West Dunbartonshire Council · Youth Employment Scotland aims to increase the number of employment...
35
Strategic Plan Performance 2014/15 Contents 1 Performance Summary 1 2 Our Priorities 3 3 Meeting the 18 Challenges 4 Have Your Say! 32 5 Contact Us 34 Welcome to West Dunbartonshire Council’s 2014/15 performance report on our Strategic Plan - the Council’s key plan that sets out our priorities over a five year period, from April 2012 to March 2017. This report is one of a series, each focusing on a different area of performance. All are available from our website. Together, we hope they provide you with a balanced view of our progress in 2014/15 that helps you judge the performance of your Council. Section 1 provides a summary of our Strategic Plan performance in 2014/15. Section 2 looks at our Strategic Plan priorities in more depth, highlighting our performance in a selection of indicators covering areas such as school attainment, recycling, and care at home. Section 3 looks at how we have managed our resources to meet the challenges and deliver our priorities over the period of the Plan. Section 4 invites you to ‘Have Your Say!’ by completing a very short questionnaire. Finally, if you want to know more about our Strategic Plan performance, have something to say about this report or how you would prefer to receive this kind of information in future, we would love to hear from you - our contact details are in Section 5. Focus n
Transcript of West Dunbartonshire Council · Youth Employment Scotland aims to increase the number of employment...

Strategic Plan Performance
2014/15
Contents
1 Performance Summary 1 2 Our Priorities 3 3 Meeting the 18 Challenges
4 Have Your Say! 32 5 Contact Us 34
Welcome to West Dunbartonshire Council’s
2014/15 performance report on our Strategic
Plan - the Council’s key plan that sets out our
priorities over a five year period, from April
2012 to March 2017.
This report is one of a series, each focusing on a
different area of performance. All are available from
our website. Together, we hope they provide you
with a balanced view of our progress in 2014/15 that
helps you judge the performance of your Council.
Section 1 provides a summary of our Strategic Plan
performance in 2014/15.
Section 2 looks at our Strategic Plan priorities in
more depth, highlighting our performance in a
selection of indicators covering areas such as school
attainment, recycling, and care at home.
Section 3 looks at how we have managed our
resources to meet the challenges and deliver our
priorities over the period of the Plan.
Section 4 invites you to ‘Have Your Say!’ by
completing a very short questionnaire.
Finally, if you want to know more about our
Strategic Plan performance, have something to say
about this report or how you would prefer to receive
this kind of information in future, we would love to
hear from you - our contact details are in Section 5.
Focus n

1
Our 2012/17 Strategic Plan sets out a clear vision for West Dunbartonshire: ‘A prosperous West Dunbartonshire recognised as a dynamic area within a successful Scotland.’ Throughout 2014/15, we worked hard implementing the actions we think will best deliver the priorities that flow from this vision:
improve economic growth and employability
improve life chances for children and young people
improve care for and promote independence of older people
improve local housing and environmentally sustainable infrastructure
improve the well-being of communities and protect the welfare of vulnerable people Our success in meeting these challenges will be assured through:
strong financial governance and sustainable budget management
fit-for-purpose estate and facilities
innovative use of information technology
committed and dynamic workforce
constructive partnership working and joined-up service delivery
positive dialogue with local citizens and communities Progress towards our priorities is measured by a range of performance indicators (PIs). Based on a selection of these indicators, this report provides a snapshot of our performance in 2014/15, highlighting our achievements as well as areas for improvement. For each PI, we begin by providing an overview of our performance, highlighting current performance against target, previous performance, and the target set for 2015/16. We have used a green, amber and red ‘traffic lights’ graphic as a quick, visual aid to help you assess our progress:
target met/exceeded
target narrowly missed
target significantly missed
1 1 Performance Summary

2
The trend graphics show whether performance is improving, declining or staying the same. The short trend compares current performance against the previous year and the long trend compares current performance against the average of the two previous years.
improving performance
declining performance
no change in performance
N/A has been inserted in the tables where data is not available or is not applicable.
Some PIs are Local Government Benchmarking Framework (LGBF) PIs that are collected by all Scottish councils. This allows us to compare our performance so that we can identify best practice, learn from each other and improve what we do. LGBF PIs have the LGBF reference after their name. We have included the most recent comparative data in the performance commentary for these PIs. This data relates to 2013/14; comparative data for 2014/15 will be available by the end of March 2016. You can find out more about the LGBF and our comparative performance from our website.
Here is a summary of our Strategic Plan performance in 2014/15:
60% of the 35 Strategic Plan PIs measured in 2014/15 met or exceeded their targets. A further 26% just missed their targets and 14% significantly missed their targets. Further details are available from the full Strategic Plan performance report for 2014/15 available from the full report on our website.
Other Performance Information
This report is one of a series, each focusing on a specific area of performance, namely:
Strategic Plan performance
Key performance indicators covering corporate management and service performance (2014/15 performance information will be available on our website from November 2015)
Local Government Benchmarking Framework PIs that are collected by all Scottish councils (2014/15 performance information will be available from our website from April 2016)
All support the Council’s 2014/15 Annual Report, providing more detailed performance information in the areas covered.

3
Our five Strategic Plan priorities are:
1. Improve economic growth and employability 2. Improve life chances for children and young people 3. Improve care for and promote independence of older people 4. Improve local housing and environmentally sustainable infrastructure 5. Improve the well-being of communities and protect the welfare of vulnerable people
Priority 1 Improve economic growth and employability Performance Overview:
2011/12 2012/13 2013/14 2014/15 2015/16
Value Value Value Value Target Status Short
Trend
Long
Trend Target
249 196 220 216 250
200
Background:
The Business Gateway, managed by the Council, aims to encourage businesses to start-up and grow in West Dunbartonshire. It provides advice and support to businesses at all stages of their development. The local Business Gateway team works closely with the Council’s business support team to provide a fully integrated package of support, providing direct links to complementary local support programmes and discretionary grants and funding opportunities. Performance:
In 2014/15, 216 new start-up businesses received advice and assistance through the Business Gateway, slightly down from 220 the previous year. While this figure was below the target of 250 set for the year, it compares favourably to other councils commonly benchmarked against West Dunbartonshire on this indicator – Inverclyde and East Dunbartonshire.
2 2 Our Priorities
Number of businesses given advice and assistance to start up through the Business Gateway

4
Looking Ahead:
During 2014/15, we carried out a review of our business support service. The outcome of this review proposed a new service delivery model which included bringing the delivery of the Business Gateway service in-house from October 2015. This new service delivery model was approved by the Infrastructure, Regeneration and Economic Development Committee in March 2015 and will provide savings, income generation opportunities, and strengthen the Council’s overall focus on growing the local economy through its businesses and people. We will continue to promote the Business Gateway service and stimulate interest through improvements to the Business Gateway website, case studies in the local press, local events, and awareness raising through social media channels. Working4Business is an exciting new joined up approach which has been developed by Community Planning West Dunbartonshire to provide a single brochure and web portal to make it easier for employers to understand and engage in the range of business support services offered locally by public sector partner organisations. These services include business start-up and development, help with recruitment, help with growing businesses and improving the skills of employees, and how to access investment. Find out more about it from our website: www.working4business.com
Performance Overview:
2011/12 2012/13 2013/14 2014/15 2015/16
Value Value Value Value Target Status Short
Trend
Long
Trend Target
67.2% 66.8% 64.7% 66%
68%
69%
Background:
The number of people in employment in the UK is measured by the Labour Force Survey (LFS) and consists of people aged 16 and over who worked for pay or profit, those on government-supported training and employment programmes, and those doing unpaid family work. Performance:
In 2014/15, 66% of working age people in West Dunbartonshire were in employment, falling slightly short of the target set for the year but up from 64.7% the previous year. Despite this slight improvement, the employment rate remains stubbornly low compared to the Scottish rate of 72.9% and the UK rate of 72.7%.
Percentage of all people aged 16-64 years in employment

5
There are other indicators that measure performance in this area. One is the number of people claiming Jobseekers Allowance (JSA), the main unemployment benefit. JSA is payable to people under pensionable age who are available for and actively seeking work. In West Dunbartonshire, the monthly JSA claimant number has fallen significantly from 2,530 in June 2014 to 2,015 in June 2015, a reduction of just over 20%.
Looking Ahead:
To help improve employment opportunities and create sustainable jobs, the Council is involved in a number of initiatives: Another 1,000 Jobs in 1,000 Days
In 2012, the Council created a Jobs Growth and Investment Framework with the aim of creating 1,000 jobs, apprenticeships and training places in 1,000 days. This was achieved by 11 February 2014, after just 650 days. On 12 February 2014, a second target of 1,000 jobs was set. There was significant progress towards this target during 2014/15, with a further 886 jobs created by 24 March 2015, after just 406 days. Working 4U
Working 4U is an integrated service provided by the Council that offers a range of employability and other support to individuals of all ages, at all stages of their journey. Partly funded by European funding, the service runs several projects that provide tailored support to unemployed residents within West Dunbartonshire to assist them to move closer to or into the labour market. This support includes one to one mentoring; digital access for benefit claims and job searching; accredited IT courses, confidence building and personal development; pre-employment training and employability qualifications; sector specific qualifications; and an employability workshop on CV writing, interview skills, job search and application forms, and IT. West Employability Hub
The West Employability Hub is the first of its kind in Scotland. It brings together the Council’s Working 4 U service, the Department of Work and Pensions, and West College Scotland in one central location in Dumbarton High Street. Young people aged 16 to 24 from Alexandria and Dumbarton receive a broad package of support, with staff from all the partners working together to develop person-centred solutions. Young people can access training, benefit advice, budgeting support and meet potential employers. Youth Employment Scotland
Youth Employment Scotland aims to increase the number of employment opportunities for young people aged 16 to 29 and help them find and sustain employment. It meets 50% of the cost of paying a young person the National Minimum Wage for a maximum of 40 hours per week for up to 26 weeks. This project is part funded by the Scottish Government and the European Social Fund. Between 1 April 2014 and 31 March 2015, 176 young people have been supported through this initiative.

6
Employment Grant 30 Plus
In addition, between April 2014 and March 2015, 60 local people were supported into employment through the 30 Plus Employment Grant. This provides a financial incentive to businesses, providing up to 50% of wage costs for people over the age of 30 for a maximum of 26 weeks. Further funding has been secured to continue this grant in 2015/16.
Priority 2 Improve life chances for children and young people
Performance Overview:
2011/12 2012/13 2013/14 2014/15 2015/16
Value Value Value Value Target Status Short
Trend
Long
Trend Target
88.3% 87% 89.0% 89.8% 89%
89%
Background:
As well as providing education services to all children, councils have a duty to provide care, protection and supervision to children who need it. A formal arrangement may be put in place by a Children’s Hearing or court due to family breakdown, the child’s behaviour or particular identified needs of the child. Performance:
In line with our continuing commitment to enable children and young people to live in the community with their family or carers, or in appropriate accommodation that meets their needs, 89.8% of all Looked After Children were supported within the local community in 2014/15. This exceeded the target of 89% set for the year and an improvement on last year’s figure of 89.0%. The most recent comparative data with other local authorities relates to 2013/14, when West Dunbartonshire ranked 18th of all 32 Scottish councils, with a figure of 89.0% compared to a Scottish average of 91%. Looking Ahead:
Over the coming months, we will be comparing our performance in this area to other councils in order to identify best practice, learn from each other and improve our performance. Building on good practice, the Youth Mentoring Scheme continues to expand, reflecting the impact it has had on the lives of many young people across West Dunbartonshire. The service won the Preventing and Reducing Re-Offending category at the 2014 Care Accolades Awards and the Best New Youth Justice Project category at the 2014 National Youth Mentoring Awards.
Percentage of all Looked After Children supported within the local community (LGBF PI)

7
Preparations are well underway to ensure the smooth introduction of the requirements of the Children & Young People (Scotland) Act 2014, including meeting the milestones required by the Scottish Government. Performance Overview:
2011/12 2012/13 2013/14 2014/15
Value Value Value Target Status Short
Trend
Long
Trend Target
92.6% 90.9% 90.1% 92.7% 92.8%
Background:
This is a valuable indicator for schools in their role of preparing young people for life beyond school. It measures the percentage of pupils leaving school and entering education, employment, training or voluntary work. Performance:
The percentage of school leavers entering positive destinations was 90.1% in 2013/14 (reported 2014/15), missing the target of 92.7% set for the year. This was slightly lower than the previous year’s figure of 90.9%. Performance was below the Scottish average of 92.3%, placing West Dunbartonshire 31st out of 32 Scottish local authorities. The reduction can be explained by the drop in the percentage of school leavers entering training (down 5.9 percentage points, from 9.1% in 2012/13 to 3.2% in 2013/14). However, the percentages of school leavers entering employment, higher education and further education are up. Employment in particular has seen a consistent increase over the last five years from 13.1% in 2009/10 to its current level of 20% in 2013/14. Looking Ahead:
Further analysis and reporting has been carried out in order for schools and partnerships to discuss 16+ transitions for the individual young people who entered a negative destination when leaving school after the 2013/14 session. West Dunbartonshire continues to apply an early robust identification process for young people at risk of moving into a post school negative destination. We are leading the field on sharing information with our partners to support young people as they plan to move on and enter positive destinations. Partnership working remains a priority and is an area where we could make further improvement. Further information will be sought in relation to leavers entering the voluntary sector and how we take this forward through our partnerships.
Percentage of pupils entering positive destinations (LGBF PI)

8
Performance Overview:
2011/12 2012/13 2013/14 2014/15 2015/16
Value Value Value Value Target Status Short Trend
Long Trend
Target
100% 100% 100% 100% 100%
100%
Background:
This indicator reflects HM Inspectorate of Education's evaluations of our educational establishments.
Performance:
One primary school (St Eunan's Primary School) and two early education and childcare centres (St Eunan's and Ferryfield EE&CCs) were inspected during 2014/15 and all were rated as satisfactory or better in three key areas: improvements in performance, children's experiences, and meeting learning needs. These results mean that we have maintained our 100% positive inspection rate to date. The full reports are available from Education Scotland’s website.
Looking Ahead:
We aim to improve further in 2015/16, focusing on:
the Scottish Attainment Challenge - a new, targeted initiative focused on supporting pupils in the authorities of Scotland with the highest concentrations of deprivation, targeting improvements in literacy, numeracy, and health and wellbeing;
raising attainment and improving learning through the implementation of the Curriculum for Excellence;
embedding Getting It Right For Every Child and the Early Years Framework, national policies to ensure the support of all children (for information about these policies see http://www.scotland.gov.uk/Topics/People/Young-People/gettingitright and http://www.scotland.gov.uk/Topics/People/Young-People/early-years/delivery/framework);
developing staff and leaders to ensure they have the required training and skills;
using data gathered from our improvement framework and self-evaluation processes to help us improve;
continuing to promote and celebrate libraries and culture; and
providing a contemporary environment fit for learning, through the modernisation of our schools’ estate.
Percentage of educational establishments receiving positive inspection reports
Executive Director of Educational Services, Terry Lanagan, getting involved in some active learning with a group of our pupils

9
Performance Overview:
2011/12 2012/13 2013/14 2014/15 2015/16
Value Value Value Value Target Status Short
Trend
Long
Trend Target
N/A 87.4% 84.4% 87.3% 83%
84%
Background:
This indicator forms part of the Council’s Literacy Strategy which is designed to improve the literacy of all who would benefit from support. Performance:
As part of our Raising Attainment Strategy, attainment data was gathered in 2012/13 from a sample of 366 children from 10 early years’ centres. The percentage of children scoring 5 and above in book knowledge was 87.4%, exceeding the target with an average score of 6.09 out of 8. Attainment data was gathered again in 2013/14 from a different sample of 315 children from another 10 centres. The percentage scoring 5 or above was 84.4%, 3 percentage points lower than the previous year, but still above target, with an average of 6.19 out of 8. This average score is higher than the previous year despite the reduction in the percentage scoring 5 or more because fewer children had very low scores of 0, 1 or 2. In 2014/15 attainment data was gathered from all early years’ establishments, with a total of 947 children. The percentage scoring 5 or above was 87.3%, which was higher than the previous year and above the target of 83%, with an average of 6.60 out of 8. Looking Ahead:
In 2015/16, the assessment will continue in all establishments in West Dunbartonshire, making year on year comparisons more reliable.
Percentage of children tested in their pre-school year achieving 5 and above in book knowledge

10
Priority 3 Improve care for and promote independence of older people
Performance Overview:
2011/12 2012/13 2013/14 2014/15 2015/16
Value Value Value Value Target Status Short
Trend
Long
Trend Target
N/A 47% 51% 55% 55%
60%
Background:
In line with the focus on community reablement (defined as services for people with poor physical or mental health to help them accommodate their illness by learning or re‐learning the skills necessary for daily living), services are being targeted towards those with high level needs in order to maximise any potential for improvement in levels of independence. Performance:
In 2014/15, 55% of people who received a reablement package reached their agreed personal outcomes, re-learning the skills necessary for daily living and improving their levels of independence. This achieved the target of 55% set for the year. Looking Ahead:
This performance indicator was introduced in 2012/13 and we will be monitoring our progress year on year as we move towards our target of 65% set for 2016/17. Building on good practice, West Dunbartonshire Link-Up service continues to expand, reflecting the impact it has had on the lives of older people. Enabling older people to access a range of community health, social work and third sector services through a single point of access, it has been well recognised nationally. It has won several awards including Working with Local Communities category of the 2014 Care Accolades Awards; Self-Management Project of the Year of the Health and Care Alliance Scotland Awards 2014; and the Gold Award for the Local Matters category of the CoSLA Excellence Awards 2015. Within West Dunbartonshire, the Council and NHS Greater Glasgow & Clyde Board have had an integrated Health and Social Care Partnership in place since October 2010. Improving care for and with older people will continue to be a key priority as those arrangements are refreshed to formally create the new West Dunbartonshire Health & Social Care Partnership in 2015/16 as required by the Public Bodies (Joint Working) Act.
Percentage of adults with assessed Care at Home needs and a reablement package who have reached their agreed personal outcomes
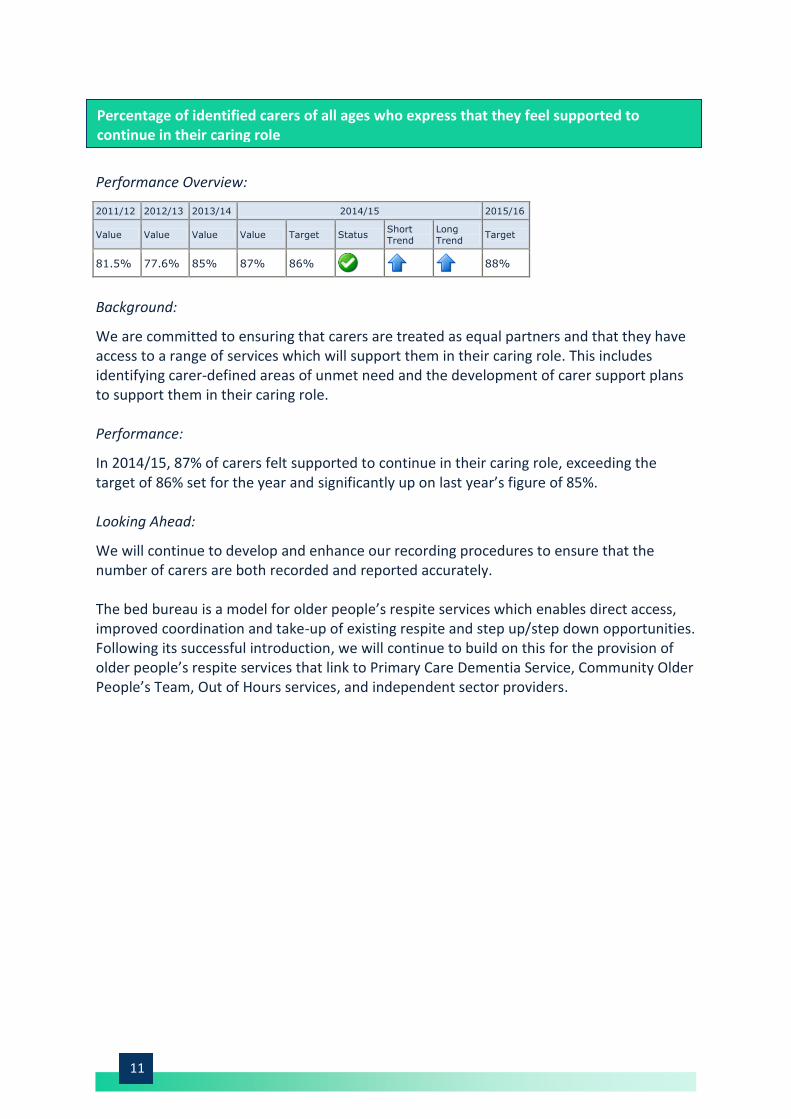
11
Performance Overview:
2011/12 2012/13 2013/14 2014/15 2015/16
Value Value Value Value Target Status Short
Trend
Long
Trend Target
81.5% 77.6% 85% 87% 86%
88%
Background:
We are committed to ensuring that carers are treated as equal partners and that they have access to a range of services which will support them in their caring role. This includes identifying carer-defined areas of unmet need and the development of carer support plans to support them in their caring role. Performance:
In 2014/15, 87% of carers felt supported to continue in their caring role, exceeding the target of 86% set for the year and significantly up on last year’s figure of 85%. Looking Ahead:
We will continue to develop and enhance our recording procedures to ensure that the number of carers are both recorded and reported accurately. The bed bureau is a model for older people’s respite services which enables direct access, improved coordination and take-up of existing respite and step up/step down opportunities. Following its successful introduction, we will continue to build on this for the provision of older people’s respite services that link to Primary Care Dementia Service, Community Older People’s Team, Out of Hours services, and independent sector providers.
Percentage of identified carers of all ages who express that they feel supported to continue in their caring role

12
Priority 4 Improve local housing and environmentally sustainable infrastructure
Performance Overview:
2011/12 2012/13 2013/14 2014/15 2015/16
Value Value Value Value Target Status Short
Trend
Long
Trend Target
158 51 48 102 70
70
Background:
As part of the Council’s role as Strategic Housing Authority for the area, we enable and deliver local housing priorities set out in the Local Housing Strategy. One of our priorities is to deliver new build social housing for rent which will meet identified housing need, improve housing conditions and provide a positive stimulus to the local economy. Performance:
The target is to deliver 350 new social houses for rent by 2017, 70 each year from 2012/13 to 2016/17. The target will be achieved through the Council’s strategic housing partnerships with the Scottish Government and a number of housing associations, and through the Council’s own ambitious new build programme which has already delivered 121 new build homes for social rent (as at Summer 2015). In relation to 2014/15, we comfortably met the target set for the year with the delivery of 102 new homes for rent. This more than addressed the shortfall in development the previous year. This figure included a £3.96 million development at Bellsmyre, Dumbarton which provided 36 new homes for rent as part of the Council’s new build programme. Looking Ahead:
Looking ahead, we have ambitious plans and targets to ensure the continued development of new affordable housing with our Strategic Housing Partner, the Wheatley Group, and our housing association partners. During the summer, 91 new social homes for rent were completed, 37 at Hillstreet Square in Brucehill, Dumbarton, delivered by the Council, and 54 at Beardmore Place, Dalmuir, provided by our Strategic Housing Partner, Cube Housing Association.
Number of new build social housing for rent
The Council’s latest new build development at Hillstreet Square

13
For more information, have a look at our Local Housing Strategy and Strategic Housing Investment Plan (SHIP) or contact the Housing Strategy and Development team who perform the Strategic Housing Authority role on 01389 737625.
Performance Overview:
2011/12 2012/13 2013/14 2014/15 2015/16
Value Value Value Value Target Status Short
Trend
Long
Trend Target
1,551 1,369 1,370 1,250 1,282
1,218
Background:
The most acute form of housing need is homelessness. It impacts significantly on people’s lives. People who have been homeless are more likely to experience mental illness, addiction issues, legal and debt problems, and limited training and employment opportunities. They are also more likely to become homeless again. Performance:
In West Dunbartonshire, there were 1,250 incidences of homelessness in 2014/15, meeting the target set for the year and down by 120 from the previous year. Together with a drop in youth homelessness for the third consecutive year, this represents a positive trend which we aim to sustain. The introduction of the Council’s supported accommodation project at Ashton View, Dumbarton, has also led to an increase in successful outcomes for single homeless households in West Dunbartonshire. Looking Ahead:
Our strategic and operational approach to tackling homelessness will continue to focus on prevention. This is the main focus of our revised homelessness strategy, together with providing housing support, helping people to sustain their tenancies and developing appropriate housing options. To help deliver this, we have carried out a structured review of our homeless service which will be embedded during 2015/16. We have also strengthened our partnerships with our advice and accommodation providers to ensure that we are properly equipped to continue to reduce homelessness across West Dunbartonshire. Following the successful outcomes of our Ashton View project, we will also be looking to increase supported accommodation provision within West Dunbartonshire to meet need. Have a look at our Homelessness Strategy to find out more about homelessness and our service in West Dunbartonshire. Or for more information, contact the Housing Strategy and Development team on 01389 737625.
Number of homelessness incidents

14
Performance Overview:
2011/12 2012/13 2013/14 2014/15 2015/16
Value Value Value Value Target Status Short
Trend
Long
Trend Target
46.1% 43.18% 44.01% 46.23% 52%
53%
Background:
The Scottish Government’s ‘Zero Waste’ Plan sets out recycling and composting targets for local authorities: 60% by 2020, and 70% by 2025. Performance:
Our recycling performance in 2014/15 was 46.23% (subject to verification by SEPA), up from 44.01% in 2013/14. Our most recent comparative performance with other Scottish councils relates to 2013/14 when we ranked 16th of all 32 councils, with a Scottish average recycling rate of 42%.
Looking Ahead:
A number of actions are being taken to further improve recycling performance including: treating residual waste prior to landfill disposal to extract recyclable material that has not be segregated for recycling by residents; implementing an alternate weekly collection system and weekly food waste collection service for 1,700 households in the New Bonhill area; introducing a weekly food waste collection service at all high rise housing; and improving the recycling infrastructure at the Dalmoak and Erskine Ferry Road household waste recycling centres to capture additional quantities of waste for recycling and re-use.
Percentage of municipal waste collected that was recycled (and composted) (LGBF PI)

15
Performance Overview:
2011/12 2012/13 2013/14 2014/15 2015/16
Value Value Value Value Target Status Short
Trend
Long
Trend Target
34.7% 34.0% 34.6% 34.6% 33%
35%
Background:
As a result of a historic reduction in funding for the maintenance of the road infrastructure nationally, our road network is similar to most other local authorities, with a significant backlog of repairs outstanding. Performance:
Nationally, the average percentage of road network that should be considered for maintenance treatment is 37.02%. West Dunbartonshire Council is in a slightly better position with a figure of 34.6%, just off the target of 33% set for 2014/15. Looking Ahead:
In recent years, an additional £1 million has been provided through capital funding to stabilise the deterioration of the road network. Asset management planning is being developed to ensure that we use a risk based approach to road maintenance and we are using new technologies and materials to ensure the most efficient approach to maintaining our road network.
Overall percentage of the road network that should be considered for maintenance treatment

16
Priority 5 Improve the well-being of communities and protect the welfare of vulnerable people
Performance Overview:
2011/12 2012/13 2013/14 2014/15 2015/16
Value Value Value Value Target Status Short
Trend
Long
Trend Target
4,020 4,172 4,788 4,966 4,980
5,179
Background:
West Dunbartonshire Leisure Trust manages the area’s 3 leisure centres, 13 community centres and the ‘Active Schools’ and sports development programmes. By enhancing recreational diversity, the Trust helps to deliver the social and economic agenda for West Dunbartonshire including improving the health of the community, providing learning opportunities and helping to make West Dunbartonshire a better place to live. Performance:
There were 4,966 attendances per 1,000 population in 2014/15, just below the target of 4,980 set for the year but higher than the previous year. Attendances at the newly refurbished gyms have increased at the Meadow Centre and Vale of Leven Swimming Pool. However, increased competition in the Clydebank area has had an adverse effect at the Play Drome. General swimming attendances, including the ‘Learn to Swim’ programme, declined marginally from the previous year. Group fitness class attendances continue to increase year on year, especially at the Vale pool following the recent extension of the studio (Figure 1). Figure 1: Total attendances at group fitness classes
Number of attendances per 1,000 population for indoor sports and leisure facilities

17
Looking Ahead:
The Council has been working closely with the Trust to develop a new £22 million leisure centre in Clydebank to replace the current Play Drome facility. The Leisure Trust will manage the facility on behalf of the Council. Work on site has now started and is scheduled to be completed and opened to the public before the end of the 2016/17 financial year.
A new membership, aimed at the over 60’s, was launched on 1 April 2015 and has proved popular. Young people aged between 16 and 19 years have had group fitness classes added to their membership and those aged 14 and 15 years can now access a selection of group fitness classes. A number of new pre 5 activity classes have also been created.
Performance Overview:
2011/12 2012/13 2013/14 2014/15 2015/16
Value Value Value Value Target Status Short
Trend
Long
Trend Target
95.5% 95.1% 80.2% 94.5% 95%
95%
Background:
The purpose of a Child Protection Case Conference is to consider whether a child, including an unborn child, is at risk of significant harm and if so, to consider a multi-agency action plan to reduce that risk. There are formal multi-agency meetings which enable agencies to share information and assessments and plan appropriately. Performance:
In 2014/15, 94.5% of all child protection case conferences were carried out within 21 days, marginally below the target of 95% set for the year and significantly up on last year’s figure of 80.2%. Those which were carried out beyond the target timescale were due to unavoidable delays such as an essential participant being unable to attend. Looking Ahead:
Throughout the year, positive improvements have been made to our recording systems and processes and this work continues to ensure that the 21 day target is achieved. This has been done through on-going staff awareness, development training, and robust scrutiny of all records to facilitate continuous improvement.
Percentage of child protection referrals to case conference within 21 days

18
Delivering our priorities can only be achieved through the efficient and effective use of our resources, working constructively with our partners, and engaging effectively with service users, local citizens and communities. Our priorities are:
1. Strong financial governance and sustainable budget management 2. Fit-for-purpose estate and facilities 3. Innovative use of information technology 4. Committed and dynamic workforce 5. Constructive partnership working and joined-up service delivery 6. Positive dialogue with local citizens and communities
Priority 1 Strong financial governance and sustainable budget management
Performance Overview:
2011/12 2012/13 2013/14 2014/15 2015/16
Value Value Value Value Target Status Short
Trend
Long
Trend Target
9.8% 9.16% 8.9% 10.13% 9%
8.9%
Background:
Rental income funds the services provided to Council tenants, so it is essential that we collect as much of the rent due as possible.
Performance:
Current tenant arrears increased by just over 1 percentage point to 10.13% in 2014/15, missing the target set for the year. This follows a period of falling rent arrears year on year (with the exception of 2011/12), from a high of 19.2% in 2001/2 when this PI was first measured, to an all-time low of 8.9% last year (Figure 2).
3 Meeting the Challenges
Current tenants' arrears as a percentage of total rent due

19
Figure 2: Current tenant arrears
Comparing our Performance with Others:
Another measure of rent arrears was included in the Local Government Benchmarking Framework (LGBF) for the first time in 2013/14 (see page 2 for more about the LGBF). It measures gross rent arrears (all tenants) as at 31 March each year as a percentage of rent due for the reporting year. This differs from the previous indicator in that it includes both current and former tenant arrears. Using this measure, our performance declined from 8.6% in 2013/14 to 9.55% in 2014/15. However, although the percentage of rent arrears increased, we collected £700,000 more rental income in 2014/15 than in 2013/14. Our most recent comparative performance with other Scottish councils relates to 2013/14, when West Dunbartonshire ranked 24th of all 32 councils, with a figure of 8.6% compared to a Scottish average of 5.5%. Looking Ahead:
We have reviewed our rent collection strategy and have changed our processes to streamline and improve how we work and deliver services to improve our performance in 2015/16.

20
Performance Overview:
2011/12 2012/13 2013/14 2014/15 2015/16
Value Value Value Value Target Status Short
Trend
Long
Trend Target
94.2% 94.4% 94.5% 95% 94.75%
95%
Background:
Council tax provides a core element of the money used to deliver services so it is essential that we collect as much of the money owed in Council Tax as possible. Performance:
The Council Tax collection rate was 95% in 2014/15, meeting the target of 94.75% set for the year. This is our best performance to date. Our collection rate has improved year on year (with the exception of 2000/1), up from 80.4% in 1999/2000 when this PI was first measured (Figure 3). Despite our improving performance year on year, we remain just below the Scottish average (Figure 3). Our most recent comparative performance with other Scottish councils relates to 2013/14, when West Dunbartonshire ranked 24th of all 32 councils, with a figure of 94.52% compared to a Scottish average of 95.16%.
Figure 3: Percentage of income due from Council Tax received by year end
Percentage of income due from Council Tax for the year, net of reliefs and rebates, that was received during the year (LGBF PI)

21
Looking Ahead:
To improve our performance in 2015/16, we have reviewed our Corporate Debt Policy and are reviewing our processes to streamline and improve how we work and deliver our services.
Priority 2 Fit-for-purpose estate and facilities Performance Overview: 2011/12 2012/13 2013/14 2014/15 2015/16
Value Value Value Value Target Status Short
Trend
Long
Trend Target
39.3% 50.5% 55.24% 61.7% 56%
61%
Background:
We recognise that our property needs to be managed effectively and efficiently. To support this, we have been reviewing all operational accommodation to identify problems at an early stage and prioritise repairs and other works. Performance:
The final phase of this review was completed during the year along with a targeted programme of capital expenditure on building upgrades and improvements. As a result, 61.7% of operational accommodation is in a satisfactory condition, exceeding the target of 56% set for the year and a significant improvement on last year’s figure.
The Council’s Asset Management Team maintains and manages the Council’s operational estate and facilities, including upgrade work. In 2014/15, £4.2 million was invested in building upgrades in the following main areas:
internal and external upgrades;
fire risks and health and safety works on all properties;
adaptations related to accessibility for schools; and
upgraded security.
In addition, the move to a modern building at Aurora House in Clydebank and the resultant closure of the ageing Rosebery House will continue to improve performance.
Proportion of operational accommodation that is in a satisfactory condition (LGBF PI)

22
Looking Ahead:
A new scoring matrix for capital expenditure on upgrading buildings has been developed. This ensures that future programmes take account of and prioritise: condition, sustainability, health and safety requirements, and access regulations. In addition, the Council are working towards a re-provision of offices behind the Grade A Listed façade of the Old Academy Building and Burgh Hall site. This will result in the eventual closure of the Garshake building and others which will further enhance our overall performance in this indicator and other related PIs. Performance Overview:
2011/12 2012/13 2013/14 2014/15 2015/16
Value Value Value Value Target Status Short
Trend
Long
Trend Target
36.5% 62% 83.49% 100% 100%
100%
Background:
The Scottish Housing Quality Standard (SHQS) is the Scottish Government’s principal measure of quality in social housing in Scotland. All our housing must meet this Standard from 31 March 2015. This means it must be:
compliant with the tolerable standard;
free from serious disrepair;
energy efficient;
equipped with modern services and facilities; and
healthy, safe and secure.
There are 55 elements across these five areas and all must be met in order to comply with the Standard.
Percentage of the Council’s housing stock meeting the Scottish Housing Quality Standard (LGBF PI)

23
Performance:
An increased focus on managing our housing stock through the development of our Housing Asset Management Strategy has led to 100% of our eligible stock successfully meeting the Standard by the target date set by the Scottish Government. This was a considerable achievement with progress in recent years outlined in Figure 4 below.
Figure 4: Percentage of Council stock meeting SHQS
Looking Ahead:
The approval of our new Housing Capital Investment Plan 2015/20 will deliver a substantial investment of £127 million in tenants' homes over the next 5 year This will ensure that our housing stock continues to improve, meets the SHQS, as well the new Energy Efficiency Standard for Social Housing (EESSH) by 2020. For more information, contact the Housing Strategy and Development team on 01389 737625.
Refurbished flats at Littleholm, Clydebank

24
Performance Overview:
2011/12 2012/13 2013/14 2014/15 2015/16
Value Value Value Value Target Status Short
Trend
Long
Trend Target
N/A 32,961 31,931 31,436 32,096
31,476
Background:
Carbon emissions result from the Council’s use of electricity, gas, oil, kerosene, water use and disposal, petrol and diesel for our fleet of vehicles, employees commuting to and from work, business travel while at work, and waste collected and managed by the Council. We measure carbon emissions from more areas now than in previous years. Performance:
Based on 32,961 tonnes recorded in 2012/13, we aim to reduce our carbon emissions by just over 15% to 27,900 tonnes by 2019/20. In 2014/15, there were 31,436 tonnes of carbon
emissions, better than the target of 32,096 tonnes set for the year and a reduction of 1,525 tonnes or 4.6% on the 2012/13 figure. The reduction in 2014/15 was due to a number of factors including:
a reduction in the Council’s building stock;
energy efficiency improvements to buildings and changes to fuel used to heat buildings;
lower amounts of waste sent to landfill and increased reuse, recycling or composting; and
our pool cars and cycling scheme.
Looking Ahead:
Looking ahead, a range of projects are planned to cut emissions further including: building efficiency - oil to gas fuel conversion, draught proofing, lighting upgrades, and replacing boilers; promoting reuse, recycling and composting; sustainable travel campaigns; and more energy efficient street lighting. Find out more about carbon management within the Council by emailing us at [email protected] or calling us on 01389 737344.
Tonnage of carbon dioxide emissions from Council operations and assets

25
Priority 3 Innovative use of information technology Performance Overview:
2011/12 2012/13 2013/14 2014/15 2015/16
Value Value Value Value Target Status Short
Trend
Long
Trend Target
N/A N/A N/A 80% 100%
N/A N/A 100%
Background:
The extensive use of and reliance on technology by our citizens, staff and school pupils requires fit for purpose systems and applications that run smoothly and efficiently. Our desktop systems are essential to many of the services we provide across the Council and so must meet a required specification for us to meet our service users’ expectations. Performance:
Over 95% of all PCs and laptops have been upgraded to Windows 7 or above, up from 80% at the end of March 2015. Some applications required additional investigation before the upgrade could be carried out hence the target was missed. However, all PCs and laptops will meet the specification by the end of October 2015. Looking Ahead:
The current ICT Modernisation project is improving the overall network infrastructure, increasing network capacity and bandwidth and introducing new and more flexible ways of using technology. The introduction of wireless across many Council locations, the roll out of thin client (lower
cost, centrally managed computers, that use bigger, shared, central computers to do all the work), and the use of mobile devices such as tablets and Chromebooks, allows departments to tap into new and more flexible ways of working. It improves staff mobility which in turn improves the services we provide to our citizens and internal customers alike. More employees working in the community now use mobile devices and the plan is for this to be further extended to other Council services and locations, enabling staff to be more mobile and improve efficiency. We are working on projects to use technology to provide access to information systems while mobile, allowing staff to complete assessments electronically in service users’ homes, saving time retyping when they return to the office, speeding up the process, and allowing more assessments to be completed in the same time frame.
Percentage of Council information technology desktop hardware that meets ICT’s agreed minimum software specification

26
Performance Overview:
2011/12 2012/13 2013/14 2014/15 2015/16
Value Value Value Value Target Status Short
Trend
Long
Trend Target
N/A N/A N/A 83% 100%
N/A N/A 100%
Background:
We have invested £4 million to improve technology for staff, pupils and residents of West Dunbartonshire. Performance:
All schools and nurseries have received a modernised Local Area Network, 100% of schools and nurseries have Wi-Fi, and 53% of schools and nurseries now have access to a new improved Wide Area Network (WAN) resulting in improved internet connection speeds and reliability. Work is underway at our remaining sites to complete this task. In the schools that have been upgraded, it has already increased our capacity to use online resources and maximise the use of new technologies such as Chromebooks. Looking Ahead:
We are working with suppliers to upgrade WAN at our remaining sites as quickly as possible.
Percentage of schools with optimal data communication network bandwidth in operation

27
Priority 4 Committed and dynamic workforce Performance Overview:
Teachers 2011/12 2012/13 2013/14 2014/15 2015/16
Value Value Value Value Target Status Short
Trend
Long
Trend Target
6.1 6.88 5.28 6.11 5
5.6
All other local government employees 2011/12 2012/13 2013/14 2014/15 2015/16
Value Value Value Value Target Status Short
Trend
Long
Trend Target
12.2 13.45 12.9 14.46 9
8
All employees (LGBF PI) 2011/12 2012/13 2013/14 2014/15 2015/16
Value Value Value Value Target Status Short Trend
Long Trend
Target
11.1 12.13 11.38 12.81 * N/A N/A N/A *
* Targets are set for ‘teachers’ and ‘all other local government employees’ separately and are shown in the
relevant tables above.
Background:
Maintaining a committed and dynamic workforce is central to the provision of cost effective services to customers. The Council is committed to supporting employees while at work and improving attendance levels across all services. Performance:
Teachers’ absence was 6.11 days in 2014/15, missing the target set for the year and up from 5.28 days last year. Similarly, absence for all other local government employees was also up, with 14.46 days recorded in 2014/15 compared to 12.9 last year. The absence figure for all employees combined was 12.81 days in 2014/15, up from 11.38 days in 2013/14. Our most recent comparative performance with other Scottish councils for all employees relates to 2013/14, when West Dunbartonshire ranked 32nd of all councils, with a figure of 11.38 days compared to a Scottish average of 9.24 days. Based on reported absence levels for the first quarter of 2015/16, predicted year end figures for 2015/16 are expected to show a year on year decrease in absence levels in comparison with 2014/15.
Average number of working days lost per employee

28
Looking Ahead:
A full review of the Attendance Management Policy has been carried out, looking at its use, application, and effectiveness in managing attendance. It has been informed by discussions and strategies that focus on changing attitudes and behaviours towards attendance among employees and managers. The revised Policy will be implemented on 1st October 2015 supported by the introduction of an Employee Well Being Charter and a dedicated programme of training and additional support primarily aimed at managers/supervisors with a direct responsibility for employees.
Priority 5 Constructive partnership working and joined-up service delivery Care Inspectorate Grading of Council Services The following 3 measures relate to grades awarded by the Care Inspectorate. The Care Inspectorate inspects and grades services on a number of quality themes: quality of care and support, quality of the environment, quality of staffing, and the quality of management and leadership. The grades awarded range from Unsatisfactory (1), Weak (2), Adequate (3), Good (4), Very Good (5) to Excellent (6). Copies of the inspection reports can be accessed on the Care Inspectorate web-site: www.scswis.com.
Percentage of Council operated children's residential care homes which are graded 5 or above
The Strategic Plan target is for all Council operated children's residential care homes to be graded at 5 or above by 2017. During 2014/15, 2 of the 4 homes received a grade 5 (Very Good) as their lowest grading on inspection. Percentage of Council Home Care services which are graded 5 or above
The Strategic Plan target is for all Council Home Care Services (Home Care, Sheltered Housing and Community Alarm services) to be graded at 5 or above by 2017. During 2014/15, 2 of the 3 services received a grade 5 (Very Good) against each quality theme inspected, representing 67%.
Percentage of Council operated older people's residential care homes which are graded 5 or above
The Strategic Plan target is for all Council operated older people's residential care homes to be graded at 5 or above by 2017. The key contributor to the delivery of this target is the provision of 2 new older people’s residential care homes in Dumbarton and Clydebank and this will positively influence the direction of travel towards the 100% target. A programme of enabling works is now underway at the Crosslet House site, to prepare the site for the main construction works to begin in August 2015. It is anticipated that the new 84 bedroom care home and day care centre will be completed in January 2017, with

29
residents moving in very soon after. The 84 bedroom care home and day care centre for Clydebank will be sited at Queen’s Quay and will form part of the wider regeneration of that site. During 2014/15, 4 of the homes received at least one Grade 5 (Very Good) in relation to particular quality themes and there has been a steady improvement in Care Inspection grades supported by the introduction of a new quality system.
Priority 6 Positive dialogue with local citizens and communities Performance Overview: 2011/12 2012/13 2013/14 2014/15 2015/16
Value Value Value Value Target Status Short
Trend
Long
Trend Target
N/A N/A 82% 82% 82%
82%
Background:
A telephone survey is carried out every month to gather residents’ views and rate their satisfaction with the Council’s website.
Performance:
Feedback from the surveys carried out in 2014/15 remains positive, with 82% of respondents satisfied with the website. This is identical to the rate recorded the previous year. Following a relaunch of our website, it is now one of the fastest loading council websites in the UK and has regained a three star rating from the Society of Information Technology Management, the highest rating the Council has achieved. Looking Ahead:
We continually review and update content on the website. New for the start of the football season is the ability to view sports pitches inspections and cancellations to see whether our pitches are open, closed or booked.
Percentage of citizens who are satisfied with the Council’s website

30
Performance Overview: 2011/12 2012/13 2013/14 2014/15 2015/16
Value Value Value Value Target Status Short
Trend
Long
Trend Target
N/A N/A 72% 82% 60%
65%
Background:
We are committed to providing high-quality services but occasionally things go wrong and it is important that we act quickly to resolve them. Our revised complaints process, introduced in 2013, has two stages: Stage 1 allows five working days or less to resolve a complaint and Stage 2 relates to complaints not resolved at Stage 1 or complex complaints requiring detailed investigation. We expect the majority of complaints to be resolved satisfactorily at Stage 1. Performance:
In line with national best practice, our aim is to resolve as many complaints as possible at Stage 1. To facilitate this, we introduced new ways of working and this has had a positive impact on the number of complaints resolved at Stage 1, with 82% recorded in 2014/15.This is up significantly from 72% in 2013/14 and exceeds the target set for the year. Looking Ahead:
We will continue to monitor our complaints handling with the aim of providing quality and timely resolutions to our customers’ complaints. Performance Overview:
2011/12 2012/13 2013/14 2014/15 2015/16
Value Value Value Value Target Status Short
Trend
Long
Trend Target
74% 80% 79% 79% 78%
79%
Background:
With over 1,400 members aged over 18 years, the Citizens’ Panel provides a way of consulting local people on a range of topics. This indicator looks at whether Citizen Panel members think we listen and respond to what they tell us.
Percentage of Citizens’ Panel respondents who agree that the Council and its Community Planning partners listen to what they tell us in surveys on developing and changing the way we provide services
Percentage of complaints received by the Council that are resolved at Stage 1

31
Performance:
79% of respondents agree that we listen to what they tell us in surveys, meeting the target of 78% set for the year. This is identical to the rate recorded the previous year. One of the key ways we evidence this is through our annual Citizens’ Panel newsletter called Feedback. This is sent to every member of the Panel and published on our website every summer. Our summer 2015 newsletter is now available from our website. Here are some examples from the newsletter, highlighting the actions we’ve taken in response to Panel feedback:
The Youth Alliance, which includes The Pulse, Community Learning & Development, and Y Sort It, are supporting a group of peer educators – young people who can work with people their own age to share key messages about personal and community safety.
Over 600 ‘No Dog Fouling’ signs have been erected throughout West Dunbartonshire and a further 120 dual purpose bins have been installed, making 1,000 bins in total.
The public can now report road faults by Twitter and Facebook as well as by more traditional methods.
Looking Ahead:
We will continue to gather feedback from service users to help us identify areas for improvement and inform the way we develop and provide services.

32
Please take a few minutes to tell us what you think about this report by completing and
returning this short questionnaire. Alternatively, complete it online or at
https://www.surveymonkey.com/r/SP14-15
Your views matter and we will use your feedback to help us improve future performance
publications.
1 How do you rate the design and layout of this report?
Very good
Fairly good
Average
Poor
2 How easy is it to read and understand?
Very easy
Fairly easy
Not very easy
Not at all easy
3 How balanced is it in presenting a fair picture of our performance?
Very balanced
Fairly balanced
Not very balanced
Not at all balanced
4 How useful is it in helping you judge the performance of your Council?
Very useful
Fairly useful
Not very useful
Not at all useful
5 Which section/s did you find particularly useful?
5 4 Have your Say!

33
6 Which section/s were not so useful?
7 This report presents performance information in text, tables and graphs. In general,
how would you prefer performance information to be presented?
Mostly text
Mostly tables
Mostly graphs
Mixture of these
8 What other information would you like to see in a future performance report?
Please send your completed questionnaire to Corporate & Community Planning,
Corporate Services, Council Offices, Garshake Road, Dumbarton, G82 3PU. Thank you.

34
If you want to know more about our performance, have something to say about this report
or how you would prefer to receive this kind of information in future, please contact us:
Phone 01389 737231
Email [email protected]
Write Corporate & Community Planning
Corporate Services
Council Offices
Garshake Road
Dumbarton
G82 3PU
Visit www.west-dunbarton.gov.uk
Other Formats This document can be provided in large print, Braille, or on audio cassette and can be translated into different community languages. Please contact: Corporate & Community Planning Corporate Services Council Offices Garshake Road Dumbarton G82 3PU 01389 737231
6 5 Contact Us