Werner Enterprises -...
26
Werner Enterprises 34 th Annual Institutional Investors Conference March 4, 2013
Transcript of Werner Enterprises -...

Werner Enterprises
34th Annual Institutional Investors Conference
March 4, 2013

This presentation includes forward-looking statements,
within the meaning of the Private Securities Litigation
Reform Act of 1995. These statements are based on
Werner Enterprises’ current plans, and are not guarantees
of future performance. They are subject to risk and
uncertainties, that could cause actual results, and
company plans and objectives, to differ materially from
those expressed in the forward-looking statements.
Such risks and uncertainties are discussed in the
Company’s Annual Report, on Form 10-K, filed with the
SEC.
DISCLOSURE STATEMENT
1 1

H Premium Truckload Transportation and Logistics Services Provider
2012 Revenue: $2.0 Billion
2012 Net Income: $103 Million
NASDAQ: WERN
Market cap: $1.7 Billion
2012 Quest for Quality Multiple Award Winner in Truckload and 3PL Logistics
ABOUT WERNER ENTERPRISES
2 2

1980
• Deregulation
1986
• IPO
1992
• GPS on all trucks
• Dedicated, Regional
and TC fleets formed
1998
• First to install
electronic driver
logs (EOBR)
1999
• Mexico launch
• Canada designated
fleet formed
2003
• Brokerage and
Intermodal expansion
2006
• Werner Global
Logistics formed
• China launch
2007
• LH fleet reduction
2009
• Safety improvement initiative begins
• Australia launch
2008
• Balanced portfolio
initiative begins
• Fuel MPG initiative
begins
1956
• Founded by
C.L. Werner
2012
• $103M earnings
(record high to date)
THE PATH OF WERNER PROGRESS
3

49% 51% 50%
26% 24% 24%
17% 16% 14% 8% 9% 12%
0%
10%
20%
30%
40%
50%
60%
2010 2011 2012
Retail/CP
Grocery Products
Manuf./Industrial
Logistics/Other% o
f R
evenues*
* top 50 customers
% o
f R
even
ue
s
Vertical:
Customers:
REVENUE SOURCES
5
27% 26% 25%
40% 40% 40%
60% 60% 61%
74% 74% 73%
0%
20%
40%
60%
80%
100%
2010 2011 2012
Top 5
Top 10
Top 25
Top 50
4

Truckload, $280B 37%
Dedicated (Private Fleet),
$277B 37%
LTL, $47B 6%
Rail carload, $56B 8%
Rail intermodal, $15B 2%
U.S. Freight Market Revenues
in billions of $*
* Sources: ATA and Stifel Nicolaus estimates
DOMESTIC FREIGHT MARKET:
MARKET SHARE & GROWTH OPPORTUNITIES
6
$0
$50
$100
$150
$200
$250
$300
TruckloadDedicated
Intermodal
$280B $277B
$15B
Re
ve
nu
e i
n b
illi
on
s
Werner Enterprises Growth Opportunities
Werner % Share Total Freight Market
5
Other
(Pipeline, Air, Water)
$73B
10%

Asset-
Lig
ht
Asset
• Freight Management
• Brokerage
• Intermodal
• Cross Border
• Global Logistics
ONE-WAY TRUCKLOAD
Regional Fleets
Temperature
Controlled
Medium / Long Haul
Team Werner
LOGISTICS
DEDICATED
Van
Temperature
Controlled
Flatbed
Network
Optimization
* Includes Cross Border Asset-Light (MX, CAN) >10% of Revenues
Goal 4Q12
1/3 26%*
1/3 38%
1/3 36%
7
REVENUE PROFILE
6

FREIGHT MARKET UPDATE
8 7
ONE-WAY
TRUCKLOAD

COMPREHENSIVE SOLUTIONS
8
Werner provides complete 3PL supply
chain solutions across all shipping modes
and geographies, from network design
through implementation.
Freight Management
With an asset-backed network of 7,150
trucks, 9,500 alliance carriers and ocean, air
and rail companies, Werner provides
unsurpassed delivery solutions worldwide.
Freight Movement
Providing door-to-door services for
companies of all sizes and industries as they
compete in today’s global marketplace,
sets us apart from our competition.
Global Implementation
Sophisticated technology tools
provide our customers instant visibility across
their supply chain, which enables them to
better manage their business.
Technological Advantages

FUEL PRICE TRENDS
10
$1.20
$1.40
$1.60
$1.80
$2.00
$2.20
$2.40
$2.60
$2.80
$3.00
$3.20
$3.40
$3.60
$3.80
$4.00
$4.20
$4.40
$4.60
$4.80
$5.00
Pri
ce
Pe
r G
all
on
(in
$)
2009 2010 2011 2012 2013
*Dept. of Energy (DOE) fuel price survey (Nat'l avg.) of truck stops used by shippers/carriers for billing fuel surcharges.
Fuel price includes fuel taxes.
1Q 2Q 3Q 4Q
9

GREEN INITIATIVES
10
Werner Enterprises is a SmartWaySM Transport partner. SmartWay is a collaboration
between the EPA and the freight industry, to increase energy efficiency and reduce air
pollution. Werner has earned a Shipper Index Factor score (SIF) of 1.25, the highest possible
score.
Fuel Efficiency Initiatives:
Aerodynamic Trucks
Installation of fuel idling reduction equipment, including Espar heaters and APU’s
MPH optimization
Out of route mile and empty mile reduction
Trailer skirts
Tire-inflation systems
Alternate Fuel Initiatives:
Testing LNG and CNG trucks
Werner’s Impact:
5 years of MPG improvement
Continued MPG improvement opportunities
150,000 ton reduction in carbon footprint from MPG improvement, last 3 years
0%
1%
2%
3%
4%
5%
6%
7%
8%
2007 2008 2009 2010 2011 2012
Hu
nd
red
s
INS/CLAIMS % of REVENUES* ACCIDENTS PER MM
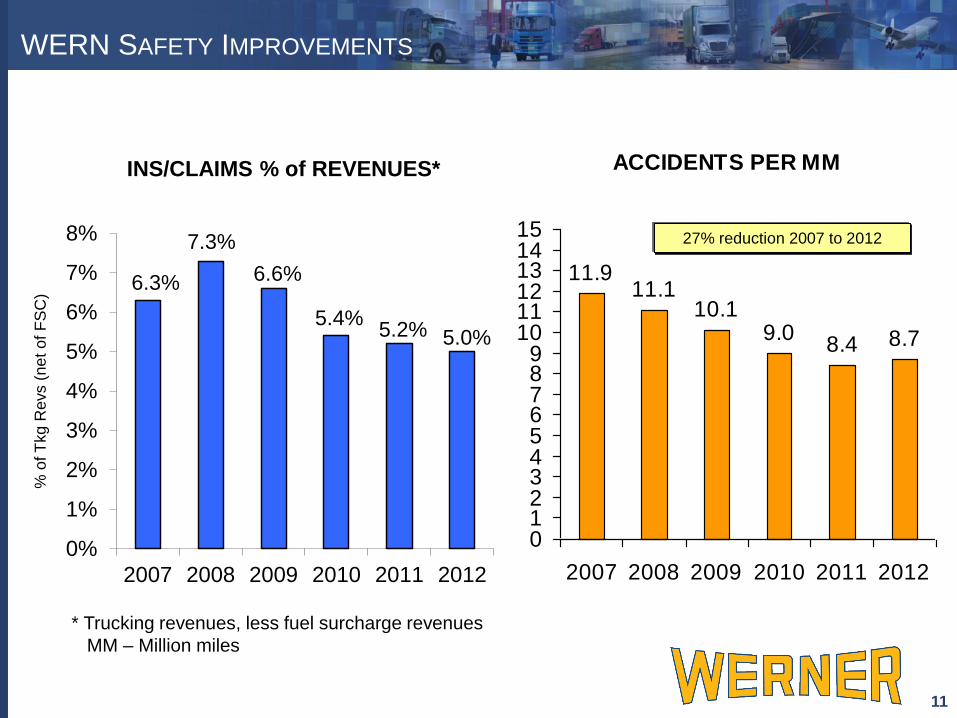
11.911.1
10.19.0
8.4 8.7
0123456789
101112131415
2007 2008 2009 2010 2011 2012
27% reduction 2007 to 2012
WERN SAFETY IMPROVEMENTS
12 11
* Trucking revenues, less fuel surcharge revenues
MM – Million miles
% o
f T
kg R
evs (
ne
t o
f F
SC
)
6.3%
7.3%
6.6%
5.4% 5.2% 5.0%

REGULATORY – HOS AND EOBR
12
HOS impact on shippers
Utilization decrease per tractor in the market
Decreased driver wage potential
Decreases capacity, increases the number of tractors needed to haul the same amount of goods
Overall impact, higher transportation costs
The FMCSA announced various changes
effective February 2012, with a compliance
date of July 2013.
Primary rule changes 34 hour restarts will
now need to include two consecutive periods
between 1 a.m. and 5 a.m. Mandatory break
period.
The latest highway reauthorization bill dubbed
Moving Ahead for Progress in the 21st Century Act
(MAP 21) was passed June 2012. EOBR mandates
in this bill states that all motor carriers that must file
a record of duty status (RODS), and will be required
to do so with an electronic logging device.

SUPPLY – CAPACITY
Source: KeyBanc
13
Including owner
operators, truckload
capacity at public
fleets is nearly 20
percent below peak
4Q06 levels
23,000
25,000
27,000
29,000
31,000
33,000
2Q
05
3Q
05
4Q
05
1Q
06
2Q
06
3Q
06
4Q
06
1Q
07
2Q
07
3Q
07
4Q
07
1Q
08
2Q
08
3Q
08
4Q
08
1Q
09
2Q
09
3Q
09
4Q
09
1Q
10
2Q
10
3Q
10
4Q
10
1Q
11
2Q
11
3Q
11
4Q
11
1Q
12
2Q
12
Total Public Truckload Fleet Capacity
3Q
12
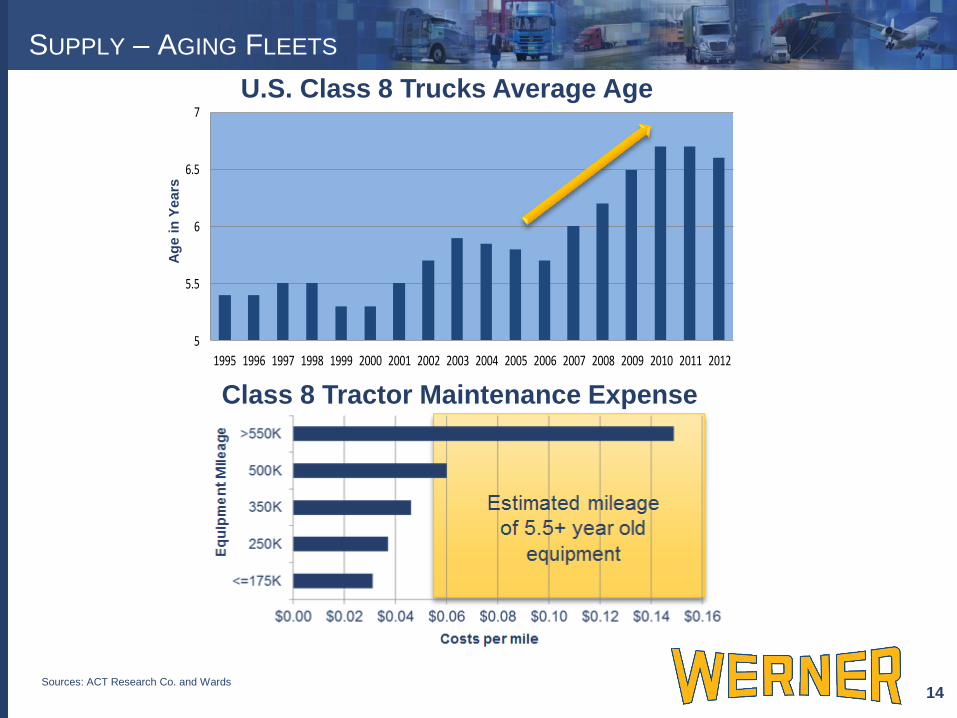
Sources: ACT Research Co. and Wards
SUPPLY – AGING FLEETS
14
U.S. Class 8 Trucks Average Age
5
5.5
6
6.5
7
1995 1996 1997 1998 1999 2000 2001 2002 2003 2004 2005 2006 2007 2008 2009 2010 2011 2012
Ag
e i
n Y
ea
rs
Class 8 Tractor Maintenance Expense

DR
IVE
R
MA
RK
ET
15 Sources: BLS OES, ACT Research Co.
2010 U.S. Census Driver Age
Profiles
“…to attract the higher share of workers needed
for the 10 year growth projection, the trucking
industry must return to the wage position that
prevailed in the 1990s.”
- ATA
“Roughly 25 percent of the driver workforce
has been eliminated from the industry during
the past 10 years as a result of demographic
and health issues... the largest group of
drivers are aged 35 to 54.”
- Logistics Management
DRIVER MARKET
Driver Wages Relative to Food Prep
Workers

$0
$50
$100
$150
$200
$250
$300
2000
2001
2002
2003
2004
2005
2006
2007
2008
2009
2010
2011
2012
2013 g
oal
Mill
ion
s o
f D
olla
rs
Cash Flow from Operations Cap Ex, Net
CASH FLOW AND CAP EX
15
* Increased cap ex in 2006 and 2007 prior to 2007 EPA engine emission change.
**Higher cap ex in 2011 and 2012 as we reduced the average age of our fleet from 2.8 years to 2.3 years.
*
16
*
$150M
$100M
**
**

ENHANCING SHAREHOLDER RETURN
16
$0
$20
$40
$60
$80
$100
$120
$140
$160
$180
$200
2006 2007 2008 2009 2010 2011 2012
Mil
lio
ns o
f $
$0.00
$0.25
$0.50
$0.75
$1.00
$1.25
$1.50
$1.75
$2.00
$2.25
$2.50
2006 2007 2008 2009 2010 2011 2012
Share repurchases
Dividends
Special dividends
$99M
$128M
$169M
$104M
$ Per Share
$1.28
$1.76
$2.36
$1.45 $130M
$1.80
Total 2006 - 2012: $ Per Share
Share repurchases $203M $2.72
Dividends $98M $1.38
Special Dividends $501M $6.95
$802M $11.05
17
$.70 $50M
$122M $1.70

-10%
-8%
-6%
-4%
-2%
0%
2%
4%
6%
8%
10%
7,000
7,200
7,400
7,600
7,800
8,000
8,200
8,400
8,600
8,800
9,000
9,200
2000 2001 2002 2003 2004 2005 2006 2007 2008 2009 2010 2011 2012
% C
ha
nge
YO
Y
Ave
rage
# o
f Tru
cks
In S
erv
ice
Average # of Trucks in Service % Change YOY
Keep fleet count flat, focused on reaching TL
OI% target of 11%
TRUCKS
17 18

1Q09 2Q09 3Q09 4Q09 1Q10 2Q10 3Q10 4Q10 1Q11 2Q11 3Q11 4Q11 1Q12 2Q12 3Q12 4Q12
Miles Per Truck YOY Miles Per Truck % Change
MILES PER TRUCK TRENDS – LAST 16 QUARTERS
19
% C
ha
ng
e Y
OY
5%
4%
2%
1%
-5%
-4%
-3%
-2%
-1%
0%
3%

OP
IN
C -
% O
F R
EV
EN
UE
S
EP
S
$.10
$.15
$.22
$.29
$.18
$.29
$.38 $.42
$.26
$.33
$.40
$.34
$.25
$.33
$.40
$.35
$0.00
$0.05
$0.10
$0.15
$0.20
$0.25
$0.30
$0.35
$0.40
$0.45
2009 2010 2011 2012
1Q 2Q 3Q 4Q 1Q 2Q 3Q 4Q 1Q 2Q 3Q 4Q 1Q 2Q 3Q 4Q
OPERATING MARGIN TRENDS*
23
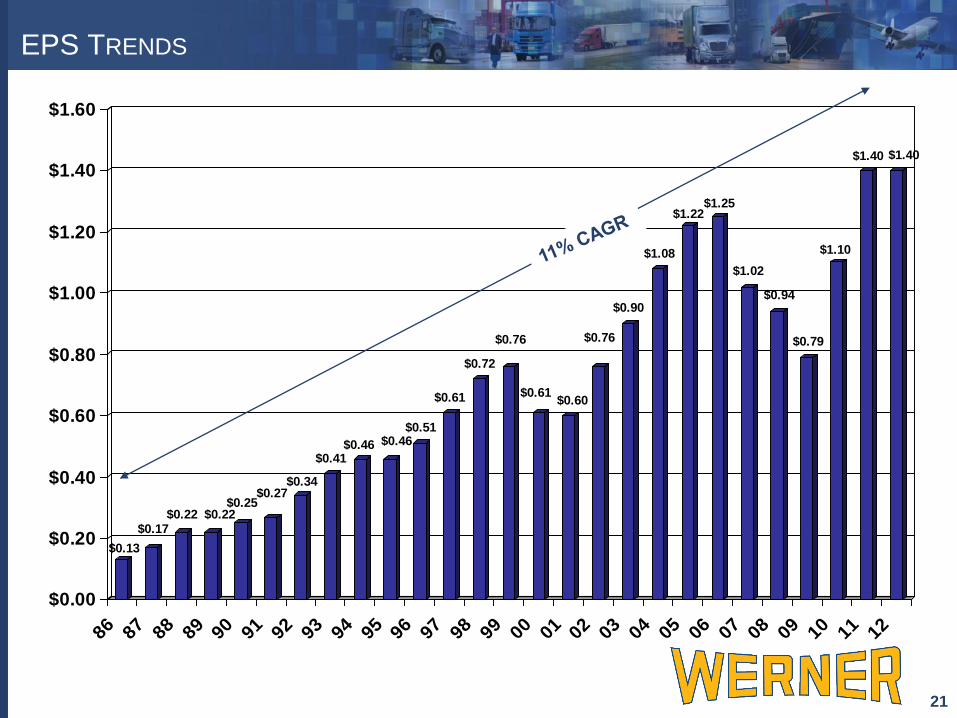
EPS TRENDS
* Total Company (Trucking and Logistics)
20
2
3
4
5
6
7
8
9
10
11
1Q 2Q 3Q 4Q
2009 2010 2011 2012
EPS TRENDS
24
$0.13
$0.17$0.22 $0.22
$0.25$0.27
$0.34
$0.41$0.46 $0.46
$0.51
$0.61
$0.72
$0.76
$0.61$0.60
$0.76
$0.90
$1.08
$1.22$1.25
$1.02
$0.94
$0.79
$1.10
$1.40 $1.40
$0.00
$0.20
$0.40
$0.60
$0.80
$1.00
$1.20
$1.40
$1.60
86 87 88 89 90 91 92 93 94 95 96 97 98 99 00 01 02 03 04 05 06 07 08 09 10 11 12
21
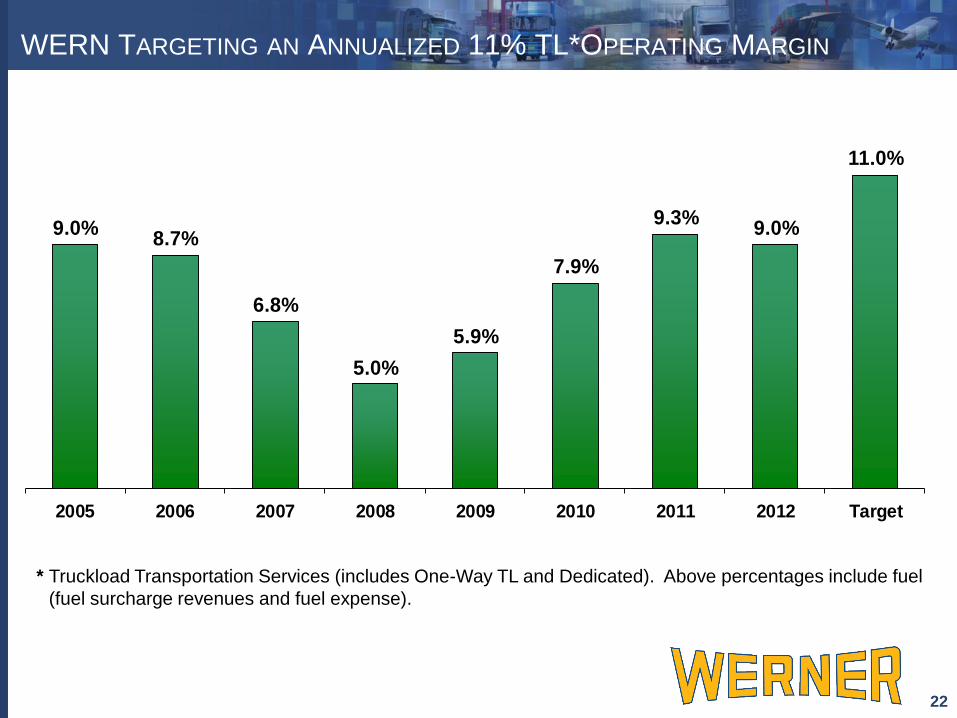
9.0%8.7%
6.8%
5.0%
5.9%
7.9%
9.3%9.0%
11.0%
2005 2006 2007 2008 2009 2010 2011 2012 Target
* Truckload Transportation Services (includes One-Way TL and Dedicated). Above percentages include fuel
(fuel surcharge revenues and fuel expense).
WERN TARGETING AN ANNUALIZED 11% TL*OPERATING MARGIN
25 22

11.3%8.8% 8.1% 7.5%
11.1%14.5% 13.6% 15.0%
2006 2007 2008 2009 2010 2011 2012 Target
ROE
6.9%5.4% 5.2% 4.6%
6.6%8.4% 7.7%
9.0%
2006 2007 2008 2009 2010 2011 2012 Target
ROA
WERN TARGETING A 15% ROE & 9% ROA
26 23

RETURN ON INVESTED CAPITAL (ROIC*) VS. SHARE PRICE GROWTH
20 24
*ROIC is a non-GAAP measure. Net income plus net interest expense, divided by average invested capital.
$5
$10
$15
$20
$25
1%2%3%4%5%6%7%8%9%
10%11%12%13%14%15%16%
2001 2002 2003 2004 2005 2006 2007 2008 2009 2010 2011 2012
Share Price (year-end) ROIC*
Re
turn
on
Investe
d C
apital
Share
Pri
ce (
year-
en
d)

27 25