WEMO - capgemini.com · 2 2 A Strategic Overview of the Global Energy MarketsA Strategic Overview...
268
In collaboration with: WEMO WEMO World Energy Markets Observatory
Transcript of WEMO - capgemini.com · 2 2 A Strategic Overview of the Global Energy MarketsA Strategic Overview...

In collaboration with:
WEMOWEMOWorld Energy Markets Observatory

2 A Strategic Overview of the Global Energy Markets2 A Strategic Overview of the Global Energy Markets
©2018 Capgemini. Reproduction in part or in whole is strictly prohibited.
Contents
WEMO 2018 Global Editorial 6
North America 19WEMO 2018 North America Editorial 201-Climate Challenges & Regulatory Policies 242-Energy Transition 373-Infrastructures & Adequacy of Supply 464-Supply & Final Customer 585-New Business Models & Services 646-Financials 76
Europe 83WEMO 2018 Europe Editorial 841-Climate Challenges & Regulatory Policies 922-Energy Transition 1003-Infrastructures & Adequacy of Supply 1084-Supply & Final Customer 1265-New Business Models & Services 1346-Financials 145
Southeast Asia 153WEMO 2018 Southeast Asia Editorial 1541-Climate Challenges & Regulatory Policies 1582-Energy Transition 1663-Infrastructures & Adequacy of Supply 1754-Supply & Final Customer 1815-New Business Models & Services 1856-Financials 195
Australia 199WEMO 2018 Australia Editorial 2001-Climate Challenges & Regulatory Policies 2042-Energy Transition 2163-Infrastructures & Adequacy of Supply 2264-Supply & Final Customer 2325-New Business Models & Services 2416-Financials 247
Appendix Figures 254
Glossary 258
List of Acronyms 261
Country Abbreviations and Energy Authorities 263
Team and Authors 264

3
Figures
North AmericaMajor energy events (2017 and H1 2018) .........22
Figure 1.1. US - Energy-related CO2 Emissions - Evolution since 2005 (million metric tons) ......24
Figure 1.2. US - Energy-related CO2 Emissions by Sector, 2005-2050 (million metric tons) ...........25
Figure 1.3. US - Electricity-related CO2 Emissions - with or without Clean Power Plan (CPP), 2000-2050 (million metric tons) .............26
Figure 1.4. US - Climate Stance Update - 2017 (US Climate Alliance) .............................................29
Figure 1.5. US - US Climate Alliance Forecast - Net GHG Emissions, 2005-2025 (million metric tons) ..........................................................................30
Figure 1.6. Canada - Estimated Weighted-Average GHG Emission Intensity of Fossil Fuel Consumption (Grams CO2 per Megajoule) .......31
Figure 1.7. Summary Regional Carbon Pricing Initiatives (ETS and Carbon Tax) - (implemented, scheduled for implementation and under consideration) and Sectoral Coverage ..............33
Figure 1.8. US - Carbon Costs Coalition Initiative ...................................................................34
Figure 1.9. Canada - Key Carbon Pricing developments across Provinces and Territories - 2017 and beyond ....................................................36
Figure 2.1. US - Decline in Energy Intensity and Carbon Intensity vis-à-vis GDP/Capita Growth, 2005-2050 ................................................................37
Figure 2.2. US - Incremental Annual Energy Efficiency Achievement/Utility Spending, 2010-2016...........................................................................38
Figure 2.3. US - Unsubsidized Levelized Cost of Energy (US$/MWh) ................................................39
Figure 2.4. US - Selected Historical Mean LCOE Comparison (US$/MWh) .......................................40
Figure 2.5. US - Solar Photovoltaic Utility-scale Solar System Cost Benchmark (2017 US$/watt - Direct Current) .......................................................41
Figure 2.6. US - Unsubsidized Levelized Cost of Storage (US$/MWh) ...............................................42
Figure 2.7. US - Total New Investment in Clean Energy, 2005-2017 (US$ billion)..........................43
Figure 3.1. - US - Electricity Use Growth Outlook, 2005-2050 ..............................................46
Figure 3.2. US - Historical Electricity Generation Mix - Evolution, 2008-2017 (TWh) ......................47
Figure 3.3. US - Projected Mix of Electricity Generation (Select Fuel Type), 2005-2050 (billion KWh) ............................................................48
Figure 3.4. US - Coal-fired Electricity Generation Capacity/Retirements, 2010-2020 (GW) ..........48
Figure 3.5. US - Annual Electricity Generating Capacity Additions and Retirements, 2005-2050 (GW) ..........................................................................49
Figure 3.6. US - Nuclear Capacity Changes - Outlook, 2015-2050 (GW) ....................................49
Figure 3.7. US - Renewable Energy Capacity Build by Technology, 2008-2017 (GW) ..............50
Figure 3.8. US - Asset Finance for Large-scale Solar and Wind Projects, 2012-2017 (US$ billion) ............................................................. 51
Figure 3.9. US - Top 10 Solar States by Capacity, 2017 (MW) ............................................................... 51
Figure 3.10. US - Natural Gas Production by Type, 2000-2050 (billion cubic meter) ..............52
Figure 3.11. US - Natural Gas Transmission Pipeline Capacity Additions, 2005-2017 (billion cubic feet per day) .................................................52
Figure 3.12. US - Natural Gas Trade with Canada and Mexico, 2010-2017 (billion cubic meter) ..............................................53
Figure 3.13. US - Historical Monthly Natural Gas Storage - Capacity and Storage Volume, 2013-2017 (billion cubic meter) ....................................54
Figure 3.14. Canada - Projected Capacity Additions and Retirements by 2040 (GW) .......55
Figure 3.15. Canada - Coal-fired Generating Capacity by Province, 2015-2040 (GW) .............56
Figure 4.1. US - Retail Electricity Sales and Sales By Sector, 2005-2017 (billion KWh) ...................58
Figure 4.2. US - Average Electricity Price and Prices By Sector, 2005-2017 (2017 cents per KWh)..........................................................................59
Figure 4.3. US - Average Electricity Price - Variations By State, 2017 (2017 cents per kWh) ............................................60
Figure 4.4. US - Projected Average Electricity Price and Prices By Service Category, 2010-2050 (2017 cents per KWh).................................. 61
Figure 4.5. US - Projected Natural Gas Consumption By End-use Sector, 2005-2050 (trillion cubic meter) ............................................. 61
Figure 4.6. US - Average Natural Gas Price By End-use Sector, 2005-2017 (US$ per cubic meter) .......................................................................62
Figure 4.7. US - Transmission Investment by Investor-owned Utilities and Independent Transmission Developers, 2011-2020 (US$ billion) .......................................................................62
Figure 4.8. Corporate Procurement of Clean Energy, 2017 (GW) .................................................63
Figure 5.1. As-a-Service Ideals ............................66
Figure 5.2. US - Select Policy Actions ................68
Figure 5.3. Daily Energy Sharing Scenario .......70
Figure 5.4. US - Projected IoT-enabled Smart Building Market, 2015-2020 (US$ billion) .........72
Figure 5.5. Business Models deployed or planned to be deployed in the next 24 months...................75
Figure 6.1. US - Revenues and associated CAGR, 2013-2017 (US$ billion) ............................ 76
Figure 6.2. Canada - Revenues and associated CARG, 2013-2017 (US$ billion) ............................77
Figure 6.3. US - EBITDA Margins and associated CAGR, 2013-2017 ...................................................78
Figure 6.4. Canada - EBITDA Margins and associated CAGR, 2013-2017 ...............................79
Figure 6.5. US and Canada - Dividend per Share in US$ and 2013-2017 Evolution .........................80
Figure 6.6. US and Canada - Utilities’ Stock Performance (July 2018) ......................................81
EuropeMajor energy events (2017 and H1 2018) .........90
Figure 1.1. World map of carbon pricing policies in 2018 ......................................................................92
Figure 1.2. Detailed characteristics of global carbon pricing policies .........................................93
Figure 1.3. Volume and use of carbon revenues in 2018 ......................................................................94
Figure 1.4. Net cost of EU ETS allowances for power and industrial sectors ..............................95
Figure 1.5. Map of indirect costs compensation schemes across the EU..............97
Figure 1.6. Total revenues derived from indirect compensation schemes for selected countries...........................................97
Figure 1.7. Comparison of the EU’s different levels of climate paths and resulting impacts on its stated ambitions .........................98
Figure 1.8. Greenhouse Gas Emissions evolutions and targets to 2020 ..........................98
Figure 1.9. EU primary energy consumption evolution and target to 2020 ..............................98
Figure 1.10. Share of Renewables in the Member States’ gross final energy consumption ...........99
Figure 2.1. New investments in clean energy .......................100
Figure 2.2. Net renewable power capacity added in Europe (GW) ........................................... 101
Figure 2.3. Leverage cost of electricity (LCOE) comparison of selected power generation sources in Europe starting production in 2017-2018.........................................................................101
Figure 2.4. Comparison of onshore wind and solar PV LCOE vs. auction prices (€/MWh) since April 2015 ....................................................102
Figure 2.5. Digital levers that transform wind industry ..................................................................102
Figure 2.6. Annually Installed Electrical Energy Storage Capacity (MWh) ......................104
Figure 2.7. EU-28 gross final energy consumption of bioenergy per market segment (2015).....................................................105
Figure 2.8. Fleet of alternative vehicles in Europe (2016) .......................................................106
Figure 2.9. 139 Hydrogen reflueling stations .106
Figure 2.10. 3.3 million EVs charging stations 106
Figure 2.11. New electric vehicle (EV) sales in Europe (BEV & PHEV by country) .....................107
Figure 3.1. Installed and decomissioned generation capacity per type of source (2017 versus 2016) ...............................................108
Figure 3.2. Overview of 2015-2017 generation mix evolution in EU countries (TWh) ...............109
Figure 3.3. Electricity consumption in EU-28 (2011 to 2017 and 2020, 2025 projections) ...109
Figure 3.4. Map of electricity flows .................110
Figure 3.5. Average European electricity spot price (2009 to H1 2018) ............................. 111
Figure 3.6. Current (2017) and future electricity capacity mix (2020, 2025)............... 111
Figure 3.7. Map of interconnections levels and interconnections projects (2018) .....................113
Figure 3.8. Market Coupling – WEMO 2018 ...114
Figure 3.9. Gas consumption in EU-28 (Bcm) 2017 .........................................................................119
Figure 3.10. Domestic gas production versus piped and LNG imports (2017) ..........................120
Figure 3.11. Map of gas imports (2017) ..........121
Figure 3.12. Piped Gas imports to Europe (bcm) .......................................................................122
Figure 3.13. LNG imports to Europe in bcm (2017) ......................................................................122
Figure 3.14. Map of pipelines and LNG terminals projects (as of June 2017) ..................................123

4 A Strategic Overview of the Global Energy Markets
Southeast AsiaIn this Observatory, Southeast Asia (SEA) refers to a region covering the following six countries only .................................................155
Figure 1.1. Primary Energy Demand Evolution, 2000-2016 (million tons oil equivalent) ..........159
Figure 2.1. Carbon Management Hierarchy ...167
Figure 2.2. Energy Consumption by Fuel, 2017 (million tons oil equivalent) ...............................168
Figure 2.3. Renewable Energy Investment (US$ billion), 2017 ...............................................169
Figure 2.4. Hydroelectricity Capacity Evolution, 2013-2017 (GW) ................................170
Figure 2.5. Solar Power Capacity Evolution, 2013-2017 (MW) ...................................................171
Figure 2.6. Wind Power Capacity Evolution, 2013-2017 (MW) ...................................................172
Figure 2.7. Biomass Capacity Evolution, 2013-2017 (MW) .............................................................173
Figure 2.8. Key Developments in Renewable Policy and Impact on Infrastructure................174
Figure 3.1. Firms experiencing electrical outages (% of firms)in selected Southeast Asian countries ................................176
Figure 3.2. Electricity Consumption, 2013-2017 (TWh) ......................................................................176
Figure 3.3. Electricity Trade flow in SEA region 177
Figure 3.4. Natural Gas Consumption, 2013-2017 (Billion cubic metres) ......................178
Figure 4.1. Average retail electricity prices ...181
Figure 4.2. Singapore: Import & Export of energy products (2015-2016) ............................183
Figure 4.3. Vietnam: Primary Energy Supply (Baseline vs. Proposed Scenario) (million tons oil equivalent) ...............................184
Figure 5.1. Current State Of Digitalization Of The Energy Value Chain ................................186
Figure 5.2. Blockchain can coordinate traditionally centralized data flows throughout the power system .........................187
Figure 5.3. The Five Pillars of Smart City Development ........................................................189
Figure 5.4. Smart Building Technology Market ....................................................................192
Figure 5.5. Priority Matrix for Digital Grid Transformation Technologies, 2018 ................194
Figure 6.1. EBITDA margins and associated CAGR, 2013-2017 .................................................195
Figure 6.2. Dividend per Share in US$ (2013-2017) .......................................................................196
Figure 6.3. Credit Ratings by Standard & Poor's, 2013-2018 ................................................197
AustraliaMajor energy events (2017 and H1 2018) .......202
Figure 1.1. Annual emissions in Australia, 2015-2030 (million metric tons) .......................205
Figure 1.2. Sectoral breakdown of emission projections, 2017-2030 (million metric tons) 205
Figure 1.3. Evolution of emission projections for 2020 over time (million metric tons) .............. 206
Figure 1.4. Projected cumulative surplus in emission reduction between 2013-2020, above
Figure 3.15. Gas storage .....................................124
Figure 3.16. Gas spot prices ...............................125
Figure 4.1. Average European gas and electricity prices in 2017 ...................................126
Figure 4.2. Residential gas prices in Europe – all taxes included (H2 2017 compared to H2 2016, in local currency) .................................126
Figure 4.3. Industrial & Commercial gas prices in Europe – VAT excluded (H2 2017 compared to H2 2016, in local currency)............................127
Figure 4.4. Residential electricity prices in Europe– all taxes included (H2 2017 compared to H2 2016, in local currency)............................128
Figure 4.5. Industrial & Commercial electricity prices in Europe – VAT excluded (H2 2017 compared to H2 2016, in local currency) ........128
Figure 4.6. Share of organizations implementing AI that observe more than 10 percentage point gain on the following benefits ..............129
Figure 4.7. Speed and convenience top the list of reasons for preferring voice assistants over human interactions ....................................131
Figure 4.8. Aggregated European electricity switching rates (2017) ........................................132
Figure 4.9. Aggregated European gas switching rates (2017) ........................................132
Figure 5.1. Impact of the following business models on utilities’ revenue in three to four years ........................................................................134
Figure 5.2. Percentage of the total company’s revenue that will come in the next three or four years from the sale of new energy products and services .........................................135
Figure 5.3. The SMART4 approach – the four smart areas of the energy transition downstream ..........................................................135
Figure 5.4. Contribution of key levers to the four Smart areas...................................................135
Figure 5.5. Heatmap of types of players on key levers ...............................................................136
Figure 5.6. Growth in Smart Building Connected Devices over time ...........................136
Figure 5.7. Building Energies .............................137
Figure 5.8. Smarthome .......................................138
Figure 5.9. CASE ...................................................140
Figure 5.10. A classification of the EV charging ecosystem in ten business models ..................141
Figure 5.11. companies .......................................142
Figure 5.12. Main partners for «smart city» initatives ................................................................143
Figure 6.1. 2016 & 2017 revenues in € billion and CAGR 2013-2017 ..........................................146
Figure 6.2. EBITDA margins (2013-2017) and associated CAGR .................................................146
Figure 6.3. Net debt and EBITDA in € million and leverage ratios for 2016 and 2017 ...........147
Figure 6.4. Dividends per share in € and 2013-2017 evolution ......................................................148
Figure 6.5. Utilities’ stock performance (July 2018) .............................................................149
Figure 6.6. Standard & Poor’s credit ratings .149
Figure 6.7. CO2 emissions from power and heat generation ...................................................150
2020 target (million metric tons) .................... 206
Figure 1.5. Evolution of emission projections for 2030 over time (million metric tons) ........207
Figure 1.6. Projected cumulative emission reduction required between 2021-2030 to meet 2030 target (million metric tons) .....207
Figure 1.7. Emission Reduction Fund contract portfolio (as of 15th June, 2018) ..................... 209
Figure 1.8. Potential new energy projects under NEG (in MW) ..............................................211
Figure 1.9. Renewable energy policy and performance status across states and territories ..............................................................213
Figure 2.1. Electricity Generation: Renewable vs. Fossil .......................................................................217
Figure 2.2. Projected Average Levelized Cost of Energy (A$/MWh) ..................................219
Figure 2.3. Large scale renewable energy projects under construction or starting in 2018 ....................................................................220
Figure 2.4. Residential energy storage system installation.............................................................222
Figure 2.5. % share of hydro in total Australian electricity generated in 2016 vs. 2017 ........... 223
Figure 2.6. % share of wind in total Australian electricity generated in 2016 vs. 2017 ............224
Figure 2.7. Cumulative installed wind capacity (in MW)...................................................224
Figure 2.8. Regional Split 2017 .........................224
Figure 2.9. % share of small-scale solar (up to 100 KW) in total Australian electricity generated in 2016 vs. 2017 ................................225
Figure 2.10. Annual solar PV installations and installed capacity (up to 100 KW) ....................225
Figure 3.1. Additional resources for summer 2017/18 (in MW) ...................................................227
Figure 3.2. AEMO/ARENA demand response trial for summer 2017/18, by sector and region..............................................................228
Figure 3.3. Number of unplanned transmission outages in NEM regions over summer 2017/18 vs. 2016/17 .............................................................229
Figure 4.1. Change in average residential customer effective prices (c/kWh) from 2007/08 to 2017/18, NEM-wide, real A$2016/17 (excluding GST).....................................................233
Figure 4.2. Change in average residential customer bill from 2007/08 to 2017/18,NEM-wide, real A$2016/17 (excluding GST) ............233
Figure 4.3. Quarterly gas generators’ fuel costs and average spot gas prices across all mainland NEM regions, Q1 2015 to Q2 2018 (A$/GJ nominal) ................................................................ 234
Figure 4.4. Change in average Victorian residential effective price (c/kWh) from 2007/08 to 2017/18, NEM-wide, real A$2016/17 (excluding GST) .............................. 236
Figure 4.5. Change in average NSW residential effective price (c/kWh) from 2007/08 to 2017/18, NEM-wide, real A$2016/17 (excluding GST).................................................... 236
Figure 4.6. Change in average South Australian residential effective price (c/kWh) from 2007/08 to 2017/18, NEM-wide, real A$2016/17 (excluding GST).....................................................237
Figure 4.7. Change in average south east Queensland residential effective price (c/kWh) from 2007/08 to 2017/18, NEM-wide, real

5
A$2016/17 (excluding GST) ...............................237
Figure 4.8. Change in average Tasmanian residential effective price (c/kWh) from 2007/08 to 2017/18, NEM-wide, real A$2016/17 (excluding GST).................................................... 238
Figure 4.9. Residential customers on standing offers in non-price regulated jurisdictions, 2014–2018 .............................................................239
Figure 6.1. Market shares in generation capacity across regions, 2017 ...........................248
Figure 6.2. Electricity retail market share across regions, 2017 ............................................249
Figure 6.3. Gas retail market share across regions, 2017.........................................................249
Figure 6.4. Five year earnings performance of AGL and Origin Energy, 2013-2017 (A$ million) ........................................................... 250
Figure 6.5. Change in electricity transmission and distribution network revenues and operating cost – previous (2012/13 – 2016/17) vs. current (2017/18-2021/22) regulatory period .....................................................................251
Figure 6.6. Change in gas transmission and distribution network revenues and operating cost – previous (2012/13 – 2016/17) vs. current (2017/18-2021/22) regulatory period .....................................................................252
Figure 6.7. Five year earnings performance of Citipower, Powercor and AusNet, 2013-2017 (A$ million) ............................................................253
Appendix FiguresFigure A.1 Peak load, generation capacity and electricity mix (2017).................................. 254
Figure A.2 Share of renewable generation capacity by country (2017) ............................... 254
Figure A.3 Yearly (2017 and 2018) and winter (2016/2017 and 2017/2018) average electricity spot prices .........................................255
Figure A.4 Electricity spot prices on the main European markets (2017 and H1 2018) ...........255
Figure A.5 Status of electricity price regimes (2017) ..................................................... 256
Figure A.7 Residential electricity price breakdown (as of June 2018) ........................... 256
Figure A.6 Electricity retail market size (2017) ..................................................................... 256
Figure A.8 Status of gas price regimes (2017) ......................................................................257
Figure A.10 Residential gas price breakdown (as of June 2017) ..................................................257
Table A.9 Gas retail market size (2017) ...........257
Topic Box
North AmericaTopic Box 1.1: Corporations outweigh CPP benefits over repeal, citing ‘climate stance an upright business move along with a moral and environmental imperative ...28
Topic Box 1.2: Canada’s British Columbia unveils legislation to update GHG reduction targets .........................................32
Topic Box 2.1: Energy storage growth traction is picking up pace – and is here to stay .............44
Topic Box 2.2: Federal initiatives ranging from trade cases to tax reform continue to drive uncertainty in the market for clean technologies ...........................................................45
Topic Box 4.1: Corporations are driving the transformation to a resilient energy supply, demanding progressively cleaner energy and seeking energy efficiency gains .........................63
Topic Box 5.1: Canada’s US$300 million ‘Smart City Challenge’ - one of the largest smart city challenges ever undertaken ................................ 74
Topic Box 6.1: Evolving Business Strategies… 79
Topic Box 6.2: Impact of key tax reform provisions on energy companies ........................81
EuropeTopic Box 1.1: The Clean Energy For All
EPBD, a 32% target for renewables and annual savings of 0.8% for energy efficiency ...............96
Topic Box 1.2: The Mobility Package positions the EU as a regulatory leader for clean and digital transportation ...........................................99
Topic Box 2.1: How digital is transforming the wind sector ? ..................................................102
Topic Box 2.2: The market for energy storage continues to grow; however, its full potential is hindered by lack of clarity around regulations and business models ...........................................104
Topic Box 3.1: Capacity mechanisms ............... 115
Topic Box 4.1: Beyond energy retail prices ...130
Topic Box 4.2: Will regulated energy tariffs disappear? .............................................................133
Topic Box 6.1: In a more challenging environment, Utilities are implementing new investment strategies towards services and low carbon energy ...............................................151
Southeast AsiaTopic Box 1.1: Government and private sector initiatives to reduce emissions challenges ....165
Topic Box 3.1: Singapore is being developed as a gas hub ...........................................................179
Topic Box 3.2: Issues and Challenges for Regional Power Cooperation ............................180
Topic Box 4.1: Case studies Singapore, Philippines & Vietnam .........................................183
Topic Box 4.2: Singapore to launch Full Electricity Retail Contestability for competitive pricing in 2018 ...............................184
Topic Box 5.1: Singapore’s first e-commerce site for energy, Electrify.sg, makes it easy for businesses to choose clean energy .................190
Topic Box 5.2: Innovation at the edge of the grid drives utility sector transformation and requires digitally enabled delivery infrastructure .......................................................193
Topic Box 6.1: Southeast Asia’s Rating Trends ........................................................197
AustraliaTopic Box 1.1: Criticisms of National Energy Guarantee policy ..................................................215
Topic Box 2.1: Revolution in rooftop solar .....225
Topic Box 3.1: Additional jurisdiction actions in South Australia ..................................231
Topic Box 4.1: Drawbacks of the current regulatory framework for consumer protection and the proposed scheme by ACCC ..................................................................240
Topic Box 5.1: Carbon Capture and Storage (CSS) to play a pivotal role in CSIRO Low Emissions Technology Roadmap ......................246

WEMO 2018 Global EditorialColette Lewiner
6 A Strategic Overview of the Global Energy Markets
Oil prices have increased
Oil prices rose as high as
2014; this represents an increase of nearly 100% since January 2016.
Four factors in particular came into play:
• Supply and demand: the booming world economy has led to a demand increase of more than 5Mb/d1 since 2015 with global oil consumption expected to top 100Mb/d by the end of 2018. World oil demand rose by 1.6% (or 1.5 Mb/d) in 2017, a rate that was higher than the annual average of 1% seen over the last decade. Inventories of crude that had built up during the 2014-2016 glut have decreased because of this strong demand and the supply cuts by OPEC/Russia.
• OPEC and Russia: in late 2016 an agreement was reached to limit their supplies in order to push up the oil price. This deal has removed at least 1.8 Mb/d since the start of 2017. Despite American pressure to enhance production in order to lower prices, OPEC and Russia agreed in June 2018 to increase production slightly less
output. In practice the increase will be less (around 700,000 b/d) because many OPEC members aren’t in a position to raise their output. The oil price increased moderately after these decisions were announced.
• Geopolitical risks: when supplies are tight, as presently, these risks
■ The U.S. withdrawal from the Iran nuclear deal announced in May 2018 and the probable sanctions
on Iran’s oil exports are the most tangible risk. Iran is the third largest worldwide oil producer and since the nuclear deal was struck and the oil-related sanctions lifted, Iran’s exports had increased.
■ Venezuela’s oil output has fallen by at least 500,000 b/d because of the economic and political crisis in the country and there is little sign that the state oil company PDVSA will be able to reverse the trend.
■
Arabia and Houthi rebels in Yemen: the Houthis, who have Iran’s support, have stepped up their attacks on Saudi Arabia’s oil infrastructure and even Riyadh. There is a chance either of supply
between Saudi and Iran.
■ Finally, Libya, where oil output has recovered to 1Mb/d, remains highly unstable even seven years after the civil war started. In conclusion the risk of a supply
• Swelling supplies from the US:
but shale oil has faced pipeline constraints and infrastructure bottlenecks limiting how quickly production can reach the market.
For the future, many observers forecast robust oil prices although they don’t see a return to pre-downturn levels.
In 2008, the oil barrel price peak at US$150 coincided with the beginning of the economic recession. What was the chicken and what was the egg? Could today’s price level trigger a new recession?
1 Mb/d: million barrels per day

7
been under construction along the Gulf of Mexico. The earliest Cheniere Energy’s Sabine Pass in Louisiana started exports in February
in March 2018. There has been no approval for new U.S. LNG plants since 2015 because of expectations of excess supply. These expectations have diminished because of soaring LNG demand. In May 2018, Cheniere announced it was expanding its Corpus Christi plant in Texas. Other U.S. projects are making good progress, signaling a second wave of investment in U.S. LNG plant export capacity.
The biggest threat to these plans is the trade dispute between the U.S. and China. Even if LNG was excluded from China’s list of U.S. exports
(almost all U.S. fossil fuels are on this list including oil and coal) the prospect of being shut out of the world’s biggest growth market will hang over Final Investment Decisions until hostilities are brought to an end.
Coal demand and prices are up
Despite being the major commodity least loved by analysts, global coal demand rose about 1% in 2017, reversing the trend seen over the last two years. This growth was mainly due to demand in Asia, almost entirely driven by an increase in coal-
June 2018 the price of thermal coal (burnt in power plants to produce electricity) rose to US$112 a ton,
Gas is still a regional commodity
Global natural gas demand grew by 3%, thanks in large part to abundant and relatively low-cost supplies. China alone accounted for almost 30% of growth globally. Gas prices rose in Europe, Asia and North America in 2017, but remained below the 10-year average. Over the past year, European and Asian prices have been supported by increasing oil, coal and carbon prices.2
Gas (LNG), natural gas markets
discrepancies in spot prices between
At the end of 2017, when the U.S. Henry Hub spot price was around US$3/MBTU3, the UK NBP price reached US$6/MBTU and the Japan price was nearly triple that at US$7-8/MBTU.
The LNG global market represents 10% of gas supplies worldwide. It has
in 2017 it reached 294 Mtpa4 and in 2020 it is likely to represent 360 Mtpa or 150% of its 2015 capacity. Following its “blue sky policy” to curb Green House Gases (GHG) emissions and limit coal usage, China increased imports by 46% in 2017 overtaking South Korea to become the world’s second largest LNG buyer after Japan. It was the third largest destination for U.S. LNG exports after Mexico and South Korea5. Thanks to the abundance of low cost gas unlocked by the shale revolution, the U.S. is a competitive supplier compared in particular to Russia, Qatar and Australia.
130% higher than its 2016 low because of strong Asian demand. Although thermal coal is being phased out of many European countries (except Germany and Poland) it accounts for 40% of energy consumption in emerging markets, especially Asia. Demand from India, Japan and South Korea was robust in H1 2018 while an early summer heatwave boosted imports to China despite the Beijing
6.
Economic growth is increasing the threat
of climate changeEconomic growth is triggering growth in global energy demand, which increased by 2.1% in 2017, (compared with 0.9% the previous year7): 72% of the rise was met by fossil fuels, a quarter by renewables, and the remainder by nuclear.
Global energy-related CO2 emissions grew by 1.4% in 2017, reaching a historic high of 32.5 gigatonnes (Gt), a resumption of growth after three years of global emissions remaining unchanged. The increase in CO2 emissions, however, was not universal. While most major economies saw a rise, some others experienced declines, including the United States, the United Kingdom, Mexico and Japan.
The Paris 2015 Climate Accord objective to keep the global temperature rise below 2 degrees in 2050 is becoming even more
Already the 2015 countries’ pledges projections led to warming of
catastrophic consequences for life
2 https://www.bp.com/en/global/corporate/energy-economics/statistical-review-of-world-energy/natural-gas/natural-gas-prices.html
3 MBTU: Million British Thermal Unit
4 Mtpa: Million tons per annum
5 Ed Crooks, “US trade spat threatens new wave of LNG plants”, Financial Times, June 27, 2018
6 https://in.reuters.com/article/column-russell-coal-china/column-chinas-first-half-coal-imports-surge-indonesia-the-winner-russell-idINL4N1TS213
7 IEA global Energy & CO2 Status report 2017
Edito
rial

8 A Strategic Overview of the Global Energy Markets
8 The net capacity factor is the ratio of an actual electrical energy output over a given period of time to the maximum possible electrical energy output over that period.
9 PV: photovoltaic solar
10 https://www.eia.gov/electricity/monthly/epm_table_grapher.php?t=epmt_6_07_b
11 IEA World Investment Report July 2017
12 https://www.irena.org/publications/2018/Mar/Renewable-Capacity-Statistics-2018
13 Bloomberg New Energy Finance study July 2018
and, in the case of onshore wind, local opposition.
Thanks to productivity gains (with the same investment more capacity can be built) solar and wind renewable energy installed capacity continued to grow representing 61% of all net power generation capacity added. However, regional and technological progress varied: in Europe wind power continued to progress while in the U.S. renewables growth was mainly in solar. The real boom is in photovoltaic solar in China with 53 GW installed capacity in 2017 (nearly half of newly installed worldwide
sky policy”.
At the end of 2017, global renewable generation capacity amounted to 2,179 GW. Hydro accounted for the largest share of the global total, with installed capacity of 1,152 GW. Wind and solar energy accounted for most of the remainder, with capacities of 514 GW and 397 GW respectively. Other renewables included 109 GW of bioenergy, 13 GW of geothermal energy, and 500 MW of marine energy (tide, wave and ocean energy)12.
solar energy investment decreased by 19%13
because of the Chinese government’s decision to slow down solar photovoltaic (PV) development. In contrast, wind investment grew by
2017 saw some spectacular achievements:
In Denmark, wind energy met as much as 43.4% of electricity consumption. The government’s goal is for wind
Ironically, in 2017 the U.S. was one of the few countries that had decreased its GHG emissions!
Renewables, carbon-free generation and
storage are expanding
Renewables
• Intermittent renewables
characteristics:Wind and photovoltaic (PV) solar are renewables with no storage, being purely intermittent; hydropower (dams), biomass and, to a certain extent, concentrated solar have storage. They don’t have the same generation output characteristics or the same grid impact. The intermittent renewables capacity factor8 varies according to location and, notably, wind and solar intensity. In the U.S., on average, the 2017 wind capacity factor was 37% and the PV9 solar 27% while the nuclear plant capacity factor was 92%10.
into account when comparing installed capacity of intermittent renewables with schedulable
plants).
• In contrast to previous years, 2017 investment in electric renewables generation
decreased by 7%11
while investment in the oil and gas value chain increased. Solar and
while onshore wind and hydropower investment decreased; probably because of the lack of suitable sites
on Earth, and the 2017 results were not in the right direction. It is now unclear how governments will be able to announce increased ambitions in line with the goal of holding global warming at 1.5 degrees in 2050.
Following his electoral campaign commitment, President Trump announced in June 2017 that the United States would withdraw from the Paris Accord. Even if other countries don’t follow the U.S.
to combat global warming, since
in 2019. Domestically, the U.S. administration has cancelled the Clean Power Act (which was never actually implemented) and there has been a relaxation of car consumption constraints. Also, the Environment Protection Agency (EPA) budget was
However, ignoring President Trump’s proposed cuts to renewable energy and early-stage energy programs, Congress decided to increase energy-related R&D and innovation budgets for 2018:
received a growing R&D budget
increase)
Projects Agency-Energy) funding increased to a record high of
• the U.S. Department of Energy’s
renewable energy budgets both increased by around 15%.

9
14 Equivalent to 110 football fields
15 March 2018
16 LCOE: Levelized Cost Of Energy
17 Clara Franziska Heuberger, Niall Mac Dowell, “Real-World Challenges with a Rapid Transition to 100% Renewable Power Systems”, Joule. [online]. Volume 2, Issue 3. March 21, 2018. https://www.sciencedirect.com/science/article/pii/S2542435118300485
18 https://jancovici.com/transition-energetique/renouvelables/pourrait-on-alimenter-la-france-en-electricite-uniquement-avec-de-leolien/
19 Overcapacity and the challenges of going 100% renewable by Chris Lo
and solar energy to meet at least 50% of its energy needs by 2030, which
Nordpool grid interconnections with countries having schedulable electricity sources: hydro in Norway, nuclear and hydro in Sweden, nuclear in Finland.
wind farm Hywind (30 MW) was commissioned by Equinor (formerly Statoil) in Scotland.
In early December 2017, the largest
world – 40 GW, 800,000 m² 14 – was launched in China.
In March 2018, SoftBank and Saudi Arabia announced a project to build
completed, nominally in 2030, it will have a capacity of 200 GW and
its heavily oil-dependent economy. In addition to that huge solar farm, the government plans to spend
reactors.
• Solar and onshore wind continued to gain in competitiveness in 2017
According to the latest Bloomberg New Energy Finance (BNEF) worldwide study15, the average LCOE16 of onshore wind was down 18% year on year at US$55/MWh, and that of photovoltaics dropped to US$70/MWh (down 18%). The decline
(- 5%) at US$118/MWh. For onshore wind, the lowest costs are recorded in Australia, Brazil, Sweden and India, while for solar, the countries with the most competitive costs are Chile, India, Australia and Jordan.
Photovoltaic solar LCOE costs are expected to continue to decrease (by 60% from 2016 to 2025). Over the same period, the onshore wind LCOE is expected to decrease by 26% and
• Intermittent renewables have an important impact on grid management as the grid
operator has to constantly balance supply with variable demand. With intermittent renewables supply, capacity back-up (i.e. operational margin) is needed and the grid design, equipment and management become more complex, hence the need for smarter grids.
In order to compare costs with schedulable generation, one has to add between 15-40% cost to the LCOE renewable costs and this
generation share increases.
• As shown by studies17, it is not possible today to manage an electricity grid with 100% intermittent renewables generation for several reasons:
■ Intermittent renewables sources
space. For example, if wind power generated 100% of French electricity consumption, windmills would occupy 5% of French territory, which is about the area currently occupied by cities, roads and car parks18. In France, to produce the electricity equivalent of a 1,000 MW nuclear reactor (France has 58 reactors) a surface equivalent to intramural Paris would have to be covered by solar panels.
■ A grid with 100% intermittent renewables is not manageable19 as increased operational margins
are needed to compensate for intermittency and as the system has to be massively oversized. Operational back-up with electrical batteries is too expensive and not feasible today. For example, in France, if all electricity was generated by intermittent renewables, battery storage of electricity would represent consumption of materials and environmental problems (for batteries manufacturing and their end of life management) out of proportion to the means available. As an illustration, to store one week of French electricity generation (with 1.5 TWh stored by day) each person would need around 500 kg of Li-ion batteries!
■ Operational backup has to be provided by schedulable electricity sources: traditional fossil fuel plants or nuclear. With no such electricity sources, grid dynamic stability would be endangered which would imply renewable power curtailment.
■ Finally, the economics of such a system would be a robust challenge, as the cost of integrating renewables on the grid grows with their share of generation. A recent study on an European Union (EU) electrical
Edito
rial

10 A Strategic Overview of the Global Energy Markets
system with 60% renewables (including 40% wind power and solar and 20% hydropower) by 2030 shows20 that there are already strong implications for system operation and costs. Similar studies show that nuclear electricity is needed as a carbon free and schedulable complement to renewables.
• New players are entering the sector: Oil companies such as BP or Shell are coming back to solar energy. By
43% stake in Lightsource, Europe’s
withdrew six years before. In January 2018, Shell ventured back into solar after a 12-year hiatus, buying a 43.86% stake in Silicon Ranch
Total entered the solar energy sector in 2011 by acquiring American Sunpower. More recently, in 2017, Total announced the signing of an agreement with the French EREN RE, with an indirect stake of 23% and a takeover of the company after
For many years, Utilities such as EDF, Engie, Enel or Iberdrola have had renewable energy generation plants in their countries and abroad and have multiple projects in their portfolios. EDF, for example, has dynamic renewable worldwide development supported by its subsidiary EDF EN (12 GW wind
and solar installed capacity in 22 countries21).
In addition, at the end of 2017 EDF announced a plan to develop and build in France 30 GW of PV by 2035, which represents four times the country’s current solar production capacity. The dedicated investment is planned to be as much as €25bn.
• Strategic considerations: As the wind and solar industries are young, concern has to be raised regarding the real lifetime of
end of life management, and solar panel recycling.
Concerns arise also from China’s essential monopoly on the global
70% of the world’s solar panels22. It
markets (and now countries such as India and Japan) with cheap panels and has triggered the bankruptcy of many western solar panel manufacturers notably in Germany and the U.S..
In fact, the EU policy of heavily funding solar and wind renewables
costly for European consumers and
been much better from economic and strategic perspectives, to invest more in R&D in order to create a high-tech solar industry in Europe.
In 2012, the U.S. followed by the EU23
Chinese solar products. However,
Chinese manufacturers circumvented
their development.
Again in January 2018, President Trump announced that solar modules
of the three subsequent years. These
countries but are largely a response to cheap Chinese products and companies moving manufacturing operations outside the USA.
This decision has already triggered actions to relocate manufacturing: for example, in April 2018 SunPower, which manufactures its PV panels outside the U.S., announced the acquisition of SolarWorld Americas in order to relocate its cell manufacturing in the United States.
However, in the short term, the
solar installations: in Q1 2018, total corporate funding fell to only US$2
Moreover, China’s spectacular photovoltaic solar capacity growth is becoming very onerous for the country. Its solar development
addition, many PV installations are not connected to the grid. These factors pressured the Chinese government to announce in early June 2018, dramatic decreases in solar subsidies and a freeze on permits for new installations.
According to a 2018 BNEF study, a pessimistic scenario would have worldwide new installed solar capacity decrease by 3% in 2018 to 95 GW.
20 https://www.power-technology.com/features/featureovercapacity-and-the-challenges-of-going-100-renewable-5872868/
21 Alain Burtin, Vera Silva, “Technical and Economic Analysis of the European Electricity System with 60% RES”. [online]. June 17, 2015. http://www.energypost.eu/wp-content/uploads/2015/06/EDF-study-for-download-on-EP.pdf
22 by end 2017
23 https://thediplomat.com/2018/02/chinas-solar-power-dominance-and-trumps-trade-tariffs/

11
Electricity storage
accommodating an increasing share of renewables in the electricity system:
■ Develop more interconnections in order to increase the overall electricity exchange zone and
sources variabilities (wind, solar, for example)
■
to trigger increased customer demand response when cheap renewable electricity is available
■
generate less electricity during
■ Dispatch “peakers” that are typically simple-cycle gas turbines able to start up and
minutes. However, they emit GHG
■ Use nuclear plants load following potential
• There are various storage technologies depending on the required storage time:
■ for very short periods (seconds,
adapted
■ for short periods (minutes, hours) batteries are the best technology
■ for hours to days storage: compressed air is being studied
■ for days to months, pumped hydro storage is a very good solution.
Unfortunately, in Europe there are few suitable sites left and these
24
■ Inter-seasonal, mega batteries such as in South Australia, with the largest worldwidebattery (worth US$50 million) or the California mega project25
• Triggered by electric vehicle development, battery technologies
large stationary batteries used for grids or small individual batteries used for self-consumption.
■ Key criteria of battery choice: performance (number of cycles, capacity, energy, yield), security, environmental impact, and system costs (battery plus electric inverter)
■ Technologies: lithium-ion is today the reference technology used in cell phones and e-vehicles. It is increasingly penetrating the stationary market for electrical systems. These batteries have high energy density, high yield and can accommodate a large number of cycles; however, they
Solid state batteries that are
much higher energy density26 than lithium-ion batteries, have emerged as potential game changers for future battery chemistries. Leading car manufacturers are already adopting them for some of their models. Other new technologies such as Zn-Air, metal-Air, sodium-ion, new Red-ox systems, and nano-
industrial development stages.
■ Battery costs have decreased quickly with an acceleration since 2016. These costs were divided by 5 in 10 years, decreasing nearly as quickly as PV cells. They should continue to decrease from around US$200/kWh in 2017 to below US$100/kWh in 2025-2035.
■ Future battery challenges are related to recycling, safety (even in extreme conditions), energy density increase and weight decrease (for mobility), increased number of possible cycles, quick charging (especially for e-vehicles), low CO2 emissions during battery manufacturing, and further cost decreases (to US$80/kWh).
■ Batteries’ end of life: three areas are being investigated: repurposing used electric vehicle batteries in grid-scale storage applications; remanufacturing individual modules or packs for reuse in new vehicles; and recycling materials in used cells and packs into new battery grade materials 27.
• Hydrogen produced by electrolysis is a mobility and storage long-term
Hydrogen-fueled vehicles represent high investment but while the cost of fuel is higher than for Electric Vehicles (EVs) it is comparable to gas-fueled cars. Currently, power-to-gas28 is not competitive as it produces gas at a cost of €50-100/MBTU, much higher than natural gas market prices (€6/MBTU in Europe and much less in the U.S.) and even higher than subsidized biogas (€30/MBTU in France).
24 As a consequence of the increased renewables share on the grids, the difference between peak and off-peak electricity prices has decreased
25 By mid 2018, Pacific Gas & Electric Co detailed plans for four storage projects totaling nearly 570 megawatts
26 Their energy density is twice lithium-ion batteries
27 https://www.nrc-cnrc.gc.ca/eng/publications/nrc_pubs/energy_storage/2016/summer_main_article2016.html
28 Power-to-gas is a technology that converts electrical power to a gas fuel.
Edito
rial

12 A Strategic Overview of the Global Energy Markets
• Critical metal resources: Lithium and cobalt are fundamental components of current lithium-ion
With the rapid growth in battery demand, their availability could become seriously critical29. In
from strong geographical concentration (65% of the world’s cobalt comes from the Democratic Republic of Congo). Chinese battery suppliers are securing lithium and cobalt resources: in early 2018, Glencore Plc, the world’s biggest producer of cobalt, agreed to sell around a third of its cobalt production over the next three years to Chinese battery recycler GEM. CATL, which specializes in batteries for electric vehicles, has acquired a majority interest in the North American Lithium mine at Quebec.
• Utilities’ roles in the battery space could be:
■ System designer and energy system manager. For example, EDF has installed at West Burton
UK) a 49 MW battery providing enhanced frequency response to the National Grid30.
■ Grid services providers as illustrated by AEP in the U.S.31
■ Investment in batteries: EDF decided to invest in 50GW of batteries by 2035. These batteries would increase security of supply and smooth the generation load curve
• Electric vehicles ■ In 2017, EVs (battery-electric vehicles and plug-in hybrids) accounted for 1.1 million vehicles, representing 1.7% of new worldwide car sales, up from 1.1% in 201632. EV sales33 are forecast to climb to 1.6 million in 2018 and further upwards to an estimated 2 million in 201934. Many car manufacturers35 have announced EV milestones and targets. If all these announcements were to come true, there will be about 25 million EVs sold by 2025 or 20% of all cars! As in other parts of the energy sector, China is a dominant player: in 2017 Chinese
680,000 all-electric cars, buses and trucks – more than the rest of the world combined – and China’s output is growing faster than the rest of the world (twice as fast as the U.S.)36. Despite rapid progress, the EV industry still needs to overcome major challenges related to battery technology (energy density and cost) and charging infrastructure.
■ Utilities and Oil and Gas companies have started investing heavily in establishing electric vehicle charging stations. In 2017, the French Utility Engie acquired the Dutch company EVBox, one
29 Analysis by researchers at the Helmholtz Institute Ulm (HIU) of the Karlsruhe Institute of Technology (KIT) https://www.kit.edu/kit/english/pi_2018_027_scenario-2050-lithium-and-cobalt-might-not-suffice.php
30 https://www.energy-storage.news/news/edfs-completed-49mw-battery-system-brings-nearly-all-efr-projects-over-the
31 https://www.elp.com/articles/2016/09/aep-texas-sees-battery-energy-storage-as-alternative-to-grid-upgrades.html
32 https://www.businessinsider.com.au/the-rapid-growth-in-global-electric-vehicle-sales-in-4-charts-2018-1
33 Frost & Sullivan’s, Global Electric Vehicle Market Outlook 2018
34 https://www.forbes.com/sites/sarwantsingh/2018/04/03/global-electric-vehicle-market-looks-to-fire-on-all-motors-in-2018/#71e77ab02927
35 https://www.reportbuyer.com/product/4833514/global-electric-vehicle-market-outlook-2018.html
36 https://www.scmp.com/business/companies/article/2143646/chinas-ev-market-growing-twice-fast-us-heres-why

13
37 DSO: Distribution System Operators
38 WEMO 2017 edition (editorial)
39 EPR: Evolutionary Power Reactor
40 March 2018 agreement between EDF and NPCIL (Nuclear Power Corporation of India Limited)
41 CGN: China General Nuclear Power Corporation
of the world’s largest providers of charging solutions for electric vehicles with more than 40,000 charging stations in service. In 2017 Shell acquired The New Motion in the Netherlands, which owns a network of 30,000 charging stations; and in June 2018, BP announced the acquisition of Chargemaster, the UK’s largest network of charging stations (6,500). Interaction between EVs and electricity operators is a major issue. On the one hand, their development will push electricity consumption up which is good news for Utilities, and idle EV batteries could improve electricity grid stability especially when the share of intermittent renewables is increasing. On the other hand, if EV charging is not mastered,
charging at certain times of day, their development would pose a big challenge for the DSOs37,
reinforce their grid for peak hours’ consumption38 which is very costly.
Nuclear is a carbon-free schedulable
generation technology
and 1,600 MW are the present
■
French-designed EPR39 became operational in China in 2018; a very important milestone for this new third generation reactor. Years later than scheduled and with huge budget overruns, the Finnish EPR at Olkiluoto and the French one at Flamanville are due
to come in service in 2019-2020. A further project involving two EPRs at Hinkley Point C (South-West England) is due for completion at the end of 2025. The Taishan reactor coming online answers many technical concerns, notably regarding safety. These technical assessments should be reinforced after the completion of Flamanville and Olkiluoto.
a turning point for the French nuclear industry, which streamlined its organization at the end of 2017 following EDF’s acquisition of Framatome (ex Areva NP), making EDF the clear leader in France’s nuclear industry. The commissioning of Taishan is reassuring for the Hinkley Point C decision and could push India to
for the Jaitapur site40. However, the commercial battle for French technology is not won.
■ Several years later than planned and with a large cost overrun,
Sanmen plant, developed by Westinghouse, also began loading fuel during spring 2018. However, Westinghouse has been in chapter 11 bankruptcy protection since 2017 and plunged its owner
Westinghouse is in the process
Canadian asset manager, after a
in January 2018.
■ China is chasing an aggressive target to increase its nuclear capacity to 58 GW by 2020 from 35.8 GW at the end of 2017 or 4% of this big nation’s power
generation. China has become
design and construction but is making full use of western technology while adapting and improving it. China’s policy is to “go global” with exporting nuclear technology. Under a Strategic Investment Agreement signed by EDF and CGN41 in October 2015, CGN agreed to take a 33.5% stake in the Hinkley Point C project, and to participate in the joint development of new UK nuclear power plants at Sizewell and Bradwell. The Hinkley Point C and Sizewell C plants will be based on France’s EPR reactor technology, while the new plant at Bradwell will feature CGN’s third generation Hualong One
Thanks to its experience in operating nuclear reactors and its cheap nuclear supply chain, China is likely to become a big player in the international nuclear sector.
■ Rosatom from Russia is today probably the most successful company building new reactors. In addition to operating 35 reactors in Russia, Rosatom is leading the new nuclear construction market with the highest number of simultaneously implemented nuclear reactor construction projects (6 in Russia and 35 abroad). Nuclear experts recognize the enhanced safety features of its generation 3 VVER-1200 currently being constructed worldwide. In addition, Rosatom is able to
from operations support and
Edito
rial
14 A Strategic Overview of the Global Energy Markets
new projects.
• Small reactors: Compared to large reactors, small reactors are
and more adapted to grids in developing countries and to multipurpose use.
■ Floating reactors: capitalizing on its experience with nuclear-powered icebreakers, in May
East destination (Pevek) where they will be connected to the grid in 2019. These reactors will generate heat and electricity. On the one hand, they can deliver electricity anywhere along a coast and connect to the local grid. On the other hand, there
as cyclones and tsunamis. If operations go well, this type of reactor could be developed for
electricity for oil platforms or seawater desalination plants.
■ Small Modular Reactors (SMRs): For many years, companies in the nuclear industry have been testing the SMR concept. Probably the most advanced project in the West is the NuScale Power Module (NPM) developed by NuScale from the U.S.. The NPM builds on nuclear technology with a focus on
Each module can produce 50 MW of electricity. A power plant can house up to 12 of these modules for a total output of 600 MW. The NPM design is making steady progress and NRC42 approval is scheduled for mid-2020. Russia, China, South Korea, France, the UK and other European countries also have SMR projects. As already pointed out, these
small reactors have many
the lack of scale that leads to relatively larger investment and higher electricity costs. This is why SMR manufacturers are
designs and maximizing the equipment that can be manufactured in plants in order to lower costs. The success of this industry policy will be tested a few years from now.
China’s growing importance in energy
In the global energy market, China is positioned in a large number of areas and geographies. China is a:
• Large consumer with growing needs and the biggest emitter of GHG, well above the USA. These emissions together with other industrial pollution problems have created huge health issues for the population and the Chinese government has launched a long-term program to develop carbon-free sources of electricity (nuclear, solar PV and wind power) in addition to building hydropower mega projects such as the Three Gorges Dam.
provider: China has a long-term policy of developing equipment
selling it on the international market China is by far the biggest worldwide consumer of coal and
power plants. Chinese companies are building more than 700 new coal plants at home and worldwide, with around half of the new coal generation expected to go on line in the next decade43. Having adapted Western
technologies such as French EPR in nuclear, solar panels or wind turbines to its own market and capabilities, China is now exporting related equipment. In addition to the partnership agreement signed with EDF in 2015, in July 2018 CGN expressed its interest in buying a stake in the UK’s EDF Energy nuclear plants.
markets provoking protectionism reactions from the EU and the U.S. administration. Moreover, in June 2018, the Chinese government decided to slow down domestic solar capacity growth, pushing more Chinese equipment onto international markets. China is also exporting wind turbines and investing massively in electricity storage development with the aim of becoming a dominant player, as it already is in EV manufacturing.
• Dominant player in critical resources: China also has a dominant share (95%) in worldwide production of rare earths44 and reserves (30%), as well as a big market share in rare metals production45. These mineral resources are crucial for successful energy transition and digital revolutions as they are key elements for magnets, EVs, electric batteries, wind turbines, nuclear reactors, smartphones, computers, consumer electronics, and so on. China is thus in a strategic position regarding energy transition and
commodities. Additionally, it is implementing an acquisition policy outside China. For example, in 2017 HP Mine Operations LLC (a Chinese-led consortium) acquired Mountain Pass, the sole U.S. rare earth mine in California. This is still being fought over by
42 NRC: Nuclear Regulatory Commission
43 According to Urgewald a Berlin based environmental group.
44 Rare earth are 17 elements used in sectors like renewable energy, telecommunication and defense
45 Guillaume Pitron, La guerre des Métaix, 2018

15
46 World Economic forum
politicians and Non-Governmental Organization (NGOs.)
these minerals is very polluting and
Western countries have left these operations to Chinese companies, reinforcing the country’s strategic position. Having acknowledged China’s dominant position, the West, and in particular the U.S., Japan and the EU, could implement long-term security of supply policies by looking for new types of reserves (in the oceans for example) and by encouraging innovation to replace rare minerals in critical equipment with more common resources.
• Big investor in energy companies: For more than a decade China has deployed an aggressive acquisition policy (notably in oil reserves)
America and Asia. In Europe it is now acquiring or taking a stake in energy-related companies: on a
State Grid of China Corporation (SGCC, the second largest grid company in China) bought stakes in the grids of Greece, Italy, Portugal and Spain. From southern Europe SGCC is moving to Germany where,
a 20% stake in the regional grid company 50 Hertz. In Portugal, CTG (China Three Gorges) which already has a 23% stake in EDP (Energias de Portugal)
more than 50%.
Chinese investment project is not only targeting road and rail infrastructures but also electricity and gas ones. It is also a commercial tool for China to establish a leading position in the European energy market.
The digital revolution is accelerating
General considerations
In looking to the future, one needs to be humble in regard to earlier, unanticipated rapid technology evolution and remember that the Web was launched in 1990, Google was created in 1998, and the iPhone came on the market in 2007. The digital revolution is accelerating thanks to technology progress and consequent economic gains. On the one hand, individuals are quickly adopting these new digital enabled services but on the other hand, their fears relating to job losses or transformation are slowing down digital deployment. Cybersecurity is and will remain a big concern.
• Technology: ■ Web access will become a commodity for all individuals (in 2016 around 50% of the world population had internet access) and corporations worldwide.
■ The Internet of Things (IoT) will continue to evolve. There were 500 million connected objects in 2005, more than 8 billion in 2017 and it’s likely there will be 100 times more in 203046. The two limitations are probably cybersecurity constraints and
attention).
■ Visual interaction with a screen will be progressively replaced by smart interaction using voice. For example, Amazon’s Alexa has sold
2014 launch.
■
Intelligence, able to reproduce learned human strategies and to converse on simple things in natural language, will be
implemented in an increasing number of processes.
■
such as block chain will be progressively adopted. As an example, E.ON and Enel
capacities via block chain in October 2017. In the gas market, a transaction was carried out using the same system between Wien Energie and Neas for a “day-ahead” contract in Germany.
• Economic gains: Digital adoption has huge potential
to decrease costs in the industry and service sectors. These productivity gains are limited by slow adoption in organizations changes, in streamlining internal processes and in recruiting or developing the required skills. However, digital-related usage is increasing quickly, creating new revenue that could progressively become a company’s main revenue streams.
• Human factor:
private life and at work: ■ Private life: all over the world, numerous start-ups are developing thousands of new digitally enabled appliances and services from simple things such as connected keys to collaborative services such as
■ In the working space, digital transformation will impact on nearly all jobs in all sectors; it’s estimated that around 400
worldwide. While it is unclear whether there will be net job losses, some jobs will disappear or be fundamentally transformed, notably those associated with manual and repetitive tasks. Will organizations be able to reskill
Edito
rial

16 A Strategic Overview of the Global Energy Markets
June 2018, EDF, Dassault Systèmes and Capgemini signed a long-term partnership agreement for the digital transformation of EDF’s nuclear engineering and its ecosystem. It aims to support EDF in the digitalization of its plant engineering projects with a view to strengthening plant performance and overall competitiveness of nuclear power.
• Operations/Networks and Smart grids: grids are strongly impacted by the increased share of intermittent renewables. Their irregularity can be mitigated by applying AI to historical meteorological data enabling, for example, more accurate forecasting of wind power.
from digitization, for example in predictive maintenance or
• Services: in Western countries, the home monitoring service market is expanding with a growing share of interactive services (in the U.S. it reached 44% in 201748). Utilities are trying to capture parts of this market, but Amazon and Google are also increasing their presence by investing billions of dollars in acquisitions: for example, Google has acquired Nest, and Amazon has acquired the video doorbell company Ring. It is in these new digital related service markets that GAFAM are becoming Utilities’ competitors.
• Business model transformation: in the Utilities sector as in many others, this area is less mature, except for medium size Utilities such as Eneco (in the Netherlands), which has transformed its business model to become a service provider. Historical players, like Centrica, Enel, Engie, E.ON or EDF
are also focusing on new service-based business models49.
• Digitization progression started with the customer experience and is now focusing on digital operations and new business models. The slow pace of change, lack of
weakness, and scale-up challenges are the main obstacles Utilities have to overcome in order to reap
Cybersecurity
According to Capgemini’s March 18 The Automation Advantage
from innovation (such as moving to the cloud and automating IT infrastructure) due to concern about cybersecurity.
While cyberattacks impact on all sectors, certain strategic sectors such as energy are particularly targeted.
These risks are increased by:
• SCADA50 systems, which have a complex architecture and are
used in grid management to facilitate renewables intermittency and generation decentralization
• IoT, which enables smart homes
increases, and data capture, is not yet secure
• Cloud services increase usage, and open data could make the services that they support vulnerable
• Cyberattacks have already impacted on all segments of the Utilities value chain: generation with the cyber control of a dam near New York in 2013; transmission with the Ukrainian grid attacks in 2015 and 2016; and customer relations with smart
47 GDPR: General Data Protection Regulation
48 Paks Associates
49 Utilities’ New Business Models: As-a-Service Breaking Through. IDC white paper, July 2018
50 SCADA: Supervisory Control and Data Acquisition
those employees, whose jobs are fated to be replaced by robots or chat bots, to other functions?
• Regulations: protecting personal privacy is a key request from digital players, hence the new European regulation on personal data protection (GDPR47). In 2018,
internal work streams (on processes and IT systems) in order to meet the May 2018 GDPR implementation deadline.
Utilities’ digital transformation
All segments of the value chain are impacted by digital transformation:
• Client relationships: utilities as
services providers have numerous clients. Digital operations will
savings. A lot of progress has already been made thanks to digitally enabled interaction to improve the customer experience. However, this transformation is slowed down by human factors. For example, replacing certain
will threaten low-skilled jobs. This means that Utilities have in parallel to launch training programs to enable these workers to do more
from handling inbound client calls to outbound calls that are more complex.
• Operations/Generation: many operational processes in maintenance, inspections or quality control can be digitized using, for example, camera images and
(AI) to the collected data. In nuclear generation, also, digital technology usage is growing: in

17
meter data hacking in 2014. New regulations in some countries, such as France, have been adopted in order to protect assets in sectors of vital importance. For example, electricity operators have to implement total segregation between Advanced Metering Infrastructure and the SCADA grid management system.
This regulation does not prevent Utilities deploying their digital transformation but it increases the projects’ duration and costs.
ConclusionIn the last few years, the
worldwide economy has been growing steadily pushing up energy consumption. This growth in demand combined with geopolitical considerations has pushed oil prices up to US$70-80/bl.
Although oil prices are not forecast to reach 2008 heights (US$150/bl), their present level could slow down the
global economy. Despite progress towards greener energy sources, growth in energy demand is threatening the fragile Paris 2015 Climate Accord. Thus, limiting the global temperature increase to no more than 2% by 2050 now seems extremely ambitious.
Progress in energy transition and the digital revolution is facing
cybercrime or the concentration of rare earth and metals production in China.
Moreover, the present commercial war between the U.S. and China is
energy sector and could endanger current progress in energy transition.
I hope you enjoy reading this second edition of the World Energy Markets Observatory.
Colette Lewiner
Senior Energy Adviser to Capgemini Chairman
Paris, September, 14, 2018
Edito
rial

18 A Strategic Overview of the Global Energy Markets

19
Nort
h Am
eric
aNorth
America

20 A Strategic Overview of the Global Energy Markets
WEMO 2018 North America EditorialPerry Stoneman & Randall Cozzens
Uncertainty has led to mixed outcomes in
action on climate change despite multifaceted initiatives by states, along with declining electricity demand and a generation shift towards clean energy.At the federal level, 2017 marked yet another year of uncertainty, due to the withdrawal from climate change action, especially the US Clean Power Plan. However, state-level initiatives continued to witness an acceleration, aimed at driving future investment in
clean transportation.
In 2017 US$57 billion was invested in clean energy predominantly in wind and solar. In addition to utility investments many corporations, such as Apple and Google who have been vocal in their support for the Clean Power Plan, have declared action on climate control to be a sound business move as well as the moral and environmental imperative, and
clean energy. Overall, if the US is on track to meet the Copenhagen accord target,
of the Paris accord targets, given the current pace of decarbonization.
While emissions in the US continued to fall, the pace of decline slowed from an annual average of 1.3% between 2005 and 2016 to under 1% in 2017. The transition in consumption trends towards less carbon-intensive fuels, along with declining electricity demand, has helped to lower the emissions level since 2005. However, the rise in energy-related CO
2 emissions in other sectors, like transport, buildings and
gains, primarily due to the absence of abatement opportunities.
Likewise, a report from the Auditor General of Canada indicates that most provinces are not on track to meet emission-reduction targets, despite
provinces and territories have targets
for reducing GHG emissions by 2020, and only two are on track to hit those goals with domestic reductions. Meeting Canada’s 2030 target will require
those currently planned or in place.
Energy productivity improved by 2.5% in 2017 contributing to the trend that energy growth is no longer linked to
of natural gas usage, have clearly contributed to this trend. Additionally, alternative energy technologies, which became cost-competitive with conventional generation several years ago, are in some instances approaching a levelized cost of electricity (LCOE) that is at or below the marginal cost of certain conventional generation technologies. Wind LCOE in the US$30-60 range continues the trend of cost competitiveness, followed by solar PV at US$43-53; combined-cycle gas, with a LCOE of US$42-78, is in close competition. This trend is primarily due to falling costs in system components (e.g. panels, inverters, racking, turbines, etc.) and dramatic improvements in
continued to fall in the energy storage market and revenue streams continued to evolve. Cost improvements for lithium-ion modules (particularly lithium-ion deliveries scheduled for post-2019 period) continue to be driven by cost-
and longer life products. Additionally, with this evolution, several forms of potential revenue streams have emerged in selected US markets, driven by state/ISO subsidies and storage-related product design development. Tesla executives have predicted unparalleled growth levels in 2019 of 300-400% for energy storage businesses.
Renewable generation soared an estimated 14.1% year-over-year in 2017, the highest ever one-year surge, with output increasing by approximately 90 TWh. Renewables and natural gas will comprise most of the capacity additions through 2050, and 2018 is expected to be a near-record year with an estimated 12.5 GW of coal power decommissioning,
second only to 2015’s high of 15 GW. The projected mix of electricity generation is
substitution by 2050. Despite sustained and growing cost-competitiveness in certain alternative energy technologies,
to meet baseload generation needs for the foreseeable future, driven primarily by policy uncertainty for the renewables
and concerns relating to grid reliability
witnessed a slump for a consecutive year while remaining strong for wind.
Average retail electricity prices witnessed a modest rise in 2017,
of electricity and driven by milder weather.
US retail electricity sales fell by 80 billion kWh in 2017, the largest drop since the recession in 2009. Aside from factors such as electricity prices, energy
playing a role in the use of electricity in each sector, most of the year-over-year changes in sales were due weather. Consumer spending on electricity fell to of 1.3% of total consumption spending, down from 1.4% in 2016. The share of household expenses on energy costs also drifted near an all-time low, driven primarily by sustained improvements in
cheaper energy sources.
On average, electricity prices are trending upwards, with notable
states of Alaska and Hawaii continue to have the highest residential electricity prices primarily due to higher fuel cost. According to the Energy Information Administration (EIA), natural gas prices are likely to have the highest impact on electricity price through 2050.
According to the Edison Electric Institute, investor-owned utilities and independent transmission developers spent an estimated US$22.9 billion on electricity transmission in 2017, a 10% rise year-over-year. Driving factors included the need to replace and upgrade aging power lines, resiliency

21
planning in response to potential threats (both natural and those caused by people), integration of renewable resources, and congestion reduction.
Revenue across all four of the industry’s primary business segments, i.e., regulated electric, competitive energy, natural gas distribution and natural gas pipeline, were driven primarily by cost control, new electricity rates, and focus on customer base growth.
The natural gas distribution segment experienced the largest revenue growth in both dollar and percentage terms as several natural gas-related acquisitions that closed during 2016 contributed a full year of revenue to 2017.
Electricity suppliers have seen limited
and smartphone-based thermostat apps.
Customer-centricity and innovative
drivers for Canadian utilities, which have focused on seizing growth opportunities while stepping up wholesale operations in export markets.
• Hydro-Québec intends to double its revenue by 2030, with a view to increasing its net income, focusing on three main growth avenues: export markets, investing outside Québec, and commercializing innovations
• BC Hydro focused on its demand-side management portfolio in 2017 and achieved 733 GWh of new incremental electricity savings.
Industry consolidation activity slowed in 2017 from 2016’s fast pace, which was to be expected as utilities navigated and consolidated the 21 deals announced from 2013 through 2016. Deal action in 2017 among regulated utilities included Sempra’s announced acquisition of Oncor, Canadian utility Hydro One’s
buy SCANA.
After a gap of almost 30 years, the corporate income tax rate in the US has been reduced to 21% from 35%. The comprehensive legislation contains
and business taxation but exempts
regulated utilities from key provisions limiting interest deductibility and allowing immediate tax breaks for capital expenditure.
transformation and accelerated disruption, with utilities reacting more aggressively to technological advances. While uncertainty remains, energy and utilities companies must address two seemingly contradictory requirements: the need to innovate and the need to economize.
The growth of renewable energy, innovations in battery storage, growth of electric vehicles, and interactive consumers continue to drive utility transformation. Sustained transformation in electricity generation is being driven by environmental considerations, technological advancements and cost, leading utilities to change their fuel mix and
is becoming an imperative. Although distributed generation currently represents only about 1% of total generation, it is expected that over the next decade distributed generation will account for a much greater market share.
Traditional business models in the utilities sector have been coming under pressure, primarily due to a convergence of factors including technological changes, falling costs of distributed generation and increased competition both within the sector and from new entrants. Market developments behind the meter, including renewable energy technology consumerization, the entry
Amazon, Microsoft) into in the smart home are tempting retail customers to choose new alternative energy solutions. Although an argument can be made as to whether the risk to utilities has been exaggerated, US utilities have been actively exploring ways to retain customers based on value creation in order to avoid the ever-increasing risks.
The rise of prosumers, coupled with ever-present risks from disruptive entrants, has triggered the adoption of a new energy-as-a-service model. Almost four out of 10 utilities believe that within the next three to four years, new products and services will represent 5-9% of total revenue. The
expected to come from electric vehicle (EV) services, generation and storage by householders, and microgrid-as-a-service. However, energy-as-a-service and comfort-as-a-service will likely be the top margin contributors. New technologies for energy storage, like Alevo, Acquion Energy, and Tesla, are changing expectations for residential and utility-scale storage. When tied renewable power generation (e.g. wind and solar), battery at scale could impact the revenue of existing utilities by between US$60-100 billion by 2025. The opposite holds true that utilities can also capitalize on the revenue opportunity associated with microgrid-as-a-service and generation and storage by householders.
North America’s installed base of smart home systems reached 31.2 million by the end of 2016, a surge of 58%, with an estimated 5.4 million multifunction or whole-home systems and 25.8 million
function. An emerging business model at the forefront of this paradigm shift, expected to grow over the next two years, is generation and storage at home (Beroe Inc. 2018).
The fusion of smart mobility and the digital edge are helping utilities remain relevant in today’s connected energy economy. Monetization of customer-generated power and excess battery capacity, along with data valorization and monetization, creates a path to avoiding disintermediation. According to an IDC study, the emerging business models of EV services/infrastructure and microgrid-as-a-service currently rank
potential for revenue growth potential.
Perry Stoneman
EVP, Global Head of Energy & Utilities
Randall Cozzens
EVP, NA Sector Head of Energy & Utilities
Nort
h Am
eric
a

22 A Strategic Overview of the Global Energy Markets
Major energy events (2017 and H1 2018)
2017
Clim
ate
chan
ge
En
erg
ytr
ansi
tio
nC
om
pan
ies
Ele
ctri
city
Gas
Ru
les
Jan Feb March April May June July Aug Sept Oct2017
March 2SDG&E and AES present their 30 MW storage facility
Jan. 30Lightstone Generation acquired 5,200 MW of generation assets from AEP
June 5TransCanada sells U.S. Northeast Power Assets to Helix
March 10Senate informs that Canada will not reach 2030 GHG reduction goal
March 7EIA informs that 2400 km of
since the beginning of 2017
Sep 22General Motors announced purchasing 200 MW of wind energy from wind farms in Ohio and Illinois
Oct 2US DoE requested FERC to subsidize “secure-fuel” power plants within competitive power markets
Sep 28Tampa Electric proposes building 600 MW of solar PV
June 1Trump administration withdraws US from Paris Climate Agreement
Oct 10US EPA proposes repeal of the Clean Power Plan (CPP) and issues a Notice of Proposed Rulemaking (NOPR)
March 31Inauguration of the 400 MW Cimarron Bend windfarm
July 24Hydro One makes a
for Avista
Feb 17Merger of Enbridge and Spectra Energy completed
Feb. 22PJM Interconnection raises US$1.5 billion to increase grid reliability
April 13Joint venture Exelon-JAPCJexel Nuclear
March 7EPA relaxes rules on exploration-production reporting
May 3DoE allows Golden Pass LNG to export LNG

23
Nort
h Am
eric
a
JanDecNov Feb March April May June July20182017 2018
May 7British Columbia unveiled Bill 34, the Greenhouse Gas Reduction Targets Amendment Act, 2018
Jan 24President Donald Trump instituted a
imported crystalline silicon solar modules and cells
FebCongress’ Bipartisan Budget Act, impacted a range of energy incentives
May 31The New York ISO projects a 0.14%-per-year fall in electricity demand from the grid of over the next decade
Dec 18EPA solicits comments on possible successor to CPP (ANOPR)
Jan 31Formation of the Carbon Costs Coalition announced by 9 states
Apr 26Deadline for comments on CPP repeal NOPR
Mar 27Canadian Auditors-Gener-al indicates most provinces not on track to meet emission-reduc-tion targets
Dec 22Congress enacted the Tax Cuts and Jobs Act
Mar 13Sempra completes Oncor takeover for US$18.8 billion
Jul 31SCANA shareholders approve sale to Dominion Energy

24 A Strategic Overview of the Global Energy Markets
The US is on track to meet the Copenhagen
Paris targets
• Electricity demand fell in absolute terms, and coal continued to lose ground to alternative energy.
• As a result of declining electricity demand and the generation shift towards less carbon-intensive fuels, power sector emissions fell by roughly the same amount in 2017 as the 2005-2016 annual average, though less
• However, the rise in energy-related CO2 emissions
power, primarily due to the absence of abatement opportunities.
2017 witnessed continued progress on carbon pricing initiatives at the regional level, and 2018 will be a critical year for implementation
• Many jurisdictions are incorporating phased approaches to plan for changes to the system design.
• The multi-state US Carbon Costs Coalition is focused on reducing carbon emissions, ensuring equity in policy proposals, developing market-based solutions, creating a resilient local economy and improving public health.
• Canada’s Pan-Canadian Framework on Clean Growth
and Climate Change sets national standards for carbon pricing but gives individual provinces considerable latitude in program design and revenue allocation.
As the US federal government retreats on climate change, US cities continue to
the Paris Accord targets
• The EPA has proposed repealing the Clean Power Plan on the grounds that ... it could only work with
to enable compliance.
• Without an alternative to the Obama administration’s climate policy, the EPA is more vulnerable to legal challenges, hence, the uncertainty that looms the climate stance is only slated to aggravate.
A report from the Auditor General of Canada indicates that most provinces are not on track to meet emission-reduction targets
• have targets for reducing GHG emissions by 2020, and only two are on track to hit those goals with domestic reductions.
• Meeting Canada’s 2030 target will require substantial
place.
1-Climate Challenges & Regulatory Policies
Energy-related emissions: While emissions in the US continued to fall, the pace of decline slowed from an annual average of 1.3% between 2005 and 2016 to under 1% in 2017
US energy-related CO2 emissions declined by 14% from 2005 to 2017, driven primarily by growth in less carbon-intensive natural gas consumption
• From 2005 to 2017, coal and petroleum-related CO2 emissions declined by 39% and 11% respectively; natural gas emissions, however, increased by 24%.
• The transition in consumption trends towards less carbon-intensive fuels has helped to lower emissions levels since 2005.
Despite this trend, the pace of decline has slowed
• Between 2005 and 2016, energy-related CO2 emissions in the US fell by 13.4%, an average annual decline of 1.3% due to a combination of slower energy demand growth and fuel switching from coal to natural gas and renewables.
• Almost 80% of the reduction in energy-related CO2 emissions in the US came from the electric power sector.
•
lower-carbon natural gas and zero-carbon renewables.
The growth in decline was reportedly half the 2005-2016 average rate.
• Power sector emissions continued to decline, but emissions from the transport, buildings and industrial sectors all grew,
Figure 1.1. US - Energy-related CO2 Emissions - Evolution since 2005 (million metric tons)
2005(Reference Year)
2010 2015 2016 2017
5,992
5,591
-7% -12% -13% -14%
-0.9% (year-on-year)
5,2745,188 5,140
4,600
4,800
5,000
5,200
5,400
5,600
5,800
6,000
6,200
Mill
ion
met
ric
tons
of
CO
2
Change since 2005 Change since 2005 Change since 2005 Change since 2005
Source: US EIA, Monthly Energy Review (May 2018)

25
Nort
h Am
eric
a
The US still short of Paris Accord
• 2 or other GHG emissions, sustaining the recent decline in energy-related CO2 emissions for the next three years should be
17% reduction below 2005 levels by 2020.
• However, the current pace of decarbonization will still leave the US considerably short of its Paris Agreement pledge of a 26-28% reduction from 2005 levels by 2025.
• A 1.7-2.0% average annual reduction in energy-related CO2 emissions is required over the next eight years to meet that target, assuming no changes in other gasses.
With the continued relaxation of federal-level policies, especially the Clean Power Plan, state and city-level climate and clean energy policy developments become more critical
• For two years running, transportation emissions exceeded power generation emissions, amid a surge in vehicle usage in the US post recession, coupled with minimal progress on fuel economy.
•
of the emissions decline from falling coal use in the electric power sector.
• A notable dissimilarity relative to previous years has been that both natural gas and coal generation declined year-on-year, displaced by growth in hydro, wind and solar generation.
Energy-related Emissions - Projected US emissions mirror the trends in energy consumption, with natural gas and renewables driving the greatest impact
Over the forecast period till 2050, energy-related CO2 emissions from the industrial sector exhibit the highest growth
Industrial sector
• Natural gas has the largest share of both energy and CO2 emissions in the industrial sector throughout the projection period, driving a 0.6% annual emissions growth from 2017-2050, on both an absolute and a relative basis.
• The relatively low cost of natural gas leads to further increases in usage and emissions.
Electric power sector
• The projected CO2
through 2050, resulting from favorable market conditions for natural gas and supportive policies for renewables compared with coal.
Commercial sector
• Projected emissions growth rate of 0.1% annually over 2017-2050 is likely to be driven by higher energy use in the sector,
Residential sector
• energy storage, are likely to result in a 0.2% annual decline in emissions over the projection period.
Transportation sector
• Along with the residential sector, the transportation sector is also projected to witness a 0.2% annual decline in emissions over the projection period, driven primarily by a surge in fuel economy standards, tempering growth in motor gasoline consumption.
Figure 1.2. US - Energy-related CO2 Emissions by Sector, 2005-2050 (million metric tons)
0
500
1,000
1,500
2,000
2,500
3,000
Mill
ion
l/c
met
ric
tons
of
CO
2
2005 2010 2015 2020 2025 2030 2035 2040 2045 2050
Re
fere
nce
Ye
ar ~
201
7
Transportation Electric Power Industrial Residential Commercial
Source: US EIA Annual Energy Outlook, 2018

26 A Strategic Overview of the Global Energy Markets
By 2046-2050, the annual domain-average transportation emissions of other GHGs are projected to decrease in continental US
• Decreases in gaseous emissions are mainly due to reduced emissions from on-road vehicles and non-road engines, which
exhibit geographical and seasonal variations across the US.
• The on-road vehicle emissions dominate the emission changes.
Emissions from the electricity sector plummeted, allowing transportation to retain its place as the largest-emitting sector for the second year in a row.
The power sector continued to drive the economy’s decarbonization, on the back of declining load and greater renewable generation, rather than coal-to-gas switching, a primary driver of 2016’s 5.8% downturn.
Energy-related Emissions - The US federal government continues to relax environmental policies; uncertainty looms around the Clean Power Plan (CPP)According to the US Energy Information Administration (EIA)’s Annual Energy Outlook 2018, the
2 emissions is now less compared to the 2017 outlook, driven by
• lower natural gas prices, and lower electricity demand has caused a reduction in the projected CO2 emissions from electric generators.
• In 2020, the projected electric power sector CO2 emissions are 1.72 billion metric tons, which is 120 million metric tons (7%) lower than the projected level of CO2 emissions in the 2017 outlook without the CPP.
• By 2030, most of the additional planned coal unit retirements are expected to have occurred, and in the absence of the CPP, projected CO2 emissions are likely to stabilize at about 1.71 billion metric tons, which is 143 million metric tons (8%) below the 2017 outlook without the CPP for that year.
• Over the long term, higher renewables growth would result in electric power sector emissions growing at a slower rate, reaching 1.78 billion metric tons in 2050, which is 242 million metric tons (12%) below the level for that year without the CPP.
Figure 1.3. US - Electricity-related CO2 Emissions - with or without Clean Power Plan (CPP), 2000-2050 (million metric tons)
1,400
1,600
1,800
2,000
2,200
2,400
2,600
Mill
ion
me
tric
to
ns o
f C
O2
2000 2010 2020 2030 2040 2050
Re
fere
nce
Ye
ar ~
201
7
2017-2050 ~ +12.99%
2017-2050 ~ -13.43%
Projection Reference ~ EIA Annual Energy Outlook 2017
Projection Reference ~ EIA Annual Energy Outlook 2018
Historical (2000-2017) Without Clean Power Plan With Clean Power Plan
1,400
1,600
1,800
2,000
2,200
2,400
2,600
2000 2010 2020 2030 2040 2050
Mill
ion
Me
tric
To
ns o
f C
O2
Re
fere
nce
Ye
ar ~
201
7
2017-2050 ~ +0.96%
2017-2050 ~ -13.38%
Historical (2000-2017) Without Clean Power Plan With Clean Power Plan
Source: US EIA, Annual Energy Outlook 2018

27
Nort
h Am
eric
aAs the US federal government retreats on climate change, US cities continue to accelerate climate
• change poses a growing threat, President Donald Trump’s infrastructure plan makes no mention of the need to build in resilience to rising global temperatures.
• Instead, it actually seeks to weaken environmental reviews
as a way of speeding up the infrastructure permit process, contradicting the priorities of many local leaders who view climate change as a growing concern.
• According to Boston University’s ‘Menino Survey of Mayors’, conducted in the summer of 2017 on a representative sample of 115 US mayors, two-thirds agreed that cities should play
Debate over the appropriacy of the repeal continues, as environmental organizations and some states
and replacement activity
• The EPA’s regulatory impact analysis indicates a divergence
supporting the CPP:
–
–from deduction in non-carbon emissions, i.e. particulate matter and ozone) because of data gaps and uncertainty in
–
• The EPA estimates that the adjustments add up to US$33 billion in costs to be avoided vs. the Obama administration’s EPA calculations of US$8.4 billion.
• The Trump administration has drafted a new proposal to regulate CO2
the Obama administration:
– The federal government has essentially accepted, for now, that it is legally obligated to address GHGs that cause global warming, even though President Trump has dismissed established climate science
– However, the new proposal is likely to result in only small tweaks to the nation’s energy system
– The new proposal, according to industry attorneys familiar with the plan, would recommend regulating the emissions of individual coal plants, which would call for modest
• Any successor rule that gives states too much discretion under a federal standard, is likely to face a backlash from CPP supporters.
• Industry observers believe that the EPA hopes to complete the ‘repeal and replace’ by the end of 2018, so that the current administration can fully litigate and defend them
The Obama-administration’s CPP aimed to cut emissions from the nation’s power plants to roughly 32% below 2005 levels by 2030. But as market forces have pushed hundreds of coal plants into retirement, and as wind and solar power have become cheaper, many states are now on track to exceed those initial targets even in the absence of federal regulation. As a result, many environmentalists contend that the original rules were too weak, not too aggressive.
On October 10, 2017, following a review as directed by President Trump’s Energy Independence Executive Order, the US Environmental Protection Agency (EPA) proposed repealing the CPP, estimating up to US$33 billion dollars in avoided compliance costs by 2030
• to permit compliance.
• The CPP had been embroiled in litigation (e.g. West Virginia vs. EPA) and the federal government has been facing a backlash from environmental groups, corporations and pro climate change state-level administrations, coupled with ethics controversies.
• Mirroring national opinion, state-level views on climate change and environmental policy are sharply divided.

28 A Strategic Overview of the Global Energy Markets
citing ‘climate stance an upright business move along with a moral and environmental imperative
In April 2018, Apple Inc. pushed back against the EPA’s proposal to repeal the CPP, arguing that scrapping the policy, which calls for cutting power plant pollution, would dull the US’ competitive edge in the clean energy economy
In 2013, Apple hired former EPA administrator Lisa Jackson as VP of environment, policy, and social initiatives, indicating
Apple has run on 100% green energy, all produced by the company itself. In addition, Apple has convinced 23 companies in its supply chain to sign a pledge to get to 100% renewable energy for the portion of their business relating to Apple products. Over the last six years, that has involved
sources, such as solar and wind farms, near the company’s facilities. Apple now has 25 operational renewable energy projects, with 15 more now in construction in 11 countries. Just eight years ago, only 16% of its facilities were powered by renewable energy. By 2015 that number had increased to 93%, then to 96% in 2016. The company has reduced GHG emissions (CO
2e) by 58% since 2011, preventing 2.2 million metric tons of CO2e. Additionally, Apple has been consistent
associated with actual energy. With over US$285 billion in cash reserves, the company continues to target even the smallest facilities, and the monumental achievement indicates its seriousness.
EPA’s proposal to repeal the CPPOpponents argued that the plan was an example of federal overreach:
• Apple’s response cites the economic advantages of supporting clean energy, including that it provides corporate electricity buyers with a hedge against fuel price
like the price of oil.
• It also notes that China is currently beating the US in clean energy investments.
• According to Apple, regulating the grid’s carbon emissions
• Apple cites its own experiences operating with 100% renewable energy in the US and the work of its subsidiary, Apple Energy LLC, which sells the excess electricity the company generates back to the grid.
– “The electricity system is far too interconnected, so regulation should consider the dynamic and interconnected nature of how power is generated, sold and consumed.” – Apple.
Google joined Apple in a growing chorus of corporations coming out in support of the CPP
• Google cites both environmental and economic fallout, should the policy be repealed.
– “Wind and solar deployment, as well as the associated supply chains, have been among the fastest-growing sectors of the US economy in recent years, with job
the overall labor force.” – Google.
• The company also notes its own personal interest in supporting the policy, citing its work to shift toward renewable energy, along with the CPP’s potential to drive job growth.
– “The Clean Power Plan can continue to drive innovation and job growth, while spurring the modernization of the American electricity system and reducing carbon dioxide emissions and helping to mitigate the threat of global climate change.” – Google.
Apple and Google support the CPP, which provides a nationwide framework for regulating electricity generation!

29
Nort
h Am
eric
a
Energy-related emissions: Disagreeing with the federal stance on climate action, US Climate Alliance state-level initiatives continue to drive a multifaceted approach to address GHG emissions
Independent analysis highlighted in the Alliance’s 2017 Annual Report shows that Alliance states are not only outpacing non-Alliance states in reducing their emissions, they are also growing their economies at a faster pace
• Besides capping pollution from cars, trucks and power plants, states intend to change the way power is bought and sold,
most dangerous GHGs, and soak up carbon already lingering in the atmosphere.
The Alliance’s 2018 Strategy lays out four key focus areas:1. Accelerate the implementation of Alliance State climate
priorities and ambitions
2. Strengthen business opportunities and job creation in the low-carbon economy
3. Scale up climate action domestically and internationally
4. Communicate climate action by the Alliance and others, both domestically and abroad, to demonstrate and inspire continued leadership.
Slate of new cross-cutting initiatives
• GHG Inventories And Projections
– Cooperation to improve GHG inventories and projections in order to strengthen policymaking and track and report progress towards climate targets.
• Climate clearinghouse
– Facilitating data-driven coordination, building a climate clearinghouse – an online platform that aggregates state-
by policymakers and the public.
• International engagement
– Working across borders to share best practices and further drive down emissions, including regional initiatives such as the North America Climate Leadership Dialogue.
The Alliance is demonstrating that climate leadership and economic growth go hand-in-hand
• Climate and clean energy policies in Alliance states have attracted billions of dollars of new investment and helped create more than 1.3 million clean energy jobs, nearly half the US total.
• Not only are states taking climate change seriously, they understand that it is a complex issue that requires a multifaceted response.
Figure 1.4. US - Climate Stance Update - 2017 (US Climate Alliance)
US Climate Alliance: Subnational Coalition (not legally binding)A bipartisan coalition of 17 governors committed to reducing GHG emissions consistent with the goals of the Paris Agreement and meeting or exceeding the targets of the federal Clean Power Plan
Alliance states reduced emissions by 15% between 2005 and 2015, compared to 10% for other states, while the economies grew faster than the rest of the country
WA
CA
MN
NY
VT
MA
CT
RI
DE
VA
NC
HI
PR
MD
NJ
OR
CO
Members Joined
California 01/06/17
New York 01/06/17
Washington 01/06/17
Connecticut 02/06/17
Rhode Island 02/06/17
Massachusetts 02/06/17
Vermont 02/06/17
Oregon 02/06/17
Hawaii 02/06/17
Virginia 05/06/17
Minnesota 05/06/17
Delaware 05/06/17
Puerto Rico 05/06/17
Colorado 11/06/17
North Carolina 02/09/17
Maryland 10/01/18
New Jersey 21/02/18
$9.0 trillion in GDP
~40% of US Population
1.3 million Clean Energy Jobs
Represents
Target~26-28% reduction in GHG emissions below 2005 levels by 2025To accelerate climate action in 2018
15%
14%
10%
12%
GHG Emissions GDP
Change in net GHG Emissions and Economic Output, 2005 to 2015
Alliance Other States
Source: US Climate Alliance

30 A Strategic Overview of the Global Energy Markets
Target the most potent of GHGs
• Plan to draw down the use of hydro
GHGs, like methane, which is known to leak from natural gas drilling sites, as well as
– California is already leading on hydro
providing a model for other states.
standards
•
consumer products not already covered by federal regulations.
– States are aiming to issue a uniform set of standards to make it easier for businesses to comply.
• new wind and solar plants, develop a green bank that might fund a small, risky project that will later attract the attention of a commercial investor.
– Alliance is working to develop new green banks linked to the New York Green Bank, raising more than US$1 billion to be invested in projects in other states.
Modernize power grids
• Develop a playbook to guide regulators and utilities on how to integrate renewables into the power grid.
Make solar power cheaper
• Simplify the permit process, countering the Trump
Clean up the transportation sector
• New or expanded tax credits for low-emissions vehicles and more charging stations.
Build resilient infrastructure
• Plan infrastructure projects, taking into account future risks from climate change, and use low-carbon materials.
achieve the goal of meeting the share of the US emission reduction targets under the Paris
• According to Rhodium Group’s multifaceted energy-economic model, the Alliance states will continue to lead the nation in reducing GHG emissions and are set to meet their share of the US emissions reduction target.
• Under current policies, Alliance states are projected to achieve a combined 24-29% reduction below 2005 levels by 2025.
• The Alliance is squarely on track, irrespective of federal inaction, while continuing to grow the economies and drive job creation.
Energy-related emissions: US Alliance states continue to strengthen stance with holistic initiatives
The policies adopted, coupled with the initiatives planned, will continue to attract new jobs and
simultaneously driving down GHG emissions
Figure 1.5. US - US Climate Alliance Forecast - Net GHG Emissions, 2005-2025 (million metric tons)
2005 2010 2015 2020 2025
900
950
1000
1050
1100
1150
1200
1250
1300
1350
1400
1450
Ne
t G
HG
Em
issi
ons
, Mill
ion
Me
tric
To
ns C
O2e
Goal Range: 26-28% below 2005 levels
Alliance States: On track for a 24-29% reductionRef
eren
ce Y
ear
~ 20
15
Source: US Climate Alliance 2017

31
Nort
h Am
eric
a
Energy-related Emissions - Despite wide-ranging initiatives, Canada is likely to miss its Paris Agreement (NDC) targetA report from the Auditor General of Canada indicates that most provinces are not on track to meet emissions-reduction targets
targets for reducing GHG emissions by 2020, and only two are on track to hit those goals with domestic reductions
• New Brunswick and Nova Scotia have climate targets for 2020 that they are likely to achieve through domestic action, while Ontario is relying on a cap-and-trade system that includes emissions reductions from outside the province.
• Besides imposing a federal carbon tax, the federal and provincial governments are also pursuing a host of other
buildings, and policies aimed at reducing reliance on gasoline and diesel in transportation.
Correlating emissions with fossil fuel consumption, Canada’s National Energy Board (NEB) has presented a declining trend in the estimated weighted-average GHG emissions intensity of fossil fuel consumption
• While total fossil fuel consumption is expected to grow, a changing fuel mix leads to declining GHGs per unit of fossil fuel energy used.
• Growth in natural gas, coupled with a steep drop in coal, results in GHG intensity declining by 7.5% from 2016 to 2040, or 14% from 2005 to 2040.
• Capturing carbon from facilities that employ CCS technology
also reduces the GHG intensity of fossil fuel use.
• Accounting for reductions in non-combustion emissions, such as reducing methane leaks, as well as including emission credits purchased through international trading mechanisms (such as Ontario and Quebec’s emission trading with California, could further decrease emissions intensity.
• However, uncertainty around future climate policies and technology development could impact on fossil fuel combustion-related GHG emission results.
On the basis of current federal, provincial, and territorial policies and actions, Canada is not expected to meet its 2030 target for reducing GHG emissions
• and actions beyond those currently planned or in place.
• Despite the presence of a federal goal that relies in part on provincial action, nine of 13 provinces and territories have no GHG targets for 2030, including Alberta, British Columbia, and Newfoundland and Labrador.
• The federal government is expected to introduce legislation to establish a federal “backstop” that would impose a carbon tax in provinces that refuse to establish their own levy or cap-and-trade policy, or that fail to meet federal standards for their system.
• However, the federal carbon tax plan is vigorously opposed by the Saskatchewan government and conservative opposition parties in Ontario and Alberta, where elections loom.
Figure 1.6. Canada - Estimated Weighted-Average GHG Emission Intensity of Fossil Fuel Consumption (Grams CO2 per Megajoule)
2005 2006 2007 2008 2009 2010 2011 2012 2013 2014 2015 2016 2017 2018 2019 2020 2021 2022 2023 2024 2025 2026 2027 2028 2029 2030 2031 2032 2033 2034 2035 2036 2037 2038 2039 2040
50
52
54
56
58
60
62
64
66
68
70
Gra
ms
CO
2 per
Meg
ajo
ule
Ref
eren
ce Y
ear
~ 20
17
Reference Case: Carbon Price of US$50/ton from 2022 to 2040High Carbon Price (HCP) Case: Carbon Price steadily increasing from 2022 to 2040
Reference Case High Carbon Price (HCP) Case
Source: NEB (October 2017)
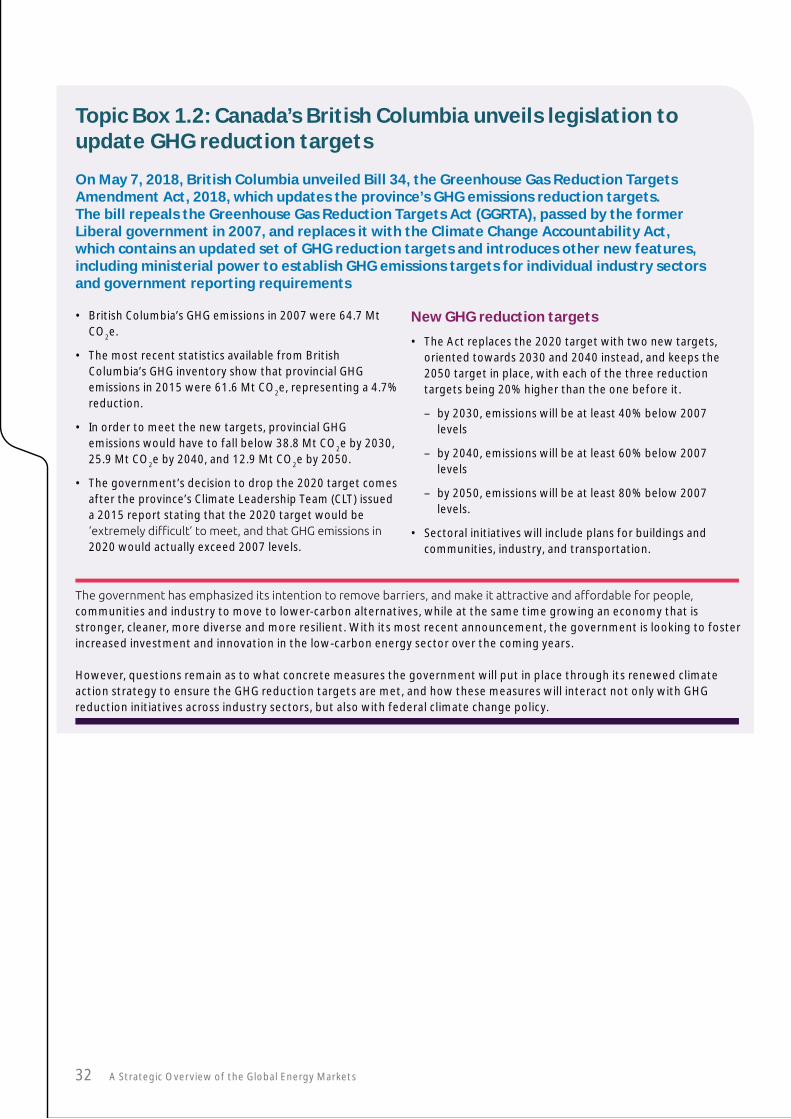
32 A Strategic Overview of the Global Energy Markets
Topic Box 1.2: Canada’s British Columbia unveils legislation to update GHG reduction targets
On May 7, 2018, British Columbia unveiled Bill 34, the Greenhouse Gas Reduction Targets Amendment Act, 2018, which updates the province’s GHG emissions reduction targets. The bill repeals the Greenhouse Gas Reduction Targets Act (GGRTA), passed by the former Liberal government in 2007, and replaces it with the Climate Change Accountability Act, which contains an updated set of GHG reduction targets and introduces other new features, including ministerial power to establish GHG emissions targets for individual industry sectors and government reporting requirements
• British Columbia’s GHG emissions in 2007 were 64.7 Mt CO2e.
• The most recent statistics available from British Columbia’s GHG inventory show that provincial GHG emissions in 2015 were 61.6 Mt CO2e, representing a 4.7% reduction.
• In order to meet the new targets, provincial GHG emissions would have to fall below 38.8 Mt CO2e by 2030, 25.9 Mt CO2e by 2040, and 12.9 Mt CO2e by 2050.
• The government’s decision to drop the 2020 target comes after the province’s Climate Leadership Team (CLT) issued a 2015 report stating that the 2020 target would be
2020 would actually exceed 2007 levels.
New GHG reduction targets
• The Act replaces the 2020 target with two new targets, oriented towards 2030 and 2040 instead, and keeps the 2050 target in place, with each of the three reduction targets being 20% higher than the one before it.
– by 2030, emissions will be at least 40% below 2007 levels
– by 2040, emissions will be at least 60% below 2007 levels
– by 2050, emissions will be at least 80% below 2007 levels.
• Sectoral initiatives will include plans for buildings and communities, industry, and transportation.
communities and industry to move to lower-carbon alternatives, while at the same time growing an economy that is stronger, cleaner, more diverse and more resilient. With its most recent announcement, the government is looking to foster increased investment and innovation in the low-carbon energy sector over the coming years.
However, questions remain as to what concrete measures the government will put in place through its renewed climate action strategy to ensure the GHG reduction targets are met, and how these measures will interact not only with GHG reduction initiatives across industry sectors, but also with federal climate change policy.

33
Nort
h Am
eric
a
Carbon pricing: The recent developments in carbon pricing initiatives were seen across North America, with newly implemented carbon pricing initiatives in 2017-2018
Summary of selected changes in regional, national and subnational carbon pricing initiatives in 2017-2018
• Initiatives implemented in 2017: Alberta (carbon tax), Ontario (ETS) and Washington (CAR)
• Initiatives implemented in 2018: Massachusetts (ETS)
• New initiatives under consideration: Côte d’Ivoire, Manitoba (Canada), Saskatchewan (Canada)
• Initiatives under consideration with new developments: New Brunswick (Canada), Nova Scotia (Canada).
Highlights for 2017-2018
• A carbon tax in Alberta, covering all GHG emissions from combustion that are not covered by its baseline-and-credit ETS for large emitters.
• An ETS in Ontario, covering GHG emissions from industry, electricity generators and importers, natural gas distributors and fuel suppliers.
• The Clean Air Rule in Washington State, establishing a baseline-and-credit system which initially covers fuel distributors and industrial companies that are not considered to be energy intensive nor trade exposed.
• An ETS in Massachusetts for power plants; power plants in the state will also continue to be subject to the Regional Greenhouse Gas Initiative.
Many jurisdictions are incorporating phased approaches to plan for changes to the system designThe implementation of carbon pricing initiatives often brings challenges, including capacity and infrastructure concerns.
To address these challenges, many initiatives include phased approaches to plan for adjustments to the system design.
California is proposing to modify components of its ETS design for the post-2020 phases, including the allocation approach and the establishment of a price ceiling.
Carbon pricing continues to gain traction
• Technological evolution is taking place, with innovative tools presenting a new frontier for carbon pricing.
• Emerging digital innovations in data gathering (satellite and sensors) and processing allow for applications in areas such as air pollution and GHG monitoring.
•
compatible and extensible methods and rules, big data, blockchain, the internet of things (e.g. smart meters), smart contracts1 and other disruptive technologies hold out the promise of addressing the needs of a new generation of carbon markets post-2020.
1 A “smart contract” refers to transactional terms and conditions embedded in computer code which allow automatic execution of the relevant transaction once precise conformity with those terms and conditions has been established
Figure 1.7. Summary Regional Carbon Pricing Initiatives (ETS and Carbon Tax) - (implemented, scheduled for implementation and under consideration) and Sectoral Coverage
Saskatchewan
Alberta
British Columbia
Washington
Oregon
California
Mexico
Manitoba
Ontario
Québec
Newfoundland and Labrador
New Brunswick
Nova Scotia
RGGI
Massachusetts
Virginia Industry
Power
Transport
Buildings
Waste
All Fossil Fuels
Solid Fossil Fuels
Liquid Fossil Fuels
ETS implemented or scheduled for implementation
Legend
ETS or Carbon Tax under consideration
ETS and Carbon Tax implemented or scheduled
Carbon Tax implemented or scheduled, ETS under consideration
Prince Edward Island
Northwest Territories
Source: State and Trends of Carbon Pricing, 2018, World Bank (May 2018)
2017 witnessed continued progress on carbon pricing initiatives at the regional level, and 2018 will be a critical year for implementing international carbon pricing mechanisms
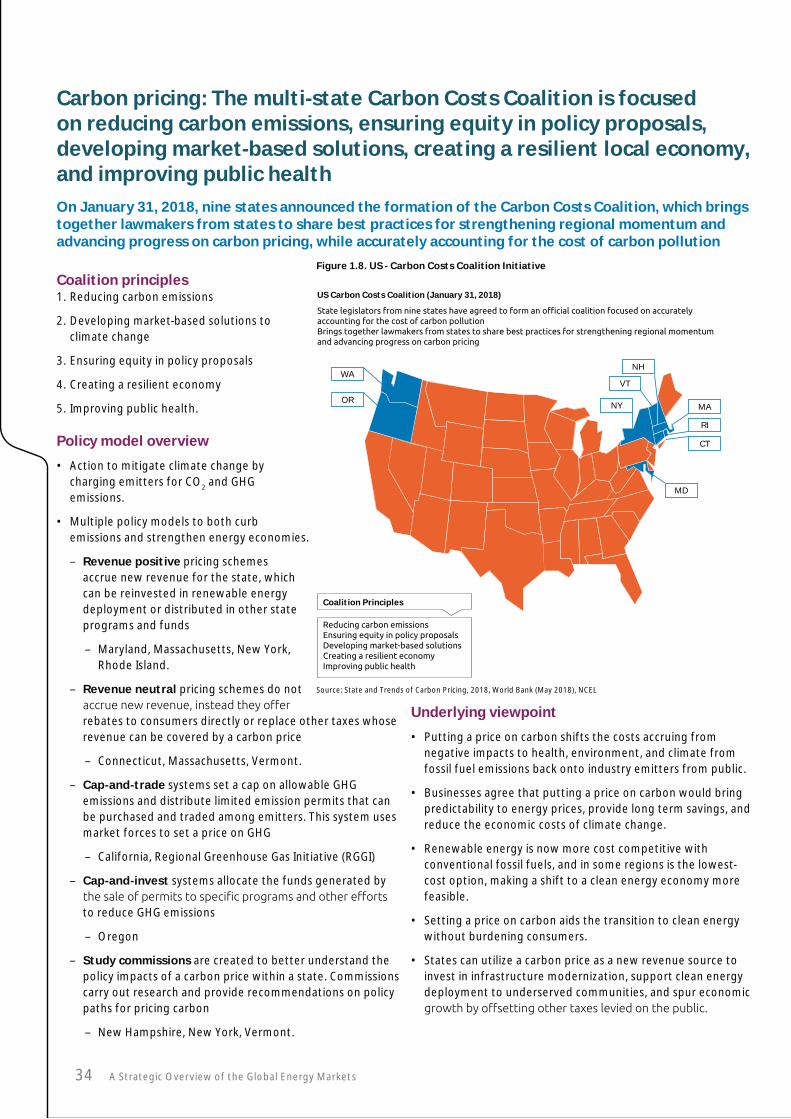
34 A Strategic Overview of the Global Energy Markets
Carbon pricing: The multi-state Carbon Costs Coalition is focused on reducing carbon emissions, ensuring equity in policy proposals, developing market-based solutions, creating a resilient local economy, and improving public healthOn January 31, 2018, nine states announced the formation of the Carbon Costs Coalition, which brings together lawmakers from states to share best practices for strengthening regional momentum and advancing progress on carbon pricing, while accurately accounting for the cost of carbon pollution
Coalition principles1. Reducing carbon emissions
2. Developing market-based solutions to climate change
3. Ensuring equity in policy proposals
4. Creating a resilient economy
5. Improving public health.
Policy model overview
• Action to mitigate climate change by charging emitters for CO2 and GHG emissions.
• Multiple policy models to both curb emissions and strengthen energy economies.
– Revenue positive pricing schemes accrue new revenue for the state, which can be reinvested in renewable energy deployment or distributed in other state programs and funds
– Maryland, Massachusetts, New York, Rhode Island.
– Revenue neutral pricing schemes do not
rebates to consumers directly or replace other taxes whose revenue can be covered by a carbon price
– Connecticut, Massachusetts, Vermont.
– Cap-and-trade systems set a cap on allowable GHG emissions and distribute limited emission permits that can be purchased and traded among emitters. This system uses market forces to set a price on GHG
– California, Regional Greenhouse Gas Initiative (RGGI)
– Cap-and-invest systems allocate the funds generated by
to reduce GHG emissions
– Oregon
– Study commissions are created to better understand the policy impacts of a carbon price within a state. Commissions carry out research and provide recommendations on policy paths for pricing carbon
– New Hampshire, New York, Vermont.
Underlying viewpoint
• Putting a price on carbon shifts the costs accruing from negative impacts to health, environment, and climate from fossil fuel emissions back onto industry emitters from public.
• Businesses agree that putting a price on carbon would bring predictability to energy prices, provide long term savings, and reduce the economic costs of climate change.
• Renewable energy is now more cost competitive with conventional fossil fuels, and in some regions is the lowest-cost option, making a shift to a clean energy economy more feasible.
• Setting a price on carbon aids the transition to clean energy without burdening consumers.
• States can utilize a carbon price as a new revenue source to invest in infrastructure modernization, support clean energy deployment to underserved communities, and spur economic
Figure 1.8. US - Carbon Costs Coalition Initiative
WA
OR
NH
MA
CT
NY
MD
RI
VT
US Carbon Costs Coalition (January 31, 2018)
Coalition Principles
Source: State and Trends of Carbon Pricing, 2018, World Bank (May 2018), NCEL

35
Nort
h Am
eric
a
Current legislation in each state under the Carbon Costs Coalition
State Current Legislation
Connecticut A revenue neutral bill with carbon priced at US$15 per ton increasing by US$5 per ton annually
Maryland A revenue positive bill with carbon priced at US$15 per ton increasing by US$5 per ton annually until 2025 where it would remain at US$45
Massachusetts A revenue neutral bill with carbon priced at US$10 per ton
A revenue positive bill with carbon priced at US$20 per ton with a rate increase of US$5 per year until it reaches US$40 per ton
A revenue positive bill with carbon priced at US$15 per ton with a rate increase of US$10 per year
New Hampshire Establishes a study commission on creating a price on carbon
New York A revenue positive bill with carbon priced at US$35 per ton with a rate increase of US$15 per year until it reaches US$185 per ton
Establishes a study commission on creating a price on carbon
Oregon A cap and invest bill requiring reducing in greenhouse gas emissions of 20% of 1990 levels by 2025, 45% by 2035 and 80% by 2050
Rhode Island A revenue positive bill with carbon priced at US$15 per ton with a rate increase of US$5 per year
Vermont The ESSEX Plan
Washington
A revenue positive bill with carbon priced at US$15 per ton with a rate increase of US$2.50 until it reaches US$30 per ton
A revenue positive bill with carbon priced at US$15 per ton with a rate increase of US$2.50 until it reaches US$30 per ton
A revenue positive bill with carbon priced at US$15 per ton of CO2
A revenue positive bill with carbon priced at US$15 per ton until 2024 when it will rise to US$20 per ton
In May 2018, Maryland Delegates David Fraser-Hidalgo and Ben
• Helps spur the growth of renewable energy
• Investments in renewable energy entail more local jobs and
increase the money staying within the state
• Helps spur innovation, allowing renewable energy to compete fairly, and provide businesses with longer-term certainty for energy fuel costs
• Helps improve air quality, reducing the impact of emissions linked to worsening public health.

36 A Strategic Overview of the Global Energy Markets
Carbon pricing: Canada’s proposed Pan-Canadian Framework for carbon pricing would set national standards but give individual provinces considerable latitude in program design and revenue allocation
Figure 1.9. Canada - Key Carbon Pricing developments across Provinces and Territories - 2017 and beyond
Alberta ~ Carbon TaxOntario ~ ETS
Initiatives implemented in 2017
ManitobaSaskatchewan
Initiatives under consideration
New BrunswickNova Scotia
OntarioJanuary 2018: Linked its ETS with the California and Québec ETSs, after Ontario signed the linking agreement in September 2017
QuébecNovember 2017: adopted legislation to prepare its ETS for the post-2020 period, which included rules for free allocation of emission allowance from 2021-2023140 and the cap for 2021-2030
New BrunswickDecember 2017: introduced its climate change legislation, which sets out the government’s plan to meet the federal carbon pricing standard by transferring a part of existing revenues from gasoline and diesel taxes to a climate change fund
Nova ScotiaFebruary 2018: Legislation allows government to set up a cap-and-trade system, which is planned to enter into force in January 2019
SaskatchewanDecember 2017: Proposed
baseline-and-credit ETS strategy to be implemented in 2019
The baseline-and-credit ETS would cover industrial facilities that emit
over 25 ktCO2e
AlbertaJanuary 2018: Carbon
Competitive Incentive Regulation
Carbon Tax rate increased from US$16/tCO2e in 2017 to
US$23/tCO2e) in 2018
British ColumbiaApril 2018: Tax Rate increased
from US$23/tCO2e to US$27/tCO2e and will continue to increase annually by US$4/tCO2e
until the rate is US$39/tCO2e in 2021
ManitobaSeptember 2018: To implement a Fixed Carbon Tax of US$19/tCO2e,
which will be reviewed in 2022To implement a
baseline-and-credit ETS in 2019 for
50 ktCO2e
Developments under consideration
Source: State and Trends of Carbon Pricing, 2018, World Bank (May 2018)
While interest around a national carbon price in the US has faded substantially since the collapse of Waxman Markey in 2009, the Canadian government under Prime Minister Justin Trudeau has since developed a national carbon price framework as a key pillar in its plan to meet its Paris Agreement commitments
• Recognizing the fact that several of the largest Canadian provinces (Ontario, Quebec, British Columbia, and Alberta) already have carbon pricing mechanisms in place, the federal government has opted for a national carbon price benchmark which provides
deciding how to meet the federal standard.
• For jurisdictions that opt for an explicit price-based system (i.e., a carbon tax), the benchmark requires a minimum price of CDN$10/ton CO
2e by 2018, rising to CDN$50/ton of CO2e by 2022.
Carbon price rises are planned in jurisdictions with comparatively higher prices, which includes :
• The British Columbia carbon tax, which will increase from US$27/ton CO2e in 2018 to US$39/ton CO2e in 2021.
• The proposed carbon tax rate for the Canada federal backstop, which will begin at US$16/ton CO2e in 2019 and scale up to US$39/ton CO2
on January 1, 2019).
– The proposed backstop system consists of two elements: a carbon tax that is generally payable by fuel producers or distributors, and a baseline-and-credit ETS for emissions-intensive, trade-exposed industrial facilities.
Canadian federal carbon pricing plan has met some controversy, including from some citizens concerned about impacts on the cost of living, and from a few recalcitrant provinces
• While support for a carbon price is substantially higher in
gasoline.
The federal standard aims to ensure that carbon pricing will apply to a broad set of emission sources throughout Canada, with increasing stringency over time
• The Pan-Canadian approach to carbon pricing requires all Canadian provinces and territories to have a carbon pricing initiative in place in 2018 that aligns with the federal standard.
• The federal standard gives provinces and territories the
and-trade system, and sets common criteria that all systems
On the subnational level, provinces and territories are working to develop carbon pricing initiatives that align with the federal standard

37
Nort
h Am
eric
a
2-Energy Transition
Progress in decoupling energy from growth continues
• of natural gas usage have contributed to this ongoing trend.
• fuel economy improvements, and structural changes in the economy continue to lower energy intensity.
US investments in clean energy tracked 2016 levels, but reported a shift in capital deployment
• This trend continues despite a turn towards a less favorable domestic policy atmosphere.
Alternative energy technologies are approaching an LCOE that is at or below the marginal cost of certain conventional generation technologies
• Wind LCOE is in the US$30-60 range, continuing the trend
of cost competitiveness, followed by solar PV.
• The gas combined cycle, with an LCOE of US$42-78, is close behind.
• Despite the sustained and growing cost-competitiveness of certain alternative
are required to meet baseload generation needs for the foreseeable future.
Among commercially deployed technologies, lithium-ion continues to provide the most economic solution across all use cases
• As the energy storage market continues to evolve, several forms of potential revenue streams have emerged in selected US markets.
• Utilities provide valuable revenue sources in exchange for location-based grid services, with the most common applications being in utility demand response programs and T&D deferral applications.
• Tesla predicts unprecedented growth in the near future.
Energy decoupling: Progress in decoupling from growth continues; declines in energy intensity and carbon intensity continue to mitigate emissions growth
Figure 2.1. US - Decline in Energy Intensity and Carbon Intensity vis-à-vis GDP/Capita Growth, 2005-2050
2005 2010
GDP/Capita (000 US$ per person) Energy Intensity('000 British thermal units per US$)
Carbon Intensity(metric tons CO per billion British thermal units)
2015 2020 2025 2030 2035 2040 2045 2050
40
45
50
55
60
65
70
75
80
85
90
2005 2010 2015 2020 2025 2030 2035 2040 2045 2050
2
3
4
5
6
7
8
9
10
Ref
eren
ce Y
ear
~ 20
17
Ref
eren
ce Y
ear
~ 20
17Projection Reference ~ EIAAnnual Energy Outlook 2018
Projection Reference ~ EIAAnnual Energy Outlook 2018
Source: US EIA Annual Energy Outlook, 2018

38 A Strategic Overview of the Global Energy Markets
Energy intensity (the amount of energy used per unit of economic growth) has declined steadily for many years, while carbon intensity (the amount of CO2 emissions associated with energy consumption) has generally declined since 2008
• Since 2008, energy usage has shrunk 1.7% despite GDP growing by 15.3%.
• Considering the laws and regulations currently in place, energy intensity and carbon intensity are projected to be 42% and 9% lower than their respective 2017 values by 2050.
The trend continues: Energy productivity (the amount of GDP produced by a unit of energy) climbed 2.5% in 2017 as economic growth continued its long-term trend of decoupling from energy use
• The US economy advanced 2.3% in 2017, up from 1.5% in 2016; whereas total energy consumption dipped 0.2% to 97.2 quadrillion BTU.
• Annualized electricity consumption, excluding consumption of distributed energy resources, fell 2.6% in 2017 despite stronger economic growth.
• Since 2007, electricity demand has reduced by an average of 0.2% per year.
• natural gas usage have clearly contributed to this ongoing trend.
• The number of residential customers using natural gas grew by 21% to 69 million in the 20 years from 1998 through 2017.
Trend indicates slowdown in new states
(EERS) policies and the maturing of many states schemes
• Carbon intensity declines as a result of changes in the US energy mix that reduce the consumption of carbon-intensive fuels and increase the use of low- or no-carbon fuels.
as has investment
the previous year
• In the years leading up to 2011 a growing number of states introduced EERS, mandating utilities to invest in energy savings among their customer base.
• There was a corresponding increase in investment in utility
– Between 2015 and 2016, Arkansas, Illinois and Pennsylvania
reported savings increases of 0.19 TWh, 0.16 TWh and 0.15 TWh respectively.
•
– Although 28 states saw an increase in energy savings in 2016, Californian utilities’ savings decreased from 5.0 TWh to 3.9 TWh
–
Figure 2.2. US - Incremental Annual Energy Efficiency Achievement/Utility Spending, 2010-2016
2010 2011 2012 2013 2014 2015 20160
5
10
15
20
25
30
-10%
-5%
0%
5%
10%
15%
20%
25%
30%
18.4
23.0
24.425.7
26.525.4
22.9
E lu n %
2010 2011 2012 2013 2014 2015 2016
3.9
4.7 4.85.0
5.6
6.2 6.3
0.8
1.01.1
1.2
1.3
1.4 1.3
0
1
2
3
4
5
6
7
8
Bll
n U
S$
-10%
-5%
0%
5%
10%
15%
20%
25%
30%
Elu
n %
5.74.7 6.0 6.1 6.9 7.6 7.6
+20% +4% +3% +13% +12% +1%
El r Na ural Gas
E lu n Na ural Gas %
Source: BNEF - Sustainable Energy in America Factbook, 2018

39
Nort
h Am
eric
aLCOE: Alternative energy technologies, which became cost-competitive with conventional generation several years ago, are, in some scenarios, approaching a LCOE that is at or below the marginal cost of certain conventional generation technologies
LCOE values for alternative energy technologies continue to decline
• continuously evolving and growing pools of capital being allocated to alternative energy.
• Declining capital expenditures per project resulting from
decreased equipment costs.
• Increased competition among participants as markets evolve policies towards auctions and tenders for the procurement
• Improving competencies in asset management and operation and maintenance execution.
Wind LCOE at US$30-$60 range, continues the trend of cost competitiveness, followed by solar PV.
Vis-à-vis, gas combined cycle, with LCOE of US$42-$78, competes closely
Figure 2.3. US - Unsubsidized Levelized Cost of Energy (US$/MWh)
$0
$50
$100
$150
$200
$250
$300
$350
Leve
lize
d C
ost
(US$
/MW
h)
Solar PV -Rooftop
Residential
Solar PV -Crystalline
Utility Scale
Solar PV - Thin
Film Utility Scale
Solar Thermal
Tower withStorage
Fuel Cell Microturbine Geothermal Biomass Direct
WindSolar PV -Rooftop
C&I
Solar PV -Community
DieselReciprocating
Engine
NaturalGas
ReciprocatingEngine
Gas Peaking
IGCC Nuclear Coal Gas Combined
Cycle
$319
$194
$150
$53 $48
$181$167
$89
$117 $114
$60
$281
$106
$210
$231
$183
$143
$78
$187
$85$76
$46 $43
$98 $106
$59
$77
$55
$30
$197
$68
$156
$96 $112
$60$42
Conventional EnergyAlternative Energy
Source: Lazard - Levelized Cost of Energy, Version 11.0
In 2016, growth in utility spending on energy
higher year-on-year
• While investment growth eased at the national level, the scenario has been more dynamic at the state level.
– Utilities in Washington increased spending by US$34 million (+11%), increases in Indiana by US$34 million (+33%), North Carolina by US$31 million (+21%) and Kentucky by US$30 million (+38%).
• California by US$57 million (-3%) and Maryland by US$90 million (-44%):
– The decrease in Maryland stems in part from a general decline in investment by the state’s utilities
– The drop in California is relatively trivial when compared against the increase from US$1.57 billion to US$1.71 billion between 2014 and 2015.

40 A Strategic Overview of the Global Energy Markets
For the foreseeable future…
• Despite the sustained and growing cost-competitiveness of certain alternative energy technologies, diverse generation
foreseeable future.
• A rational and cost-based analysis is necessary to enable a
increasingly clean energy economy.
The displacement trend will be moderated by the intermittent nature of alternative energy generation and the current reluctance of capital providers to underwrite merchant exposure, as well as an understanding of the need for resource diversity in a modern electricity grid
Levelized Cost of Energy: Costs continue to decline for alternative energy technologies, albeit at a modest rate
Over the last eight years, wind and solar PV have become increasingly cost-competitive with conventional generation technologies, on an unsubsidized basis, in light of material declines in the pricing of system components (e.g., panels, inverters, racking, turbines, etc.), and dramatic
• The gap between the costs of certain alternative energy technologies (e.g., utility-scale solar photovoltaic and
utility-scale onshore wind) and conventional generation
and, in certain instances, increase (e.g., nuclear).
• Large-scale conventional and renewable generation projects (e.g., IGCC, nuclear, solar thermal, etc.) continue to face a
absolute costs, competition from relatively cheap natural
uncertainty.
A key issue facing alternative energy generation technologies is the impact of the availability and cost of capital on LCOEs (as a result of capital markets dislocation, technological maturity, etc.);
build them
Figure 2.4. US - Selected Historical Mean LCOE Comparison (US$/MWh)
2009 2010 2011 2012 2013 2014 2015 2016 2017$30
$80
$130
$180
$230
$280
$330
$380
Me
an L
CO
E (U
S$/M
Wh)
Eight-Year Percentage Decreases
Nuclear: +20%
Coal: -8%
Gas -Combined Cycle: -27%
Utility Scale Solar: -86%
Wind: -67%
Source: Lazard -Levelized Cost of Energy, Version 11.0 (November 2017)
TrendsWhile capital costs for a number of alternative energy generation technologies (e.g., solar PV, solar thermal) are currently in excess of some conventional generation technologies (e.g., gas), declining costs for many alternative energy generation technologies, coupled with uncertain long-term fuel costs for conventional generation technologies, are working to close formerly wide gaps in electricity costs.

41
Nort
h Am
eric
a
Levelized Cost of Energy: The increasing use of technologies has resulted in a decline in costs, particularly for solar PV installations
Costs associated with a utility-scale solar installation in the US from 2010
drop
• Total installed costs fell from nearly US$4.5 per watt in 2010 to nearly US$1 per watt in 2016.
• Evolving drivers of change:
– Amplifying economies-of-scale impacts on EPC contractor and developer costs
– Lower module and inverter prices
– Increased competition, lower installer and developer overheads, improved labor productivity, and optimized system
Although hardware cost reductions (module and inverter prices, in particular) have been an important driver of system cost reductions in recent years, the size of these gains has decreased recently, due to the policy uncertainties in the sector
Figure 2.5. US - Solar Photovoltaic Utility-scale Solar System Cost Benchmark (2017 US$/watt - Direct Current)
2010 2011 2012 2013 2014 2015 2016 2017$0
$1
$1
$2
$2
$3
$3
$4
$4
$5
$5
2017
US$
/wat
t ~
Dir
ect
Cur
rent
2.42 2.15
1.120.67 0.68 0.67 0.65
0.35
2.15
1.76
1.54
1.37 1.20 1.150.80
0.68
4.57 3.91
-14.3% -32.0% -23.4% -7.5% -3.3% -20.7% -28.9%
2.66 1.89 1.82 1.822.04 1.82
Other costs Panel
Source: NEB (October 2017)
Levelized Cost of Storage - Among commercially deployed technologies, lithium-ion continues to provide the most economic solution across all use casesAs the energy storage market continues to evolve, several forms of potential revenue streams have emerged in selected US markets
Key Findings
• Continued decreasing cost trends
– Cost improvements for lithium-ion modules (particularly
by increases in engineering, procurement and construction
–lithium-ion (i.e., median of ~10% CAGR vs. ~12%).
• Evolving revenue streams
–across geographic regions in the US, mirroring state/ISO subsidies and storage-related product design
– Utility revenue streams for transmission and distribution
demand response revenues are also diverse and complex;
however, in high-cost regions (e.g., ConEd’s territory) they can be attractive
– Customer revenue sources are dominated by bill savings, which are highly lucrative in high-cost investor-owned
• Project economics remain highly variable
– Commercial use case in CAISO provides an attractive
Capacity Requirements (LCR) and bill management savings
– Distribution deferral use case in NYISO provides an
adequacy (estimate based on ConEd’s Brooklyn-Queens Demand Management (BQDM) program)
– Microgrid project revenue sources in ISO-NE were limited and provided negative illustrative returns ; and residential
project economics due to the relatively high installed cost
and participation in demand response.

42 A Strategic Overview of the Global Energy Markets
Figure 2.6. US - Unsubsidized Levelized Cost of Storage (US$/MWh)
Flow Battery(V)#
Flow Battery(Zn)#
Lithium-Ion Flow Battery(V)#
Lithium-Ion Flow Battery(V)#
Lithium-Ion Lithium-Ion Lead-Acid Advanced Lead
Lithium-Ion Lead-Acid Advanced Lead
$0
$200
$400
$600
$800
$1,000
$1,200
$1,400
Leve
lize
d C
ost
(US$
/MW
h)
$209
$286 $282
$184
$272 $273
$363
$891
$1,057$950
$1,028
$1,160 $1,138
$413
$315$347 $338 $338 $406 $386
$985
$1,154
$1,107
$1,274$1,239
$1,188
CommercialPeaker Replacement Distribution Microgrid Residential
In front of the meter Behind the meter
Source: Lazard -Levelized Cost of Storage Analysis, Version 3.0 (November 2017)Note: # Denotes indicative Flow Battery LCOS value | Flow Battery(V) ~ Flow Battery Vanadium; Flow Battery(Zn) = Flow Battery Zinc
For the foreseeable future…
• In many cases, local market/regulatory rules are not available to reward the owner of an energy storage project for providing all (or the optimal combination of) potential revenue streams.
• Although energy storage developers/project owners often include energy arbitrage and spinning/non-spinning reserves as sources of revenue for commissioned energy storage projects, frequency regulation, bill management and resource adequacy are currently the predominant forms of realized sources of revenue.
Cost of Storage Comparison
In front of the meter Behind the meter
• Flow battery manufacturers have claimed that they do not require augmentation costs and can compete with lithium-ion; however, operational experience is lacking to practically verify these claims.
• Flow batteries lack the widespread commercialization of lithium-ion.
•
8-hour use cases.
• Compared with in front of the meter, behind-the-meter system costs
are substantially higher due to higher unit costs.
• The low initial costs of lead and lead carbon are outweighed by
higher augmentation and operating costs.
Lithium-ion equipment costs continue to decline
integration, and cheaper inverters
• Battery module prices are expected to continue declining, driven by sustained manufacturing competition.
• System integration costs will decline as more and larger electrical equipment manufacturers enter the energy storage market.
• Energy storage inverters continue to follow solar inverter price declines, with sustained price reductions expected in the coming years.
Key drivers of energy storage market growth
• Enabling policies: Include explicit targets and/or state goals incentivizing procurement of energy storage.
– California energy storage procurement targets (e.g., AB2514) require 1,325 MW by 2020.
• Incentives: Upfront or performance-based incentive payments to subsidize initial capital requirements.
– California Self-Generation Incentive Programs (SGIP): US$450 million budget available to behind-the-meter storage.
• Market fundamentals: Endogenous market conditions resulting in higher revenue potential and/or increased opportunity to participate in wholesale markets.
– California Real-Time Energy: 100+ hours with >US$200/MWh locational marginal price in 2016.
• Favorable wholesale/utility program rules: Accessible revenue sources with operational requirements favoring fast-responding assets.
–
storage.

43
Nort
h Am
eric
a
• High peak and/or demand charges: Opportunities to avoid utility charges through peak load management during
– ERCOT 4CP Transmission Charges: ~US$2-$5/kW-mo. charges applied to customers during system coincident peak hours in summer months.
Utilities provide valuable revenue sources in exchange for location-based grid services, the most common applications being in utility demand response programs and T&D deferral applications
• California investor-owned utilities
– Capacity Bidding Program (CBP)
– PG&E: ~US$9.9/kW-mo., 6 mo.
– SCE: ~US$4.5/kW-mo., 12 mo.
– SDG&E: Varies on notice, from US$10.6
– US$15.2/kW-mo., 6 mo.
– Base Interruptible Program (BIP)
– PG&E: US$8-$9/kW-mo., 12 mo.
– SCE: US$24-$30/kW-mo., 6 mo.
– SDG&E: US$12/kW-mo. summer, US$2/kW-mo. winter
– Demand Bidding Program
– US$0.50/kWh during events
• Hawaiian Electric
– Fast DR Pilot Program
– US$5/kW-mo., 12 mo.
– US$0.50/kWh during events
• Com Edison
– Voluntary Load Reduction Program
– US$0.25/kWh + delivery payment
– Completely voluntary
• Florida
– Commercial Demand Reduction Program
– US$8.20/kW-mo.
– FPL controls the asset during events
• ConEd
– Commercial System Relief Program (CSRP)
– US$6-$18/kW-mo., depending on location
– 5 mo. period, US$1/kWh
– Distribution Load Reduction Program (DLRP)
– US$18-$25/kW-mo., depending on location
– 5 mo. period, US$1/kWh
• Duke Energy Progress
– Demand Response Automation (DRA) Program
– US$3.25/kW-mo. + US$500/kW for 1st & 2nd event + US$6/kW at each event.
Key takeaways
• Jurisdictional and regulatory concerns have limited deployment thus far.
• Transacted values do not typically equal price; in most installations value substantially exceeds price.
• Assets are typically transacted as a capital purchase by utilities.
• Asset value is highly location dependent.
• Deferral length varies based on factors independent of the battery.
• Projects are rarely transacted in the absence of other revenue streams.
Clean Energy Investment - US clean energy investment, which took second place after China, held its ground at US$57 billion despite a turn towards a less favorable domestic policy atmosphereFigure 2.7. US - Total New Investment in Clean Energy, 2005-2017 (US$ billion)
2005 2006 2007 2008 2009 2010 2011 2012 2013 2014 2015 2016 201705
10152025303540455055606570
Bill
ion
US$
17
35
47
44
35
47
62
53
45
52
5856
57
New Investment (Billion US$) Evolution (%)
2%
-40%
-20%
0%
20%
40%
60%
80%
100%
120%
Evo
luti
on
(%)
Source: BNEF - Sustainable Energy in America Factbook, 2018
US investments tracked 2016 levels but reported a shift in capital deployment
• energy investment concealed shifts in capital deployment.
• Solar investment fell 20%, as policy uncertainty delayed projects and leading residential solar vendors pulled back from the market.
• However, smart energy technologies attracted 25% more funding in 2017 than in 2016 and wind investment expanded 19%.
• The Midwest’s system operator, MISO, is overseeing a large build-out of its wires

44 A Strategic Overview of the Global Energy Markets
Topic Box 2.1: Energy storage growth traction is picking up pace – and is here to stay
Wood Mackenzie Power and Renewables estimates global annual energy storage deployments will grow from 2.3 gigawatt hours in 2017 to 21.6 gigawatt-hours in 2022
Tesla’s energy storage business - monumental growth predictions for the future
Tesla executives predict unparalleled growth levels in 2019 of 300% to 400% for its energy storage business
• Company’s energy business is likely to catch up with its electric vehicle business in the long term.
•
years to install 1 GWh of energy storage projects.
• Tesla had shut down a Powerwall battery manufacturing production line in order to make more batteries for its Model 3 car, but is now adding new cell lines to address cell shortages.
• That will enable Tesla to soon triple its storage business.
Yet, challenges remain
• One of the challenges Tesla is facing in growing its energy storage business is a shortage of trained electricians.
• Tesla reported that it installed 84 MW of solar power in Q2 2018, which is 11% higher than in Q1 2018 but down 52% year-on-year.
• The company expects solar growth rates to remain stable for the rest of the year and attributed the slower pace to
solar rooftop shingles, which can last anywhere from 30 to 50 years.
• Tesla has projected that solar deployments should remain stable in H2 2018, and will end the year with 329 MW of solar power deployed, its lowest since 2014.
Production at Fremont, California
Production at Gigafactory, Nevada
2008Unveiled Roadster, battery technology and electric powertrain
Unveiled Model S, premium all-electric sedan
2015Unveiled Model X, sport utility vehicle
2016 - 2017Unveiled Model 3, low-priced vehicle that began production in 2017 and Tesla Semi, truck
2018Production set to increase to a rate of 500,000 vehicles a year by 2018
Energy solutions - Powerwall, Powerpack and Solar Roof - enabling homeowners, businesses, and utilities to manage renewable energy generation, storage, and consumptionGigafactory 1 - facility designed to reduce battery cell costs and, by 2018, produce more lithium-ion batteries annually than were produced worldwide in 2013
infrastructure, seeking to replicate Texas’ success in reducing wind curtailment rates.
– The construction of the Texas Competitive Renewable
Energy Zone (CREZ) transmission lines brought wind produced in west Texas to demand centers farther east, slashing curtailment rates from a peak of 17% in 2009 to under 2% for 2016.

45
Nort
h Am
eric
a
Topic Box 2.2: Federal initiatives ranging from trade cases to tax reform continue to drive uncertainty in the market for clean technologies
Solar under pressure
• In January 2018, President Donald Trump instituted a 30%
cells, which is scheduled to step down to 15% by 2021.
• The safeguard measure was imposed in response to a trade complaint submitted by two bankrupt domestic solar module manufacturers.
• The case, lodged by Suniva and SolarWorld, alleged unfair competition from Chinese manufacturers, but the
origin.
• estimated 4-10%.
Tax reforms passed around the end of 2017 assure change in favor of clean energy
• While the electric vehicle, wind, and solar tax credits remain unchanged from prior years, the corporate tax rate dropped to 21% from 35%.
• This tax cut raises after-tax earnings for renewable projects, but also reduces the supply of tax equity available for supporting renewable build.
• Additionally, the tax cut may free up utility money for infrastructure investments or for lowering retail electricity rates.
• are now required to pay a minimum level of taxes on foreign transactions under the BEAT provision.
• Although this can also limit tax equity supply, the negative impact is curbed by a provision that allows corporations to use 80% of the Investment Tax Credit (ITC) and Production
• The introduction of immediate, 100% depreciation of
lived assets such as energy saving building materials or technology.
In February 2018, Congress passed the Bipartisan Budget Act, which impacted on a range of energy incentives
• (biogas, biomass, waste to energy, active geothermal, hydropower, marine and hydrokinetic) received one-year retroactive extensions.
• solar, micro-turbines, fuel cells, combined heat and power,
downs.
• The budget law also lifted the end-of-2020 in-service deadline for nuclear plants to qualify for the nuclear production tax credit.
• capture and sequestration (CCS) facilities.
Renewables support programs in 2017
• Most customers in 40 states, plus DC, could access net metering at the full retail rate as of August 2017.
• But states across the country are looking at potential reforms to the scheme: over the past year, Arizona,
metering.
• compensation rates or set a deadline by which small-scale PV owners can still qualify for net metering.

46 A Strategic Overview of the Global Energy Markets
3-Infrastructures & Adequacy of Supply
Renewable generation soared an estimated 14.1% year-on-year in 2017, the highest ever one-year surge, as output increased by approximately 90 TWh
• Total renewable generation hit 717 TWh, driven by a rebound in hydro (up 13%, or 36 TWh) and new solar and wind build (driving generation up by 53 TWh, including estimates for small-scale solar).
With its ability to store water and to regulate output as needed, Canada’s hydro capacity also facilitates the development of intermittent renewable resources such as wind and solar
• Over the past 5 years, policy incentives and declining costs
renewable resources.
• Multiple initiatives, at both federal and regional level, continue to indicate a considerable decline in coal capacity by 2040.
The projected mix of electricity generation is
2050
• Fuel prices in the near term would drive the share of
• Driven by continued favorable economics, generation relative to alternative technologies would more than double between 2017 and 2050, with an average annual growth rate of 2.8%.
• Tax credit phase-outs and coal plant retirements are likely to accelerate additions of near-term renewables
• Nuclear capacity retirements are projected to accelerate along with an anticipated drop in natural gas prices, while also indicating lower revenues in competitive power markets.
Renewable capacity build witnessed a slump in 2017 after record-level additions in 2016, down 19% to 18.4 GW from 22.7 GW in 2016
• 2017 saw policy turbulence for the renewable industry,
grid reliability and resilience.
• consecutive year while remaining strong for wind pipeline.
Electricity Use - Electricity use is expected to grow steadily through 2050 driven by growth projections across all demand sectors
Figure 3.1. - US - Electricity Use Growth Outlook, 2005-2050
-1
0
1
2
3-Y
ear
Ro
lling
Ave
rag
e (%
)
Electricity Use Growth Outlook (3-Year Rolling Average)
Re
fere
nce
Ye
ar ~
201
7
Projection Reference ~ EIAAnnual Energy Outlook 2018
2005 2010 2015 2020 2025 2030 2035 2040 2045 2050
0 200 400 600 800 1000 1200 1400 1600 1800
Billion KWh
Residential
Commercial
Industrial
Transportation
Residential
Commercial
Industrial
Transportation
Residential
Commercial
Industrial
Transportation
2050
2017
1990
Electricity Use by End-use Demand Sector
Electricity Sales Direct Use
Source: US EIA Annual Energy Outlook, 2018

47
Nort
h Am
eric
a
After decades of diminishing growth, 2017 saw the US energy sector change gear, indicating a surge in future electricity demand
• While the historical electricity demand growth rates
going forward will be driven largely by economic growth and
• According to the Lawrence Berkeley National Laboratory, the
declined to US$28/MWh in 2013, from US$44/MWh in 2009, down 36%.
Demand growth was negative in 2017, but is projected to rise slowly through 2050
• According to US EIA, the 2017–2050 average annual growth in electricity demand is projected to reach about 0.9%.
Decline witnessed historically; steady growth on the horizon
• Growth in retail electricity demand fell of 2.6% year-on-year (excluding contributions from distributed, small-scale facilities).
• Compound annual electricity growth has been steadily declining, from 5.9% over 1950-1990, to 1.9% over 1990-2007, to -0.2% since 2007.
Growth in direct-use generation outpaces the growth in retail sales as a result of the adoption of
Electricity Generation - 2017 witnessed a historical leap in contribution from renewable energy
Renewable generation (including hydropower) soared an estimated 14.1% year-on-year in 2017, the highest ever one-year surge, as output increased by approximately 90 TWh
• Total renewable generation hit 717 TWh, driven by a rebound in hydro (up 13%, or 36 TWh) and new solar and wind build (driving generation up by 53 TWh, including estimates for small-scale solar).
The moderate slump in contribution to total generation by natural gas (32%, from 34% in 2016) was an underlying factor in the growth in renewables
• In absolute terms, gas generation sank to 1,278 TWh from 1,391 TWh year-on-year. Recovering gas prices and an estimated 1.7% slump in total generation (including estimates
for distributed solar) also contributed to a squeeze on gas plants.
• Total coal generation declined by 3% in 2017, but held steady at approximately 30% of total electricity generation.
Nonetheless, natural gas retained its top position. The continuing changes to the structural fundamentals of the US generation mix will likely cement its role here for some years: natural gas build boasted its best year since 2005, as new installations reached 10.7 GW in 2017
Figure 3.2. US - Historical Electricity Generation Mix - Evolution, 2008-2017 (TWh)
2017year-on-year
4100
4150
4200
4250
4300
4350
4400
4450
0%
10%
20%
30%
40%
50%
60%
70%
80%
90%
100%
Ele
ctric
ity
Ge
nera
tio
n M
ix (
%)
Elec
tric
ity
Gen
erat
ion
(TW
h)
2008 2009 2010 2011 2012 2013 2014 2015 2016 2017
48% 44% 45% 42% 37% 39% 39%33% 30% 30%
1%1% 1%
1%1% 1% 1%
1%1% 0%
20%20% 20%
19%19% 19% 19%
19% 20% 20%
22%24% 24%
25% 31% 28% 28%33% 34% 32%
9% 11% 10% 13% 12% 13% 13% 14% 15% 18%
Coal Oil
Nuclear Natural Gas
Renewables (including Hydro) Electricity Generation (TWh)
Source: BNEF (February 2018), BP Statistical Review of World Energy, 2018

48 A Strategic Overview of the Global Energy Markets
Electricity Generation - The projected mix of electricity generation
Fuel prices in the near term would
• In the longer term, the relatively low cost of
generation.
• Federal tax credits would drive near-term growth in renewables generation,
electricity generation.
Clean Power Plan (CPP) on these projections
• at a higher level than in the CPP scenario, but growth in natural gas and renewables generation capacity would dampen coal’s growth.
• Near-term coal power plant retirements and competition with
about 1,200 billion KWh through 2050.
• to decline through 2030 to about 1,000 billion KWh, before declining gradually through 2050.
Driven by continued favorable economics, generation relative to alternative technologies would more than double between 2017 and 2050, with an average annual growth rate of 2.8%.
Figure 3.3. US - Projected Mix of Electricity Generation (Select Fuel Type), 2005-2050 (billion KWh)
2005 2010 2015 2020 2025 2030 2035 2040 2045 2050200
400
600
800
1,000
1,200
1,400
1,600
1,800
2,000
2,200
Bill
ion
KW
h
Nuclear Nuclear (With CPP) Coal Coal (With CPP)
Renewable Renewable (With CPP) Natural Gas Natural Gas (With CPP)
Source: US EIA Annual Energy Outlook, 2018
Capacity Change Projections - 2018 slated to be a near-record year with an estimated 12.5 GW of decommissioning, second only to 2015’s high of 15 GW
Although the pace of coal retirements slowed in 2017, further acceleration is expected, driven by a gamut of factors
• 306 GW.
• runtime and lower revenues for coal plants.
• Additionally, aging boilers and rising operating costs, partly due to US EPA regulations covering sulfur, nitrogen, and mercury emissions from power plants, have forced many coal plants to retire earlier than originally planned.
– The Mercury and Air Toxics Standards (MATS) is currently engaged in a lawsuit.
– The New Source Performance Standards (NSPS) is still
gas plants.
Figure 3.4. US - Coal-fired Electricity Generation Capacity/Retirements, 2010-2020 (GW)
2010 2011 2012 2013 2014 2015 2016 2017 2018 2019 20200
2
4
6
8
10
12
14
16
GW
2
12
2 21
3
11
64
15
8 4
Announced Completed
Source: BNEF (February 2018)

49
Nort
h Am
eric
a
Capacity Change Projections - Renewables and natural gas would comprise most of the capacity additions through 2050Tax credit phase-outs and coal plant retirements likely to accelerate additions of near-term
• Most electricity generation capacity retirements are likely to occur by 2025, driven primarily by lower natural gas prices.
• Approximately 80 GW of new wind and solar photovoltaic (PV) capacity would be added from 2018–2021, driven by declining
capital costs and the availability of tax credits.
• New wind capacity additions would decline in pace after the expiration of production tax credits in the early 2020s.
• Although the commercial solar investment tax credits (ITC) would be reduced and the ITC for residential-owned systems would expire, the growth in solar PV capacity is likely to continue through 2050 for both utility-scale and small-scale applications.
Figure 3.5. US - Annual Electricity Generating Capacity Additions and Retirements, 2005-2050 (GW)
2005 2010 2015 2020 2025 2030 2035 2040 2045 2050
-30
-20
-10
0
10
20
30
40
50
GW
Nuclear Coal Oil & Gas Wind Solar Other
Source: US EIA Annual Energy Outlook, 2018
Figure 3.6. US - Nuclear Capacity Changes - Outlook, 2015-2050 (GW)
2015 2020 2025 2030 2035 2040 2045 2050-4
-3
-2
-1
0
1
2
GW
Year-over-year Nuclear Capacity Changes Nuclear Electricity Generation Capacity
New Reactors Assumed Uprates
Actual/Announced Retirements Projected Retirements
Reference Year ~ 2017
Reference Year ~ 2017
Additions
Retirements
Projection Reference ~ EIA Annual Energy Outlook 2018
Projection Reference ~ EIA Annual Energy Outlook 2018
2015 2020 2025 2030 2035 2040 2045 205075
80
85
90
95
100
GW
Source: US EIA Annual Energy Outlook, 2018
Capacity Change Projections: Nuclear capacity retirements are projected to accelerate with an expected slump in natural gas prices, power markets also indicating lower revenues in competitive power markets

50 A Strategic Overview of the Global Energy Markets
The US EIA projects a steady decline in nuclear electricity generating capacity, from 99 GW in 2017 to 79 GW in 2050, a 20% decline, with no new plant additions beyond 2020
• Federal policies triggering further uncertainty
– October 2017
– The US Department of Energy (DOE) requested that the Federal Energy Regulatory Committee (FERC) create rules to subsidize “secure-fuel” power plants within competitive power markets that maintain 90 days’ worth of fuel supplies on site.
– The FERC ultimately declined to implement the
or reliability in the targeted power markets.
– February 2018
– Congress passed the Bipartisan Budget Act, which impacted on a range of energy incentives.
– The budget law lifted the end-2020 in-service deadline for nuclear plants to qualify for the nuclear production tax credit.
Renewable Capacity Build: Renewable capacity build witnessed a slump in 2017 after record-level additions in 2016, down 19% to 18.4 GW from 22.7 GW in 2016
2017 saw policy turbulence for the renewable industry, with tax reform,
grid reliability and resilience
Some technologies have been idling without long-term policy support
• Solar
– Utility-scale developers rebuilding project pipeline following the project commissioning rush in 2016
– In 2017, the Southeast dominated utility-scale build with 2 GW, twice as much as California
– Small-scale build driven by larger system
back growth plans.
• Wind
– Developers aiming to bring projects online by the 2020 deadline to qualify for the full Production Tax Credit (PTC), with many waiting to take advantage of falling equipment costs.
In cumulative terms, growth has been driven by wind and solar, which together jumped 471% since
Figure 3.7. US - Renewable Energy Capacity Build by Technology, 2008-2017 (GW)
2008 2009 2010 2011 2012 2013 2014 2015 2016 20170
5
10
15
20
25
GW
+13% -46% +57% +95% -56% +58% +24% +43% -19%
11.29.9 6.0 9.4 18.3 8.1 12.8 15.9 22.7 18.4
Wind Solar Others*
Source: BNEF - Sustainable Energy in America Factbook, 2018 * Hydro, Geothermal, Biomass, Biogas, Waste-to-Energy All values are shown in AC except Solar, which is included as DC capacity Numbers include Utility-scale (>1MW) projects of all types, Rooftop Solar, and Small and Medium-sized Wind

51
Nort
h Am
eric
a
for a consecutive year, while wind pipeline remained strongSolar
• for the second consecutive year, dropping to US$8.6 billion, correlating with falling technology costs.
• The 2017 levels are indicative of utility-scale build in 2018, as most assets are typically
Wind
• A large portion of the US$15.5 billion in
billion (2017) relate to projects to be commissioned in 2018-2020.
• status of the Production Tax Credit (PTC), which has expired and been retroactively extended multiple times since 2012.
Figure 3.8. US - Asset Finance for Large-scale Solar and Wind Projects, 2012-2017 (US$ billion)
0
5
10
15
20
25
2012 2013 2014 2015 2016 2017
Bil
lion
US$
Solar Wind
Investment by Technology ~ Asset Finance
Source: BNEF - Sustainable Energy in America Factbook, 2018 Note: Solar=Solar Thermal, Utility-scale PV - Wind=Large-scale Wind
Figure 3.9. US - Top 10 Solar States by Capacity, 2017 (MW)
1,599 MW
313,959
21,074 MW
5.4 million
2,595 MW
425,941
3,400 MW
505,705 1,874 MW
210,274 1,430 MW
156,678
1,566 MW
177,270
2,011 MW
MassachusettsUtah
330,445
2,390 MW
371,251
4,308 MW
486,339
Rank 01
Rank 04
Rank 03
Rank 08
Rank 07
Rank 10
Rank 09
Rank 06
New Jersey
North Carolina
Georgia
Florida
Florida
Arizona
California
Nevada Rank 05
Rank 02
Capacity Enough to Power
Source: Solar Energy Industries Association
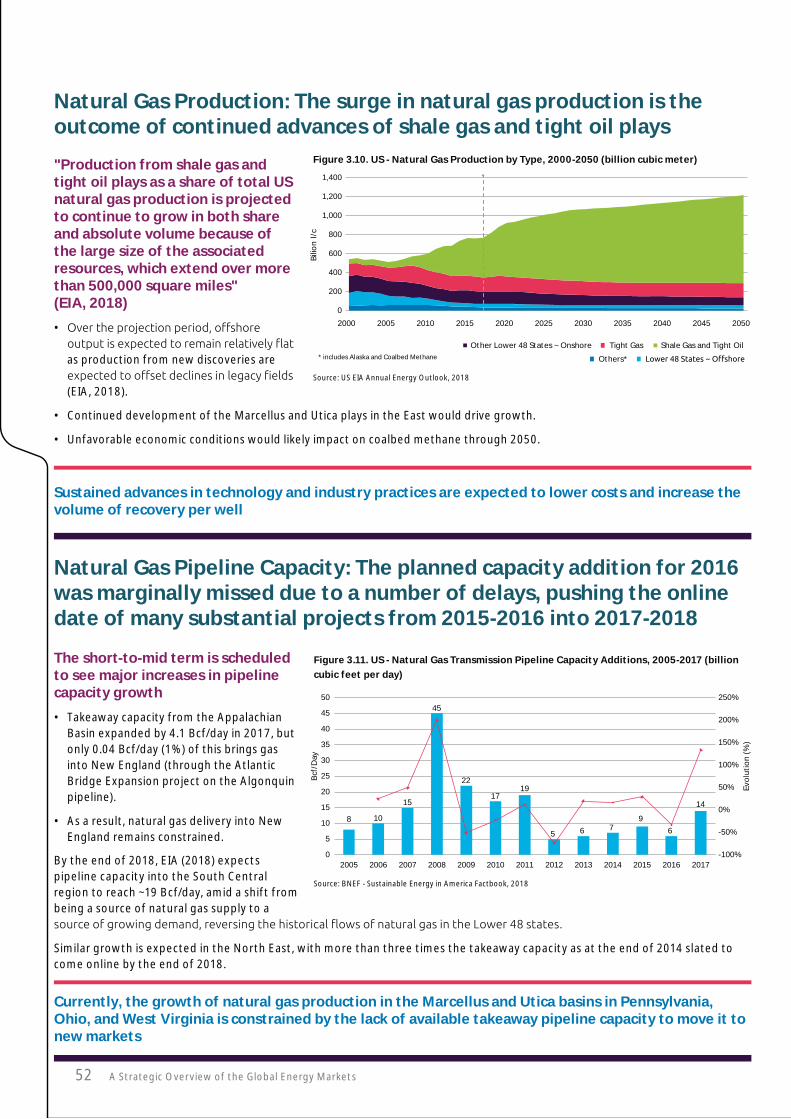
52 A Strategic Overview of the Global Energy Markets
Natural Gas Production: The surge in natural gas production is the outcome of continued advances of shale gas and tight oil plays
"Production from shale gas and tight oil plays as a share of total US natural gas production is projected to continue to grow in both share and absolute volume because of the large size of the associated resources, which extend over more than 500,000 square miles" (EIA, 2018)
•
as production from new discoveries are
(EIA, 2018).
• Continued development of the Marcellus and Utica plays in the East would drive growth.
• Unfavorable economic conditions would likely impact on coalbed methane through 2050.
Sustained advances in technology and industry practices are expected to lower costs and increase the volume of recovery per well
Figure 3.10. US - Natural Gas Production by Type, 2000-2050 (billion cubic meter)
2000
* includes Alaska and Coalbed Methane
2005 2010 2015 2020 2025 2030 2035 2040 2045 2050
0
200
400
600
800
1,000
1,200
1,400
Bili
on
l/c
Others*
Other Lower 48 States ~ Onshore Tight Gas Shale Gas and Tight Oil
Source: US EIA Annual Energy Outlook, 2018
Natural Gas Pipeline Capacity: The planned capacity addition for 2016 was marginally missed due to a number of delays, pushing the online date of many substantial projects from 2015-2016 into 2017-2018
The short-to-mid term is scheduled to see major increases in pipeline capacity growth
• Takeaway capacity from the Appalachian Basin expanded by 4.1 Bcf/day in 2017, but only 0.04 Bcf/day (1%) of this brings gas into New England (through the Atlantic Bridge Expansion project on the Algonquin pipeline).
• As a result, natural gas delivery into New England remains constrained.
By the end of 2018, EIA (2018) expects pipeline capacity into the South Central region to reach ~19 Bcf/day, amid a shift from being a source of natural gas supply to a
Similar growth is expected in the North East, with more than three times the takeaway capacity as at the end of 2014 slated to come online by the end of 2018.
Currently, the growth of natural gas production in the Marcellus and Utica basins in Pennsylvania, Ohio, and West Virginia is constrained by the lack of available takeaway pipeline capacity to move it to new markets
Figure 3.11. US - Natural Gas Transmission Pipeline Capacity Additions, 2005-2017 (billion cubic feet per day)
2005 2006 2007 2008 2009 2010 2011 2012 2013 2014 2015 2016 2017
8 10
15
45
22
1719
5 6 79
6
14
-100%
-50%
0%
50%
100%
150%
200%
250%
0
5
10
15
20
25
30
35
40
45
50
Bcf
/Day
Evo
luti
on
(%)
Source: BNEF - Sustainable Energy in America Factbook, 2018

53
Nort
h Am
eric
a
Natural Gas Trade: 2017 marked the US as a net exporter since 1957, driven primarily by sustained growth in production
Continued production growth, especially from the Appalachia region, along with new pipeline capacity coming online, or slated to come online by the end of 2018, indicate a surge in delivery to regions in the Midwest and Northeast, thereby displacing Canadian imports and increasing US pipeline exports to Canada
• Imports from Canada, primarily from the Western region,
remain relatively stable.
• Bilateral trade between Canada and US is dominated by pipeline shipments, with 97% of all US imports in 2017 coming from Canada.
• Pipeline capacity into Mexico has witnessed a surge, driven primarily by growth in demand for natural gas from Mexico’s power sector and favorable prices compared with LNG shipment.
Besides the Sabine Pass LNG Terminal and Cove Point LNG Facility, four other LNG projects are under construction and expected to increase US liquefaction capacity from 3.6 Bcf/day to 9.6 Bcf/day by the end of 2019, further increasing natural gas exports
Figure 3.12. US - Natural Gas Trade with Canada and Mexico, 2010-2017 (billion cubic meter)
2010 2011 2012 2013 2014 2015 2016 2017
-0.500.000.501.001.502.002.503.003.504.004.50
Bill
ion
Cub
ic M
eter
Bill
ion
Cub
ic M
eter
Import ~ Canada (LNG) Export ~ Canada (LNG) Export ~ Mexico (LNG)
Natural Gas Trade ~ LNG
2010 2011 2012 2013 2014 2015 2016 2017-120-100
-80-60-40-20
020406080
Natural Gas Trade ~ Pipeline
Import ~ Canada (Pipeline) Import ~ Mexico (Pipeline) Export ~ Canada (Pipeline) Export ~ Mexico (Pipeline)
Natural Gas Trade Flows, 2017(Billion Cubic Meter)
83.89
25.97
43.694.00
Pipeline LNG
Source: EIA, BP Statistical Review of World Energy, 2018

54 A Strategic Overview of the Global Energy Markets
Natural Gas Storage: Relatively little new underground natural gas storage capacity was built in the Lower 48 states over the last four years
In 2017, design capacity grew by about 1%, and demonstrated maximum working gas volume (demonstrated peak) fell by 1%
• At a national level, design capacity increased by 34 Bcf (0.7%) between November 2016 and November 2017, driven by expansion to existing facilities, primarily in the East storage region, where design capacity grew by 30 Bcf (2.9%) in 2017.
• Several facilities in Ohio and West Virginia expanded in 2017 to accommodate increasing levels of natural gas production in the Appalachian Basin.
• Demonstrated peak decreased by 46 Bcf (1.0%) in 2017
November 2017, i.e. beginning of each yearly heating season).
– 2012 witnessed high inventory levels because of record warm weather.
Figure 3.13. US - Historical Monthly Natural Gas Storage - Capacity and Storage Volume, 2013-2017 (billion cubic meter)
US - Natural Gas Storage Plan, 2017-2018(Billion Cubic Meter)
Jan-
2013
Feb
-201
3M
ar-2
013
Ap
r-20
13M
ay-2
013
Jun-
2013
Jul-2
013
Aug
-201
3Se
p-2
013
Oct
-201
3N
ov-
2013
Dec
-201
3Ja
n-20
14Fe
b-2
014
Mar
-201
4A
pr-
2014
May
-201
4Ju
n-20
14Ju
l-201
4A
ug-2
014
Sep
-201
4O
ct-2
014
No
v-20
14D
ec-2
014
Jan-
2015
Feb
-201
5M
ar-2
015
Ap
r-20
15M
ay-2
015
Jun-
2015
Jul-2
015
Aug
-201
5Se
p-2
015
Oct
-201
5N
ov-
2015
Dec
-201
5Ja
n-20
16Fe
b-2
016
Mar
-201
6A
pr-
2016
May
-201
6Ju
n-20
16Ju
l-201
6A
ug-2
016
Sep
-201
6O
ct-2
016
No
v-20
16D
ec-2
016
Jan-
2017
Feb
-201
7M
ar-2
017
Ap
r-20
17M
ay-2
017
Jun-
2017
Jul-2
017
Aug
-201
7Se
p-2
017
Oct
-201
7N
ov-
2017
Dec
-201
7
050
100150200250300350400450
Bill
ion
Cub
ic M
eter
Bill
ion
Cub
ic M
eter
Underground Storage Capacity - Total Natural Gas
Underground Storage Capacity - Total Working Natural Gas Underground Storage Capacity - Count of Storage Capacity
Monthly Natural Gas Storage Capacity
Jan-
2013
Feb
-201
3M
ar-2
013
Ap
r-20
13M
ay-2
013
Jun-
2013
Jul-2
013
Aug
-201
3Se
p-2
013
Oct
-201
3N
ov-
2013
Dec
-201
3Ja
n-20
14Fe
b-2
014
Mar
-201
4A
pr-
2014
May
-201
4Ju
n-20
14Ju
l-201
4A
ug-2
014
Sep
-201
4O
ct-2
014
No
v-20
14D
ec-2
014
Jan-
2015
Feb
-201
5M
ar-2
015
Ap
r-20
15M
ay-2
015
Jun-
2015
Jul-2
015
Aug
-201
5Se
p-2
015
Oct
-201
5N
ov-
2015
Dec
-201
5Ja
n-20
16Fe
b-2
016
Mar
-201
6A
pr-
2016
May
-201
6Ju
n-20
16Ju
l-201
6A
ug-2
016
Sep
-201
6O
ct-2
016
No
v-20
16D
ec-2
016
Jan-
2017
Feb
-201
7M
ar-2
017
Ap
r-20
17M
ay-2
017
Jun-
2017
Jul-2
017
Aug
-201
7Se
p-2
017
Oct
-201
7N
ov-
2017
Dec
-201
7-60%-40%-20%
0%20%40%60%80%
0
50
100
150
200
250
Underground Storage - Base Natural Gas
Underground Storage - Working Natural Gas Underground Storage - Change in Working Gas (% year-on-year)
Monthly Natural Gas Storage Volume
12
4
310
8
79
6
5
Note: * Working Gas plus Base Gas capacity in Million Cubic Meters (MCM)
On Hold7.Aliso Canyon Expansion ,
CA - (Southern California Gas)8.D'LoGas Storage Cavern 1/2,
MS - (D'LoGas Storage)9.Magnum Gas Storage Project 2/3/4,
UT ~ 0.29 MCM* (Magnum Gas Storage)
Terminated10.Seneca Lake Gallery 2 Expansion,
NY - (Arlington Storage)
Construction2.East Cheyenne Phase 2: Lewis Creek Field,
CO ~ 0.35 MCM* (NGS Energy)3.Mist Storage Expansion Project,
OR - (Northwest Natural Gas)
Planned4.Golden Triangle Storage Cavern 3/4,
TX ~ 0.63 MCM* (AGL Resources)5.D'LoGas Storage Cavern 3,
MS - (D'LoGas Storage)6.Magnum Gas Storage Project 1,
UT ~ 0.10 MCM* (Magnum Gas Storage)
Year in Service - Estimated year that the storage facility or expansion will be completed
2017
2018
Operational1.CrowvilleSalt Dome Project Cavern 2,
LA ~ 0.12 MCM* (Perryville Gas Storage)
Source: EIA
recorded in the month of February. As a result, natural gas storage inventories ended the injection
However, the end of 2017 witnessed cold weather not seen since the 2013 - 2014 winter, thereby
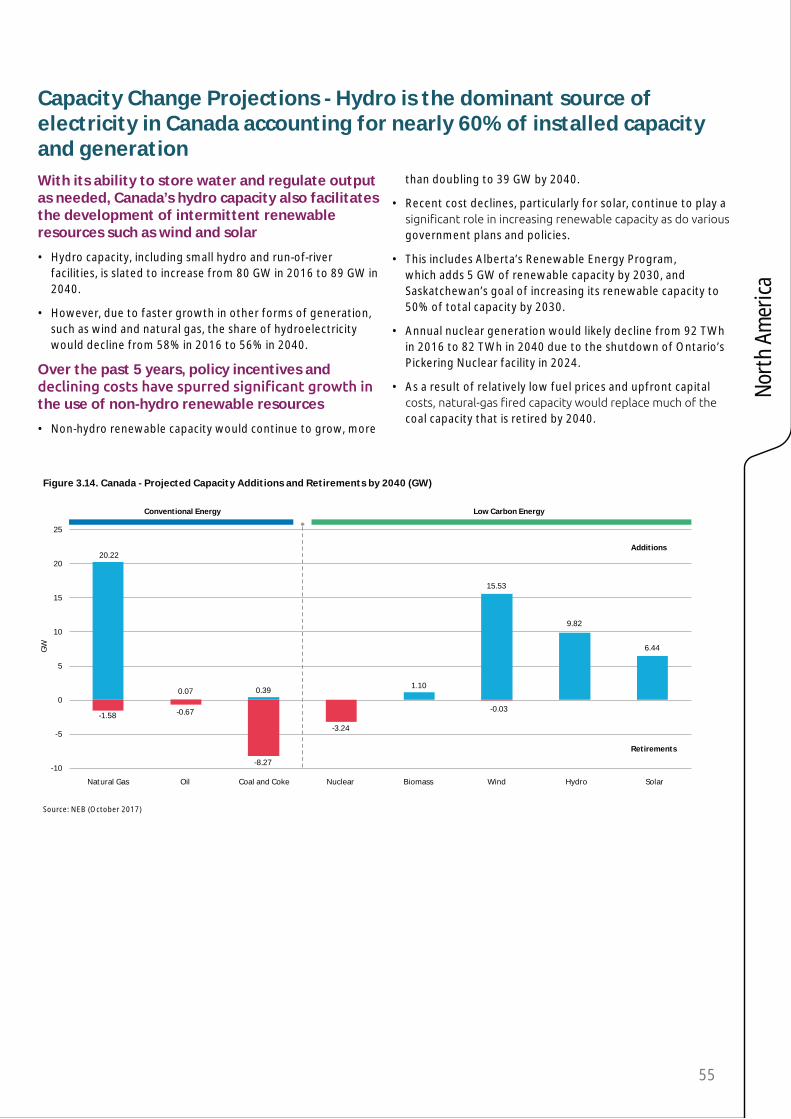
55
Nort
h Am
eric
a
Capacity Change Projections - Hydro is the dominant source of electricity in Canada accounting for nearly 60% of installed capacity and generationWith its ability to store water and regulate output as needed, Canada’s hydro capacity also facilitates the development of intermittent renewable resources such as wind and solar
• Hydro capacity, including small hydro and run-of-river facilities, is slated to increase from 80 GW in 2016 to 89 GW in 2040.
• However, due to faster growth in other forms of generation, such as wind and natural gas, the share of hydroelectricity would decline from 58% in 2016 to 56% in 2040.
Over the past 5 years, policy incentives and
the use of non-hydro renewable resources
• Non-hydro renewable capacity would continue to grow, more
than doubling to 39 GW by 2040.
• Recent cost declines, particularly for solar, continue to play a
government plans and policies.
• This includes Alberta’s Renewable Energy Program, which adds 5 GW of renewable capacity by 2030, and Saskatchewan’s goal of increasing its renewable capacity to 50% of total capacity by 2030.
• Annual nuclear generation would likely decline from 92 TWh in 2016 to 82 TWh in 2040 due to the shutdown of Ontario’s Pickering Nuclear facility in 2024.
• As a result of relatively low fuel prices and upfront capital
coal capacity that is retired by 2040.
Figure 3.14. Canada - Projected Capacity Additions and Retirements by 2040 (GW)
Natural Gas Oil Coal and Coke Nuclear Biomass Wind Hydro Solar
20.22
0.07 0.391.10
15.53
9.82
6.44
-1.58 -0.67
-8.27
-3.24
-0.03
-10
-5
0
5
10
15
20
25
GW
Conventional Energy Low Carbon Energy
Additions
Retirements
Source: NEB (October 2017)

56 A Strategic Overview of the Global Energy Markets
Driven by equivalency agreements in Saskatchewan, New Brunswick and Nova Scotia, part of the traditional coal capacity would remain in place after 2030, to be used sparingly till 2040
Figure 3.15. Canada - Coal-fired Generating Capacity by Province, 2015-2040 (GW)
0%
10%
20%
30%
40%
50%
60%
70%
80%
0
2
4
6
8
10
12
GW
2015 2016 2017 2018 2019 2020 2021 2022 2023 2024 2025 2026 2027 2028 2029 2030 2031 2032 2033 2034 2035 2036 2037 2038 2039 2040
Fleet Capacity Utilization
Alberta Nova Scotia New Brunswick
Saskatchewan Saskatchewan CCS
Source: NEB (October 2017)
Capacity Change Projections - Canada’s federal regulations apply a strict emissions performance standard to coal units that have reached the end of their useful lives, essentially requiring them to be shut
Multiple initiatives, at both federal and regional level continue to indicate a considerable decline in coal capacity by 2040
• In 2015, Alberta announced plans to accelerate the phase out
out by 2030.
• In autumn 2016, the federal government announced its intention to amend its existing coal regulations to phase out
of their economic lives.

57
Nort
h Am
eric
a
Ideological deterrents and the way forward
The current political climate, further aggravated by a persistent ‘not-in-my-backyard’ sentiment,
energy generation levels. The uncertainty underlying the federal regulatory process is a deterrent to development, thereby hindering the possibility of greater economic growth.
However, amid all the ambiguity, continued and growing interest in accommodating distributed energy resources highlights a move to put modern grid capabilities to the test
Continued penetration across states laying the groundwork
Arizona California Hawaii New York Illinois
Value-of-solar established
an alternative to net
energy metering (NEM),
and the recent APS rate
settlement involves
transitioning all new retail
customers to a time-of-
use (TOU) or demand-
based rate by default,
beginning in 2018
Residential Rate Reform
includes implementing
a new minimum bill
and transitioning all
residential customers
to opt-out TOU rates,
beginning in 2018
Grid Modernization
Strategy prescribes
aggressive investments
in network
infrastructure upgrades
to accommodate
extraordinary recent
growth in DERs, with far
more expected in order to
achieve 100% renewables
by 2045
Reforming the Energy
Vision is proceeding
rapidly, transforming the
utility business model and
delivering on aggressive
grid modernization
initiatives, to set the stage
for a distributed low-
carbon electricity system
in the future
Recent legislative
developments are
combining elements of
traditional ratemaking
with performance-
based rates to create
incentives for utilities
to make incremental
network upgrades, while
directly encouraging DER
investments via NEM
and renewable portfolio
standard (RPS) carve-outs
for Illinois-sited resources

58 A Strategic Overview of the Global Energy Markets
4-Supply & Final Customer
US retail electricity sales fell by 80 billion kWh in 2017, to the second-lowest level since the recession in 2009
• Most of the year-over-year changes in sales in 2017 were attributable to changes in weather.
•
• Consumer spending on electricity was the lowest ever recorded, while the share of household expenses on energy costs also drifted near an all-time low.
The upsurge in transmission investment is being driven by the fundamental aim of
via improved grid operations and clean energy
• The driving factors include the need to replace and upgrade aging power lines, resiliency planning in response to potential threats (both natural and caused by humans), the integration of renewable resources, and congestion reduction.
• The corporate renewable PPA trend is likely to continue
share lessons learned, and set aggressive goals.
Prices remained subdued in 2017 but, unlike in 2016, average retail prices witnessed a modest rise across most regions
• The surge was primarily driven by fuel cost and infrastructure expenditure.
• average usage of electricity, due to milder weather.
• have the highest residential electricity prices in the nation.
Natural gas prices have witnessed variances relative to competitiveness with other generation fuels
• Higher natural gas prices contributed to a 6% year-on-year decline in natural gas consumption for power generation, as coal became more competitive with natural gas.
Retail electricity: In 2017, US electricity sales plummeted, to the second-lowest level since the recession in 2009
Figure 4.1. US - Retail Electricity Sales and Sales By Sector, 2005-2017 (billion KWh)
2005 2006 2007 2008 2009 2010 2011 2012 2013 2014 2015 2016 2017
0
200
400
600
800
1,000
1,200
1,400
1,600
1379
1349
946
8
Residential Commercial Industrial Transportation
Bill
ion
kWh
US - Retail Electricity Sales by Sector
2005 2006 2007 2008 2009 2010 2011 2012 2013 2014 2015 2016 2017
3,500
3,550
3,600
3,650
3,700
3,750
3,800
Bill
ion
kWh
-5%
-4%
-3%
-2%
-1%
0%
1%
2%
3%
4%
5%
US - Retail Electricity Sales (All Sectors)
Evo
luti
on
(%)
36613670
3765
3734
3597
3755 3750
3695
3725
3765 3759 3762
3682
-2.14%
Source: US EIA (July 2018)

59
Nort
h Am
eric
a
US retail electricity sales fell by 80 billion kWh in 2017, with total sales identical to the levels
the residential, commercial, and industrial sectors
• Apart from, factors such as electricity prices, energy
use of electricity in each sector, most of the year-over-year changes in sales in 2017 were attributable to the weather.
• Cooling degree days (indicator of cooling-related energy demand) were 9% lower in 2017 year-over-year, indicating a cooler summer and less demand for air conditioning.
• Heating degree days (indicator of heating-related energy demand) were 1% lower in 2017 year-over-year; in the Southern census region (from Texas to Delaware), heating degree days were 8% to 10% lower than in 2016.
Consumer spending on electricity was the lowest in history, while the share of household expenses on energy costs also drifted near an all-time low
• Consumer spending on electricity contracted marginally in 2017 to 1.3% of personal consumption expenditure, down from 1.4% in 2016.
• electricity costs a modest part of total consumer expenditure.
•
• The most competitive power purchase agreements came in at just over US$20/MWh for solar, while wind power purchase agreements executed in the US wind belt averaged an estimated US$17/MWh in 2017.
Electricity Prices: Prices remained subdued in 2017 but, unlike in 2016, average retail prices witnessed a modest rise across most regionsRetail electricity prices have increased across the US, despite the drop in electricity usage
• Retail residential electricity prices have witnessed a 4% rise over the last decade, with sharper increases across some areas, e.g., prices in Oregon have surged by ~40% over the last 10 years, while marginal changes have been reported in Florida.
• In 2017, prices witnessed a 2.6% increase, driven primarily by
two factors.
– The early 2017 increase in residential electricity prices can be attributed to the rising costs of fuels used for generating power, e.g., H1 2017 natural gas prices for electric generators were 37% higher year-on-year.
– Power utilities continued the trend of increasing their expenditure on infrastructure for the transmission and distribution of electricity.
Figure 4.2. US - Average Electricity Price and Prices By Sector, 2005-2017 (2017 cents per KWh)
2005 2006 2007 2008 2009 2010 2011 2012 2013 2014 2015 2016 2017-2%
0%
2%
4%
6%
8%
10%
6
7
8
9
10
11
US
Cen
ts p
er k
Wh
Evo
luti
on
(%)
8.14
8.909.13
9.749.82 9.83 9.90 9.84
10.07
10.44 10.4110.27
10.54
2.6%
US - Average Electricity Price (All Sectors)
5
6
7
8
9
10
11
12
13
14
US
Cen
ts p
er k
Wh
2005 2006 2007 2008 2009 2010 2011 2012 2013 2014 2015 2016 2017
6.91
12.90
10.68
9.67
Residential Commercial Industrial Transportation
US - Average Electricity Price by Sector
Source: US EIA (July 2018)

60 A Strategic Overview of the Global Energy Markets
due to milder weather
Electricity Prices: Hawaii has the most expensive residential electricity but expenditure is highest in South Carolina
On average, electricity prices certainly seem to be on an upwards trajectory, with notable variations across states
• Prices in the East North Central and West North Central regions have risen faster and more steadily than in other regions.
• Prices in the West South Central states have remained comparatively low.
highest residential electricity prices in the nation
• Hawaii’s high prices are primarily driven by higher fuel costs,
for consumers and businesses
Figure 4.3. US - Average Electricity Price - Variations By State, 2017 (2017 cents per kWh)
7.00 to 9.009.01 to 10.0010.01 to 12.00 12.01 to 15.00 15.01 and Higher
16.148.18
8.30
8.92
8.44
7.75
8.76
8.12
8.98
8.55
8.66
7.94
9.00
8.29
9.89
9.94
9.75
9.33 9.61
9.19
9.83
9.02
9.16
9.64
9.15
9.26
9.71
9.83
9.98
9.54
9.28
10.71
10.65
10.58
11.39
10.53
10.16
11.05
12.94
14.78
14.57
19.52
26.07
10.9911.8112.00
13.38
16.16
17.62
16.1416.44
Price Ranges(cents per KWh)
US ~ Average Electricity Retail Prices ~ Variations By State, 2017(cents per KWh)
US Cents 10.54 per KWh
National Average, 2017
Ark
ansa
sId
aho
Iow
aK
entu
cky
Loui
sian
aN
evad
aO
klah
om
aO
reg
on
Texa
sU
tah
Was
hing
ton
Wes
t V
irg
inia
Wyo
min
g
Ala
bam
aC
olo
rad
oG
eorg
iaIll
ino
isIn
dia
naM
issi
ssip
pi
Mis
sour
iM
ont
ana
Neb
rask
aN
ew M
exic
oN
ort
h C
aro
lina
No
rth
Dak
ota
Ohi
oSo
uth
Car
olin
aSo
uth
Dak
ota
Tenn
esse
eV
irg
inia
Ari
zona
Del
awar
eD
ist.
of
Co
lum
bia
Flo
rid
aK
ansa
sM
aryl
and
Mic
hig
anM
inne
sota
Pen
nsyl
vani
aW
isco
nsin
Mai
neN
ew J
erse
yN
ew Y
ork
Ver
mo
nt
Ala
ska
Cal
ifo
rnia
Co
nnec
ticu
tH
awai
iM
assa
chus
etts
New
Ham
psh
ire
Rho
de
Isla
nd
0
5
10
15
20
25
30
US
Cen
ts p
er K
Wh
US ~ Average Electricity Retail Prices ~ Variations By State, 2017
Variation Range
Average Electricity Price, 2017 National Average, 2017
Source: Global Energy Institute (February 2018)

61
Nort
h Am
eric
a
Electricity Prices: Falling generation costs are expected to
through 2050
Natural gas prices are likely to have the highest
2050
• Average electricity prices are expected to remain relatively
2050.
• Generation costs represent the largest share of the price of
electricity, and are projected to decrease by 10% from 2017 to 2050 in response to continued low natural gas prices and increased generation from renewables.
• Transmission and distribution costs are likely to increase by 24% and 25% respectively by 2050, driven by the need to replace aging infrastructure and upgrade the grid to accommodate changing reliability standards.
Figure 4.4. US - Projected Average Electricity Price and Prices By Service Category, 2010-2050 (2017 cents per KWh)
2010 2015 2020 2025 2030 2035 2040 2045 2050
9
10
11
12
US
Cen
ts p
er K
Wh
US ~ Projected Average Electricity Price
Projection Reference ~ EIAAnnual Energy Outlook 2018
Reference Year ~ 2017
2017 2020 2030 2040 2050
0
1
2
3
4
5
6
7
8
9
10
11
12
US
Cen
ts p
er K
Wh
2.98 3.163.70 3.80 3.73
1.31 1.441.57 1.65 1.64
6.256.32
5.96 5.74 5.62
10.9210.54 11.23 11.19 10.99
US ~ Projected Average Electricity Prices by Service Category
Distribution Transmission Generation
Projections
Source: US EIA Annual Energy Outlook, 2018
Natural Gas Consumption Projections: Growth is likely to be driven by industry and the demand for electricity
Consumption in the residential and commercial sectors would remain
• Natural gas consumption for electricity generation is expected to increase, but at a slower rate than in the industrial sector, supported by the scheduled expiration of renewable tax credits in the mid-2020s.
• counterbalance demand growth would keep residential and commercial sector
• Although the overall share remains relatively small, use in the transportation sector, particularly for freight and marine shipping, is expected to increase.
Figure 4.5. US - Projected Natural Gas Consumption By End-use Sector, 2005-2050 (trillion cubic meter)
0
50
100
150
200
250
300
350
400
2005 2010 2015 2020 2025 2030 2035 2040 2045 2050
Trill
ion
Cub
ic M
ete
r
Residential Commercial Industrial Electric Power
US ~ Projected Natural Gas Consumption By End-use Sector
Projection Reference ~ EIAAnnual Energy Outlook 2018
Reference Year ~ 2017
Source: US EIA Annual Energy Outlook, 2018

62 A Strategic Overview of the Global Energy Markets
Natural Gas Prices: Of the two largest sectors of natural gas consumption, industry and electricity, the latter is more responsive to prices, due to more fuel optionsNatural gas prices have witnessed variances relative to competitiveness with other generation fuels
• Higher prices in 2017 contributed to less natural gas consumption for power generation.
• In the Northeast, which tends to have large price spikes during periods of cold weather, new pipeline capacity, along with warmer winter weather, helped to moderate price volatility.
• However, record cold temperatures at the end of December 2017 in the Eastern US drove record demand for natural gas
• Until the last few days of 2017, relatively warm winter weather in the rest of the US limited natural gas consumption growth in the residential and commercial sectors, year-over-year.
• However, higher natural gas prices contributed to a 6% year-on-year decline in natural gas consumption for power generation, as coal became more competitive with natural gas.
Overall prices at key regional trading hubs were less volatile year-over year, as pipelines that came
Figure 4.6. US - Average Natural Gas Price By End-use Sector, 2005-2017 (US$ per cubic meter)
2005 2006 2007 2008 2009 2010 2011 2012 2013 2014 2015 2016 20170.00
0.10
0.20
0.30
0.40
0.50
0.60
-15%
-10%
-5%
0%
5%
10%
15%
0.450.48 0.46
0.490.43 0.40 0.39 0.38 0.36
0.390.37 0.35
0.39
US ~ Average Natural Gas Price ~ Residential Sector
US$
per
Cub
ic M
eter
Evo
luti
on
(%)
US$
per
Cub
ic M
eter
Evo
luti
on
(%)
US$
per
Cub
ic M
eter
Evo
luti
on
(%)
US$
per
Cub
ic M
eter
Evo
luti
on
(%)
9.3%
2005 2006 2007 2008 2009 2010 2011 2012 2013 2014 2015 2016 2017
0.300.28 0.27
0.34
0.19 0.19 0.180.14
0.160.20
0.14 0.120.15
0.00
0.05
0.10
0.15
0.20
0.25
0.30
0.35
0.40
-50%
-40%
-30%
-20%
-10%
0%
10%
20%
30%
US ~ Average Natural Gas Price ~ Industrial Sector
2005 2006 2007 2008 2009 2010 2011 2012 2013 2014 2015 2016 2017
0.400.42
0.400.43
0.36 0.33 0.310.29 0.29
0.310.28 0.26 0.28
8.4%
0.000.050.100.150.200.250.300.350.400.450.50
-20%
-15%
-10%
-5%
0%
5%
10%
15%
US ~ Average Natural Gas Price ~ Electricity Sector
2005 2006 2007 2008 2009 2010 2011 2012 2013 2014 2015 2016 2017
US ~ Average Natural Gas Price ~ Commercial Sector
0.00
0.05
0.10
0.15
0.20
0.25
0.30
0.35
-60%-50%-40%-30%-20%-10%
0%10%20%30%40%
17.6%
17.7%
Source: US EIA (July 2018)
Transmission Investment - Current capital expenditure plans suggest that investment will peak at US$23.9 billion in 2018
The upsurge in investment is being driven by the utility’s fundamental aim of providing reliable,
improved grid operations and clean energy
• According to the Edison Electric Institute, investor-owned utilities and independent transmission developers spent an estimated US$22.9 billion on electricity transmission in 2017, a 10% rise year-over-year, and a 91% rise since 2011.
• Driving factors include the need to replace and upgrade aging power lines, resiliency
Figure 4.7. US - Transmission Investment by Investor-owned Utilities and Independent Transmission Developers, 2011-2020 (US$ billion)
2011 2012 2013 2014 2015 2016 2017 2018 2019 2020
12.0
15.1
19.7 20.2 20.822.9
23.9
22.621.6
17.2
0
5
10
15
20
25
30
US$
Bill
ion
(No
min
al)
-10%
-5%
0%
5%
10%
15%
20%
25%
30%
Evo
luti
on
(%)
Forecast
Source: BNEF - Sustainable Energy in America Factbook, 2018
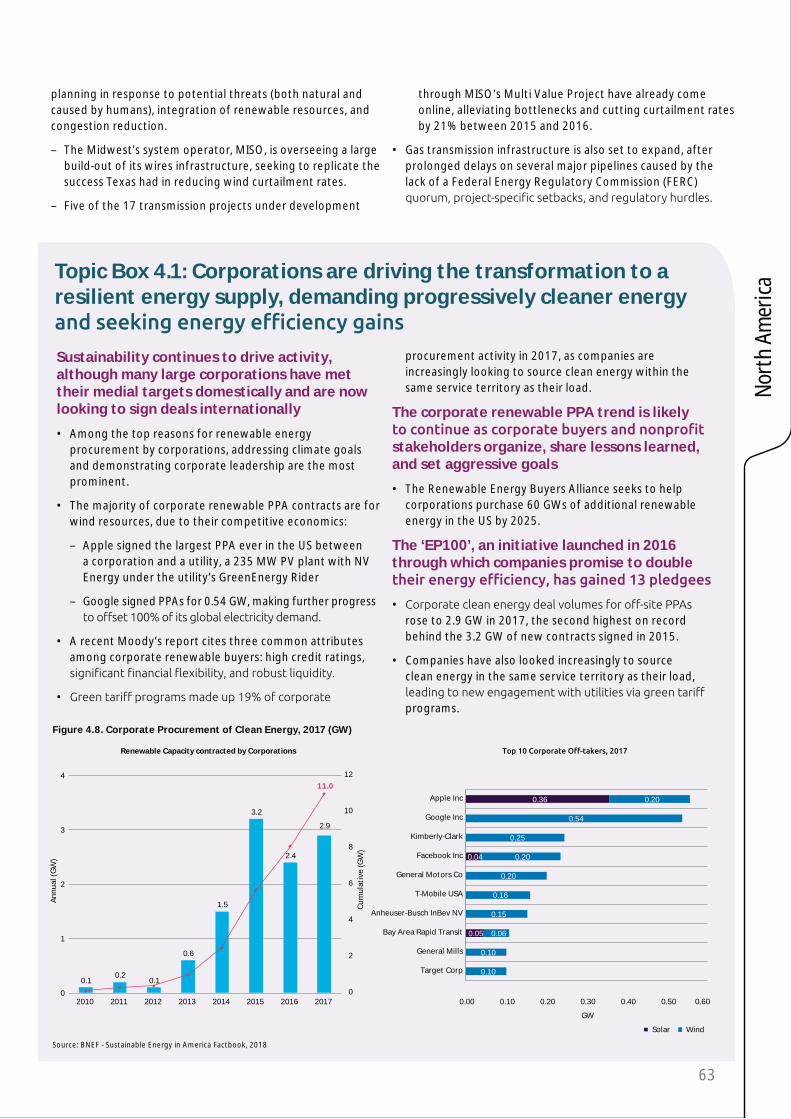
63
Nort
h Am
eric
a
planning in response to potential threats (both natural and caused by humans), integration of renewable resources, and congestion reduction.
– The Midwest’s system operator, MISO, is overseeing a large build-out of its wires infrastructure, seeking to replicate the success Texas had in reducing wind curtailment rates.
– Five of the 17 transmission projects under development
through MISO’s Multi Value Project have already come online, alleviating bottlenecks and cutting curtailment rates by 21% between 2015 and 2016.
• Gas transmission infrastructure is also set to expand, after prolonged delays on several major pipelines caused by the lack of a Federal Energy Regulatory Commission (FERC)
Topic Box 4.1: Corporations are driving the transformation to a resilient energy supply, demanding progressively cleaner energy
Sustainability continues to drive activity, although many large corporations have met their medial targets domestically and are now looking to sign deals internationally
• Among the top reasons for renewable energy procurement by corporations, addressing climate goals and demonstrating corporate leadership are the most prominent.
• The majority of corporate renewable PPA contracts are for wind resources, due to their competitive economics:
– Apple signed the largest PPA ever in the US between a corporation and a utility, a 235 MW PV plant with NV Energy under the utility’s GreenEnergy Rider
– Google signed PPAs for 0.54 GW, making further progress
• A recent Moody’s report cites three common attributes among corporate renewable buyers: high credit ratings,
•
procurement activity in 2017, as companies are increasingly looking to source clean energy within the same service territory as their load.
The corporate renewable PPA trend is likely
stakeholders organize, share lessons learned, and set aggressive goals
• The Renewable Energy Buyers Alliance seeks to help corporations purchase 60 GWs of additional renewable energy in the US by 2025.
The ‘EP100’, an initiative launched in 2016 through which companies promise to double
• rose to 2.9 GW in 2017, the second highest on record behind the 3.2 GW of new contracts signed in 2015.
• Companies have also looked increasingly to source clean energy in the same service territory as their load,
programs.
Figure 4.8. Corporate Procurement of Clean Energy, 2017 (GW)
0.10.2
0.1
0.6
1.5
3.2
2.4
2.9
2010 2011 2012 2013 2014 2015 2016 20170
1
2
3
4
Ann
ual (
GW
)
11.0
0
2
4
6
8
10
12
Cum
ulat
ive
(GW
)
Renewable Capacity contracted by Corporations
0.00 0.10 0.20 0.30 0.40 0.50 0.60
Target Corp
General Mills
Bay Area Rapid Transit
Anheuser-Busch InBev NV
T-Mobile USA
General Motors Co
Facebook Inc
Kimberly-Clark
Google Inc
Apple Inc
0.05
0.04
0.36
0.10
0.10
0.06
0.15
0.16
0.20
0.20
0.25
0.54
0.20
Solar Wind
GW
Source: BNEF - Sustainable Energy in America Factbook, 2018

64 A Strategic Overview of the Global Energy Markets
5-New Business Models & Services
and accelerated disruption, with utilities reacting more aggressively to technological advances
• Energy and utilities companies must now address two seemingly contradictory requirements: the need to innovate and the need to economize.
rising costs, and ever-weakening credit metrics, driven by competition from evolving distributed energy models have been causing utilities to enter a ‘Death Spiral’
• Although the underlying risks persist, key opportunities exist that could avoid the foregone conclusion and trigger new streams for utilities.
disruption, with utilities reacting more aggressively to technological advances
Energy and utilities companies must now address two seemingly contradictory requirements: the need to innovate and the need to economize.
Rise of renewable energy, innovations in battery storage, increased electric vehicles adoption, new grid transformation models and interactive consumers continue to signal an era of accelerated transformation on the horizon
Sustained electric generation transformation is being driven by carbon concerns and other environmental
Grid transformation is gaining prominence amid disruptive forces getting further integrated with consumer preferences
The evolution of distributed generation on customer premises continues to drive the modernization of electric
distributed generation and customer battery storage
While distributed generation represents only about 1% as-on-date, it is expected that over the next decade as
much greater market share
Despite a risk abound to ratings, corporate transformations (M&A) are witnessing a revival, albeit a slower rate, with capital spending expected to remain elevated to serve futur infrastructure needs
The rise of prosumers coupled with the ever-present risks from disruptive entrants has triggered the adoption of new ‘energy-as-a-service’ model
• Per IDC, in two years, by 2020, more than 9 out of 10 utilities will have deployed Energy or Comfort-as-a-Service models to better serve their Commercials and Industrials (C&I) and residential customers.
• Focus remains critical on uncoordinated, siloed initiatives that inhibit the transformation.
• potential and executing the resulting roadmaps centered on business outcomes will be key for utilities’ future success.
• Disruptive non-utility sector entrants like Apple, Google and Amazon continue to cause radical transformation of the sector.

65
Nort
h Am
eric
a
The Triggers driving transformation
Disruption to energy models and associated grid
of digitization
• According to World Economic Forum1, “The digitalization of electricity could unlock US$3.1 trillion in industrial and
stem from value creation for customers and a reduction in emissions.”
• Deployment of low-powered sensors, analytics, and big data platforms designed to manage massive amounts of industrial machine data, enabling lower cost of operation, better asset
decisions, and bidirectional interactions with prosumers.
Edge and cloud driving industrial innovation
• Proliferation of powerful edge devices that service real-time applications response needs, with cloud providing data consolidation, massive analytic capabilities and profound business insights that help drive more sophisticated enterprise-wide decision making.
• Advanced analytics continues to drive real time monitoring of assets for optimal maintenance management while connecting multiple sites (fossil plants, wind farms, hydro, nuclear) and distributed assets (T&D substation and other
management business decisions.
Collaborative Robots in practical applications
• According to IDC2, “By 2020, 50% of all electricity transmission and distribution utilities will be using drones to evaluate service lines, thus reducing asset and inspection costs and achieving savings of up to 5% and 30%, respectively.”
• The key areas of application would pertain to safety at
the electricity network, connecting equipment health and maintenance apps like asset performance management with
the maintenance.
• “AI will be the brain of the future smart grid. The technology will continuously collect and synthesize overwhelming amounts of data from millions of smart sensors nationwide to make timely decisions on how to best allocate energy resources. Additionally, the advances made from ‘deep learning’ algorithms, a system where machines learn on their own from spotting patterns and anomalies in large data sets, will revolutionize both the demand and supply side of the energy economy.” - Harvard University3.
• The stage is set for AI applications to become a reality by combining insights from massive machine data collection with analytic models and analysis that can automate decisions in a power and utility environment.
weakening credit metrics, driven by competition from evolving distributed energy models have been causing utilities to enter a ‘Death Spiral’
Traditional business models in the utilities sector have been coming under pressure, primarily due to a convergence of factors including, technological changes, falling costs of distributed generation and other distributed energy resources and increased competition
• Rising prices continue to trigger ever-reinforcing incentives for customers to switch for cheaper power.
• Utility bond ratings have slipped gradually since 1970,
• Investor-owned utility capital spending on distribution and transmission infrastructure has doubled since 2006, while power sales has been witnessing a slump.
In an article from 2015, William Pentland of Forbes argues that “the predicted casualties of the death spiral have turned out to be the victors and the predicted victors have turned out to be the casualties.” In this case, the “victors” are the utility companies and the “casualties” are the distributed renewable energy companies. SunEdison, for instance, a supposed “victor” in the report, had lost more than two-thirds of its market value in 2015.
US utilities have been actively innovating traditional business models of one-way power delivery, and must continue to focus on value creation in order to avoid the ever-increasing risks…
A monumental transition to incorporate evolving business models will be crucial for utilities in the years ahead - Embracing alternative energy technologies and grid modernization entails not only new infrastructure, but new business models that generate returns by maximizing customer value.
Although the underlying obsolescence risks persist, key opportunities exist that could buck this downward trend and trigger new streams for utilities…
1 World Economic Forum (2018): "Electricity: uncovering value through digital transformation"
2 IDC (2018): Utilities' new business models, IDC White Paper
3 Harvard University (2018), "How Artificial Intelligence will revolutionnize the Energy Industry"

66 A Strategic Overview of the Global Energy Markets
The advent of disruptive business models…
The Key: evolving portfolios The Drivers The Future: As-a-Service gaining prominence
• The rise of prosumers coupled with the ever-present risks from disruptive entrants has triggered the adoption of new ‘Energy-as-a-service’ model
• Almost four out of ten utilities believe that within the next three to four years, the impact of new products and services will range from 5% to 9% of their total revenues
• Focus remains critical on uncoordinated, siloed initiatives that inhibit the transformation
• Utilities continue to leverage
energy and digital technologies to reshape and grow their business
• on revenues is expected to be driven by electric vehicle (EV) services, generation and storage @home, and microgrid-as-a-service
• However, energy-as-a-service and comfort-as-a-service will likely be the top margin contributors
• Beyond the meter services: Energy-as-a-service (solar/storage) and Comfort-as-a-service/Smart Home
• Emergence of ‘Energy Aggregators’, providing bundled services, beyond the traditional portfolio
• Energy or Comfort-as-a-Service deployement to better serve their C&I and residential customers
• element
• scenarios that include smart mobility/charging infrastructure
• Smart Building/Smart City/Smart Grid
Energy price volatility has emerged as a major issue for large-scale consumers from the commercial
energy sourcing comes as a consequence of both regulation and corporate social responsibility targets.
traditional utilities to intermediaries, aggregators and digital platform providers - Utility CIOs have
emergence of smart home technology giants (Apple, Google and Amazon), digital ecosystems and virtual assistants are increasingly tempting retail customers to choose new energy-provisioning solutions.
Beyond the meter: Energy/Comfort As-a-service delivery model and ideals gaining prominence…
Figure 5.1. As-a-Service Ideals
Using platform-based solutions, DevOps, and API ecosystems for more agile, less exception-oriented systems
Understanding the business context to reimagine processes aligned with meeting client needs
Orienting governance to source expertise from all available sources, both internally and externally, to address capability gaps
Applying analytics models, techniques, and insights from big data in real-time
Using automation and cognitive computing to blend analytics, talent, and technology
Ensuring relationships are contracted to drive sustained
outcomes
Proactively managing digital data across service chain of people, systems, and processes
Plugging into “ready to go” business-outcome-focused people, process, and technology solutions with security measures
Source: HfS, 2017
Design thinking, intelligent automation, actionable and accessible data, and plug-and-play digital services are rapidly getting adopted in utility operations, with elements of "As-a-Service" ideals becoming pervasive in new contracts
• "As-a-Service" implies engagements that are rooted in more collaboration and focused on bringing together people, process, and technology in services, while also leveraging analytics, plug-and-play platforms, and intelligent automation, and bringing outside-in perspectives and capabilities to deal with the challenges the industry faces.

67
Nort
h Am
eric
a
• "Energy-as-a-service" and "Comfort-as-a-service" has already been deployed by approximately three quarters of organizations (74% and 79% respectively).
– Depth of the services (integrated client asset management
the capability of utilities and contenders to take risks.
Innovative disruption is being driven from outside of the traditional utility operators
• Alevo, Acquion Energy and Tesla, changing the expectations for residential and utility scale storage.
• Coupled with new power generation formats (e.g., wind and solar) could increase the revenue of existing utilities by
between US$60 billion and US$100 billion by 2025.
• New customer experience expectations from outside of the utilities market, driven by companies as Google, Facebook,
Case: Pepco, Maryland
• Plans to build or buy 700 kW of solar generation at a price capped at US$1,650 per kilowatt with recovery to start January 1, 2019 at a 10.5% ROE.
• The settlement allows the company to initiate a 50 MW battery storage project at costs capped at US$2,300/kW, while deploying a minimum of 530 electric vehicle charging stations at an investment of up to US$8 million, to be recovered over four years after 2021.
Energy Storage: State policies investigating and promoting the trend are boosting adoption rates across North America and radically transforming the sector
Trend - Wood Mackenzie estimates that the annual value of the US energy storage market will exceed US$1.2 billion in 2019
• North America stands among the leaders in commercial and demonstration grid-scale energy storage projects; energy storage market grew 27% in 2017, with 431 MWh deployed.
• Per GTM Research, 100 MWh of grid-connected energy storage were deployed in Q4 2017, marking 1,080 cumulative MWh deployed between 2013 and 2017; while expecting that the US market will almost double this total in 2018 alone, with more than 1,000 MWh of energy storage forecast to be deployed.
• Despite the front-of-meter market gaining the largest share of deployments, the behind-the-meter market made
deployments in both the residential and non-residential segments.
• Use Cases:
– The State of California: led the way, primarily in the behind-the-meter demand charge management, driven by its Self-Generation Incentive Program (SGIP), which will likely boost behind-the-meter energy storage deployments over
– Passed in August 2018, the ‘Senate Bill 700’ bill would authorize the continuation of SGIP through 2025, with funding to supply roughly US$166 million per year in incentives for qualifying behind-the-meter technologies, or US$830 million total, enough to help add about 3,000 MW of behind-the-meter batteries to the state by 2026.
– Another driving factor is turning to peaking capacity aimed at replacing gas - the aftermath of the 2015 gas leak at Aliso Canyon, California, which led to around 100 MW of energy storage projects being developed quickly
as a local capacity resource.
– In January 2018, the state regulator, the California Public Utilities’ Commission (CPUC) issued Resolution
one of California’s three main investor-owned utilities (IOUs), to “procure energy storage or preferred
reliability”.
– Energy-Storage.News (2018) has reported in the past on the potential of energy storage to displace peaker plants
citing batteris as “an economically attractive substitute
peaking plants, especially when deployed on a distributed basis and owned and operated by the electric utility”.
– Other markets such as Hawaii, Massachusetts and New York
– In Q1 2018, First Solar beat out natural gas peakers in Arizona with its solar-plus-storage system that uses a 50 M battery to store energy for evening peak hours uses.
Drivers
• Falling prices for lithium-ion batteries, due to demand from electric vehicles, and a decline in balance-of-system costs driving energy storage cost competitiveness.
– Lithium-ion held 98.8% market share in Q4 2017, leading the market for the 13th straight quarter.
• Advances in energy storage technology, in particular battery
• Growing constraints on the development of new transmission increased need for new transmission to manage integration elevates storage as an alternative.
1 Green Tech Media, 2018

68 A Strategic Overview of the Global Energy Markets
Figure 5.2. US - Select Policy Actions
New YorkJanuary 2018: Announced a target of 1.5 GW of energy storage by 2025
MassachusettsJune 2017: The Massachusetts Department of Energy Resources set an energy storage target of 200 MWh by 2020
New Jersey
Maryland
North Carolina
New Mexico
Arizona
Washington
Oregon
Nevada
California
storage.
Source: EIA (May 2018)
Energy Storage: To date, California has introduced number of measures related to energy storage
• As of May 2018, three states besides California have set storage mandates/targets.
• Some states allow storage systems to be included in renewable portfolio standards.
• incentives for energy storage including grants, support for pilot projects, and tax incentives.
• Many states require utilities to produce integrated resource plans that demonstrate each utility’s ability to meet long-term demand projections using a combination of generation,
minimizing costs: Arizona, California, Connecticut, Colorado, Florida, Indiana, Kentucky, Massachusetts, New Mexico, North Carolina, Oregon, Utah, Virginia, and Washington.
– Incorporating storage into these plans can be a challenge
and demand-side resource.
Solar’s growth in Energy-as-a-Service: Net metering (letting homeowners sell excess power back to the grid, driven by solar) triggered a
system
California has witnessed the highest progress…
• utility-scale solar and rooftop solar, California has helped more than half a million customers go solar since 2007.
• California regulators predict that, by 2020, 85% of customers in the state will be using electricity from entities other than investor-owned utilities.
In many locations, utility companies bundle distribution costs for electricity, and charge a uniform per-kWh rate for solar power. When this pricing model combines with net metering, solar customers receive a subsidy partially paid by other non-solar customers in their state.
According to Solar Energy Industries Association (SEIA), the cost of installing solar panels has declined more than 70% since 2010, making it a more attractive as an alternative energy source to homeowners.

69
Nort
h Am
eric
a
market, the US continues to hold its top spot in demand for, and penetration of, home automationNorth America’s installed base of smart home .8 million point solutions, designed for one
• The estimated total installed base at the end of 2016 was 21.8 million smart homes.
• This corresponds to 16.7% of all households, implying that this is the most advanced smart home market globally.
• Adoption of smart home systems is forecasted to grow at a compound annual growth rate (CAGR) of 27%, resulting in 73.0 million smart homes by 2021, reaching US$ 27.2 billion in yearly revenues, at a CAGR of 22% between 2016 and 2021.
By Q1 2018, over 32% of North American households were equipped with home automation systems, with comfort taking precedence over economy in the smart home market
• cases - primarily smart thermostats, security systems, smart light bulbs, network cameras and multi-room audio systems.
• Overall, security and safety, utilities management and wellness monitoring are the key selling points, with smart home gateways reporting the highest adoption (Q2 2017).
• There are a number of connectivity and interoperability technologies in the smart home market - many are competing for a position as the de facto standard for communication between smart home solutions.
• Cross-platform compatible and user interfaces have been gaining traction - Amazon’s Alexa service, Apple’s HomeKit platform, Google Home have been penetrating the market.
Key Drivers Key Barriers
advancements in digital analytics platforms, and people living longer but with chronic health issues
Lack of consumer awareness, and inability of security systems installed in smart homes to prevent crimes
• Encouraging customers to become active prosumers as small-scale production and storage of energy becomes more
• The rapid drop in PV and storage prices will make it more
and storage equipment rather than purely sell commodities.
• Generation and storage @home is very appealing in countries with low population density and/or high solar radiation; Canada has the highest level of plans for deployment (90%).
• Per IDC, approximately four out of ten organizations plan to deploy it in the next two years, totaling 56% when
Smart Mobility and the Digital Edge: "Moving from the proliferation to
value generated"1
"In the US, a full transformation generates nearly four times the value of the proliferation; a key reason for the value generation is that more miles would be driven by EVs"1
• certainly contributes to a reduction in urban mobility emissions, along with stricter emissions regulations on internal combustion engines (ICEs).
• However, focusing solely on personal-use EVs will not help to achieve the current climate goals.
• In the US, cutting vehicle emissions by half would require
vehicles; current forecasts predict this percentage will not be reached until 2042.
Transformation…
• The transformation would focus on electrifying high-use
Emerging business models with expected implementation plans for the coming 24 months - generation and storage at home
1 "Electric Vehicles for Smarter Cities: The Future of Energy and Mobility", World Economic Forum, 2018

70 A Strategic Overview of the Global Energy Markets
Figure 5.3. Daily Energy Sharing Scenario
Where you work Daily Energy Sharing Scenario Where you live
WorkHome
Average EV battery capacity is 85kwh
Remaining EV Battery capacity could power a home for up to
Battery usage for daily work commute = Approx. 20% of battery capacity
EV owner still has enough to capacity to commute home for charging or to power home
Source: Capgemini Analysis (2018)
The fusion of Smart Mobility and the Digital Edge are facilitating utilities to remain relevant in today’s connected energy economy…
• EV Infrastructure (battery, plug-in hybrid, and hybrid vehicles, along with the surge in charging infrastructure) continues to disrupt the sector:
– EV Charging
– Demand Response
– Vehicle to Grid
– Settlements/Payment System
– Car Fleet Charging Services
– Security & Tamper Detection.
• Monetization of Customer-Generated Power & Excess Battery Capacity along with Data Valorization and Monetization present opportunities to avoid the risk of dis-intermediation.
The digital edge is enabling the rise and acceleration of Daily Energy Sharing Scenario driven primarily by the integration of technology (gateway sensors, microprocessors), connectivity (telecommunications), and power (grids, micro-grids, photovoltaic)
• It is estimated tha 40% of large enterprises will be integrating edge computing principles into their 2021 projects, up from less than 1% in 2017.
vehicles, such as shared autonomous vehicles (AVs), public
• Instead of relying on individual customers to replace their ICE with EVs, the transformation would rely on companies making capital investment decisions based on a compelling business case for EVs that operate at a lower cost per mile than ICEs at a high rate of use.
• This transformation would increase the positive impacts of EVs on the environment compared to the current model, representing up to US$60 billion by 2030 for the US alone.
• Case: In cities such as Oslo and Montreal where hydropower generates more than 95% of the electricity, with no emissions and no intermittency, EV charging would be continuously clean. Smart charging would still be useful to deal with any local constraints on the power grid, for example, to reduce the need for grid reinforcements or to shave peaks in demand.
• Case: In cities like Richmond, Virginia, in the eastern US, which is supplied by a mix of wind and conventional coal generation, charging could be timed to match the windiest times.
• Case: Cities that derive an increasing share of their electricity
supply from renewable energies, for instance, San Francisco or Houston in the US, could avoid curtailing renewables by adjusting optimal charging times and charging station locations.
Energy…
• The integration of the charging infrastructure with grid edge technologies, such as decentralized generation, storage, smart buildings and smart grids, is limited.
• Policy support in the form of dynamic pricing and other
also limited.
Initiatives…
• The Massachusetts Electric Vehicle Incentive Program incentivizes (up to US$7,500 for purchase and US$5,000 for lease) municipalities, universities, colleges and state agencies
• The city of Montreal (Canada) has created a multidisciplinary
directorates of environment, transport, urban planning, economic development, municipal properties and rolling stock management and the Montréal Transit Authority.

71
Nort
h Am
eric
a
• IoT and more immersive, interactive UIs will drive one-third of large enterprises to create or use edge locations by 2021.
Per IDC, emerging business models - EV services/infrastructure
respectively in terms of revenue expectations at industry level, although they do not top the corresponding ranking in terms of companies’ gross margins. In terms of adoption, the later is being viewed as a low-margin business model, however, coupled with Edge, the same presents strong opportunities to evolve further and integrate with the changing energy delivery dynamics.
Case: NSTAR Electric, Massachusetts
• Plans to recover US$45 million in investments to accelerate the development of electric vehicle infrastructure and up
12-megawatt energy storage facility.
New sales of battery, plug-in hybrid, and hybrid vehicles accelerated, especially new, longer-range versions of existing models
• US sales of EVs, including battery electric vehicles (BEV) and plug-in hybrid electric vehicles (PHEV), jumped to over 194,000 units in 2017, up 23% year-over-year. Overall, EVs made up 1.1% of new vehicle sales in the U.S. in 2017, up from 0.9% in 2016.
• The price of lithium-ion battery packs, a key driver of BEV pricing, crashed 23% in 2017. Pack prices tumbled 65% between 2013 and 2017-end, bringing average prices down to US$209/kWh. There are currently 47,117 public and workplace charging outlets in the US, including 6,270 fast charging outlets, up 18% in 2017, year-over-year.
Cases1
• The Volkswagen Group, under the terms of a legal settlement with the State of California and the US EPA, created a
subsidiary called Electrify America that will spend a total of US$0.8 billion over ten years to deploy charging infrastructure within California and US$1.2 billion over a decade outside California.
• Use of public procurement programmes to stimulate the initial roll-out of EVs:
– The federal government put forward in 2015 a purchase share target for electric passenger vehicles of 20% by 2020 and 50% by 2025
– The state of California, which was granted a waiver by the EPA to implement its GHG emission standards in 2009 (Federal register, 2009), has vowed to stick with the stricter rules even if federal standards are rolled back (Davenport and Tabuchi, 2018)
– In 2016 California’s governor issued an executive order to call for 1.5 million ZEVs on the road by 2025 (State of California, 2016)
– A number of private and public initiatives are considering the development of workplace chargers - Tesla has
companies and commercial property owners.
Some market observers suggest that a transformation of the transportation sector may be underway, with EVs poised to quickly replace traditional passenger vehicles in Canada
• Incentives for purchases in some provinces, as well as an EV mandate in Quebec, contribute to a steadily increasing market share for EVs.
• Higher adoption in Quebec is driven by EV mandate policy, purchase incentives, and low electricity prices.
• Ontario, B.C. and Manitoba also have higher EV sales due to their low-emitting electricity grids and vehicle purchase incentives.
Smart Buildings: 2018 witness continued growth in the usage of Internet of Things (IoT)2
Shifting customer demands, climate change mitigation and sustainability goals, power reliability and resilience concerns, and budget constraints are driving demand for intelligent building solutions
• Predictive Maintenance
– A new trend expected in 2018 is the use of predictive maintenance in facility management, using IoT sensors and other hardware devices to get a report on the state of a commercial building and all equipment.
• Air Quality Measurement
– One major trend to watch for in 2018 is how smart building air quality can have an impact on the productivity of workers.
• IoT supported Complex Applications
– Use of thermal imaging will allow facility managers to check for equipment that are outside of the temperature range; detection of ultra-sonic noises.
•
–analyze it with higher spatial resolution, improving energy-conservation Measures (ECM).
• Real-time Data Accessibility
– IoT applications allow facility managers to conduct various experiments to check the result of optimization.
1 Global EV Outlook, 2018
2 "IoT Smart building trends to look out for in 2018", Senseware 2018

72 A Strategic Overview of the Global Energy Markets
Figure 5.4. US - Projected IoT-enabled Smart Building Market, 2015-2020 (US$ billion)
2015 2016 2017 2018 2019 20200
5
10
15
20
25
30
35
40
45
50
0%
5%
10%
15%
20%
25%
30%
Rev
enu
e (U
S$ B
illio
n)
Evo
luti
on
(%)
1921
24
2935
45
Source: Statista, 2018
According to Persistence Market Research, the global building automation systems (BAS) market, led by North America, valued at US$49.2 billion in 2016, is expected to reach a market value of
(2017–2025)
Smart Grid: Modernization of the grid to accommodate complex
intelligence capabilities1
electric companies continue to manage, operate, and invest in an increasingly digital energy grid, the next step is to utilize the data being generated as a strategic asset to improve grid operations
Smart meters continue to pave the way for the transformation of the electric power system, and creating the foundation for a customer-facing, modern energy grid
• Smart meter installations have grown dramatically since 2007, with over 55% coverage of the US household by 2016-end - more than 40 electric companies in the US have fully deployed smart meters, engaging in grid resiliency and operations, integrating distributed energy resources (DERs), and providing customer solutions.
• Expanded services typically include time-based pricing, load
and web services for energy management by enabling two-
• Sensing capabilities in smart meters continue to advance, and electric companies now are collecting more complete power characteristics (e.g., voltages and reactive power) in addition
• US smart meter installations approach 76 million; projected to reach 90 million by 2020.
•
– Using sensors for temperature control; Using actuators for HVAC controls; Complex applications like providing complete energy automation for a
time communication; Considers weather forecasts to save real-time energy costs.
Trends driving smart building adoption
• Rise of “as-a-service” in real estate:
such as Salesforce.
•
• Renewed focus on space utilization and space analytics.
• Continued demand for green buildings: based on
• Data analytics are increasingly used to create value within commercial real estate building operations.
Enhancing grid reliability2
• During the historic 2017 hurricane season, smart meters
Hurricanes Harvey and Irma in August and September.
• By integrating voltage and reactive power data collected by smart meters with Distribution Management Systems (DMS), electric companies are implementing distribution automation
monitoring, and predictive asset maintenance capabilities.
1 "Electric Company, Smart Meter deployments Foundation for a Smart Grid", 2017
2 "Why aren't more focused on reducing power system losses", T&D World, 2017

73
Nort
h Am
eric
a
• Technical losses are critical in evaluating system upgrades and key assessments for the implementation of demand side and distributed energy alternatives as well as conservation programs.
• Continued adoption of smart grid technologies increases the importance of routinely evaluating system losses, assessing the numerous variables involved.
• Modernization initiatives, thus call for system upgrades to aging equipment, to ensure a stand at addressing substantial savings for the utilities.
• Besides advanced meter infrastructure (AMI) and analytics,
distribution management and automation technologies, demand management systems and energy storage are among the smart grid technologies that can help reduce power losses by leveling, reducing or improving the quality, and thereby
– Case: Ameren Services is utilizing AMI data and data management platform to calculate system losses on every part of the Ameren Illinois grid in near real time, allowing system loss studies to be coupled with valuable functions such as truing-up regional grid energy market settlement calculations.
High cost and cybersecurity are considered the primary barriers to its adoption:
Another key aspect to grid modernization is addressing the ever-present issue of technical transmission and distribution (T&D) losses, which has annually averaged close to 5% through the period 2012 to 2016
• In its 2014 study, DOE estimated historical and forecast investment in the Smart Grid as approximately US$32.5 billion between 2008 and 2017, averaging US$3.61 billion annually in the period.
• The eventual costs of a Smart Grid build-out may therefore be
• Using DOE’s estimate as a basis, a reasonable assumption
may be that Smart Grid spending by the electricity industry of approximately US$3.5 billion annually could continue through
Most electric utilities appear to view Smart Grid systems positively, even with the added concerns for cybersecurity - costs could be reduced and system resiliency improved by further integration of automated switches and sensors, even considering the cost of a more cyber-secure environment.
Despite the high costs of a formal transition, deployment of the Smart Grid continues, with a gradual modernization of the system
Case: Public Service Colorado• Embarked upon an Advanced Grid and Intelligence Initiative,
which includes infrastructure investments and other costs related to improving productivity.
• cost recovery would focus on “funding investments to better
customers more information for greater control over their energy budget, reduce system fuel and energy costs, and put in place technology to keep costs low over the long term” (Public Service Colorado).
Case: Narragansett Electric in Rhode Island• Proposed a Power Sector Transformation Plan (PSTP)
consistent with the state’s Power Sector Transformation Initiative (PSTI).
• Shifting the traditional electric utility business model to a more performance-based model, aligning incentives with customer demand and public policy.
• The company’s PSTP has four main components: investments
in advanced metering, grid modernization, electric vehicle infrastructure, and energy storage and solar demonstration projects.
Case: Duke Energy, Florida•
investments intended to enhance reliability, reduce outages, shorten restoration time, support the growth of renewable energy and emerging technologies, install advanced metering infrastructure, and upgrade company systems.
Case: Florida Power & Light Company (FPL) • Has invested heavily in energy grid modernization - physical
grid hardening, digital grid technologies, and data analytics to enhance grid resiliency and to improve its understanding of the nature and extent of outages, improving its ability to restore power when outages do occur.
• Installed 4.9 million smart meters that let the company know when individual customers are out of power and has deployed more than 83,000 intelligent grid devices and smart switches.
As Distributed Energy Resources (DERs), such as private or rooftop solar PV, energy storage systems, electric vehicles, and connected home devices like smart thermostats and smart appliances, continue to grow, electric companies need greater visibility into the performance of these systems to better
74 A Strategic Overview of the Global Energy Markets
Topic Box 5.1: Canada’s US$300 million ‘Smart City Challenge’ - one of the largest smart city challenges ever undertaken
Over 159 cities applied to the challenge, focusing on six areas: economic opportunity, empowerment and inclusion, environmental quality, healthy living and recreation, mobility and safety and security
Case in Focus: A coalition of the Toronto, Ontario and Canadian governments’ contract with Sidewalk Labs, a sister company of Google, to come up with a US$50 million design for
of land on Toronto’s waterfront
• The idea: A “smart city,” a sensor-enabled, highly
neighborhood built from the internet up” - Sidewalk Labs.
Sidewalk Toronto has been marketed as a high-tech community, prioritizing sustainability, safety, and
The innovation will be underpinned by pervasive data collection through connected sensors and personal information that people would share to access customized programs and services (Mother board, 2018).
Amenities like garbage disposal and goods delivery are to be coordinated and driven by AI and robotics.
An ongoing public engagement process involves extensive community and stakeholder consultation and long-range planning, focused on improving infrastructure and
governance policies related to data protection and privacy (Alphaville, Financial Times, 2018).
Canadian innovators and will create thousands of good, middle-class jobs. The new technologies that emerge from Quayside have the potential to improve city living—making
for Canadians and their families.” - Prime Minister Justin Trudeau.
With the project six months into a public consultation period, data transparency has been cited among the key barriers…
• Privacy watchdogs have raised concern over who will control sensitive digital information - resistance from local
sensors that may be embedded in such infrastructure as
• Also at issue are ownership rights over any products or techniques developed at the site and sold elsewhere.
• Waterfront Toronto has agreed to negotiate intellectual property ownership and digital privacy rights based on a set of “guiding principles”(Fortune, 2018).
• Data minimization (reducing the amount of data collected to a bare minimum) is another point in concern.
Despite the concerns, and delays, Sidewalk Toronto continues to present a disruptive innovation,
development at the fore.
Overall, technological change has made small-scale implementations a reality, allowing municipalities (rather than only states or regions) to independently engage in their own transformational process - utilities appear to be less eager to invest in smart city domains compared to their appetite for implementing the other new business models (IDC).
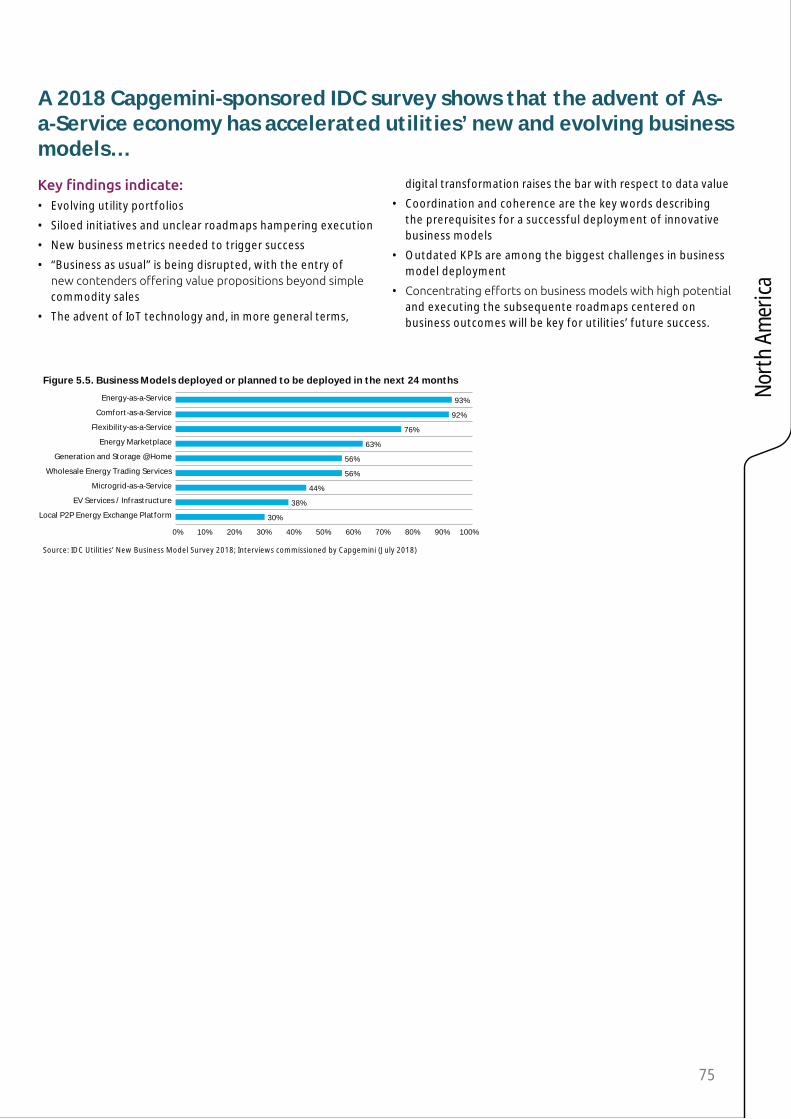
75
Nort
h Am
eric
a
A 2018 Capgemini-sponsored IDC survey shows that the advent of As-a-Service economy has accelerated utilities’ new and evolving business models…
• Evolving utility portfolios
• Siloed initiatives and unclear roadmaps hampering execution
• New business metrics needed to trigger success
• “Business as usual” is being disrupted, with the entry of
commodity sales
• The advent of IoT technology and, in more general terms,
digital transformation raises the bar with respect to data value
• Coordination and coherence are the key words describing the prerequisites for a successful deployment of innovative business models
• Outdated KPIs are among the biggest challenges in business model deployment
• and executing the subsequente roadmaps centered on business outcomes will be key for utilities’ future success.
Figure 5.5. Business Models deployed or planned to be deployed in the next 24 months
Local P2P Energy Exchange Platform
EV Services / Infrastructure
Microgrid-as-a-Service
Wholesale Energy Trading Services
Generation and Storage @Home
Energy Marketplace
Flexibility-as-a-Service
Comfort-as-a-Service
Energy-as-a-Service
30%
38%
44%
56%
56%
63%
76%
92%
93%
0% 10% 20% 30% 40% 50% 60% 70% 80% 90% 100%
Source: IDC Utilities’ New Business Model Survey 2018; Interviews commissioned by Capgemini (July 2018)

76 A Strategic Overview of the Global Energy Markets
6-Financials
Generally considered to be defensives, the utilities sector only marginally underperformed the wider market in 2017
• growth for the last few years, driven by increasing energy
• Utilities are thus expanding in renewables, midstream, and gas, while also focusing on customer base growth.
• among the key drivers for Canadian utilities.
Most analysts see the industry’s current earnings growth trend continuing over the next few years, with rising dividends and healthy balance sheets, and with regional pockets of opportunity for higher growth rates
• States are looking at alternative ratemaking approaches to encourage consideration of Distributed Energy Resources, reduce frequency of rate cases, and decouple cost recovery from load growth.
• Regulators and other stakeholders are seeking the right
of capital, innovation, regulatory lag, retention of service quality, reasonable cost of service, and rate base expansion.
Revenues: The sector’s total annual revenue in 2017 increased by US$13.4 billion, or 3.8%, year-over-year
Revenue increased for all four of the industry’s primary business segments in 2017: regulated electricity, competitive energy, natural gas distribution and natural gas pipeline
• While nationwide electricity output decreased by 0.9% after four years of marginal increases, regulated electricity revenue increased modestly in 2017, rising by US$2.0 billion, or 0.8% year-over-year.
– This segment’s share of industry revenue fell to 68.0% from 70.0% in 2016, yet remained well above the 52.1% level of 2005.
• The natural gas distribution segment experienced the largest revenue growth in both dollar and percentage terms as several natural gas-related acquisitions that closed during 2016 contributed a full year of revenue to 2017.
– These included Southern Company’s purchase of AGL Resources, Dominion Energy’s purchase of Questar, Duke
Figure 6.1. US - Revenues and associated CAGR, 2013-2017 (US$ billion)
0
5
10
15
20
25
30
35
40
Rev
enu
es (U
S$ B
illio
n)
-12.0%
-10.0%
-8.0%
-6.0%
-4.0%
-2.0%
0.0%
2.0%
4.0%
6.0%
8.0%
10.0%
7.7% 7.7%
2.4%
-0.5% -0.7%
1.5%
-1.5%
0.9%
3.2%
1.0%
-1.5%
9.8%
CA
GR
(%)
Exelon(Illinois)
Duke Energy
(North Carolina)
Southern Company(Georgia)
NextEra Energy
(Florida)&
Electric(California)
American ElectricPower(Ohio)
FirstEnergy(Ohio)
Edison International(California)
Consolidated Edison(NY)
Sempra Energy
(California)
NRG Energy(New Jersey)
The AES Corp
(Virginia)
2013 2014 2015 2016 2017 CAGR (2013-2017)
Source: Thomson Reuters EIKON Data (“Total Revenue”), Capgemini Analysis

77
Nort
h Am
eric
a
Energy’s acquisition of Piedmont Natural Gas and Black Hills’ acquisition of SourceGas Holdings.
• Revenue from regulated operations (sum of regulated electricity and natural gas distribution) has grown steadily as a percentage of industry revenue over the past decade.
Utilities have been focusing on customer base growth for the last few years after electricity consumption decreased due to energy
• Exelon, the largest hybrid utility and the largest utility by revenue, attributed earnings to regulatory rate increases and New York Zero Emissions Credits (ZEC) revenue and higher
slump.
• Duke Energy’s higher regulated electricity revenues were associated with increased pricing and riders driven by new rates in Duke Energy Progress South Carolina, base rate
in North Carolina, as well as growth in normal weather retail volumes.
• Healthier customer base growth has been the key driver for NextEra Energy.
• NextEra Energy Resources’ performance was boosted due to record solar and wind generation capacity additions in 2017.
among the key drivers for Canadian utilities
Utilities have been focusing on seizing growth opportunities, while stepping up wholesale operations in export markets
• Hydro-Québec responded to requests for proposals by the states of New York and Massachusetts, and plans to participate in energy transition in various global regions by purchasing assets or stakes in companies involved in hydroelectric generation and power transmission.
– Hydro-Québec intends to double its revenue by 2030, with a view to increasing its net income, focusing on three main
growth avenues: export markets, investing outside Québec and commercializing innovations.
• Hydro One has achieved CA$89.5 million in savings through operational improvements, besides consolidating Avista Corporation to create a top 20 North American utility focused on regulated transmission as well as local distribution of electricity and natural gas.
• BC Hydro focused on demand side management portfolio in 2017, and achieved 733 GWh of new incremental electricity savings.
Figure 6.2. Canada - Revenues and associated CARG, 2013-2017 (US$ billion)
Hydro-Québec(Québec)
Hydro One(Ontario)
BC Hydro(British Columbia)
Ontario Power Generation(Ontario)
ENMAX(Alberta) TransAlta(Alberta)
-12.0%
-10.0%
-8.0%
-6.0%
-4.0%
-2.0%
0.0%
0
2
4
6
8
10
12
14
Rev
enu
es (U
S$ B
illio
n)
-5.9%
-4.2%
-9.6%
-4.6%
-2.2%
-5.5%
2013 2014 2015 2016 2017 CAGR (2013-2017)
CA
GR
(%)
Source: Thomson Reuters EIKON Data (“Total Revenue”), Capgemini Analysis

78 A Strategic Overview of the Global Energy Markets
EBITDA Margins - Cost control, new electric rates and customer growth have helped the utility sector come up with relatively stable earnings growth despite the mild weather-related impact on demand during H1 2017
last several years, driven by increasing energy
expand in renewables, midstream, and gas
•
and smartphone-based thermostat apps.
• Duke Energy, NextEra Energy and Southern Company continue to be the top performers:
– Duke Energy’s result was supported by growth from investments in electric and natural gas businesses, including the full-year earnings contribution from Piedmont Natural Gas
– Favorable impact of tax reforms and healthy deliverance from the two subsidiaries drove NextEra Energy’s earnings amid customer base growth
–
maintenance costs
– Southern Company’s net debt-to-EBITDA ratio was 5.5x at the end of Q3 2017, while Duke Energy’s and NextEra Energy’s ratios were 5.6x and 4.2x, respectively
–last three years indicates that its earnings have risen fairly
2.0% compound annual growth rate over the ten years
Figure 6.3. US - EBITDA Margins and associated CAGR, 2013-2017
15%
20%
25%
30%
35%
40%
50%
45%
EB
ITD
A M
argi
ns
(%)
2013 2014 2015 2016 2017
CAGR (2013-2017)
Duke Energy 2.2%(North Carolina)
NextEra Energy 1.6%(Florida)
Southern Company 0.8%(Georgia)
Edison International 2.7%(California)American Electric Power 2.3%(Ohio)Sempra Energy 4.5%(California)
(California)
The AES Corp 4.8%(Virginia)
Consolidated Edison 5.5%(NY)
Exelon 5.3%(Illinois)
NRG Energy 1.8%(New Jersey)
Source: Thomson Reuters EIKON Data (“Normalized EBITDA”), Capgemini Analysis
EBITDA Margins: Emerging new technological and regulatory trends in
In Canada the downturn in energy prices has had
continued conservation initiatives; however,
tie to economic growth1
• Under the earnings-sharing mechanism implemented in 2017, Hydro-Québec TransÉnergie and Hydro-Québec Distribution share with customers any surplus over and above the rate of
return authorized by the Régie de l’énergie for a given year.
– An amount of US$45 million was recognized in this regard in 2017; it will have a positive impact on the rate
• TransAlta’s EBITDA from generation increased 13% year-over-year, excluding Canadian Coal, due to strong performance in wind and solar, Australian gas, Canadian gas and US coal segments.
1 "Industry Top Trends 2018", S&P Global rating, 2018

79
Nort
h Am
eric
a
Figure 6.4. Canada - EBITDA Margins and associated CAGR, 2013-2017
5%
15%
25%
35%
45%
55%
65%
EB
ITD
A M
argi
ns
(%)
CAGR (2013-2017)
Hydro-Québec -1.4%(Québec)
TransAlta 3.2%(Alberta)
BC Hydro 0.9%(British Columbia)
Hydro One 1.6%(Ontario)
Ontario Power Generation 2.8%(Ontario)
ENMAX 6.1%(Alberta)
2013 2014 2015 2016 2017
Source: Thomson Reuters EIKON Data (“Normalized EBITDA”), Capgemini Analysis
Topic Box 6.1: Evolving Business Strategies…
Rate design for a Distributed Energy Resources (DER) future
• Evolving technologies, especially the distributed generation sources such as rooftop solar, have led many utilities to propose new rate designs and many Public Utility Commissions (PUCs) to initiate alternative rate design investigations (EET, 2018).
– In January 2017, the Public Utility Commission of Texas
rate designs and recommended phasing in alternative
– In April 2017, the Missouri Public Service Commission
emerging issues in the utility sector, including the implementation of alternative rate designs, the installation of AMI, and establishing a competitive EV market
– In October 2017, New York Public Service Commission
impacts of a range of mass-market rate reform scenarios
– The big three California utilities have been conducting
time-of-use (TOU) pilots throughout 2017 in order to gather information and aid in their transition to default TOU rates in 2019.
Industry consolidation activity slowed in 2017 from 2016’s fast pace
• The year’s slower mergers and acquisitions (M&A) pace was to be expected as utilities navigated and consolidated the 21 deals announced from 2013 through 2016.
• Stagnant nationwide power demand makes M&A a potential route to faster earnings growth for larger utilities through synergies and cost reductions as well as acquisition of smaller utilities with relatively better growth outlooks.
– Deal action in 2017 among regulated utilities included Sempra’s announced acquisition of Oncor, Canadian
to buy SCANA
– Great Plains and Westar revised the terms of their pending combination in response to Kansas state regulators’ concerns
– Canadian utility Algonquin completed its purchase of Missouri-based Empire District Electric.
In the US, the uncertainties on tax reform are now receding, so important parameters on valuing targets and capital costs are now clearer; Canadian and US utilities have been focusing on cross-industry (gas utilities buying electric utilities and vice versa, and even an electric/gas utility holding company starting to build out a water utility acquisition strategy) or cross-border (mostly Canadian holding companies buying US utilities) combinations1
1 "Industry Top Trends 2018", S&P Global rating, 2018

80 A Strategic Overview of the Global Energy Markets
Dividends: The investor-owned electric utility industry extended its long-term trend of widespread dividend increases in 2017
The percentage of companies that raised or reinstated their dividend in 2017 was 88%, the second-highest on record after 2016’s 91%• The industry’s average dividend increase per company during
2017 was 5.6%, with a range of 1.4% to 12.9% and a median increase of 5.6%.
• As of December 31, 2017, 42 of the 43 publicly traded companies in the Edison Electric Institute (EEI) Index were paying a common stock dividend.
• The Tax Cuts and Jobs Act signed into law in December 2017 maintained pre-existing tax rates for dividends and capital gains, which is crucial to avoid a capital raising disadvantage for high-dividend companies.
–sheet have allowed it to raise dividend at above-average rates
– Edison International took a meaningful step in raising its dividend payout ratio toward the upper end of its targeted range of 45% to 55% of subsidiary Southern California Edison’s earnings
– NextEra Energy has been consistent with its plan, announced in 2015, to target 12% to 14% annual growth in
–maintaining a dividend payout ratio at 70% to 80% of earnings.
Figure 6.5. US and Canada - Dividend per Share in US$ and 2013-2017 Evolution
The AES Corp
(Virginia)
EdisonInternational(California)
NextEra Energy
(Florida)
Sempra Energy
(California)
American ElectricPower(Ohio)
Southern Company(Georgia)
ConsolidatedEdison
(NY)
Duke Energy(North
Carolina)
Hydro One
(Ontario)
TransAlta(Alberta)
Exelon(Illinois)
FirstEnergy(Ohio)
NRG Energy
(New Jersey)&
Electric(California)
0.0
0.5
1.0
1.5
2.0
2.5
3.0
3.5
4.0
4.5
Div
iden
d p
er S
hare
(US$
)
200.0%
-10.3%
-91.5%
60.7%48.9%
29.3% 22.6%14.4% 12.9% 12.2% 9.9%
-34.5%
-73.3%
-59.5%
CanadaUSA
-150.0%
-100.0%
-50.0%
0.0%
50.0%
100.0%
150.0%
200.0%
250.0%
Evo
luti
on
(%)
2013 2014 2015 2016 2017 Evolution (%)
Source: Thomson Reuters EIKON Data (“Dividend per Share DPS”), Company Annual Reports, Capgemini Analysis
Stock Performance: The industry’s stock performance in 2017 was a
sheets, steady mid-single-digit earnings growth from capital investment programs and an industry average dividend yield just above 3%
US utilities traded strong despite three rate hikes in 2017
• Since the US Fed began raising interest rates in December 2015, US utilities have outpaced broader markets - in this period, total returns from the Utilities Select Sector ETF came in at around 41%, while the SPDR S&P 500 returned 37% in the same period1.
• Utilities appear to be trading at a premium based on their PE (price-to-earnings) ratios.
– On average, they have a PE multiple of 16x, compared with
– NextEra Energy and Southern Company have their PE ratios near 18x while Duke Energy is trading at a PE multiple of ~21x
– Elliott Management stated that NRG was ‘deeply undervalued’ earlier in 2017 when it disclosed its stake in the largest merchant power player; however, NRG stock more than doubled since then.
1 "An investor guide", Market Realist, 2018
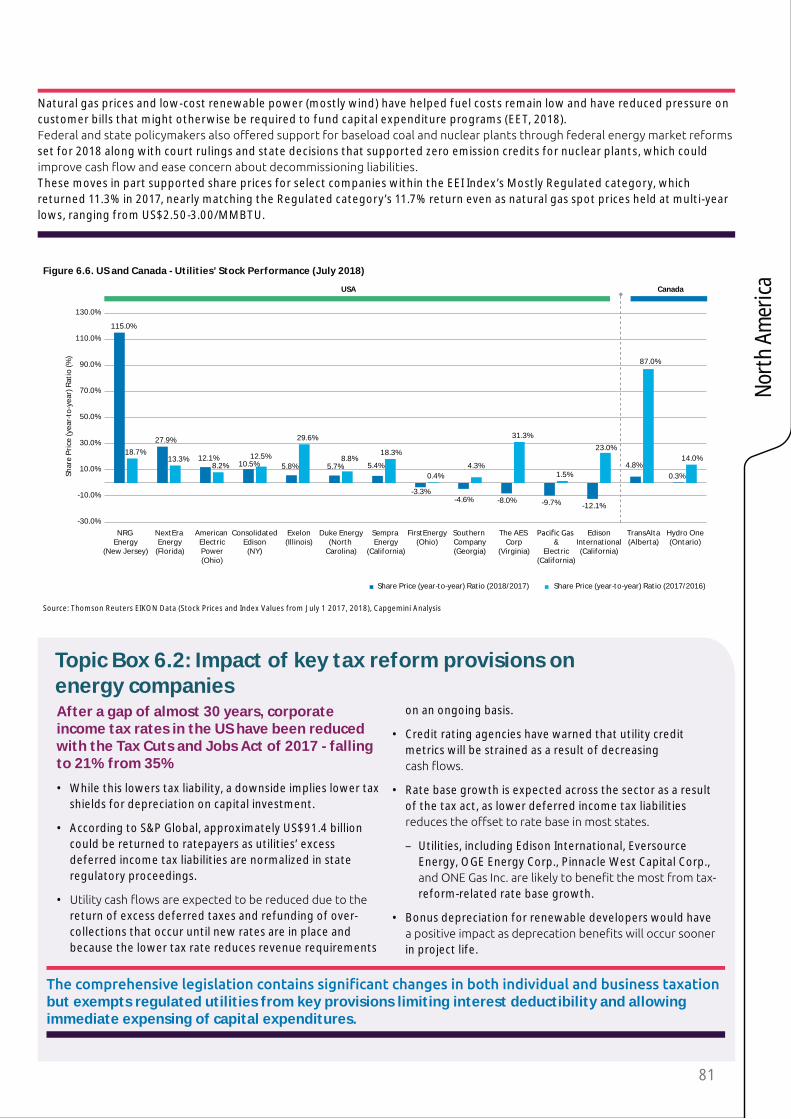
81
Nort
h Am
eric
a
Natural gas prices and low-cost renewable power (mostly wind) have helped fuel costs remain low and have reduced pressure on customer bills that might otherwise be required to fund capital expenditure programs (EET, 2018).
set for 2018 along with court rulings and state decisions that supported zero emission credits for nuclear plants, which could
These moves in part supported share prices for select companies within the EEI Index’s Mostly Regulated category, which returned 11.3% in 2017, nearly matching the Regulated category’s 11.7% return even as natural gas spot prices held at multi-year lows, ranging from US$2.50-3.00/MMBTU.
Figure 6.6. US and Canada - Utilities’ Stock Performance (July 2018)
NRG Energy
(New Jersey)
NextEra Energy
(Florida)
American ElectricPower(Ohio)
Exelon(Illinois)
Duke Energy(North
Carolina)
Sempra Energy
(California)
FirstEnergy(Ohio)
Southern Company(Georgia)
The AES Corp
(Virginia)
TransAlta(Alberta)
Hydro One(Ontario)&
Electric(California)
EdisonInternational(California)
ConsolidatedEdison
(NY)
USA Canada
-30.0%
-10.0%
10.0%
30.0%
50.0%
70.0%
90.0%
110.0%
130.0%
Shar
e P
rice
(yea
r-to
-yea
r) R
atio
(%)
115.0%
27.9%
12.1%10.5% 5.8% 5.7% 5.4% 4.8%
0.3%
18.7%13.3%
8.2%12.5%
29.6%
8.8%18.3%
0.4%4.3%
31.3%
1.5%
23.0%
87.0%
14.0%
-12.1%
-3.3%-4.6% -8.0% -9.7%
Share Price (year-to-year) Ratio (2018/2017) Share Price (year-to-year) Ratio (2017/2016)
Source: Thomson Reuters EIKON Data (Stock Prices and Index Values from July 1 2017, 2018), Capgemini Analysis
Topic Box 6.2: Impact of key tax reform provisions on energy companiesAfter a gap of almost 30 years, corporate income tax rates in the US have been reduced with the Tax Cuts and Jobs Act of 2017 - falling to 21% from 35%
• While this lowers tax liability, a downside implies lower tax shields for depreciation on capital investment.
• According to S&P Global, approximately US$91.4 billion could be returned to ratepayers as utilities’ excess deferred income tax liabilities are normalized in state regulatory proceedings.
• return of excess deferred taxes and refunding of over-collections that occur until new rates are in place and because the lower tax rate reduces revenue requirements
on an ongoing basis.
• Credit rating agencies have warned that utility credit metrics will be strained as a result of decreasing
• Rate base growth is expected across the sector as a result of the tax act, as lower deferred income tax liabilities
– Utilities, including Edison International, Eversource Energy, OGE Energy Corp., Pinnacle West Capital Corp.,
reform-related rate base growth.
• Bonus depreciation for renewable developers would have
in project life.
but exempts regulated utilities from key provisions limiting interest deductibility and allowing immediate expensing of capital expenditures.

82 A Strategic Overview of the Global Energy Markets

83
Euro
pe
Europe

WEMO 2018 Europe EditorialColette Lewiner
84 A Strategic Overview of the Global Energy Markets
Energy transition is progressing in Europe
their renewables installed capacity. 2017 was a record year for wind with 16.8 GW of new capacity added,
photovoltaic (PV) solar capacity that
energy is the largest intermittent renewables source, supplying 11.6% of the EU’s electricity demand.
At the same time, fossil fuel generation capacities continued to be decommissioned (2.2 GW for fuel oil, 2.2 GW for gas and 7.5 GW for coal)1.
While some EU countries, such as Poland, refused to take the decision to phase out their much-needed coal plants, others, such as France, have committed to close them2.
In Germany, the governing coalition partners have agreed to come up
represent 37% of German electricity generation, that all nuclear plants should be closed by 2022, and that the North-South transmission lines needed to transport the electricity produced by North Sea wind farms are progressing very slowly, one might wonder how Germany will ensure its security of supply.
Perhaps the solution is to massively increase Germany’s gas imports from Russia and also its electricity imports. This means other European countries would have to program additional power capacities to compensate for Germany’s reduced contribution. This may or may not be in line with their own energy transition plans.
In addition to government decisions, Utilities are also implementing plans
to change their electricity mix towards more renewables sources. The large French utility EDF is now investing more in renewables than in nuclear. In December 2017, it launched its “Solar Plan” aiming to build 30 GW of photovoltaic solar in France by 2035. This volume represents four times the current solar electricity production capacity in France. In March 2018, EDF launched a storage plan to build 10 GW of storage capacity by 2035, representing an €8 billion investment.
Climate change objectives are
threatenedThe main energy transition goal for Europe is to meet the Paris 2015 Climate Accord objective to limit our planet’s temperature increase to 2°C (or even 1.5°C) by 2050 by decreasing greenhouse gas (GHG) emissions.
With global and European economic recovery, 2017 was not a good year vis-à-vis climate change targets.
The EU has a stated target of reducing its CO2
2020 and by 43% by 2030, with a 60% drop by 2040.
However, data released by the European Commission in April 2018 showed that emissions regulated under the European Union’s Emissions Trading
time in seven years in 20173.
Higher carbon emissions are attributed to increasing industrial activity resulting from economic growth. These trends
crisis, but have been rising again in recent years.
1 https://windeurope.org/about-wind/statistics/european/wind-in-power-2017/#findings
2 In January 2018, the French President has pledged, to shut all of his country’s coal-fired power plants by 2021.
3 http://ec.europa.eu/eurostat/statistics-explained/index.php/Greenhouse_gas_emission_statistics

85
Economic crisis was probably the main driver of previous emissions reductions and climate package objectives has to be questioned.
The ETS system contributed little to earlier drops in emissions. It has
be applied in 2019, notably the MSR4, will remove some of the surplus.
In addition, in February 2018 the EU Council approved an update to the ETS that will apply for the 2021-2030 period. The overall cap on the total volume of emissions will be reduced annually by 2.2%.
• The carbon price increased from €5/t in early 2017 to €14/t in June 20185; however, this price is far too low to trigger investments in low carbon projects. The new rules will not be enough to cut emissions in line with the Paris Agreement.To enhance incentives to invest in clean energy, the system must be complemented by additional action;
price.
to get approval for an EU-wide
such as Poland, are opposing it, and as Germany is hesitant (due to the opposition of coal and lignite producers, and the push from renewables operators).
could be adopted at national levels (for electricity generation). So far, the only country in Europe
United Kingdom. The Carbon Price
Floor (CPF) has doubled since it was introduced in 2013 from £9/tCO
2 to £18/tCO2. Since the implementation of the CFP, there have been
generation output together with the closure of several coal stations6. As a result, in 2017 UK CO2 emissions decreased by 3.2% (compared to 2016), a very good performance when compared to the global EU emissions increase over the same period. Following the UK precedent, in 2018 the Dutch government announced
electricity sector, reaching €43/t by 2030, and the Nordic countries
to “secure future green investments in the region”. According to a recent report7, if the EU complied with the Paris Agreement, carbon prices would double by 2021 and could quadruple to €55/t by 2030, a level at which technologies such as CCS8 would be
9.
• EU Energy lawUnable to set higher carbon prices, the EU is relying on renewables
play the main part in GHG emissions reduction. In June 2018, the Commission, the Parliament, and the Council reached an agreement which sets a binding target of 32% renewable energy in total energy consumption by 2030 and of 32.5% energy savings by the same date (with a clause for an upwards revision by 2023)10. EU countries have implemented
sectors, producing substantial
4 MSR: Market Stability Reserve
5 https://sandbag.org.uk/carbon-price-viewer/
6 David Hirst, Matthew Keep, “Carbon Price Floor (CPF) and the price support mechanism”, The House of Commons library. January 2018.
7 https://www.carbontracker.org/eu-carbon-prices-could-double-by-2021-and-quadruple-by-2030/
8 CCS: Carbon Capture and Storage
9 https://carbonmarketwatch.org/2018/02/06/floor-prices-necessary-support-weak-carbon-market/
10 https://www.euractiv.com/section/energy/news/eu-strikes-deal-on-32-renewable-energy-target-and-palm-oil-ban-after-all-night-session/
new buildings consume half the energy they did in the 1980s; energy intensity in EU industry decreased by 16% between 2005 and 2014;
expected to save consumers €100 billion annually – about €465 per household – on their energy bills by 2020. With the implementation of energy
are expected. They include lower demand for EU gas imports, lower energy costs, less need for additional generation and grid capacities, new business opportunities, and new jobs for European companies. The electricity market rules will be negotiated in Q3 2018 and should be enforced before the end of the present EU commission (May 2019).
• Long-term strategy
European Commission to produce
2019. To be in accordance with the Paris Agreement, the new EU long-term strategy will have to set out how to scale up climate action from incremental to transformational, connecting sectors such as power, mobility, the building industry, and agriculture and encouraging investment in clean technologies or usages. Electricity development is a key vector in decarbonizing the whole economy and in digital transformation while improving security of energy supply. In addition, one cannot exclude the
(such as superconductivity) and innovative technology implementation (such as hydrogen
Euro
pe

86 A Strategic Overview of the Global Energy Markets
usage for storage and mobility)
These research and innovation programs should be funded
“Horizon Europe”, proposed by the commission in June 2018 to succeed Horizon 202011.
Europe is going to need more gas imports
sooner than expectedas a consequence of increasing consumption and decreasing domestic production.
Natural gas is a potential “bridge fuel” during transition to a decarbonized energy system: it emits less carbon dioxide during combustion than other fossil fuels and can be used in many industries. However, because of the high global warming potential of methane12 (the major component of
natural gas use depend on system leakages control13.
Although sectors other than energy (agriculture, human activities, industry) also contribute to methane released into the atmosphere, Oil and Gas operators as well as Utilities have to
order to legitimately claim that gas is a “bridge fuel”.
After a continuous decline between 2010 and 2014, natural gas demand in Europe started to rise again in 2015. In 2017 it rose by 5% after increasing by 6.5% in 201614. The main drivers of this growth are temperature, continuous economic recovery across Europe, and increased gas deliveries to the power sector notably during the cold period in
January 2017 when French nuclear plant availability was relatively low.
According to “BP Energy Outlook”15, between 2016 and 2040 in the context of a European energy consumption decline, the share of natural gas should increase from 24% to 27%.
• Domestic European gas production is falling sooner than anticipated. Following a series of gas production cuts due to earthquakes, production
21.6 billion cubic meters (bcm) this year, more than a 50% reduction from its 53.8 bcm 2013 peak. Moreover, the Dutch government announced in March 2018 that it will phase out gas production by 2030. Consequently, Europe is going to need more gas imports sooner than expected16.
• Security of gas supply: In 2017, the EU imported 69% of its natural gas. Thus, security of gas supply is a concern. However, the market is choosing the cheapest (but not the safest) gas supply.
17, but being more expensive than piped gas, LNG imports represent only 9.3% of Europe’s consumption. Despite warnings about the dangers of dependence on Russian gas and EU sanctions after the Ukraine crisis, Russian exports to Europe reached record levels in 2016 and 2017 and were around 40% higher in 2017 than in 201218. Overcoming strong opposition from the U.S. President, the Nord Stream 2 gas pipeline (55 Gm3 capacity,
the Commission’s hurdles and was
accepted. By mid-2018, work had
pipeline should be completed in time to compensate for the decreasing supply from the Netherlands, while reinforcing EU dependency on Russian!
The Utilities landscape is changing quickly
• is improving thanks to higher energy prices and higher carbon prices that are triggering electricity and gas markets price increases. On average, the 2017 French spot market price was €45/MWh compared to €37/MWh in 2016. Capacity markets, now functioning in many European countries (notably UK, Spain, Sweden, France), are providing extra revenue to Utilities having spare capacity, improving not only their top line but also their bottom line. The clearing prices for 2018 auctions are showing a large spread over
for extra capacity over years and countries. In the UK the clearing price at the 2018 T-4 auction was an historic low of £8/kW compared to £22/kW in 2017, while the equivalent in France price for 2019 was as high as €18/kW compared to €9/kW in 2017. In 2017, thanks to increased wholesale market electricity prices and additional capacity market revenue, Utilities’ revenue levels19 improved on average.
between existing players and newcomers pushed down EBITDA
11 https://ec.europa.eu/info/designing-next-research-and-innovation-framework-programme/what-shapes-next-framework-programme_en
12 EPA (Environmental Protection Agency) currently uses a Global Warming Potential (compared to CO2) of 25 over 100 years
13 https://www.edf.org/methane-other-important-greenhouse-gas
14 https://www.oxfordenergy.org/wpcms/wp-content/uploads/2018/04/Natural-gas-demand-in-Europe-in-2017-and-short-term-expectations-Insight-35.pdf
15 https://www.bp.com/content/dam/bp/en/corporate/pdf/energy-economics/energy-outlook/bp-energy-outlook-2018-region-insight-eu.pdf
16 https://www.mckinseyenergyinsights.com/insights/the-2017-european-gas-market-in-10-charts/.
17 Shipments come from Algeria, Qatar, Nigeria and more recently the U.S.
18 https://www.ft.com/content/7b86f4be-f08e-11e7-b220-857e26d1aca4

87
margins. Due to important CAPEX requirements, Utilities are, on average, increasing their debt level and leverage ratio. However, French Utilities are carrying out, sooner than announced, their large divestment plans: by February 2018, EDF had already implemented 80%
six months earlier than announced. These divestments are improving the companies’ balance sheets and enabling them to convert their portfolio to less carbon-intensive activities. After a few years of uncertainty, Utilities’ successful transformation
leading to good 2017 stock performances despite lower dividends per share.
political decision to phase out nuclear plants, they have battled to obtain
two years saw some legal victories
compensation linked to their right to property and to their investment in nuclear plants prior to 2011. They also had a favorable outcome to their request for refunding the illegal used nuclear fuel tax. When these Court decisions are implemented, German Utilities such as RWE, Vattenfall and E.ON should receive billion euros,
situation. • Utilities transformation
Utilities’ integrated business model is questioned
In January 2018, the Finnish utility Fortum acquired from E.ON its 47%
stake in the fossil fuel asset company Uniper, and made a bid for the other
deal demonstrates that “old fossil fuel type” generation has a value for some Utilities as electricity supplies diminish with the withdrawal from
renewables generation needs schedulable back-up and as electricity prices increase.
announced in March 2018, German utility RWE will combine the renewables businesses of rival E.ON with Innogy (its renewables and networks subsidiary) while E.ON will acquire Innogy’s regulated energy networks and customer operations. E.ON and RWE will consolidate assets that make money in Europe’s power industry: subsidized renewables and regulated networks. The question is why this could not have been done years ago via a simpler asset swap.
This deal, which results in specialist Utilities in one part of the value chain,
or Utilities and push them to split their activities.
This type of split is made possible because spot markets set the electricity or gas prices and thus integrate the value chain from power generation to electricity retailing.
However, each country and Utility
to be taken into account in such decisions.
Utilities are entering new sectors and adapting their business model
■ Retailers are confronted with new technologies such as digitalization, IoT20
19 On a sample of 16 of Europe’s largest Utilities
Euro
pe

88 A Strategic Overview of the Global Energy Markets
The new company will supply gas and electricity to more than 11 million domestic customers, just behind British Gas, the market leader. Despite the substantial decrease in competition resulting from the merger, Anne Lambert, chair of the CMA’s inquiry group, concluded “that with more than 70 energy companies out there, we have found that there is plenty of choice when people shop around”. The 34.4% stake held by the German Innogy SE in the new company is expected to be transferred to rival German energy
large asset swap between E.ON and Innogy SE owner RWE (see above).
■ For many years, GAFAMs24 announced their entry to the retail electricity market but nothing
more visible: with their voice-based devices such as Google Home or Amazon Echo they are competing with Utilities in the smart home space.
Foreign investors are entering the Utilities space
Following the EU directives on deregulation, Utilities that were losing market share in their domestic
(notably chatbots), and block chain, as well as domestic PV panels coupled with storage batteries. They’re adapting their client relationship in order to decrease
multi-channels approach suited to mobility. They are also adapting
customer requests regarding not only price by also environmental considerations and the appetite for self-generation. Many Utilities are
positioning themselves as trusted advisers enabling their customers to save energy and create smart
They’re also entering into
to the market (e.g. large retailer Casino and Engie on solar energy related services). In the generation part of the value chain, they are investing heavily in renewables (EDF acquiring Futuren, Engie acquiring the Langa group, an independent producer of renewable energy).
■ They are buying dozens of small to medium-size companies to enter nnovative areas such as electric vehicle charging, insulation and smart meters.
Retail markets are changing
■ In France, which was slow to open its energy retail markets,
example, the number of alternative electricity suppliers increased from 32 in 2015 to 38 in 2017. In gas they increased from 23 to 29 over the same period. These new suppliers are new players such as Lampiris in Belgium (now acquired by Total), retailers such as Darty or Carrefour, energy companies such as Butagaz, or Oil and Gas majors such as Total (acquiring the new player Direct Energie).
■ Contrary to this, in 1998 the UK
introduce competition in the gas and electricity retail markets and it is now re-regulating this market. Since 2008, Ofgem21 and the CMA22 have argued that the domestic retail energy market (dominated by the Big Six retailers23) was not working properly because the less engaged customers are disadvantaged. Following inquiries, in mid-2018 the UK government passed legislation to remedy this situation by capping standard variable and
by the less engaged customers). These energy price caps are set to come into force in December 2018 and, according to the UK government, they will save millions of households up to £100 a year. This new legislation has prompted executives from SSE and German-owned “npower” companies to enter into a merger that would better enable them to cope with these energy caps. At the end of August 2018, they got the green light from the CMA and the merger should be completed by
in the UK energy sector as the Big
20 IoT: Internet of Things
21 OFGEM: Office of Gas and Electricity Markets
22 CMA: Competition and Markets Authority
23 The Big Six are British Gas, EDF Energy, E.ON, npower, Scottish Power, and SSE.
24 GAFAM: Google, Amazon, Facebook, Apple, Microsoft

89
markets decided to acquire market shares in other European countries. A period (2006-2008) of intensive acquisitions at high prices followed (ENEL/Endesa, Iberdrola /Scottish and Southern, EDF/ British Energy deals) which had a negative impact on Utilities’ balance sheets for years. This period ended with the 2008 crisis and private equity funds became acquisitive players (Macquarie in electric and gas infrastructures, for example).
Recently a new player outside the European zone, namely China, has been acquiring Utilities assets, starting in southern Europe with Spanish and Portuguese grid companies. In May 2018, China Three Gorges, already an EDP shareholder,
majority shareholder. Interestingly the Portuguese government agreed in principle. By entering into south European Utilities, these Chinese players are acquiring interesting connections in South America. Time will tell whether they’ll be silent shareholders wishing to learn or more active ones.
Colette Lewiner
Senior Energy Adviser to Capgemini Chairman
Paris, September, 14, 2018
Conclusion Energy price increases are helping
Utilities to move more smoothly towards energy transition.
However, the present economic growth is threatening climate change objectives, casting doubt on the
energy package and on the 2015 Paris climate change achievements.
European reforms are helping the return to a sustainable market but
price, achieving the ambitious 2030 GHG emissions decrease target is doubtful. Utilities have continued to transform themselves but need to accelerate as
(new entrants, oil majors, retailers, GAFAMs) is increasing.
Euro
pe

90 A Strategic Overview of the Global Energy Markets
Major energy events (2017 and H1 2018)
2017
Clim
ate
chan
ge
En
erg
ytr
ansi
tio
nC
om
pan
ies
Ele
ctri
city
Gas
Ru
les
Jan Feb March April May June July Aug Sept Oct2017
March 28EDF’s capital increase for
approximatively €4 billion
06 June“Climate plan” announcement to end fossil fuels
January 17
has signed an agreement
German North Sea
January 05
operator Allego hasdeployed Europe's
March 14
on the Italian
April 18Direct Energie
merger project withTotal (acquisition
by Total of 74.33%of its capital)
May 21Acquisition by Lampiris of
the company WinWatt, specialized in the solutions
photovoltaic panel installations, electricity
storage and vehicle charging
May 25Siemens contributes tothe Northvolt project to build Europe’s largest lithium-ion factory in northern Sweden.
August 30
two quick-charge stations based on
September 19
October 31Direct Energiecompleted theacquisitionQuadran ENRs
March 22Land Taxi: Company
opens Coventry plantelectric black cars
(£325 million)
June 28Spain Awards
4 Gigawatts Solar& 1 Gigawatt Wind
In Renewables Auction
October 18
Azerbaijan gas pipeline
May 21The Swiss vote in favor of
ban on nuclear plants
July 06France decides to ban all diesel vehicules starting 2040
July 25
to ban sale ofall diesel vehicules starting 2040
October 02
Source: Various industry sources - Capgemini analysis, WEMO2018

91
JanDecNov Feb March April May June July20182017 2018
May 22European Council approves
new rules on waste management and recycling
January 8E.ON tenders Uniper shares
March 14E.ON to acquire 76.8% stake
in Innogy from RWE
June 29Gas Natural Fenosaturns into Naturgy
March 12: E-On to cut 5000 Jobs
February 26Energy price cap: Government to introduce legislation
January 18Norway to make all short-haul
January 30Engie-ADEME
100% renewablegas scenario
May 25Denmark, Poland and Lithuania signedagreements for construction pipelines
April 05Nord Stream 2:
1st compromise onthe revision of the gas
directive early April
November 08Total acquires Engie’s
upstream LNG business
December 11EDF giant Solar Plan (30 GW)
January 15
January 15
January 1744% Wind — Denmark Set New Wind Energy Record In 2017
February 8Coal Kilroot Power Station to close
March 05NewMotion in a
new vehicle-to-grid project
April 09Norsk Hydro signs DPAwith Macqueni and GE
for an annual supply of 0,75 TWh
April 10Air Products and Engie
announced the signing ofa supply agreement of green
electricity based on the traceability
May 4
come together
charging infrastructurefor homes
January 25EU commits €578million funding for
undersea Spain-France Power Link
21 February
May 18Germany allows cities to ban diesel vehicles
December 15
Europe’s largest solar developmentcompany over three years for a 43% stake in the business
May 14Statoil to changename to Equinor
Euro
pe

Figure 1.1. World map of carbon pricing policies in 2018
2018 prices given in USD/tCO2e:
Established EmissionsTrading Scheme
Chile
Argentina
South Africa
Liechtenstein
Switzerland
EU9
Portugal
Colombia
RGGI
France
IrelandU.K.
IcelandQuebec
Ontario
Manitoba
Alberta
BritishColumbia
Canada
WashingtonOregon
California
Mexico
Denmark
Massachusetts
Slovenia
UkraineKazakhstan
China
BEITIA
HUBCHO SHA
FUJGUA
SHE
Singapore
New-Zealand
Australia
Tokyo
Saitama
Japan
South Korea
Poland
Latvia
Estonia
FinlandSweden
Norway
10
14
14
814
21
15
15
15
Scheduled EmissionsTrading Scheme
Established Carbon Tax
Scheduled Carbon Tax
23
4
BEI: Beijing
China’s pilot ETSsystem:
CHO: ChongqingFUJ: FujianGUA: GuangdongHUB: HubeiSHA: ShanghaiSHE: ShenzhenTIA: Tianjin
83322641
102
76
139
102
1021
<1
<1
5
5
55
2925
2918
57
2
27
23
2
3
4
10
16
19
5
10
Source: I4CE - Institute for Climate Economics with data from ICAP, World Bank, government officials and public information, April 2018.
1-Climate Challenges & Regulatory Policies
The uptake of carbon pricing policies is on the rise in developing
Countries and provinces accounting for 60% of global GDP have implemented carbon pricing policies (46 countries and 26 provinces or cities).
• Originally circumscribed to European and North American countries, carbon pricing policies are being implemented by developing states and cities.
• The take-up of carbon pricing policies should be sustained in the coming years as 8 geographic areas have pledged to set up their own policies.
The launch of the Chinese ETS has doubled the global share of GHG emissions covered to reach between 20-25%. The scheme should be fully operational by 2020.
Carbon prices are highly heterogeneous
• Carbon permit prices vary from less than US$1/tCO2e in Tianjin to US$23/tCO2e in Alberta.
• Carbon tax rates vary from less than US$1/tCO2e in Poland to US$139/tCO2e in Sweden.
Therefore, existing schemes as
most prices are still far below the US$40-80/tCO2e range recommended by the Stern and Stiglitz report (2017) to achieve the Paris target of keeping the rise in average global temperature to well below 2° by 2050. Further action will be required to increase coverage and raise prices to meet this imperative.
92 A Strategic Overview of the Global Energy Markets

The level of ambition of carbon policies varies considerably regarding sectors and share of emissions covered, with a global coverage of 25% of emissionsETS schemes all cover the energy and industry sectors
• New Zealand and South Korea’s stand out as they also encompass building, transport, waste, aviation – even forestry in the case of NZ.
• California and Quebec’s ETS cover the highest share of emissions – 85%.
• Sector coverage is a key feature to assess an ETS but it does not necessarily translate into a higher share of emissions
Carbon taxes are mostly limited to emissions at source• They only cover emissions from coal, oil and gas in 18 out of
23 countries.
• In 5 countries, they also cover the energy and industry sectors.
• Latvia’s carbon tax stands out as the most encompassing as it covers the transport and aviation sectors as well. Surprisingly, though, it accounts for only 15% of emissions.
China’s national ETS is a major development, yet it could be considerably expanded. Only the energy sector will be covered by the scheme, thus covering 30% of national GHG emissions.
Figure 1.2. Detailed characteristics of global carbon pricing policies
Finland
Jurisdiction Sectoral scopeStartyear
Fuelscovered
Price in USD/tCO2
(nominal value)Share of
emissions (%)
Poland
Norway
Sweden
Denmark
Slovenia
Estonia
Latvia
Switzerland
Iceland
Ireland
Ukraine
Japan
France
Mexico
Portugal
Alberta
Chile
Colombia
Argentina
Manitoba
Canada
Singapore
South Africa
United-Kingdom
Liechtenstein
British Columbia
1990
1990
1991
1991
1992
1996
2000
2004
2008
2010
2010
2011
2012
2014
2014
2015
2017
2017
2017
2018
2018
2019
2019
2019
2013
2008
2008
76
<1
57
139
29
21
2
5
102
18
29
<1
3
55
2
10
23
5
5
10
19
16
4
10
25
102
27
36
4
60
40
40
24
3
15
33
55
49
71
68
35
46
29
45
42
24
NA
50
NA
80
80
23
26
70
Euroean Union
Jurisdiction Sectoral scopeStartyear
Price in USD/tCO2
(nominal value)*Share of
emissions (%)
Alberta
New-Zealand**
Switzerland
RGGI
Tokyo
Saitama
California
Beijing
Guangdong
Shanghai
Shenzhen
Tianjin
Chi
na
Hubei
Fujian
National***
South Korea
Australia
British Columbia
Ontario
Washington
Massachusetts
Mexico
Canada
Chongqing
Quebec
Kazakhstan
2005
2007
2008
2008
2009
2010
2011
2012
2013
2013
2013
2013
2013
2014
2016
2017
2015
2016
2016
2017
2017
2018
2018
2019
2014
2013
2013
9
23
14
8
4
14
14
15
8
2
6
4
1
2
3
NA
21
10
NA
15
NA
0
NA
NA
3
15
0
45
45
51
11
20
20
18
85
45
60
57
40
55
35
60
30
68
50
0
82
67
20
NA
NA
Manitoba
Oregon
2019
2021
NA
NA
NA
NA
40
85
50
Instruments:
Established emissions trading scheme
Sectors:
Scheduled emissions trading scheme
Established carbon tax
Scheduled carbon tax
Price in USD/tCO2:
Less than 10
Between 11 and 30
More than 30
Energy
Industry
Building
Transport
Waste
Aviation
Fuels:
Coal Oil Gas
Share of emissions covered:
Less than 35%
* ETS prices: mean values observed between April 2017 and April 2018. Tax prices observed on April 1, 2018.
** The ETS in New Zealand also covers the forest sectors.
*** China’s national ETS was launched in December 2017, it will be fully operational in 2020.
Between 36% and 65%
More than 65%
Source: I4CE - Institute for Climate Economics, April 2018.
93
Euro
pe

€32 billion in carbon revenue has been collected, mostly by European States, which use 46% for mitigation and adaptation and 44% to improve their general budgets
Globally, 46% of revenue derived from carbon pricing is earmarked for low carbon projects and 44% is allocated to States’ general budgets.
• ~87% ETS revenues are earmarked.• ~53% of carbon taxes revenues are allocated to States’
general budgets.
policy in general.
More than 67% of carbon revenues came from EU Member States.• The EU ETS accounts for 2/3 of revenues derived from
all ETS.
• This highlights major revenue opportunities for other countries.
• The deployment of the Chinese ETS should change the picture.
ETSs only represent 1/3 of carbon revenues. This is the direct consequence of low prices observed in all ETS globally.
The French carbon tax accounts for 1/4 of revenue from all carbon taxes• Sweden’s carbon tax generates comparatively more revenue,
~0.6% of GDP compared to ~0.2% for France.• France’s is expected to increase from €30.5/tCO2e to €86.2/
tCO2e by 2022.
Figure 1.3. Volume and use of carbon revenues in 2018
Alberta 96 16 44
Denmark 33
Colombia 171
Chile 160
Portugal 133
194 185
RGGI, USA 176 22
Year of implementation
carbon tax since 2013
carbon tax between 2008 and 2013
carbon tax before 2007
Emissions Trading Scheme since 2013
Emissions Trading Scheme between 2008 and 2013
Emissions Trading Scheme before 2007
Revenue uses
Earmarking
General budget allocation
Tax exemptions
Direct transfers
4,657
1,723
2,927
2,471
2,471
6546541,074189368
951434
7075458477
33185171160
133
5,424
1,356
2,024
1,499
482
194
747
196
ETS
Carbontax
Volume of revenue decreases
Volu
me
of r
even
ue d
ecre
ases
France
Sweden
Japan
Norw
ayFinland
United
-King
do
mSwit
zerl
and
Bri
tish
Col
umbi
a
Alb
erta
Irela
nd
Mex
ico
DenmarkColo
mbia
ChilePortu
gal
EU ETS
California
Ontario
RG
GI, U
SAA
lberta
Queb
ec
USD 11,139 M
USD 21,090 M
Source: I4CE - Institute for Climate Economics with data from World Bank, government officials and public information, April 2018.
94 A Strategic Overview of the Global Energy Markets

Only the power sector experienced direct costs from the EU ETS - until
industrial sector to contribute too
The EU ETS is capped• A maximum number of allowances (EUA) are distributed
among corporations in power, industrial and airline sectors.• By reducing the number of allowances available, the EU
increases the cost of GHG emissions for corporations thus incentivising them to reduce them.
of the EU ETS, costs were mostly borne by the power sector.
spending for power corporations.• Industrial sectors collected emissions surpluses during the
The discrepancy has been reduced since 2013• Industrial companies have stopped accumulating surpluses,
entering a net payment period from 2017 onwards.
The redesign of the EU ETS has levelled the
sectors as both are now bearing the ETS’s costs. The power sector still experiences a much more sizeable gap than the industrial sector.
Figure 1.4. Net cost of EU ETS allowances for power and industrial sectors
4,000
2,000
0
-2,000
-4,000
-6,000
-8,000
4,000
2,000
0
-2,000
-4,000
-6,000
-8,000
Net
co
st o
f al
low
ance
s(M
illio
n €)
Net
co
st o
f al
low
ance
s(M
illio
n €)
2005 2008 2013 2017 2005 2008 2013 2017
Industrial sectors
Combustion of fuels
Surplus Surplus
Note: data for 2017 are based on the EUTL of April 3 - missing gaps are estimated by Wegener CenterSource: EEA,2018 and EUTL, 2018
95
Euro
pe

reinforced with EPBD, a 32% target for renewables and annual savings
Adopted legislative proposalEssential features of the Energy Performance of Buildings Directive (EPBD)
inspection, monitoring and control.• Support electromobility infrastructure deployment
in new or largely renovated non-residential buildings by requiring electricity cables for every 5 parking spaces, to become electric vehicles charging points.
• Establish an optional Smart Readiness Indicator to show buildings’ capacity to use new technologies and electronic systems.
Next steps to be discussedOngoing legislative proposals
• The next two points to be agreed are Electricity Regulation
addressed are risk preparedness and rules for ACER (Agency for the Cooperation of Energy Regulators).
Agreed legislative proposals (to be adopted)New objectives for renewables
• Ensure a binding target of 32% share of renewable energy at the EU-level by 2030, with an upward revision clause by 2023.
• Achieve targets for renewables: – – Increase of 1.3% yearly average in heat/cooling sector for
2021-2025 and 2026-2030 periods, starting from the level achieved in 2020.
• Set regulatory framework on self-consumption.
Concerning governance, Member States should
• Make sure each country is doing its fair share in reaching targets.
• Use a template based on the 5 dimensions of the Energy Union Strategy to update National Energy and Climate Plans (NECPs) every 5 years, with a biennial progress report and an annual report on GHG emissions.
• Collaborate to achieve EU target of 15% grid interconnection.
consumption from 2021 to 2030.
level, with an upwards revision by 2023.• Establish national rules on the allocation of heating,
cooling and hot water consumption in buildings with collective systems.
• Reinforce rules on individual metering and billing of thermal energy.
The Clean Energy For All Europeans package is a set of 8 legislative proposals published by the European Commission in November 2016. The EPBD was adopted in December 2017 and new political agreements were reached in 2018. Other proposals will be addressed in 2019.Sources: https://ec.europa.eu/energy/en/topics/energy-strategy-and-energy-union/clean-energy-all-europeanshttp://data.consilium.europa.eu/doc/document/ST-10308-2018-INIT/en/pdfhttp://data.consilium.europa.eu/doc/document/ST-10309-2018-INIT/en/pdfhttp://publications.europa.eu/resource/cellar/ebdf266c-8eab-11e5-983e-01aa75ed71a1.0008.03/DOC_5
96 A Strategic Overview of the Global Energy Markets

EU climate policies should be stepped up in order to limit temperature rise to well below 2°C by 2050 and match the Union’s ambition
The EU’s commitment concerning its long-term
• The European Council concluded in 2009 that emissions should be reduced to 80-95% by 2050 compared to 1990 levels.
• Pursuing the 2030 climate and energy framework adopted following the Paris Agreement would equate falling short of the 80-95% ambition from 2031 onwards.
Bolder action is therefore required to limit temperature rise to well below 2°C.
• Under the following scenario, illustrated by stacked bars in Figure 1.7, adoption of and investment in low-carbon technologies should be stepped up.
Heterogeneous compensation for indirect costs borne by industries distorts the functioning of the EU ETS, but recent reforms might reduce discrepancies
The industrial sector experiences indirect costs as utilities pass EUA’s costs to them through their energy bills.
• Costs can be high for energy intensive industries – steel, cement.
• It increases the risk of carbon leakage as they can be incentivised to relocate to countries with less stringent regulations, thus lower costs.
Compensation schemes have been set up by about 1/3 of Member States to reduce these risks.
• All schemes are partial and regressive, but amounts transferred are discretionary.
• France transferred about 59.8% of revenues derived from EUA’s auctions in 2016, yet Greece used only 2.6%.
The heterogeneity of measures poses a competitiveness threat as some industries in
even though studies (Ecorys, 2013) have not found evidence of carbon leakage.
Regulatory updates coupled to a reduction in
the status quo.
• The fourth period of the EU ETS advocates more strongly the need for all Member States to compensate and reduce discrepancies.
• It also suggests a soft cap of 25% on auction revenues, which is likely to have a strong impact on pre-existing schemes, which all
Figure 1.5. Map of indirect costs compensation schemes across the EU
No compensation
implemented/adopted*, EC ApprovedPlanned, not EC approved yet
Source: 2018 State of the EU ETS report, 2018, pp.23-24, https://www.i4ce.org/wp-core/wp-content/uploads/2018/04/20180416-2018-State-of-EU-ETS-Report-Final-all-logos_-1.pdf
Figure 1.6. Total revenues derived from indirect compensation schemes for selected countries
Member State
France
Germany
The Netherlands
Finland
Greece
Flanders
140,339,677.00
288,723,308.06
45,000,000.00
36,300,000.00
3,845,242.00
39,383,616.43
234,683,755
850,000,000
142,610,000
71,220,000
148,050,000
56,917,488
59.80%
33.97%
31.55%
50.97%
2.60%
69.19%
Total compensationindirect costs
Auction Revenues Percentage of auctionrevenues used
Source: Data obtained from Member States, Tieben and in ‘t Veld, 2017, & Maximiser, 2018
97
Euro
pe

Figure 1.9. EU primary energy consumption evolution and target to 2020
1,900
1,650
1,700
1,800
1,750
1,850
1,450
1,500
1,550
1,600
Mto
e
19901995
20002005
20102015
2020
Historical evolution of primary energy consumption
Path to reach 2020 target
2020 target for EU-28
-10%in 2016
-20%
Source: Eurostat, Capgemini consulting WEMO2018I did
Europe 2020 strategy objectives should be met for GHG reduction and renewables share, but the primary energy consumption target will be missed
The EU has already exceeded the 2020 GHG reduction targets.• The EU’s emissions have been reduced by 24% as of 2016
compared to the 2005 level, which exceeds the 20% reduction by 2020 target.
• Emissions decreased slowly from 1990 to 2007, threatening to derail the 2020 objective. The 2007 crisis led to a sharp decline in emissions that proved sustainable despite economic recovery from 2012 onwards.
Figure 1.8. Greenhouse Gas Emissions evolutions and targets to 2020
4,400
4,600
4,800
5,000
5,200
5,400
5,600
5,800
6,000
MtC
O2e
4,000
4,200
19901995
20002005
20102015
2020
Historical evolution of GHG emissions
Path to reach 2020 target
-20%
-24%in 2016
2020 target for EU-28
Source: Eurostat 2018 with data from the European Environment Agency and the European Commission 2018
Figure 1.7. Comparison of the EU’s different levels of climate paths and resulting impacts on its stated ambitions
6,000
5,000
MtC
O2e
4,000
3,000
2,000
1,000
0
EU ETS - Power
2013
2014
2015
2016
2017
2018
2019
2020
2021
2022
2023
2024
2025
2026
2027
2028
2029
2030
2031
2032
2033
2034
2035
2036
2037
2038
2039
2040
2041
2042
2043
2044
2045
2046
2047
2048
2049
2050
ESR - Transport
Other emissions
2017 Baseline - EU ETS - emissions
2017 Baseline - ESR - emissions
2017 Baseline - other emissions
EU ETS - Other transf.
ESR - Buildings
EU ETS Industry
ESR - Others
1990 EUGHGemissions
-20% in 2020 -40% in 2030 Between
-80 and -95%
in 2050
Source: Mind the gap - Aligning the 2030 EU climate and energy policy framework to meet long-term climate goals, 2018, p.42, https://www.i4ce.org/wp-core/wp-content/uploads/2018/06/I4CE-Enerdata_Mind-the-gap-full-report-1.pdf
This could be achieved by assessing counteractive interactions between ETS,
and other policies.
• It would hasten the pace of reduction of the ETS’ cap and in ESR targets, which would incentivise power and industry players to increase their investments by 2030.
The EU is on track to meet its 2020 renewables target.
• The share of renewables in gross energy consumption almost doubled between 2005 and 2016 to reach ~17% in the EU-28
• Major discrepancies persist between EU Member States. While 53% of Sweden’s gross energy consumption came from renewables, only 6% did so for Luxembourg.
• Some countries like France, the Netherlands and Ireland
50% for France and Ireland, 100% for the Netherlands.
Setting intermediary targets in 2030 and 2040 would enable stakeholders to better plan and adapt to policy changes, therefore easing the implementation of long-term goals.
98 A Strategic Overview of the Global Energy Markets

Topic Box 1.2: The Mobility Package positions the EU as a regulatory leader for clean and digital transportationState of play• The Mobility Package comprises 3 main parts, presented to
the European Commission from May 2017 to May 2018. • All initiatives are now in negotiations with the
co-legislators and stakeholders. • The stated objectives and targets may evolve.
1) Europe on the move
• Give 8 legislative initiatives for a transition to a clean mobility, especially in road transport.
• Encourage electromobility and smart road charging 1,200 alternative fueling points, including
charging points, by 2020.• Set a cooperative intelligent transport system by 2030
to reduce fuel consumption and CO2 emissions by 1.2% per year.
2) Clean mobility objectives
• Amend the Clean Vehicles Directive to stimulate the market by requiring a minimum level of environmentally friendly vehicles in national public procurements.
• Reduce CO2 emissions of new cars and vans by 30% in 2030 compared to 2021 and by 15% for new trucks in 2025 compared to 2019.
• Use Worldwide Harmonised Light Vehicle Test Procedure to measure CO2 emissions, achieving a target of 95gCO2/km in
3) Safe, connected and automated mobility goals
• Become the world leader in automated and connected mobility using a digital environment for information exchange in transport (maritime and freight) and advanced safety features for vehicles and pedestrians.
Focus: Action plan for batteries• Have a European industrial leadership and workforce
covering the value chain.• Enhance sustainability by securing access to raw
materials, including ones derived from recycling.• Promote innovation (new materials, battery
management systems…) with €110 million in 2018-2019 for battery-related research, in addition to €250 million already allocated.
• Support battery deployment by allocating €270 million to smart grids and energy storage projects.
The Mobility Package aims at furthering the transition to a low carbon economy by implementing the Strategy for Low-Emission Mobility adopted in 2016. All proposals are now under negotiation with the aim of adopting legislative proposals in 2019.Sources: http://www.europarl.europa.eu/legislative-train/theme-resilient-energy-union-with-a-climate-change-policy/package-eu-mobility-packagehttps://ec.europa.eu/transport/modes/road/news/2017-05-31-europe-on-the-move_enhttps://ec.europa.eu/transport/modes/road/news/2017-11-08-driving-clean-mobility_enhttps://ec.europa.eu/transport/modes/road/news/2018-05-17-europe-on-the-move-3_enhttp://wltpfacts.eu/wltp-test-co2-targets/https://ec.europa.eu/transport/sites/transport/files/3rd-mobility-pack/com20180293-annex2_en.pdf
Figure 1.10. Share of Renewables in the Member States’ gross final energy consumption
Sweden
Latvia
Finland
Austria
Portugal
Denmark
Estonia
Slove
nia
Romania
France
Lithuania
Spain
Croatia
Germany
Greece
Italy
Bulgaria
Ireland
Poland
United K
ingdom
Netherla
nds
Slovakia
Belgiu
m
Czech
Republic
Cyprus
Hungary
Luxem
bourgM
alta
European U
nion-2
8
30%
40%
50%
60%
0%
10%
20%
2005
2020
Ob
ject
ive
2016
Source: Eurostat 2018
The EU is likely to miss its 2020
• EU primary energy consumption peaked around 2007 at 1840 Mtoe to reach 1640 Mtoe in 2016. This only translates to a -10% reduction instead of the -15% required to be on track for the 2020 objective.
99
Euro
pe

Europe. It gives an overview of the overall market and technology trends in the energy and transportation sectors. According to the European Environment Agency, the energy and transportation sectors were the two largest emitters of greenhouse gas (GHG) emissions, representing 45% of overall European emissions. The following trends are highlighted in this chapter:
Clean energy investment at its lowest levels since 2006 in EuropeClean energy investment tumbled in Europe to US$41 billion, despite additional renewable power capacity.
After 3 years of stable investment and renewable additions ranging 20-22 GW, 2017 saw a 37% drop in investment in clean energy sources compared to 2016 (investment here includes
2016 had seen major transactions like the UK’s 1.2 GW Hornsea
deals were signed during 2017.
Steady investment in solar
The solar PV market is becoming resilient to changes in policy support as costs come down and PV projects are less dependent on government subsidies. Solar power additions were stable (the EU-28 added 5.91 GW in 2017, compared to 5.89 GW in 2016 according to Solar Power Europe).
Germany and the UK experienced major slowdowns in investment on the back of fewer
Lower investment in Germany and the United Kingdom contributed to the decline. In Germany investments dropped by 35% to US$10.4 billion as the regulatory framework for
closing of biomass, onshore wind and solar subsidy programs and a huge gap between wind auctions leading to a 65% decrease (US$7.6 billion).
Sweden jumped to become the third-largest clean energy market in 2017 behind Germany and the UK: the country saw
owing to a dynamic onshore wind market.
Figure 2.1. New investments in clean energy in Europe: 2005-2017
33,1
46,8
67,4
81,382,5
113,9
128,4
88,9
59,4
67,9 62,9 64,1
40,9
0
20
40
60
80
[$b
N]
100
120
140
2005 2006 2007 2008 2009 2010 2011 2012 2013 2014 2015 2016 2017
Solar Wind Other Running average
Nominal values: Total values include estimates for undisclosed deals. Excludes corporate and government R&D, and spending for digital energy and energy storage projects (reported in annual statistics only).Sources: BNEF Q1 2018 report
2-Energy Transition
• In spite of growing renewable power additions, investment in the renewables sector fell by 37%
• Onshore wind and utility-scale solar photovoltaic (PV) continued to see an improvement in their cost-competitiveness, with the average levelized cost of electricity (LCOE) estimated at €60/MWh and €70/MWh respectively for new projects commissioned in 2017.
• The battery storage market accelerated in 2017, increasing from 410 MWh to 590 MWh
battery storage capacity installed. Growth is happening both in front of the meter (e.g. large-scale batteries providing grid stability services) and behind the meter (e.g. small-scale installations used for self-consumption).
• Biomass was the largest renewable energy source in 2017 (including power, heat and transportation) and will play a key role in meeting European renewable energy targets
rural economy, its contribution to base-load power and injection into the gas grid as well as with vehicles.
• Electric vehicles sales soared to approximately 230,000 in 2017, nevertheless representing only 1.5% of total European light vehicles.
• The role of hydrogen sees modest progress through several demonstration projects, like ENGIE’s installation of a multi-fuel station with 50 Renault Kangoo cars in the French international market of Rungis.
100 A Strategic Overview of the Global Energy Markets

Employment in Europe grew by 3% in 2016The global renewable energy sector employed 9.8 million people in 2016 with 1.19 million jobs in Europe.
The biomass sector was the leading employer and represented 10% of the European share (389,000 jobs), making Europe the leader in global biomass employment. Biomass is the most labor-intensive renewable energy sector and has been boosting the economy in rural regions. Europe accounted for 30% of global wind employment and the wind industry is the second best employer in Europe after biomass (344,000) with Germany responsible for 47% of this total. In spite of steady investment in solar PV projects, employment dropped by 8% in Europe in 2016. According to SolarPower Europe, the enforcement of import duties on Chinese PV cells had curbed job potential in Europe until now. These restrictions were removed on 3 September 2018.
Average wind and solar costs have come down by ~20% compared to 2016Onshore wind and solar PV are the most cost-competitive sources of power generation for semi-base generation.
• Due to a rapid fall in system costs and improved capacity factors, solar PV has seen the fastest cost reduction between 2016 and 2017.
• In contrast, costs reductions were more limited for onshore windfor digital tools are promising greater cost reduction in the future (see topic box on digital wind).
• Gas and coal prices saw a 17% and 24% increase compared to 2016 owing to higher demand for gas, and to a sharp reduction in Chinese coal production and sustained
and Europe.• The cost of small hydro depends on the
location and varies greatly. In Western Europe, potential will be limited to a few
ageing turbines. LCOE is stable, at roughly double the cost
of onshore wind despite having a higher capacity factor. Projects are complex and located far from the shore, and average installation costs were reported at US$4,700/kW.
Nuclear is forecast to be the most cost-competitive baseload generation but the future price remains uncertain.
• Due to an additional delay in Flamanville PWR commissioning, EDF raised the total project cost to
in 2003.
•
Geothermal is the second best option but resource potential is limited to Turkey and Iceland. In other parts of Europe, costs are much higher owing to enhanced geothermal technology and deeper wells.
• Wood-based biomass LCOE ranges from €80-120/MWh and additions are steady, but potential is curbed by supply availability.
Figure 2.2. Net renewable power capacity added in Europe (GW)
0
5
10
15
20
[GW
]
25
30
35
40
2009 2010 2011 2012 2013 2014 2015 2016 2017
SolarWind Other
2022 2222
25
3634
23
20
Source: IRENA
Figure 2.3. Leverage cost of electricity (LCOE) comparison of selected power generation sources in Europe starting production in 2017-2018
Coal sem
i-base
Hydro d
am
Hydro ru
n-of-r
iver
NG sem
i-bas
e (CCGT)
Natura
l gas p
eak
Coal base
Geotherm
al
Biom
ass in
cinera
tion
Existin
g nuclear
New nuclear
Onshore
win
d
Utility
-scale
solar P
V
Residentia
l PV
Leve
lized
cos
t of e
lect
rici
ty [€
/MW
h]
350
300
150
200
250
0
50
100
Peak capacities
Semi-base and intermittent capacities
Base capacities
Fossil fuelRenewableNuclear
Notes:Analysis shows LCOE range for major European markets (UK, France, Germany, Spain, Italy). Assumptions on CAPEX and cost of capital are based on literature research and company interviews. The range for geothermal reflects projects in Eastern Europe and best-in-class enhanced geothermal systems (EGS) in Germany. Analysis excludes carbon price impact. Assuming current EU ETS price at 18 €/tCO2, LCOE would increase by €18/MWh for coal and by €7/MWh for gasThe cost of nuclear is based on future pressurized water technology under construction in the UK and is based on the UK Department for Business, Energy & Industrial Strategy estimates. Distinction is made between “first of a kind” (FOAK) and “nth of a kind” (NOAK)Source: Capgemini Consulting, IRENA, BP database, Fraunhofer Institute, Commodity Markets Annual prices
101
Euro
pe

Some of the current digital trends (which are already a part of this new changing wind industry picture) and actor’s move to go further in this changing environment
Drones for optimization of inspections & repairs
Self-piloting drones,
system, could capture high-quality images, detect wind turbine cracks and collect valuable data.
• Ørsted partnered with SkySpecs to investigate automated drone inspection on the world’s largest
2018). Iberdrola and Arbórea Intellbird is using the
distances over electric power lines, combined with the new software with a focus on wind farm evacuation lines to improve power line inspection (July 2018). Blueye Robotics has developed an underwater drone
surrounding sea bed to increase the response time to potential problems.
Tailor-made robots for remote maintenance & repair of blades
& repairing activities and some basic services such as cleaning and polishing.
• Helical Robotics created the small robots travelling up and down on a wind turbine surface and inspecting the blades and other mechanics. SGRE is developing blade robots for monitoring basic services by partnering with Rope Robotics, to develop blade maintenance robots which is planned to be commercial by 2019. GE Renewable Energy has been working on this question since 2012 and they are using GE blade robot, with a microwave scanner, to check the structural integrity of blades.
Figure 2.5. Digital levers that transform wind industry
Drones
Robotics
Big Data & Analytics
Machine learning & AI
AI
Design & Performance optimization, detection of failure initiation,
improved production predictions, ...
Automated inspections, predictive maintenance, ...
Automated repairing activities,automated operations, …
Production optimization, remote fault monitoring & detection, …
Figure 2.4. Comparison of onshore wind and solar PV LCOE vs. auction prices (€/MWh) since April 2015
0
April 2015
May 2015
June 2015
July 2015
August 2015
Sept. 2015
Oct. 2
015
Novem. 2
015
Decem
. 2015
January 2016
February
2016
Marc
h 2016
April 2016
May 2016
June 2016
July 2016
August 2016
Sept. 2016
Oct. 2
016
Nov. 2016
Dec. 2016
January 2017
February
2017
Marc
h 2017
April 2017
January 2018
February
2018
Marc
h 2018
April 2018
May 2017
June 2017
July 2017
August 2017
Sept. 2017
Oct. 2
017
Nov. 2017
Dec. 2017
20
40
60
80
100
120
140
160
EUR
/MW
h (n
om
inal
val
ues)
• Average utility-scale solar PV• Average onshore wind• FR/GER Auction prices solar PV • FR/GER Auction prices onshore wind
•
LCOE value in nominalSources: WEMO2017, EEMO 2016, Capgemini AnalysisFederal Network Agency (Bundesnetzagetur) & French Ministry for Economy & Finance (CRE)
In 2017, the weighted average LCOE of utility-scale solar PV declined by around 30%, mainly driven by module price reduction.• Lower installation costs and increased capacity factors (use
of trackers, better sizing of the inverter) are improving the economic competitiveness of utility-scale PV.
• In some markets utility-scale PV costs are already comparable
subsidy-free solar plant coming online (46 MW).
mainly due to the abrupt withdrawal of China’s incentives; Bloomberg New Energy Finance (BNEF) expects a 34% decline in module prices in 2018, to reach a global average of €23.2 ct/W by the end of 2018. With module prices representing nearly 50% of solar capex, solar LCOE are bound to decrease further during 2018.
Utility-scale PV and onshore wind cost of electricity converge
102 A Strategic Overview of the Global Energy Markets

Wind and solar average bidding prices in Germany and France converge• In 2018, France and Germany awarded Utility-scale PV projects at €55.3/MWh and
€48.2/MWh respectively.• The gap between German and French average bidding prices is wider for onshore
wind (€47.3/MWh and €65.4/MWh respectively for auctions awarded in January and February 2018). Although wind resources are more attractive in France, the cost of onshore wind in France is 20-40% higher than in Germany because of a longer development time and more regulatory hurdles.
the bids. One reason for the challenge for onshore wind was a new temporary rule requiring all bidders to have environmental permits before submitting a bid (source: WindEurope).
103
Data analysis to maximize assets’ value through performance assessment, plan optimization and active monitoring
1. farms: GE
stabilize energy supplies. A better prediction of low-output days will
and reduce the amount of overall lost production. 2. Machine learning (ML) for improving wind turbine operational
gathered from IoT systems to predict asset failures better and extend
the number of sites and the remote locations of wind farms, there is
3. Big data techniques optimize cost models and energy production: Vestas acquired Utopus Insights solutions capable of delivering increased predictability, increased renewable energy production,
(Light Detection and Ranging—is a remote sensing method used to examine the surface of the Earth) and predictive weather modelling techniques, enabling to provide a robust 3D representation of the
weather models and energy production forecasts.
Euro
pe
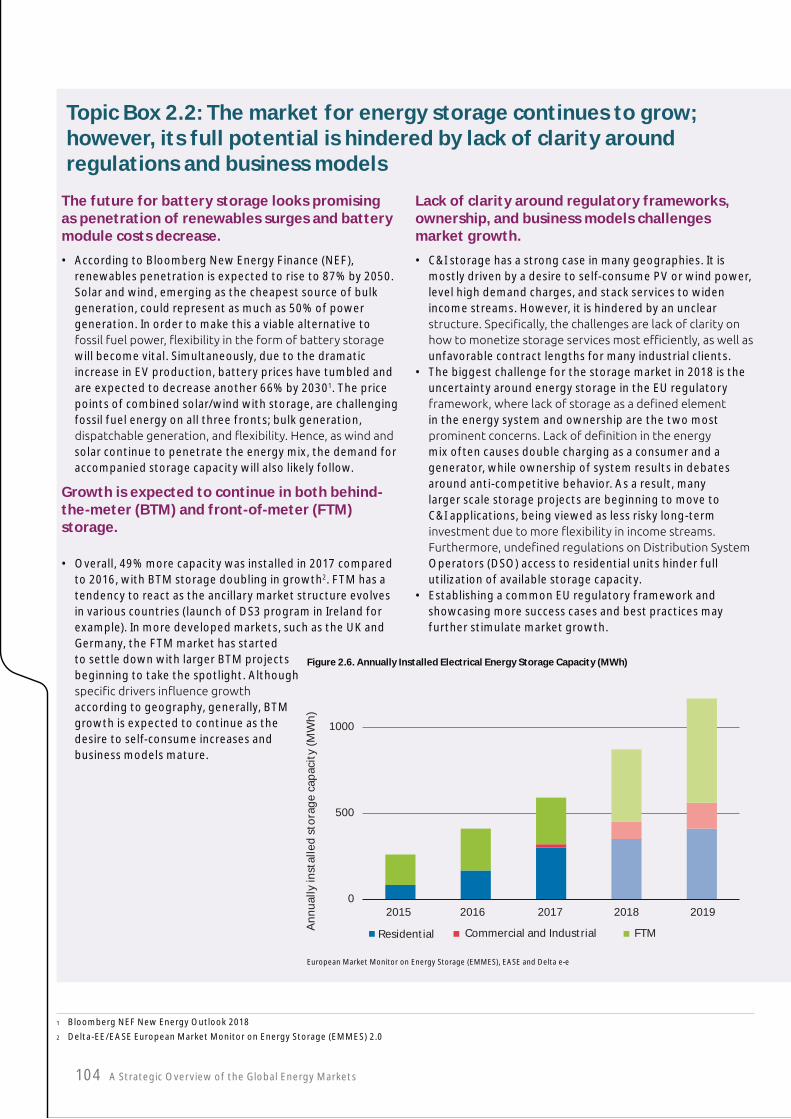
Topic Box 2.2: The market for energy storage continues to grow; however, its full potential is hindered by lack of clarity around regulations and business models
The future for battery storage looks promising as penetration of renewables surges and battery module costs decrease.
• According to Bloomberg New Energy Finance (NEF), renewables penetration is expected to rise to 87% by 2050. Solar and wind, emerging as the cheapest source of bulk generation, could represent as much as 50% of power generation. In order to make this a viable alternative to
will become vital. Simultaneously, due to the dramatic increase in EV production, battery prices have tumbled and are expected to decrease another 66% by 20301. The price points of combined solar/wind with storage, are challenging fossil fuel energy on all three fronts; bulk generation,
solar continue to penetrate the energy mix, the demand for accompanied storage capacity will also likely follow.
Growth is expected to continue in both behind-the-meter (BTM) and front-of-meter (FTM) storage.
• Overall, 49% more capacity was installed in 2017 compared to 2016, with BTM storage doubling in growth2. FTM has a tendency to react as the ancillary market structure evolves in various countries (launch of DS3 program in Ireland for example). In more developed markets, such as the UK and Germany, the FTM market has started to settle down with larger BTM projects beginning to take the spotlight. Although
according to geography, generally, BTM growth is expected to continue as the desire to self-consume increases and business models mature.
Lack of clarity around regulatory frameworks, ownership, and business models challenges market growth.
• C&I storage has a strong case in many geographies. It is mostly driven by a desire to self-consume PV or wind power, level high demand charges, and stack services to widen income streams. However, it is hindered by an unclear
unfavorable contract lengths for many industrial clients. • The biggest challenge for the storage market in 2018 is the
uncertainty around energy storage in the EU regulatory
in the energy system and ownership are the two most
mix often causes double charging as a consumer and a generator, while ownership of system results in debates around anti-competitive behavior. As a result, many larger scale storage projects are beginning to move to C&I applications, being viewed as less risky long-term
Operators (DSO) access to residential units hinder full utilization of available storage capacity.
• Establishing a common EU regulatory framework and showcasing more success cases and best practices may further stimulate market growth.
1 Bloomberg NEF New Energy Outlook 2018
2 Delta-EE/EASE European Market Monitor on Energy Storage (EMMES) 2.0
104 A Strategic Overview of the Global Energy Markets
Figure 2.6. Annually Installed Electrical Energy Storage Capacity (MWh)
An
nu
ally
inst
alle
d s
tora
ge
cap
acit
y (M
Wh
)
0
500
1000
2015 2016 2017 2018 2019
Residential Commercial and Industrial FTM
European Market Monitor on Energy Storage (EMMES), EASE and Delta e-e

Biomass is the largest renewable energy source in Europe meeting 10%
1. According to Eurostat, in 2015, the total EU-28 biomass supply for electricity, heating and transport fuel amounted to 112,37 Mtoe. This amount is projected to increase by nearly 24% up to 139 Mtoe by 2020.
2. ofbioenergy in Europe with 82.921 ktoe in 2015. Bioheat is used mainly in residential and industrial sectors (respectively 50% and 26%).
3. Electricity production from bioenergy continues to increase in Europe, albeit at a slower pace than other renewable technologies – Electricity coming from bioenergy increased by 2% between 2016
and 2017 (from 190 TWh to 196 TWh). – At the same time, electricity coming from overall renewable
energy increased by 10.6% between 2016 and 2017 (from 607 TWh to 679 TWh).
4. The bioenergy mix is more or less similar in every country of Europe exept for Malta and Luxembourg for which biofuel for
of bioenergy. And in the United Kingdom, shares of bioheat and electricity are respectively 44% and 40%.
5. Looking at national consumption, the 5 largest bioenergy consumers represent more than half of the EU’s total bioenergy consumption (54%). All these countries have been
Germany remains the leading country with 17% of total EU-28 consumption, followed by France with 12%, Italy and Sweden with 9% each, and Finland with 7%.
Can Europe become a leader
In October 2017 the European Battery Alliance was launched by EU Commission Directorate-General for Energy to make Europe the powerhouse of the global battery market. The announcement underscores the growing role that batteries will play in the power, chemical and automotive sectors, but is also a reminder that European manufacturers are lagging behind their Asian counterparts. It is widely accepted that Li-ion batteries will be the dominant energy storage technology in the next decade because of the versatility both in terms of power and energy. However, their performance needs to be improved in terms of energy density, charge/discharge speed and reliance on raw materials. In particular their supremacy has been challenged in recent months because of fear over lack of raw materials, in particular cobalt. The price of one tonne of cobalt went from US$32,500 to US$81,000 between 2016 and 2017. Cobalt is a key component of the cathode and most of the resources are located only in the Democratic Republic of Congo. This is why battery technology promoters are
the anode, the cathode, the separator and the electrolyte. In recent years battery startups have emerged to propose alternatives to Li-ion. Conamix, a U.S.-based start-up, raised several million dollars in June 2018 to develop a cobalt-free electrode (the company is backed by Albermarle and U.S. utility Exelon). Other options considered are sodium-ion – i.e. replacing lithium by cheaper sodium – or zinc-air batteries.
However, the recent bankruptcy of the promising AquionEnergy battery technology illustrates that the sector remains highly competitive and the future technology uncertain. AquionEnergy had developed saltwater electrolytes to reduce environmental risk. However, its technology was not cost-competitive for short-term duration needs and the company went bankrupt in March 2017 to be then acquired by an unknown investor in July 2017.
* Sources: https://www.chemistryworld.com/news/battery-builders-get-the-cobalt-blues/3008738.article https://www.greentechmedia.com/articles/read/saltwater-aquion-emerged-from-bankruptcy-new-owner#gs.uruBWQk
105
Figure 2.7. EU-28 gross final energy consumption of bioenergy per market segment (2015)
150.000
ktoe
135.000
120.000
105.000
90.000
75.000
60.000
45.000
30.000
15.000
02000 2002 2004 2006 2008 2010 2012 2014 2016 2018 2020
Bioheat Biofuels for transport Bioelectricity
82.921
2015:112.374 ktoe
14.15815.295
90.051
29.092*
19.855
residential42.288
biogas128bioethanol
2.680
biodiesel11.345
power only6.466
CHP8.829
other sectors2.089
service4.422
derived heat12.759
industry21.363
Bioheat82.921
74%
Biomasfor trans.
14 15813%
Electricity15.29514%
* Target for liquid biofuels for transport includes multiple countingsSource: Eurostat, National Renewable Energy Action Plans 5NREAPs), AEBIOM’s calculations, WEMO2018 Eu
rope

The EV charging network is growing exponentially, outpacing investment in CNG and H2 fueling networks
The European network of public and private EV charging stations is growing rapidly.
• A total of 3.3 million EV charging stations existed in Europe at the end of 2017, of which nearly half a million EVs were added in just 20172.
• In comparison, there are ten times fewer compressed natural gas (CNG) stations in Europe (3,408 according to NGVA Europe 2016 market report).
• Finally, there were 139 hydrogen stations in operation in Europe as of February 20181 (106 as of January 2017). Out of the 33 stations opened in Europe since January 20171, 24 opened in Germany.
Cost, ease of installation and strong government push underpin EV infrastructure growth.• An increasing number of
EV charging stations both to the
public and for private use. Costs now range from a couple of hundreds euros for homes to €50,000 to fast charging station2.
• However opening a hydrogen refueling station requires to install a facility composed of several systems to store, compress and distribute gas.
With very few H2 stations in place, installation costs are still very high. For example the Avia Orly Ouest station built in the Paris area by Air Liquide in December 2017 was estimated at
3.
Figure 2.9. 139 Hydrogen reflueling stations
Sources: H2Stations
Figure 2.10. 3.3 million EVs charging stations
Sources: Chargemap
to alternative mobility in Europe, but electric vehicles are catching up
The transportation sector contributes to roughly a quarter of European greenhouse gas emissions (GHG) and is predicted to fall behind its 2020 reduction targets (emissions from transport in 2015 – including aviation but excluding international shipping – were 23% above 1990 levels according to the
engines is of the utmost importance to decarbonate the sector.
In this report Capgemini chose to look at the status of three types of vehicle technology contributing to the decarbonization of the sector:Gas Vehicles (LPGV) and Natural Gas Vehicles (NGV), Electric Vehicles (EV), and Fuel Cell Electric Vehicles (FCEV).1. Driven by the Italian market, LPG and NGV represent the majority of all
alternative vehicles in Europe enabling decarbonation, respectively 75.7% and 19.5% in 2016.
2. EV represented 4.7% of the European stock of alternative vehicles in 2016. As the carbon emissions reduction targets and environmental standards increase, the share of EV is poised to increase.
3. Sales of FCEV remain anecdotical in Europe. Some 180 FCEV passenger cars were sold in 2017 according to the European Commission with Toyota and Hyundai being the main vendors. As for light commercial vehicles, 50 Renault Kangoo vehicles were sold to the Rungis market in France. Capgemini estimates 1,200 FCEVs (passenger and commercial) circulated on European roads in 2017, primarily in Germany and France.
Figure 2.8. Fleet of alternative vehicles in Europe (2016)
FCEV: 1,200
Vehicules
EV: 496,550
Vehicules
NGV: 2.046 Millions
Vehicules
LPG: 7.928609 Millions
Vehicules
Source: IEA, IANGV,EAFO, Capgemini Consulting analysis
1 LBT; TUV SUD; https://fuelcellsworks.com/news/germany-had-the-highest-increase-of-hydrogen-refuelling-stations-worldwide-in-2017
2 Newmotion, https://newmotion.com/en_GB/about-us/press-room/electric-vehicle-charging-on-the-rise-across-europe
3 Automobile Propre; http://www.automobile-propre.com/hydrogene-air-liquide-inaugure-nouvelle-station-orly/
106 A Strategic Overview of the Global Energy Markets

Germany focuses on hydrogen mobility initiativesThe use of hydrogen in mobility is expanding in
• Public transportation with hydrogen buses – Hydrogen buses lead to no additional operational
constraints compared to combustion engine buses: refueling takes only 5-10 minutes and the range can be as much as 400 km thanks to the high energy density of H2 fuel cells3.
– As of 2018, 386 hydrogen buses are either in operation or planned mainly through 5 initiatives (CHIC, HyTransit, High V.LO-City, JIVE, 3Emotion) supported by the Fuel Cell and Hydrogen Joint Undertaking (FCH JU): a unique public private partnership supporting research, technological development and demonstration activities in fuel cell and hydrogen energy technologies in Europe3.
–
over Europe3.
–hydrogen projects: they have predictable recharging patterns and vehicles make regular stop-overs at the same location equipped with a single hydrogen refueling station4.
– In June 2018, ENGIE Cofely opened a hydrogen station to power 50 utility vehicles to be used by the company’s technicians (project supported by the FCH JU)5.
Other early stage H2 applications aiming at reducing gasoline and diesel consumption:• Rail transportation
– In November 2017, the Lower Saxony transport authority (Germany) signed a contract with Alstom for the delivery of 14 hydrogen Coradia iLint trains6.
• Heavy-duty transportation – The H2-Share project started in 2017 aims at testing a
refueler on North-West European roads7.
Germany on track to overtake Norway as the largest European EV market
1. EV sales increased by 21% in 2017 in Europe and reached around 230,270 units when at the same time overall vehicles sales increased by only 3.4%. In 2017, electric vehicles represented 1.5% of overall vehicles sales (~15.6 million) in Europe.
2. Norway and Germany were the largest EV markets in 2017: – Norway is the European leader in terms of market share
with 39% of new car sales being electric. In comparison, the value is six times higher than Sweden which has the third-highest global market share (6%), after Iceland (12%,
– Germany saw the biggest increase in electric vehicles sales with 54,560 EV sold in 2017 against 24,000 in 2016. The uptake of electric vehicles is still largely driven by the policy environment. The ten leading countries in electric vehicle adoption all have a range of policies in place to promote the uptake of electric cars.
3. The Netherlands is the only country where sales of electric vehicles decreased between 2015 and 2017.
Netherlands related to the private use of company cars. This change ended the tax incentive for Plug-In Hybrid Electric Vehicles (PHEVs) in early 2017 while retaining a tax advantage for Battery Electric Vehicles (BEVs).
Figure 2.11. New electric vehicle (EV) sales in Europe (BEV & PHEV by country)
Norway
France
Germany
UK
Netherla
nds
Sweden
10
20
30
Tho
usan
d
40
50
60
70
0
2013 2014 2015 2016 2017 62,26
54,78
47,25
34,78
20,35
11,07
Sources: International Energy Agency, WEMO 2018
3 AFHYPAC, http://www.afhypac.org/documents/divers/ElementEnergy%20Brochure%2007-18%20web.pdf
4 AFHYPAC, http://www.afhypac.org/documents/divers/H2%20Mobilit%C3%A9%20France%20EN%20FINAL%20UPDATED.pdf
5 ENGIE, https://www.engie.com/en/journalists/press-releases/largest-hydrogen-utility-fleet-alternative-multi-fuel-station/
6 ALSTOM, http://www.alstom.com/press-centre/2018/07/coradia-ilint-hydrogen-train-receives-approval-for-commercial-operation-in-german-railway-networks/
7 NWEUROPE, http://www.nweurope.eu/projects/project-search/h2share-hydrogen-solutions-for-heavy-duty-transport/
107
Euro
pe

Electricity market
Evolution of the capacity mix
Just as in 2016, renewable capacities were invested in to ensure the EU’s move towards a more renewable mix.
• With 15.6 GW capacity installed in 2017, wind broke a new annual record 1 and led the way in renewable energies (up by
connected in 2017, including for example: – 570 MW at Race Bank in England (connected in May 2018) –
wind farm (generating since October 2017).• Fossil fuel capacities continue to be decommissioned in
the EU, with a decrease of 10.3 GW in 2017 led mainly by a constant decline in coal capacity (7.5 GW): – Closure of Germany’s Wardohl-Elverlingsen coal plant
accounted for the loss of 310 MW (disconnected in March 2018)2.
• However, with 2.6 GW capacity commissioned in 2017, gas is the only fossil fuel with a positive balance of installed vs. decommissioned capacities for two years in a row. This evolution is explained by the reopening of previously mothballed gas capacities to face small adequacy challenges occurring in 2017.
3-Infrastructures & Adequacy of Supply
Figure 3.1. Installed and decomissioned generation capacity per type of source (2017 versus 2016)
10,000
15,000
20,000
-15,000
CoalGas
Fuel oilWind
Solar PVBiomass
HydroWaste
GeothermalOcean
Nuclear
-10,000
-5,000
0
5,000
Dec
om
mis
sio
ned
and
new
inst
alle
d c
apac
ity
[MW
]
Fossil fuel technologies Low carbon technologies
-7,510 -7,510
-2,256 -2,197 -2,197
-486 -640
3,115
12,490
6,7006,030
1,064657
154 613
281,741
2,612
15,638
964
1,085
807
5
2017
2016
Decommissioned (MW)
New capacity (MW)
Source: WindEurope Annual Statistics 2017
In Europe adequacy of supply was maintained in 2017 in spite of increased intermittency and a slight 0.5% growth in consumption.
• Renewables’ share in the capacity mix continued growing steadily (+6.7%) while carbon capacities were steadily decommissioned (-2.6%).
• The renewables upwards trend is
58% of forecast generation capacity in 2025.
The European Union took further steps towards market integration.
• All network codes have been published and their implementation is ongoing. TSOs’ roles are now evolving to meet the new regulations.
market coupling (XBID) went live in June 2018.
• The European Commission strengthened its commitment to interconnection infrastructure with new principles for setting interconnection targets.
On a local level, the gradual transformation of the electricity market revolves around system operators .
• Local consumption and production patterns are evolving and require adapted local infrastructures and a strong collaboration between Transmission System Operators (TSOs) and Distribution System Operators (DSOs).
• Smart meter deployment keeps
the transformation of local markets.
Net EU power capacity increased by 17.8 GW (1.8%) in 2017, with the 10.3 GW decommissioning of fossil fuel capacity compensated for by 28.1 GW of new capacity
1 WindEurope annual statistics 2017
2 https://beyond-coal.eu/2018/03/23/coal-plant-retirements-gain-pace-europe/
108 A Strategic Overview of the Global Energy Markets

Evolution of the generation mix
Evolution of energy consumption
The share of renewables energies generation stabilized at 30% of the mix in 2017 after increasing for many years.
In 2017, hydro was the only renewable source to decrease in the generation mix. Hydro reservoirs were close to historical lows in Mediterranean countries, leading to generation unavailability for this source1.
The winner in this hydro situation was natural gas, the only fossil fuel to have an increased share in the EU generation
mix1. For example, in Portugal, natural gas met 69% of summer 2017 portuguese consumption while being exported to Spain.
strong wind capacities such as Germany and the UK:
• Germany: wind power generation increased by +26.5 GWh to reach 106.6 GWh, 16.2% of the total mix2.
• United Kingdom: on June 7, it established a renewables peak power output record of 19.3 GW (incl. 9.6 GW wind), covering 55% of the midday power demand in the country3.
For the third year in a row, electricity consumption increased in the EU-28. Compared to the 1.9% rise the previous year, consumption appeared to stabilize.
This slight increase in power consumption follows the hottest (2016) and the second hottest (2017) years globally since 18804, joined by the coldest winter in several year, reaching some record lows in Eastern and Central Europe.
• In Poland, electricity consumption increased by 2%
Italy, Spain and Portugal, electricity consumption also
Figure 3.2. Overview of 2015-2017 generation mix evolution in EU countries (TWh)
Thermal nuclear Fossil fuels
Renewable Other hydro
Other source
Generation mix 2016
Generation mix 2017
Generation mix 2016
Generation mix 2017
Total 2017: 3,090 TWh
Focus on fossil fuels mix evolutionin EU countries (TWh)
Focus on renewable generation mix evolutionfor EU countries (TWh)
Generation
- of w
hich lignite
- of w
hich hard coal
- of w
hich gas
- of w
hich oil
- of w
hich mixed fu
els
- of w
hich other f
ossil fuels
700
600
500
400
300
200
100
0
Total renewable
generation
- of w
hich wind
- of w
hich solar
- of w
hich biomass
- of w
hich other r
enewable
- of w
hich renewable hydro
1,000
600
900
800
700
500
400
300
200
100
0
Cap
acit
y [T
Wh]
Total 2016:3,068 TWh
31 TWh1%
36 TWh1%907 TWh
30%
796 TWh26%
788 TWh25%
1,303 TWh42%
1,320 TWh43%
26 TWh1%923 TWh
30 %
27 TWh1%
Source: ENTSO-E database – Capgemini analysis, WEMO2018
Figure 3.3. Electricity consumption in EU-28 (2011 to 2017 and 2020, 2025 projections)
500
1,000
2,000
1,500
4,000
3,000
2,500
3,500
0
2011 2012 2013 2014 2015 2016 2017 2020 2025
3,035 3,0422,957 3,046 3,061
2,9893,086
3,272
Elec
tric
ity
con
sum
pti
on
in E
U-2
8 [T
Wh]
CAGR 2017 -2025: +0.8%
+0.49%
3,001
Source: ENTSO-E database – Capgemini analysis, WEMO2018
The EU power generation in 2017 increased slightly by 0.7% (+21TWh) to reach 3,089 TWh generated in 2017
Electricity consumption increased by 0.5% in 2017 to reach 3,061 TWh
1 Winter Outlook 2017
2 https://ag-energiebilanzen.de/28-0-Zusatzinformationen.html
3 https://www.telegraph.co.uk/business/2017/06/07/uk-sets-new-renewable-energy-record-wind-solar-surge/
4 NASA, https://www.giss.nasa.gov/research/news/20180118/109
Euro
pe

Overall adequacy of supply
extreme weather conditions and political events
Evolution of imports, exports & prices
Winter 2017-2018 would have been uneventful if not for the Serbia-Macedonia-Montenegro power deviation3.
• In January 2018, the political disagreements by the Serbian and Kosovar authorities caused a frequency deviation for the following three months, a never yet encountered situation in Continental Europe, where the missing energy amounted to more than 113 GWh.
Adequacy was endangered but maintained despite summer 2017 events4.• Several overloading events occurred on AC lines in the south
Hungary and Poland (extreme wind).• In August and September, half the nuclear power plants in
Sweden were under maintenance, increasing the need for imports to the south of the country. Further maintenance for some of them led to a strained few hours of high prices in Sweden but also in Denmark and Finland.
• The non-availability of two nuclear power plants in Germany and numerous outages in the Czech Republic endangered the voltage stability in the region.
• France and Germany remain the main exporters of electricity. In contrast, Italy keeps its rank as the biggest importer5.
• To secure its electricity supply, and due to poor
have increased.• Sweden’s net exports increased in 2017 as its nuclear
generation capacities returned to normal.• To secure its electricity demand, Bulgaria imposed a
27-day export ban from January 13 until February 8, the longest ever.
Average spot prices rose in 2017 and are projected to stabilize in H1 2018.• This surge in European wholesale prices is mainly connected
to the greater use of natural gas in electricity generation to mitigate the hydro situation, as mentioned earlier, coupled with an increase in gas prices5.
• CO2 prices increased from €8-20/tCO2
average prices of fossil-fuel generation.• The majority of European markets noted a high increase in
electricity prices in January due to the cold spell. However,
Figure 3.4. Map of electricity flows
Net Exporting country
Net Importing country
Poland3
Finland20Norway
-15
Sweeden-19
Germany-48
Belgium6
France-35
Spain15
Portugal-3
UK16
Ireland
Greece5Italy
36
Slovenia
Austria8 Hungary
11
Slovakia3
Czech Republic-14
Denmark5
Netherland4
Switzerland6
Source:
110 A Strategic Overview of the Global Energy Markets
increased, by 2%, 1.6% and 4% respectively,1 with high demand peaks in January 20172.
• Other European countries were more or less stable, with for example a 0.5% increase in Germany and a 0.4% decrease in France1.
1 https://yearbook.enerdata.net/electricity/electricity-domestic-consumption-data.html
2 https://docstore.entsoe.eu/Documents/Publications/SDC/Winter_Outlook_2017-18.pdf
3 https://www.entsoe.eu/news/2018/03/06/press-release-continuing-frequency-deviation-in-the-continental-european-power-system-originating-in-serbia-kosovo-political-solution-urgently-needed-in-addition-to-technical
4 ENTSO-E Winter Outlook 2017
5 The European Power Sector in 2017, Agora Energiewende

In 2025, low-carbon capacities are expected to represent 68% of the European Union’s capacity mix
Installed capacity forecast
Recent political decisions from Brussels are likely to accelerate the decommissioning of existing
In April 2017, the European Commission voted for tougher environmental performance standards for Large Combustion Plants (LCP), including hard coal and lignite plants 2. Power generators failing to reduce their emissions in line
closure. According to the European Environmental Bureau 3, 82% of coal capacities expected to be operating at that time
The EU is urging countries to invest in Renewable Energy Source (RES) infrastructure for immediate replacement of ageing components, as according to the IEA, investment in the power sector prior to 2020 will be less costly than after that date4.
The decrease in wind and PV prices along with the generalization of tendering process areas in Europe will be instrumental in the investment in new capacities, and thus to the achievement of a 32% renewables share in the 2030 power mix5.
Nuclear share in electricity mix will decrease slightly after 2020.
The German nuclear phase-out plan continues with the decommissioning of Philippsburg 2 at the end of 2019. However, new nuclear capacities will see the light of day with Finland’s 1.6 GW Olkiluoto-3 plant, expected to begin regular operation from May 2019. EDF’s Flamanville nuclear plant in France has delayed the start-up of its new third reactor for another year, with full operation starting in 2020. As a consequence the closure of Fessenheim will also be delayed.
the Nordic market remained stable as it was
• After an initial stabilization of price volatility, prices increased in 2017, particularly in Q1, with its harsh weather conditions1.
Figure 3.5. Average European electricity spot price (2009 to H1 2018)
Ave
rag
e Eu
rop
ean
elec
tric
ity
spo
t p
rice
[€/M
Wh]
60
50
40
30
20
10
0
2009 2010 2011 2012 2013 2014 2015 Year2016
Year2017
H1 2018
43.15
49.16
54.06
49.86 47.70
40.4541.51
37.00
44.36 44.17
Source: Power Exchange websites – Capgemini analysis, WEMO2018
Figure 3.6. Current (2017) and future electricity capacity mix (2020, 2025)
Coal and ligniteGas
Year % oftotal mix
2016 43%2017 41%
2020 37%2025 32%
Other fossil fuelsNuclearHydroWindSolar
OtherOther RES
Year % oftotal mix
2016 57%2017 59%2020 63%2025 68%
Low-carboncapacities
2025: 1088 GW Fossil-fueledcapacities
2020: 1004 GW
2017: 988 GW 14%
22%
12%
11%
13%
17%
20%
12%4%
3%
10%
17%
24%
15%
4%
16%
17%
5% 7%
12%15%
6%
9%
15%
Source: ENTSO-E database – Capgemini analysis, WEMO2018
Generation & consumption forecastAs the EU capacity mix turns to renewable power investment, the EU objective of 32% RES in the
• After having analyzed past weather patterns in Europe and established various scenarios, a study published in June 2018 went as far as saying that this objective will be outperformed 6.
• Generation from nuclear capacities is likely to increase in 2018 and to stay constant until 2020, when some French nuclear plants should become available for production
Germany’s Gundremmingen B plant at the end of 20177.• With the increase in both renewables and nuclear
generation in 2018, fossil generation is expected to see a
1 European commission, Electricity market quarterly reports
2 http://ec.europa.eu/environment/pdf/31_07_2017_news_en.pdf
3 http://eeb.org/new-rules-hasten-end-for-europes-dirtiest-power-plants/
4 https://ec.europa.eu/energy/en/topics/energy-strategy-and-energy-union/2050-energy-strategy
5 http://europa.eu/rapid/press-release_STATEMENT-18-4155_en.htm
6 https://www.sciencedaily.com/releases/2018/07/180726161255.htm
7 The European Power Sector in 2017, Agora Energiewende 111
Euro
pe

sharp decrease in 2018, and a drop of 16% is forecast by 2020 (assuming constant consumption)1.
Electricity demand is forecast to rise by 0.7% per year between 2017 and 2025.• Demand continues to increase due to the economic growth
forecast2
two factors will probably be competing forces with energy
electricity consumption in Europe.
• The target CO2 emissions reduction is a factor in the electricity demand increase forecast, as it requires moving from conventional fuels to electric power, driving the
continuous growth in electric vehicles (both BEVs and PHEVs), and so on1.
• Finally, the digital revolution is also driving the demand increase. Electricity consumption by Bitcoin mining, for instance, is growing and it is likely to represent 0.5% of the world’s electricity by the end of 20183.
Adequacy of supply forecast
Regulation and implementation of European Market integration
In the short term, the risk to Europe’s security of supply remains under control4.
According to ENTSO-E, adequacy of supply will be maintained throughout Europe in the summer of 2018 given the estimated availability of generation, market-based demand-side response and commissioned interconnections.
However, hydro reservoir levels still need to be monitored: 2017 left the Alpine region with hydro levels close to historical lows. Regional Security Coordinators (RSC) will have to assess closely the week-ahead adequacy situation in Austria and Switzerland where hydro generation amounts to more than half the capacity, and ensure that TSOs will be ready in case any risk materializes.
Furthermore, generation curtailment might be needed in case of renewable generation excess and low demand in Ireland and south Italy.
In the mid-term, adequacy of supply will still be secure but some areas should be monitored.
ENTSO-E’s base case scenario for the Mid-term Adequacy Forecast (MAF) shows that most countries will be able to secure their adequacy of supply by 2020. But high risks are still observed in some countries like Cyprus, Ireland or Malta, where a Loss Of Load Expectation (LOLE) greater than 10h/y is forecast5.
For 2025 and with the 2017 MAF base case scenario, adequacy of supply will continue to be under control for most countries. However, the situation could worsen in the Baltic area (due to aging power plants for instance). In contrast, adequacy of supply could improve between 2020 and 2025 in Bulgaria and Northern Ireland, thanks to planned commissioning of CCGT plants and a new interconnector respectively.
All 8 electricity network codes are now published,
• Emergency & Restoration: published in November 2017• Electricity Balancing: published in November 2017• System Operations: published in August 2017• Forward Capacity Allocation: published in September
2016 and implementation ongoing• High Voltage Direct Current Connections: published in
August 2016 and implementation ongoing• Demand Connection Code: published in August 2016 and
implementation ongoing• Requirements for Generators: published in April 2016 and
implementation ongoing• Capacity Allocation & Congestion Management:
published in July 2015 and implementation ongoing.
While the newest published codes will be more detailed in order to produce implementation guidelines in the coming years and shape the European electricity landscape, the EU witnessed in June 2018 the go-live for intraday coupling, whereas the Regional Security Coordinators are to be implemented in December 2018.
The evolving European energy landscape is a driving force for regulation and coordination of the EU’s system operators.
• As we saw previously in this chapter, an increase in energy generation from variable renewable energy (VRE) sources is expected in the EU and will lead to more decentralized
Market integration continues to take shape at the European level thanks to the implementation of network codes6
1 The European Power Sector in 2017, Agora Energiewende
2 European Economic Forecast, Spring 2018
3 “Bitcoin will use 0.5% of world’s electricity by end of 2018, finds study” Independent, May 16th 2018
4 ENTSO-E Summer Outlook 2018
5 ENTSO-E, Mid-Term Adequacy Forecast, 2017 Edition
6 ENTOS-E - Key Recommendations for the Clean Energy Package
112 A Strategic Overview of the Global Energy Markets

Focus on infrastructure interconnexion
The Expert Group launched in 2016 issued its report in November 2017, in which it proposed a new approach for
1:
• Improve the functioning of the European electricity market through the implementation of the Third Package network codes and increase the capacity available to the market (it is for example proposed that AC interconnectors’ net transfer capacity be doubled)
• Favor new interconnection projects if any of the following
between countries or bidding zone (€2/MWh), ensuring that electricity demand can be met in all conditions, enabling export potential of excess renewable production
• Make mandatory a for each new interconnector
• Facilitate public involvement to help address any perceived concerns towards interconnectors
• Regularly re-evaluate the proposed methodological approachthe network infrastructure.
In the wake of this report, the European Commission issued a “Communication on strengthening Europe’s energy networks”
invested by 2030 to upgrade and expand European energy networks (national grids and interconnectors), leading to
2.
Figure 3.7. Map of interconnections levels and interconnections projects (2018)
Countries Projects of cross-border interconnections
Expecteddate
Capacity increase
DE - BE Lixhe (BE) / Oberzier (DE) – ALEGrO Project 2020
> 500 MW-
AT - IT Lienz (AT) - Veneto region (IT)Prati (IT) – Steinach (AT)
20242019
1,000 MWIT - SI 2022
1,500 MWDE - NL Doetinchem (NL) -Niederrhein (DE) 2018
CZ - SKinterconnector
2019 5,907 MW
1,000 MW
AT - DE Westtirol (AT) - Vöhringen (DE)Pleinting (DE) - St Peter (AT)
20242024
1,000 MW> 2,000 MW
DK - NL North Sea Wind Power Hub 2035 - 2040 14,000 MW
1,400 MWNO - UK Norway / United Kingdom interconnection– North Sea Link
2021
-PL - DK 2030
1,000 MWPL - LT Ostroleka (PL) -Stanislawow (PL) - LitPol Link Stage 2
2023
2,000 MW
FR - UK Warande (FR) / Kingsnorth (UK) – GridLinkMenuel (FR) / Exeter (UK) – FAB Project
AQUIND InterconnectorMandarins (FR) – Sellindge (UK) ElecLink
2022
1,000 MW2018
1,000 MWUK - BE Richborough (UK) / Gezelle (BE) – NEMO link
2nd interco UK - BE
2019
1,400 MW2028
NO - DE Tonstad (NO) / Wilster (DE) – NordLink 2020 1,400 MW
FR - DE Vigy (FR) - Uchtelfangen (DE) 2027 1,000 MW
RO - BG Black Sea Corridor 2020 1,339 MW ~3329 MW in 2030
DE - PL Vierraden (DE) / Krajnik (PL)Gubin (PL)-Eisenhuettenstadt (DE) - GerPol Power Bridge II
2020 > 1,000 MW
2026
FR - IT Grande-Ile (FR / Piossasco (IT) - 2019 1,200 MW
2022 1,400 MW2022 1,000 MW - 1,400 MW
ES - PT Fontefría (ES) – Ponte de Lima (PT) 2021 3,000 MW - 3,200 MW
DE - DK 2020 1,000 MW
FR - ES Cubnezais (FR) / Gatica (ES) - Golfe de Gascogne 2025 2,000 MW
Level of interconnections
Cross-borderinterconnections
commissioned
Projects of prioritycross-borderinterconnections& projects under study
< 5%
5% & < 10%
10% & 15%
> 15%
Priority electricitycorridors from the Trans-EuropeanNetworks for Energy(TEN-E) strategy
IE
NL DE
CH
SE
NO
FI
EE
LT
LV
PL
SKCZ
Baltic Energy MarketInterconnection Plan
Electricity
North Seas
ATHU
HRSI
UK
PT
ES
IT
GR
FR
LU
BE
BG
RO
NordBalt 17/02/2016DK
South WesternElectricity
Interconnection
Central / SouthEastern Electricity
Connections
Note: The European Council requires each country to have a minimum import capacity level equivalent to 10% of its installed capacitySource: European Commission, ENTSO-E – TYNDP, Enerpresse, various sources – Capgemini analysis, WEMO2018
In 2017 the European Commission once again strengthened its commitment to the interconnection infrastructure after the report of the Expert Group on electricity interconnection
Consequently, regardless of the voltage level (transmission or distribution), the system will need to handle greater volatility and less predictable generation, as well as less inertia.
sources and services connected at the distribution level, and will need to obtain and activate such services from
distribution network.
• Whereas regulation has made it mandatory for European TSOs to coordinate their actions, the risk of potential problems in DSO networks means that coordination and information exchange between both DSOs and TSOs is also key to managing an overall functioning system and securing adequacy of supply. System operators (TSOs and DSOs) bear responsibility for making decisions and operating their own networks securely and reliably.
1131 European Commission, Towards a sustainable and integrated Europe, Nov 2017
2 European Commission, Communication on strengthening Europe’s energy networks, Nov 2017
Euro
pe

Focus on market coupling (intraday & day-ahead)Day-ahead market coupling continued and intraday coupling emerged.
In Europe, 19 countries are coupled in the so-called Multi-Regional Coupling (MRC), covering about 85% of European power consumption and operating with no major incidents according to ENTSO-E.
While day-ahead coupling projects are quite mature (and continue with additional couplings like Croatia and Slovenia to Nord Pool in June 2018), Cross Border Intraday (XBID) went live in June 2018 with the help of 4 partners, EPEX SPOT, GME, Nord Pool and OMIE4.
Countries continue to launch their intraday markets (IDM), in order to be able to join XBID. Croatia (CROPEX) successfully launched its IDM in April 2017, and Bulgaria (IBEX) announced the launch of its IDM in April 20185, whereas countries like France and the UK continued their growth in volumes traded in IDM (50% and 20% increase y-o-y respectively in July 2018)6.
The balancing regulation is put into practice with the implementation of cross-borders projects.
To meet the objectives of the European Commission regulation regarding cross-border balancing, many cross-border projects have been launched. For instance, the PICASSO Project was
with eight more TSOs as members, with an objective to design, implement and operate a platform for automatic Frequency Restoration Reserves. Other projects worth mentioning include the Frequency Containment Reserves (FCR) project with ten TSOs, the Manually Activated Reserves
Reserves Exchange (TERRE, six TSOs) and the International Grid Control Cooperation (IGCC, 23 TSOs).
In addition, in June 2018 ENTSO-E submitted the implementation frameworks for imbalance netting and replacement reserves with approval expected by the end of 2018.
Figure 3.8. Market Coupling – WEMO 2018
IE
NL DE
CH
SE
DK
NO
FI
EE
LT
LV
PL
SK
CZ
ATHU
SI
UK
PT ES IT
GR
FR
LU
BE
BG
ROHR
XBID
XBID
XBID XBID
XBID
XBID
XBID
XBID
XBID
XBID
XBIDXBID
XBID
FB
FB
FB
FB
FB
Coupling areas
MRC (Multi-Regional Coupling)MRC without capacities4 MMC (4 Markets Market Coupling)Progressing towards Market Coupling
Day Ahead coupling projects
Intra day coupling project
Entry date Coupling region
Nov 2010 CWE (Central Western Europe)
Feb 2014 NWE (North Western Europe)
May 2014 SWE (South Western Europe)
Nov 2014 4 MMC (4 Markets Market Coupling)
Feb 2015 IBWT (Italian Borders Market Coupling)
May 2015 CWE FB (Flow Based)
Jan 2018 WB6 (Western Balkan)
FB
Go - livedate Coupling project
2018 XBID (Cross Border Intraday) XBIDRS
AL FY
BK
ME XK
Source: Power exchanges and various industry sources – Capgemini analysis, EEMO17 & WEMO 2018
114 A Strategic Overview of the Global Energy Markets
Since its beginnings in 2013, the European policy towards interconnection Projects of Common Interest (PCIs) has started to come to fruition and is accelerating:
• Approximately 30 PCIs are or will be in operation by the end of 2018 while 47 more are to be completed around 2020
• In August 2017, the Spain-France power link consultations started1. At the very beginning of 2018, the project obtained a €578 million2 funding commitment from the EU, more than three times the EU CEF support in 2016.
• These numbers have to be tempered as more than half the electricity infrastructure projects are experiencing delays3.
1 Inelfe, Electricity Interconnection France-Spain across the Bay of Biscay
2 Reuters, “EU provides record funding for a France-Spain power link”, January 25, 2018
3 European Commission, Communication on strengthening Europe’s energy networks, November 2017
4 Nord Pool Cross-Border Intraday: Questions & Answers
5 Balkan Green Energy News, “IBEX announces intraday market kick off”, April 2, 2018
6 EPEX SPOT and CROPEX press released

Topic Box 3.1: Capacity mechanisms
On November 30, 2016, the European Commission (EC) submitted the draft package Clean Energy for All Europeans, notably including proposals for a regulation on the internal market for electricity (Proposal for a Regulation of the European Parliament and of the Council on the internal market for electricity (recast), November 30, 2016, COM (2016)
One of the objectives of the EC is to harmonize the regulation of capacity mechanisms within the European Union
mechanisms set by several Member States.
Initial lack of regulation in the EU has led to a wide range of European capacity mechanisms.
In several Member States, the “energy only” market does
new generation capacities. As a consequence, some Member
security of supply in the future.
To prevent possible electricity shortages, many Member States have set up capacity mechanisms, which consist of remunerating capacity providers (power generation and demand response operators) for being available to produce during consumption peaks.
The approaches adopted in response to each Member State’s electricity systems and national energy policy issues have
to another, from more centralized to more market-based designs:
• Germany and Belgium rely on temporary strategic reserves: competitive tendering procedures are organized in order to select capacity generators which are outside the electricity market, and operate only in emergencies.
• Italy and Poland adopted a market-wide capacity mechanism based on competitive auction managed by TSOs where capacity providers can obtain compensation for being available.
• in the French market-wide capacity mechanism, energy
to cover the increased demand of their clients as well as a security margin, in order to operate on the market. Capacity
system operator (TSO), and sold by power generators to suppliers.
Although the designs of capacity mechanisms vary, they all
for making electricity capacity available. The existence of this revenue outside of the traditional electricity market has led the EC to suspect the existence of State aid. The EC launched a sector inquiry in April 2015 and made several recommendations
in November 2016 (Final Report of the Sector Inquiry on Capacity
Following the European Commission’s initiative, capacity market designs progress towards increasing cooperation between Member States.
According to the 2016 sector inquiry outcome, capacity mechanisms should not be a substitute for market reform failures. Before proposing capacity mechanisms, Member
resource adequacy concerns through market reforms. The
current overcapacity and regulatory failures: the incentives to invest, which would only rely on capacity mechanisms, may
the medium and long term.
The EC is also concerned that capacity mechanisms often provide subsidies only for national capacity providers, ignoring the value of cross-border imports and distorting
open and well-connected internal energy market are lost and costs for consumers increased.
In order to resolve those two major issues, the EC made
which have been included in the proposal for a regulation on the internal market for electricity (Articles 22 and 23, proposal for a Regulation of the European Parliament and of the Council on the internal market for electricity (recast), November 30,
which is being negotiated. The EC wants each Member State to:
• rely on a thorough necessity assessment going beyond national borders
• allocate support through competitive tenders open to all types of capacity providers
• limit competition distortions by appropriate design; • limit interference with price formation in the
energy markets• limit the impact on cross-border trade by allowing capacity
providers in other Member States to participate.
On this last issue, the European dimension for capacity mechanisms is, for now, limited to the objective of cross-border cooperation, with the intention that capacity providers can play a role directly or indirectly in neighboring
step for the EC and in the future, cross-border cooperation should free the way for an integrated capacity market.
115
Euro
pe

Decentralization of the energy system and the evolution of local balancing
Evolution of the DSO role
There are now many varied sources of energy in the power
distributed generation and energy storage in homes and vehicles, and microgeneration connected as part of consumers’ electrical installations.
volume and direction than were foreseen when the network system was originally planned, representing a challenge for
response are becoming increasingly important for balancing demand and supply.
In several EU countries aggregators are entering the electricity or reserve markets, though their progress has not been smooth. Regulatory frameworks are undergoing gradual reform in order to better enable their market access.
In European markets, existing aggregators work primarily with industrial or commercial customers. However, it is expected that new technologies will make it possible for residential
attractive and play a bigger role in system stability
In Germany, Next Kraftwerke, an aggregator of wind and biogas power plants, achieved a 50% capacity increase in 2017. It hopes to repeat this in 2018 and add more green power producers to its portfolio.
Electric vehicle registration in the EU-28
The increasing integration of electric vehicles (EVs) generates
grid technology, for example, enables better balancing of peak demand on the electricity grid by allowing EVs to both draw power from the grid and return it to the network.
2017 saw a 35% increase in the registration of plug-in hybrid electric vehicles (+224,000), compared with 2016. France recorded the largest number of registrations (over 26,110 PHEV), followed by Germany (more than 24,350 PHEV) and the UK (more than 13,580 PHEV)1.
loads. The EU energy transition process is accompanied by many new products such as smart appliances, and services at the local distribution level such as smart grids.• The Clean Energy Package (CEP) therefore proposes that
services from distributed energy resources such as self-generation, small-scale renewable generation, energy storage and power-to-heat services neutrally (rather than owning/operating them) and to integrate innovative solutions in order to manage local congestion and solve technical problems.
• The CEP ensures transparency of market transactions and recommends prohibiting DSOs from owning and operating
where they are required in order to ensure the reliable,
Essentially, these regulations and recommendations all contribute to the transition from a Distribution Network Operator to a Distribution System Operator, where DSOs will be responsible of local network balancing in strong collaboration with TSOs. In that respect, the Council of European Energy Regulators also backs Clean Energy proposals for:
• Greater TSO/DSO coordination• Greater participation of DSOs in the EU institutional
framework via a new EU-wide DSO entity• DSOs to produce network plans that feed into TSO
transportation network.
Aggregation’s new role in the market: grid management and appropriate grid balancing measures must accompany one another at local levels
The Clean Energy Package reinforces the “trusted third-party”, market facilitator role of the DSO.
1 European Environment Agency, Electric vehicles as a proportion of the total fleet, June 2018
116 A Strategic Overview of the Global Energy Markets

As a reminder, in 2009 the European Union set an objective of 80% smart meter deployment by 20202. However, this is not expected to be reached, as revised data in 2017 projected 72% penetration by 2020.
generation, among them Italy (32 million smart meters) and Sweden (5.2 million smart meters)3. – In Italy, Enel’s distribution arm e-Distribuzione plans to
install 13 million second generation meters by 2019 and another 28 million in the following decade.
–uncertainty around regulations and a greater diversity of DSOs (around 5 million expected to be installed by 2025).
include France (12 million smart meters in July 2018 representing 32% of the goal4), the UK (12 million smart meters in August 2018, 46%5) and Spain.
• Countries who didn’t choose mass rollout are now launching selective deployment, starting with large consumers: – After approval in 2016, Germany is getting ready for
batch of smart meter gateways, preparing for the million smart metering systems they will have to deploy6.
– In Belgium, smart metering deployment was approved in 2018, aiming to have smart meters in a third of Belgian homes by 20227.
Smart meter deployment
(1) http://www.berginsight.com/ReportPDF/ProductSheet/bi-sm13-ps.pdf
(2) https://www.enedis.fr/sites/default/files/field/documents/Enedis_Dossier_Presse_Linky_2017.pdf
(3) https://www.smart-energy.com/regional-news/europe-uk/second-wave-smart-meter-rollouts-begins-italy-sweden/
(4) https://www.geoplc.com/2018/07/compteurs-linky-un-moyen-de-reduire-sa-consommation-delectricite/
(5) https://www.gov.uk/government/statistics/statistical-release-and-data-smart-meters-great-britain-quarter-2-2018
(6) https://www.eon.com/en/about-us/media/press-release/2018/eon-kickstarts-smart-meter-rollout-by-ordering-16000-smart-meter-gateways.html
(7) https://www.rtbf.be/info/belgique/detail_la-belgique-va-generaliser-les-compteurs-d-electricite-intelligents?id=9937466
Smart meter deployment progresses in Europe: almost 40% of the target 281 million electricity customers had a smart meter by the end of 2017 1
The evolutions described above all raise the balancing mesh question. In the future, as the balancing zones will not only depend on the number of points in one geography, DSOs will have to redesign their local modelling by including the Renewable Energy Source (RES) concentration, EV distribution, and the producers’
Many EU DSOs have voiced plans to transform their businesses into service-oriented companies, and agreed to collaborate and share their competencies and knowledge. Associations of DSOs and partnerships will contribute towards the development of a regulatory framework to improve the
energy system.
117
Euro
pe

Gas market
Gas demand grew for the 3rd year in a row reaching its highest level since 2011.• The gas consumption increase was
mainly for use in power generation.• Portugal, Greece and Spain
experienced a double-digit gas consumption growth.
providing an actionable lever for security of supply.• Utilization rate of European terminals
is 27%.• Importation capacity is set to increase
by 70 bcm in 2023 (+30%).• LNG terminals are developing
alternative revenues.
On the supply side, Europe faces a reduction in indigenous gas production.• The Dutch government has decided
to gradually stop production at the Groningen site.
• European gas production decreased by 3.1%.
boosted gas production in Ireland.
Although considered key for EU security of supply, the European storage market remains under pressure.• Storage capacity remains level
at 95 bcm with only 7 bcm under construction.
• Despite this, February and March 2017 saw the lowest stock levels recorded since 2011.
Piped gas remains the main source to meet increasing gas demand.• Russia is still the largest EU supplier
(43% of European imports).• In 2018, the Netherlands became a
the 1950s.• Azeri gas will be an opportunity for
EU gas spot prices increased considerably by mid-2017.• TTF became the largest European
hub, overtaking NBP.• Low storage levels & weather
contributed to an increase in spot prices, in addition to general trends in the oil & gas sector.
118 A Strategic Overview of the Global Energy Markets

Gas demand grew for the 3rd year in a row reaching its highest levels since 2011EU-28 natural gas demand grew again in 2017 by 3.9% to reach 466 bcm mainly pulled by power generation.
• For the third year in a row, EU gas demand increased by 3.9% over 2016 to reach 466.4 bcm1.
• Despite this positive trend, after seven consecutive quarters EU gas demand was marked by a decrease of 2%2 in Q4 2017. This decrease was particularly marked in Denmark, Finland, Latvia and Sweden. Due to mild weather and relatively high temperatures in Northern Europe, gas demand for space heating decreased and took away the growth of gas consumption in the power sector.
• Not all EU members saw the same trend of increased consumption: Portugal showed the biggest growth with 21%3 more in 2017 than a year earlier. Greece, Croatia and Spain also experienced double-digit growth. The EU’s four biggest gas consumers had lower rates; Italy, Germany and France had consumption growth of 6.3%, 3% and 0.4% respectively, while demand fell by 3% in the UK4.
consumption. This market share increased by 11% compared to 2016. This growth rate was highest in Portugal (51.7%), Greece (23.2%), Spain (19.5%), and France (16.5%)5.
• Maintenance and safety assessments on French nuclear power plants was an important driver for the rising dependence on gas-fuelled generation in Western Europe. Also the low hydro levels and the lack of wind during cold days provided support to gas-powered generation6.
• In summer 2017, the gas price started to increase. Clean spark spreads reached their lowest level in Q1 2018. The situation of the EU’s biggest gas consumers was as follows:
– In the UK, both wholesale electricity and natural gas prices increased gradually. The clean spark spreads remained stable at around €6/MWh7 in Q1 2018, helped by slightly increasing carbon prices, securing competitiveness of gas-
– In Germany, electricity prices are lower compared to the UK. The clean spark spreads reached their lowest level since Q2 2015, averaging nearly €7/MWh1 in Q1 2018. With
the power market was 14.2%. – Even in the context of Europe’s declining energy
consumption, the share of natural gas should increase from 24% to 27%2 by 2040 vs. 2016 levels.
Figure 3.9. Gas consumption in EU-28 (Bcm) 2017
Bcm
2010 2011 2012 2013 2014 20162015
CAGR 2010-14: -5.1%
448.8
2017
466.4
417.7
300
400
600
500
200
0
100
521.0
470.3 457.9
400.9
450.7
+7.4%
+3.9%
+4.2%
Source: BP Statistical Review 2018, Capgemini Analysis WEMO2018
1 BP Statistical Review 2018
2 Eurostat, (data as of 13 June 2018 from data series nrg_103m)
3 Quarterly report on European gas market Vol. 10 and 11
4 Eurostat, (data as of 13 June 2018 from data series nrg_103m)
5 ENTSO-E data
6 Quarterly report on European gas market Vol. 10 and 11
7 Quarterly report on European electricity market Vol. 10 and 11
119
Euro
pe

Figure 3.10. Domestic gas production versus piped and LNG imports (2017)
Gas from domestic productionGas from pipeline importsGas from LNG importsTotal available supply (TWh)Evolution 2017 vs. 2016+5%
0 200 400 600 800 1,000
Total available supply [TWh]
RO
BE
PL
ES
NL
FR
IT
DE
UK
GR
BG
DK
IE
SK
CZ
AT
HU
FI
LV
100%
100%
19%
21%
100%
7%
52%
7%
100%
100%
100%
71%
66%
99%
93%
81%
93%
85%
79%
46%
77%
80%
39%
93%
34%
54%
7%
15%
29%
23%
13%
9%
13
20
35
36
50
53
56
92
99
109
131
180
211
352
397
492
793
867
992
-12.7%
-8.2%
7.8%
0.5%
2.5%
20.6%
6.2%
2.1%
8.5%6.8%
14.3%
1.7%
4.6%
10.0%
4.5%
0.3%
6.0%
-2.7%
Source: BP Statistical Review 2018, Capgemini Analysis WEMO2018
Europe faces reduction in indigenous gas production
Despite the world global production increase, EU-28 natural gas production continued to fall by 3.1%.
of 4%1
previous years. • European gas production decreased by 3.1% compared to
2016, to reach 117.8 bcm in 20173. Therefore, the European share of global gas production fell by 0.23% (to reach 3.2%). Several European players reduced gas production; for example in the Netherlands production fell by 9%, and Italy and Germany experienced drops of 4% and 8% respectively4.
• The Dutch government took the decision (on March 29, 2018) to stop gas production at the Groningen site - one of the largest gas reservoirs in the world – by 2030. This
The production shutdown planning consists of reducing production to 12 bcm before 2022 and to stop it by 20305.
Indeed, production has been declining since its peak of 53.8 bcm in 2013, reaching 21.6 bcm in 20176.
Despite this negative trend, the UK and Ireland proceeded to increase production:
• For the second consecutive year, the UK overtook the Netherlands and remains the largest natural gas producer in Europe. Its gas production grew by 0.6%7.
• In Ireland, gas production has been boosted since the
energy security of supply in Ireland (in 2014, 96% of Irish gas demand was imported from the UK). Indeed, at peak
of Ireland’s natural gas needs8.
1 Quarterly report on European electricity market Vol. 10 and 11
2 BP Energy Outlook (https://www.bp.com/content/dam/bp/en/corporate/pdf/energy-economics/energy-outlook/bp-energy-outlook-2018-region-insight-eu.pdf)
3 BP Statistical Review 2018
4 Quarterly report on European gas market Vol. 10 and 11
5 Enerpresse, Article N°12046
6 Reuters, https://www.reuters.com/article/us-netherlands-groningen-gas/netherlands-to-halt-gas-production-at-groningen-by-2030-idUSKBN1H51PN
7 BP Statistical Review 2018
8 Shell Ireland website, https://www.shell.ie/about-us/projects-and-sites/corrib-gas-project/securing-our-energy-future.html
120 A Strategic Overview of the Global Energy Markets

Piped gas remains the main source to meet increasing demand
Pipeline imports cover the major part of EU gas demand.
Piped gas was the major source satisfying increasing demand, in particular during cold days in winter, covering 81.6% of gas demand to reach 372.8 bcm1. The gas imports bill was estimated at around €69 billion.
• Imports from Russia increased by 12%2 and it continues to increase its exports to the EU-28 despite the EU’s ambition to reduce this dependency. Germany, the UK and Croatia3 saw the greatest increases. Russia remained the EU’s largest
gas supplier, covering 43% of European imports, followed by Norway with 38%. The main Russian supply channels are through Ukraine (44%), Nordstream (30%) and Belarus (24%)2.
• From April to September 2018, the Netherlands became
increase was supplied by Norway4. • In order to meet the incremental EU gas demand and
to improve gas supply channels, several gas pipeline projects are being studied in the design phase or are under construction. For example:
Figure 3.11. Map of gas imports (2017)
NORWAYPiped gas: 108.5 bcm
LNG: 3.9
RUSSIAN FEDERATIONPiped gas: 159 bcm LNG: 0.1
NIGERIALNG: 10.9 bcm
DK
FR
PT
ES
GR
IT
RO
BG
PL
SK
HU
HR
DE
CH
FI
EE
LV
IE
BE
SENO
UK
AT
SI
CZ
LT
NL
PERULNG: 3.9 bcm
TRINIDAD & TOB.LNG: 1.4 bcm
QATARLNG: 22.1 bcm
ALGERIAPiped gas: 33 bcmLNG: 9.4 bcm
LIBYAPiped gas:4.4 bcm
OTHERSLNG: 1.5 bcm
XX
Total net imports (in bcm)
Piped gas imports (net)
LNG imports (net)
Exporting country
Importing country
Existing LNG terminal
Re-exports
43.3
30.8
35.5
26.3
0.5
8.6
13.78.5
14.719
1.9
3
1.6
3.2
8.2
3.3
6.3
2.2
1.8
62.2
4.8
-1.6
Note: Others = Brazil, Equatorial Guinea, Egypt, Angola, United Arab Emirates Source: BP statistical review of world energy 2018, GIIGNL – Capgemini analysis, WEMO2018
1 GIIGNL
2 Quarterly report on European gas market Vol. 10 and 11
3 PJSC Gazprom Annual Report 2017
4 Reuters, https://www.reuters.com/article/netherlands-gas-imports/dutch-become-net-importer-of-gas-as-groningen-production-cuts-bite-idUSL8N1RW38L
121
Euro
pe
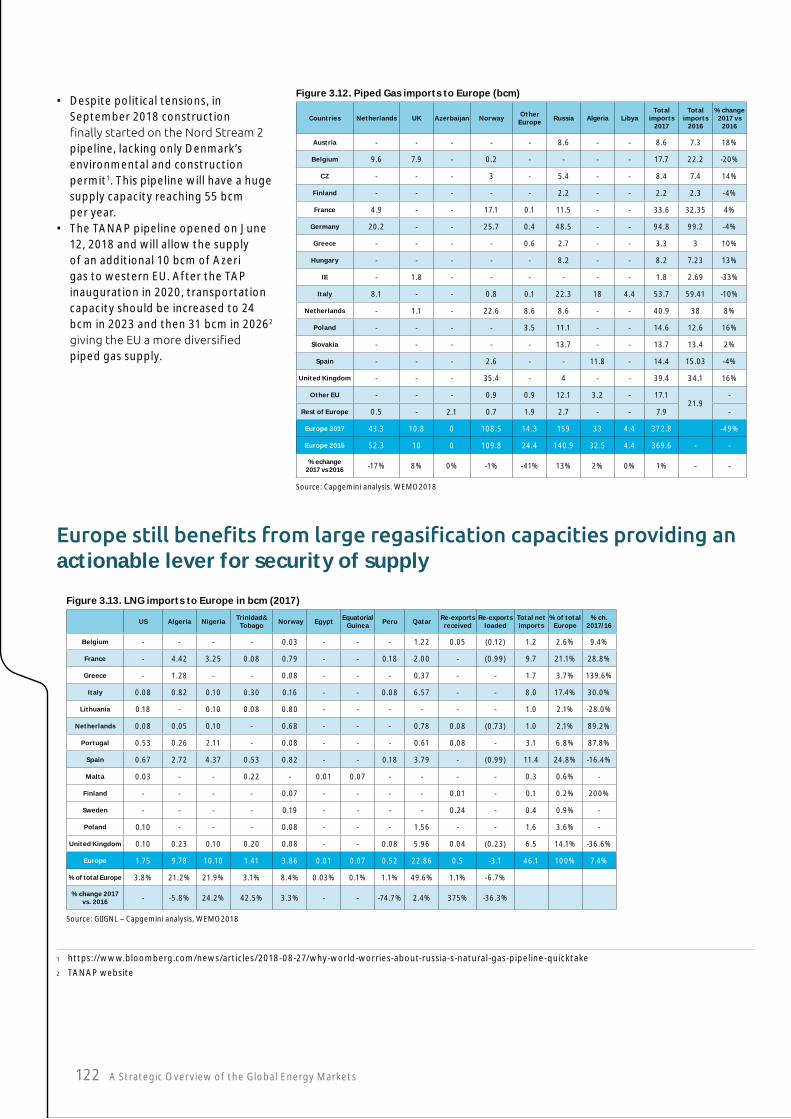
Figure 3.13. LNG imports to Europe in bcm (2017)
US Algeria NigeriaTrinidad&
Tobago Norway Egypt
Equatorial Guinea
Peru QatarRe-exports
receivedRe-exports
loadedTotal net imports
% of total Europe
% ch. 2017/16
Belgium - - - - 0.03 - - - 1.22 0.05 (0.12) 1.2 2.6% 9.4%
France - 4.42 3.25 0.08 0.79 - - 0.18 2.00 - (0.99) 9.7 21.1% 28.8%
Greece - 1.28 - - 0.08 - - - 0.37 - - 1.7 3.7% 139.6%
Italy 0.08 0.82 0.10 0.30 0.16 - - 0.08 6.57 - - 8.0 17.4% 30.0%
Lithuania 0.18 - 0.10 0.08 0.80 - - - - - - 1.0 2.1% -28.0%
Netherlands 0.08 0.05 0.10 - 0.68 - - - 0.78 0.08 (0.73) 1.0 2.1% 89.2%
Portugal 0.53 0.26 2.11 - 0.08 - - - 0.61 0.08 - 3.1 6.8% 87.8%
Spain 0.67 2.72 4.37 0.53 0.82 - - 0.18 3.79 - (0.99) 11.4 24.8% -16.4%
Malta 0.03 - - 0.22 - 0.01 0.07 - - - - 0.3 0.6% -
Finland - - - - 0.07 - - - - 0.01 - 0.1 0.2% 200%
Sweden - - - - 0.19 - - - - 0.24 - 0.4 0.9% -
Poland 0.10 - - - 0.08 - - - 1.56 - - 1.6 3.6% -
United Kingdom 0.10 0.23 0.10 0.20 0.08 - - 0.08 5.96 0.04 (0.23) 6.5 14.1% -36.6%
Europe 1.75 9.78 10.10 1.41 3.86 0.01 0.07 0.52 22.86 0.5 -3.1 46.1 100% 7.4%
% of total Europe 3.8% 21.2% 21.9% 3.1% 8.4% 0.03% 0.1% 1.1% 49.6% 1.1% -6.7%
% change 2017 vs. 2016 - -5.8% 24.2% 42.5% 3.3% - - -74.7% 2.4% 375% -36.3%
Source: GIIGNL – Capgemini analysis, WEMO2018
actionable lever for security of supply
Figure 3.12. Piped Gas imports to Europe (bcm)
Countries Netherlands UK Azerbaijan NorwayOther
EuropeRussia Algeria Libya
Total imports
2017
Total imports
2016
% change 2017 vs
2016
Austria - - - - - 8.6 - - 8.6 7.3 18%
Belgium 9.6 7.9 - 0.2 - - - - 17.7 22.2 -20%
CZ - - - 3 - 5.4 - - 8.4 7.4 14%
Finland - - - - - 2.2 - - 2.2 2.3 -4%
France 4.9 - - 17.1 0.1 11.5 - - 33.6 32.35 4%
Germany 20.2 - - 25.7 0.4 48.5 - - 94.8 99.2 -4%
Greece - - - - 0.6 2.7 - - 3.3 3 10%
Hungary - - - - - 8.2 - - 8.2 7.23 13%
IE - 1.8 - - - - - - 1.8 2.69 -33%
Italy 8.1 - - 0.8 0.1 22.3 18 4.4 53.7 59.41 -10%
Netherlands - 1.1 - 22.6 8.6 8.6 - - 40.9 38 8%
Poland - - - - 3.5 11.1 - - 14.6 12.6 16%
Slovakia - - - - - 13.7 - - 13.7 13.4 2%
Spain - - - 2.6 - - 11.8 - 14.4 15.03 -4%
United Kingdom - - - 35.4 - 4 - - 39.4 34.1 16%
Other EU - - - 0.9 0.9 12.1 3.2 - 17.121.9
-
Rest of Europe 0.5 - 2.1 0.7 1.9 2.7 - - 7.9 -
Europe 2017 43.3 10.8 0 108.5 14.3 159 33 4.4 372.8 -49%
Europe 2016 52.3 10 0 109.8 24.4 140.9 32.5 4.4 369.6 - -
% echange 2017 vs 2016 -17% 8% 0% -1% -41% 13% 2% 0% 1% - -
Source: Capgemini analysis. WEMO2018
1 https://www.bloomberg.com/news/articles/2018-08-27/why-world-worries-about-russia-s-natural-gas-pipeline-quicktake
2 TANAP website
• Despite political tensions, in September 2018 construction
pipeline, lacking only Denmark’s environmental and construction permit1. This pipeline will have a huge supply capacity reaching 55 bcm per year.
• The TANAP pipeline opened on June 12, 2018 and will allow the supply of an additional 10 bcm of Azeri gas to western EU. After the TAP inauguration in 2020, transportation capacity should be increased to 24 bcm in 2023 and then 31 bcm in 20262
piped gas supply.
122 A Strategic Overview of the Global Energy Markets

LNG imports continue to increase and reach new markets.1. This met 9.9%2 of
EU-28 gas need.
The EU-28 utilization rate increased to 27% but remains lower than the 34% global average. In addition, in 2018 Northwest Europe started to increase its reload activity in particular due to shipments from Yamal LNG.
• In 2017, the three countries that increased their LNG imports the most were the “Eastern gas axis” of Spain, Portugal and France, representing 52.3%3 of the total.
• Poland and Lithuania are using LNG to allow price competition. For instance, in 2017 Lithuania balanced its gas imports (50% LNG and 50% piped gas from Russia) allowing it to negotiate better prices.
• The U.S. is the new source of LNG for the European market, providing 1.75 bcm3 in 2017 and aiming to secure a greater market share in Europe. However, the market remains driven by price and Asian markets are still more attractive.
New customers Albania, Ireland and Estonia will enter the market with LNG terminals planned.
Malta started to import in 2017 (0.3 bcm) to reduce it dependency on heavy oil as a source of energy.
Overall the LNG import terminal annual overall capacity is 210 bcm4 - way above the 46.1 bcm imported in 2017 - and should be
exports with terminal liquefaction capacity at 500 bcm and 125 bcm capacity under construction in March 20185.
Figure 3.14. Map of pipelines and LNG terminals projects (as of June 2017)
CH
NO
DK
LIBYA
FR
ES
GR
IT
RO
BG
PL
SK
CZ
AT HU
SI HR
DE
LU
FI
EE
LT
LV IE
BE
RUSSIA
Nord Stre
am 1
Baltic Pipe
White Stream
Medgaz GALSI
SE
Gre
en S
trea
m
BBL NL
UK
ALGERIA
TAP
PT
Turkish StreamSCPX
TCP
BALTIC &NORTH SEA
60
85
ATLANTIC
77
92
EAST. MED
1529
BLACK SEA
0 0
WEST. MED
56
75
Interconnector projects - SOUTH-EAST EUROPE
Capacity (bcm)
Status
Commissioning date
Cost ($ billion)
TCP
32 In politicaldeadlock
5
2019-2020
Pre-feasibilitystudies
SCP-(F)X
5
~1.5
2021-2022
Launched
TANAP
16
8
2018
Underconstruction
TAP
10
2020-2022
4.4
Design. FID
Baltic Pipe
10
2022
1.6
Pipeline projects Projects of new pipelines (planned or under construction) Built segments of pipelines under construction Interconnection projects supported by the EU
LNG terminals
Existing
Under constructionand/or included within Mandatory Planning
Under study or proposed
TAP
Nominal annual capacityby receiving zone
(in bcm)
Existing Forecast by 2023
Interconnector projects AFRICA-EUROPE
GALSI Capacity (bcm) 8
Status Commissioning date
Start of construction2019
Cost ($ billion) 2.5
Nord Stre
am 2
Source: GIE GLE, European commission projects of common interest – Capgemini analysis, WEMO2018
1 GIIGNL
2 Quarterly report on European gas market Vol. 10 and 11
3 GIIGNL
4 GLE Investment database
5 IGU 2018 World LNG report 123
Euro
pe

Figure 3.15. Gas storage
2011/01/0
2
2011/05/0
5
2011/09/0
5
2012/01/0
6
2012/05/0
8
2012/09/0
8
2013/01/0
9
2013/05/1
2
2013/09/1
2
2014/01/1
3
2014/05/1
6
2014/09/1
6
2015/01/1
7
2015/05/2
0
2015/09/2
0
2016/01/2
1
2016/05/2
3
2016/09/2
3
2017/01/2
5
2017/05/2
8
2017/09/2
8
2018/01/2
9
0%
10%
20%
30%
40%
50%
60%
70%
80%
90%
100%
0
20
40
60
80
100
120
% F
ull
Tota
l sto
rag
e ca
pac
ity
(bcm
)
Capacity (bcm) %FULL
Source: Capgemini analysis, WEMO2018
Although considered key for EU security of supply, Europe’s storage market remains under pressure
European storage hit the lowest level since 2011 during winter 2018.
on high volume quickly accessible that can also be provided by storage. Therefore gas storage capacity remains a key factor for energy security of supply but hit its lowest level since 2011 during winter 2018.
The combination of cold weather in February and March and low import levels led to the lowest stock level recorded since 2011 at 18% of storage capacity. The situation was especially
Belgium, the Netherlands, Slovakia and France1.
Overall EU-28 storage capacity remains unchanged at
construction2. The low seasonal spread continues to send negative signals to storage operators, except in the UK:
storage capacity covering only 6% of the UK annual gas demand (20% for France) after the Rough facility closure in 2017. Dependence on the Belgium-UK interconnection pipeline was strong during winter 2018. With a high seasonal spread in the UK, the market is sending a price signal to storage operators incentivizing seasonal storage2. The UK accounts for 30% of EU-281 planned projects for new storage capacity. However, few of these are under construction making this situation permanent in the short term.
• In France, the storage market is under pressure due to the monopoly of two players. 2018 was a turning point with a new regulation set by the CRE3. The objective through open bidding for storage capacity, is to increase the level of stored gas and decrease the cost from €7.5/MWh to €5.2/MWh, thereby avoiding a repeat of the critical situation
on April 1, 20183.
1 GIE website https://www.gie.eu
2 European Commission Quartely report on European Gas market
3
124 A Strategic Overview of the Global Energy Markets

Figure 3.16. Gas spot prices
05/09/1
7
03/08/1
7
04/08/1
7
02/05/1
7
01/05/1
7
06/09/1
7
07/10/1
7
08/10/1
7
09/10/1
7
10/11/1
7
11/11/1
7
12/12/1
7
01/12/1
8
02/12/1
8
03/15/1
8
04/15/1
8
05/16/1
8
06/16/1
8
07/17/1
8
08/17/1
8
09/17/1
8
0
10
20
30
40
50
60
70
80
90
0
5
10
15
20
25
30
35
40O
il p
rice
($/b
arre
l)
Gas
pri
ce ($
/MW
h)
LNG-Japan US-Henry Hub NL-TTF UK-NBP Europe Brent FOB
Source: Capgemini analysis, WEMO2018
Following a period of convergence in international gas prices, EU gas spot prices increased considerably by mid-2017
Several factors led to this situation.
International gas prices experienced strong convergence during Q2 20171, the greatest since 2011. This situation remained stable until mid-2017, when spot prices at Asian and European hubs grew substantially:
• Japanese LNG price growth was supported by the robust increase in Chinese gas demand as well as strong global seasonal demand.
• In Europe, in August 2017, several factors contributed to a steady rise in gas spot prices: – Low storage levels, higher coal and oil prices, continued
conversion from coal to gas, Norwegian gas supply outage and concerns about French nuclear power availability.
–2017 and March 2018, compared to the U.S. dollar. The exchange rate increased to 1.23 in March 2018, having previously been 1.05 in January 20172. This development has widened the gap between European and American prices.
– Weather conditions had a major impact on gas prices at European hubs. In January 2018, above-average temperatures lowered gas prices. These prices rose sharply in March, due to late cold weather.
Traded volumes on European gas hubs fell by 4% in 2017 (amounting to 44,500 TWh). After the Brexit referendum, the Dutch Title Transfer Facility (TTF) hub overtook the UK’s National Balancing Point (NBP) and became the largest European gas trader. The TTF hub covered 56% of European traded volumes in Q1 2018, while the NBP share decreased to 31%3.
The French gas market is about to evolve. From November 1, 2018 the two existing hubs will merge into a single one. The French Energy Regulatory Commission (CRE) is insisting on this
the detriment of consumers in southern France4.
On the other hand, cold weather in North America reduced natural gas stocks and supported the sharp rise in gas prices between December 2017 and January 20185.
1 European Commission, Quarterly Report, Q1 2018
2 XE Currency Charts, https://www.xe.com/currencycharts/?from=EUR&to=USD&view=2Y
3 European Commission, Quarterly Report, Q1 2018
4 CRE deliberation https://www.cre.fr/content/download/16595/file/171026_2017-246_ZoneDeMarcheUnique.pdf
5 NGI the weekly gas market report http://www.naturalgasintel.com/articles/113294-eias-2018-henry-hub-natural-gas-price-forecast-rebounds-to-320mmbtu
125
Euro
pe

Retail energy prices in Europe
Residential gas prices remained stable.
• Across Europe, Household gas prices varied from less than 35€/MWh in Luxembourg to more than 120 €/MWh in Sweden,cheapest and the highest price.
(+26%), Bulgaria (+21%) and Denmark (+18%).• The largest falls in Household gas prices was recorded in Slovenia (-6%) and Germany (-5%). • Taxes and levies made up the largest contribution to the price of gas for households in
Denmark (53% of household gas price) and the Netherlands (51% of household gas price).
Average retail energy prices decreased in Europe between H2 2016 and H2 2017.
• Average household electricity and gas prices in Europe remained nearly stable in H2 2017 – Gas: -0.5% in H2 2017 compared to
H2 2016 – Electricity: -0.25% in H2 2017
compared to H2 2016.• Average industrial gas and electricity prices in Europe decreased in H2
2017 compared to H2 2016 – Gas: -9% for very small industries, -5% for small to medium industries and
0% for medium to large industries – Electricity: -2% for very small industries, -1.2% for small to medium
industries and -3.9% for medium to large industries.
Figure 4.2. Residential gas prices in Europe – all taxes included (H2 2017 compared to H2 2016, in local currency)
10%
15%
20%
25%
30%
-10%
0%
-5%
5%
Pri
ce c
hang
e H
2 20
17 v
s. H
2 20
16,
in lo
cal c
urre
ncy
(%)
Pri
ce (€
/MW
h, P
urch
asin
g P
ow
er P
arit
y)
Pre
-tax
pri
ceLe
vies
VA
T an
dre
cove
rab
les
HR BGUK BELU CZHU SI
EU28 ITFR NLDE LT AT PL PTES SEROLV IE SK EE DK
A
0
20
40
60
80
100
120
140
Source: EUROSTAT – Capgemini analysis, WEMO2018
Figure 4.1. Average European gas and electricity prices in 2017
Residential Industrial
Change in price between
H2 2016 and H2 2017
Min (€/MWh)
Max (€/MWh)
Change in price between
H2 2016 and H2 2017
Min (€/MWh)
Max (€/MWh)
Gas -0.5% 34.6 133.1 From -9% to 0% 17.3 66.5
Electricity -0.25% 133.9 287.6 From -3.9% to -1.2% 39.2 219.9
Source: EUROSTAT – Capgemini analysis, WEMO2018
4-Supply & Final Customer
126 A Strategic Overview of the Global Energy Markets

Industrial gas prices decreased in H2 2017 compared to H2 2016.
fall in industrial gas prices was observed in small to medium industries with a 30% drop in the Netherlands and the most
in very small industries in Lithuania with a 50% rise compared to H2 2016.
• The UK had the lowest industrial gas prices both for medium to large industries (17.3€/MWh) and for small to medium (46.6 €/MWh) industries and Romania had the lowest industrial gas prices for very small industries (29€/MWh).
• Sweden had the highest gas prices for all industries.
Figure 4.3. Industrial & Commercial gas prices in Europe – VAT excluded (H2 2017 compared to H2 2016, in local currency)
20
30
25
40
50
45
35
0
15
5
10
30%
20%
40%
-10%
-20%
-30%
0%
10%
40
60
50
70
0
30
10
20
60%
50%
-10%
-20%
-30%
10%
0%
30%
20%
40%
20
30
25
35
0
15
5
10
30%
20%
40%
-10%
-20%
10%
0%
Medium to Large Industries: 1,000 TJ (i.e. 277.8 GWh) < annual consumption < 4,000 TJ (i.e. 1,111.3 GWh)
Small to Medium Industries: 10 TJ < annual consumption < 100 TJ (i.e. 27.78 GWh)
Very Small Industries: annual consumption < 1,000 GJ (i.e. 0.2778 GWh)
RO HR LV DEBG SKLTEU28 IEUK PTLU FRESHUEE PL DKSI
ATBECZ SE
HUCZUK BE LUNL DEHR SKLV SEPLPT EEBG IT DKLTEU28 FRIE ATES
RO SI
UK ESPL LVSKDEFR CZEU28 IT SEHU PTBE RO ATNL EEDKBG
Pric
e [€
/MW
h, V
AT
excl
uded
]
Pric
e ch
ange
H2
2017
vs.
H2
2016
,in
loca
l cur
renc
y [%
]
Pric
e [€
/MW
h, V
AT
excl
uded
]
Pric
e ch
ange
H2
2017
vs.
H2
2016
,in
loca
l cur
renc
y [%
]
Pric
e [€
/MW
h, V
AT
excl
uded
]
Pric
e ch
ange
H2
2017
vs.
H2
2016
,in
loca
l cur
renc
y [%
]
Source: Eurostat – Capgemini analysis, WEMO2018
• Across Europe, the lowest residential electricity price was observed in Luxembourg the highest In
Germany, the renewable energy (EEG Umlage – Support to renewable electricity generators) accounted for more than 23% of the retail electricity bill. This surcharge rose from 6.35 ct/kWh to 6.88 ct/kWh between 2016 and 20171.
1 https://www.cleanenergywire.org/factsheets/what-german-households-pay-power
127
Euro
pe

2 https://www.eecc.eu/blog/booming-power-prices-in-romania-and-hungary
Figure 4.5. Industrial & Commercial electricity prices in Europe – VAT excluded (H2 2017 compared to H2 2016, in local currency)
Medium to Large Industries: 20 GWh < annual consumption < 70 GWh
Small to Medium Industries: 500 MWh < annual consumption < 20 GWh
Very Small Industries: annual consumption < 20 MWh
100
150
250
200
0
50
5%
-0%
10%
20%
15%
-10%
-15%
-20%
-25%
-5%
80
120
100
160
140
0
60
20
40
0%
-2%
2%
6%
4%
8%
-8%
-6%
-4%
80
140
100
120
0
60
20
400%
10%
20%
30%
40%
-20%
-10%
RO PLHU DKUK LVSI
LU PTELEU28 ES DEBESKHR IELT EE SE CZFRBG AT IT
RO EECZ FR ATPL DEESHU BELU UKSE BG NL LVPT ITHR SK EL
EU28DKSI IE
CZSILU EE ELNL ATBEDK PTLT
EU28PL ES DESE BGFR RO IE LV SK IT UKHUHR
Pri
ce [€
/MW
h, V
AT
excl
uded
]
Pri
ce c
hang
e H
2 20
17 v
s. H
2 20
16,
in lo
cal c
urr
ency
[%]
Pri
ce [€
/MW
h, V
AT
excl
uded
]
Pri
ce c
hang
e H
2 20
17 v
s. H
2 20
16,
in lo
cal c
urr
ency
[%]
Pri
ce [€
/MW
h, V
AT
excl
uded
]
Pri
ce c
hang
e H
2 20
17 v
s. H
2 20
16,
in lo
cal c
urr
ency
[%]
Source: Eurostat – Capgemini analysis, WEMO2018
Figure 4.4. Residential electricity prices in Europe– all taxes included (H2 2017 compared to H2 2016, in local currency)
Pri
ce c
hang
e H
2 20
17 v
s. H
2 20
16,
in lo
cal c
urre
ncy
(%)
Pri
ce (€
/MW
h, P
urch
asin
g P
ow
er P
arit
y)
HUSENL CZUK AT SIEL
ROFR LVITEE LT PTSK BEPLDKLU
EU28 BGHR IE DEP
re-t
ax p
rice
Levi
esV
AT
and
reco
vera
ble
s
-15%
-10%
-5%
0%
5%
10%
0
50
100
150
200
250
300
350
Note: Annual electricity consumption between 2,500 kWh and 5,000 kWh Source: EUROSTAT – Capgemini analysis, WEMO2018
Industrial electricity prices decreased in H2 2017 compared to H2 2016.
• Amongst the other EU countries, Germany had the highest electricity prices for both very small industries and small to medium industries, due to a high level of taxes.
• The UK had the highest electricity prices for medium to large industries. High electricity prices in the UK are partially explained by a
£18/ton (20€/ton) compared to other EU countries (6€/ton for the EU-ETS quotas).
• Romania, Sweden and Luxembourg had the lowest electricity prices respectively for very small industries, small to medium industries and medium to large industries.
• industrial electricity prices was observed in Greece, up 29% for medium to large industries.
• industrial electricity prices was recorded in Italy, with a drop of 19% for very small industries.
128 A Strategic Overview of the Global Energy Markets
• Residential electricity prices increased by 7% in Estonia and Romania and by 5% in the UK, Belgium, Bulgaria and Poland.
• The increase in electricity prices in Romania was mainly related to the upward trend of coal prices and low hydro situation, combined with a severe winter2.
• The largest fall in electricity prices was recorded in Italy (-11%) followed by Croatia (-7%).

experience
By analyzing huge amounts of data, learning and predicting
a better customer experience, thus improving customer satisfaction, loyalty and endorsement.
AI encompasses a range of technologies that learn over time as they are exposed to more data. AI commonly includes speech recognition, natural language processing, semantic technology, biometrics, machine and deep learning, swarm intelligence, and chatbots or voice bots.
According to Gartner1, “through 2020, AI use cases supporting CX are forecasted to deliver the most business value” and by 2021, “15% of all customer service interactions will be
Anticipate customer needs…
…by analyzing high data volumes to provide proactively personalized recommendations and advice. Customers now expect providers to anticipate their needs at each stage of
energy use management, outage or emergency, etc.
… by providing the most relevant actions at the right moment: pause a customer’s energy contract while they’re living in their secondary residence, adapt the temperature of their home according to their expectation in terms of comfort or cost, supply renovation services, etc. AI technology enabling highly scalable and bespoke experiences gives customers peace of mind.
Simplify interactions with customers…
through conversational interfaces and augmented analytics. Virtual Customer Assistants (VCAs) and chatbots, thanks to technologies linked to natural language processing, speech
understanding and thereby deliver a really quick and easy service. VCAs and chatbots are also continuously improving by learning from conversations with customers.
1 Gartner, “Gartner says Global Artificial Intelligence Business Value to reach US$1.2 Trillion in 2018”, [online], April 25, 2018, https://www.gartner.com/newsroom/id/3872933
Figure 4.6. Share of organizations implementing AI that observe more than 10 percentage point gain on the following benefits
Reduced churn Reducedcustomer complaint
Enhanced customersatisfaction
(increase in NPS)
66%72% 73%
Source: Capgemini Digital Transformation Institute, State of the AI Survey, N=993 companies that are implementing AI, June 2017
129
Euro
pe

Topic Box 4.1: Beyond energy retail prices
Renewable electricity: accelerating increase in consumer choiceEuropean energy regulation is delivering its promise of strong competition among electricity and gas suppliers, pushing them to supply commodities at the lowest possible price to their customers. However, price is no longer the only criteria prompting consumers to switch supplier: the source of the electricity, and whether it is renewable, are increasingly considered. As far as corporate consumers are concerned, an increased portion of their electricity comes from renewable sources. According to IRENA1, this portion represented more than 465 TWh in 2017 (3.5% of global commercial and industrial sector consumption). Their choice is not only driven by corporate social responsibility rules and image improvement, but also by pure economics, as renewable electricity production costs are rapidly decreasing and will continue to do so over the next decades. Active renewable sourcing is therefore seen as a natural hedge against increasing electricity prices, especially from fossil fuels.
RE100 initiative: real interest and commitments from corporatesRE100 is a collaborative global initiative of around 140 companies (half of them headquartered in Europe) operating in 120 countries, committed to sourcing 100% of their electricity consumption from renewable sources, at some point in the future. According to RE100’s latest report, they represented together an annual consumption of 160 TWh, which would equate to the 24th largest electricity consumption country. There are several options available to companies making progress towards 100% renewable electricity consumption:
Origin in Europe), self-generated electricity, purchase from on-site installations owned by a supplier, or direct contracts with producers (corporate Power Purchase Agreements, or PPAs).
on emission reduction goals, improve management of
Guarantees of Origin (GoOs): a necessary starting point, but not the panacea
to all types of customers (B2B and B2C). The European-wide GoOs mechanism was set up by an EU directive to provide a framework to track electricity, especially from renewable sources. This is now considered a legal requirement when
meet clients’ expectations. Indeed, as GoOs can be traded independently from the power itself, there could be some
mismatch between the true origin of the electricity and the positive message the customer believes they are supporting.
Self-consumption: an appealing way to add value to corporate assetsAccording to IRENA, one third of renewable electricity sourced by corporate consumers comes from self-consumption. It means that renewable production facilities are built on-premise, directly connected to corporates' buildings and facilities. For some companies, this is a clever way to add value to unused property (rooftops, land), either by investing themselves into production facilities (mostly photovoltaic) or by letting a third party invest.
consumption against a local, behind-the-meter production, thus avoiding some of the network charges and associated taxes. Moreover, in regions where networks cannot provide reliable, continuous access to electricity, this can serve as back-up power, in case of rolling blackouts or unexpected power cuts.
Corporate Power Purchase Agreements
Globally, corporate PPAs account for another third of renewable electricity sourced by corporate consumers, according to IRENA. A corporate PPA is a contract under which a business buys electricity directly from a producer of renewable energy on a long-term basis (generally 15 to 25 years), thus providing a long-term commitment to green
it allows the alignment of both producers’ and consumers’ interests: price visibility (the price is based on production costs: Leverage Cost Of Electricity or LCOE) and stability (the price is not subject to wholesale power price volatility).
by IT companies to supply their data centers (Google, Apple, Facebook, Amazon, Microsoft, etc.), initially mainly in the US (from 3.1 GW registered in 2015 to 5.4 GW worldwide in 2017, according to Bloomberg New Energy Finance), then in Northern Europe. In H1 2018, Norway and Sweden saw corporate wind PPAs signed totaling almost 1.4 GW – a
whole of 2017. Eneco has been a leader in the Netherlands, signing corporate PPAs with Dutch Railways and Google a few years ago. Now, PPAs are spreading to other industrial segments: the French railway company SNCF is in the process of contracting corporate PPAs, as well as the airport operator
in Italy, supplying a brick and tile provider, Weinerberger, with PV electricity. In the Netherlands, Vattenfall has announced it will purchase power from three solar PV farms, totaling 38 MW, to supply power to the residents of the city of Uden.
1 http://www.irena.org/publications/2018/May/Corporate-Sourcing-of-Renewable-Energy
130 A Strategic Overview of the Global Energy Markets

Virtual Customer AssistantOne of the biggest changes that AI will bring to everyday customer experiences is in
more natural form of interaction through a Virtual Customer Assistant (VCA). Based on a cognitive system, it can do a better job than humans in answering customer questions
most relevant decision. In that way and thanks to emotion detection, the VCA gives instant
The VCA can also assist customers in evaluating the energy performance of their home, suggesting whether or not to install solar PV, replace the windows, insulate the loft, etc.
AI will create richer, more engaging customer experiences across all channels through disrupting use cases
Energy Broker
Based on the analysis of energy production (whether from the national or local grid, or produced or stored by the customer themselves, such as PV, home or car battery, etc.), the customer’s current and future estimated consumption, and the energy price, the broker automatically makes the best decision in order to reduce the customer’s energy bill. The broker can thereby make sell or buy decisions, activate the appropriate energy source, change energy provider, etc. This gives
Figure 4.7. Speed and convenience top the list of reasons for preferring voice assistants over human interactions
49%
It isfaster
It ismore
convenient
It providesgreaterchoice
It isbetterable to
understandmy concerns
It providesbetterquality
customerservice
It helps meautomate
my routineshopping
tasks
It helpsme avoid
interactingwith a sales/
servicerepresentative
It seemslike a
smarterway toshop
It feelsas real asspeaking
to a humanbeing
47%41% 40% 39% 38% 38% 38%
32%
Source: Capgemini Digital Transformation Institute, Conversational Commerce Survey, October-November 2017, N=5,041 consumers in the U.S., UK, France, and Germany.
131
Euro
pe

Figure 4.8. Aggregated European electricity switching rates (2017)
Belgiu
m (F
landers)
Belgiu
m (W
allonia)
Norway
Great B
ritain
Netherla
nds
Northern
Ireland
Ireland (R
ep. of)
Finland
SpainIta
ly
Portugal
Sweden
Germany*
France
Slovenia
Belgiu
m (B
russ
els)
Denmark
*
Czech
Republic
Austria
Slovakia
Croatia
*
Estonia
Greece
Latvia
Romania
Poland
Luxembourg
Lithuania
0%
10%
Ag
gre
gat
ed E
uro
pea
n el
ectr
icit
y sw
itch
ing
rat
es 2
017
(%) -
I&C
and
res
iden
tial
s 15%
20%
5%
Super hot and hot markets
Active markets
Cool active markets
Dormant
Warm active markets
* 2016 data Source: VaasaETT Utility Customer Switching Research Project
Figure 4.9. Aggregated European gas switching rates (2017)
Belgiu
m (F
landers)
Belgiu
m (W
allonia)
Great B
ritain
Netherla
nds
Northern
Ireland
Ireland (R
ep. of)
SpainIta
ly
Sweden
Germany*
France
Slovenia
Belgiu
m (B
russ
els)
Denmark
*
Czech
Republic
Austria
Slovakia
Croatia
*
Estonia
Latvia
Poland
Luxembourg
10%
Ag
gre
gat
ed E
uro
pea
n g
as s
wit
chin
g r
ates
201
7(%
) - I&
C a
nd r
esid
enti
als
15%
25%
20%
5%
0%
Super hot and hot markets
Active markets
Cool active markets
Dormant
Warm active markets
* 2016 data Source: VaasaETT Utility Customer Switching Research Project
changes in selected countries for electricity (France, Northern Ireland) and gas (Northern Ireland, Estonia, Czech Republic)
Switching rates are a key indicator of competition maturity on energy retail markets
is essentially seen as the free (by choice) movement of a customer from one supplier to another. Switching activity is
Customer switching is one of the factors that are used for measuring the level and success of competition in retail energy markets; in principal the higher the number of customers changing their supplier, the more there are opportunities for competitive suppliers and new entrants. VaasaETT divides levels of switching into six categories: super hot markets, hot markets, warm active markets, active markets, cool active markets and dormant markets. The category into which a
also upon its behavioural characteristics.
Electricity: slight increase overall in churn rates, no big change since last year
For electricity, although switching rates have overall increased by around 0.5% on average, there were only movement within each switching activity cluster. As in previous year, Flanders,
Norway, Netherlands and Great Britain are still the most active markets in Europe. Only Northern Ireland has faced a slight decrease from 15.4% in 2016 to 14.2% in 2017. However, customers’ growing interest in taking advantage of the competitive market and its opportunities can be seen in Latvia and Romania which have both developed into a Cool active markets from being a Dormant markets with less than 0.5% switching. Within the Active markets, France came from the 3rd place last year to the number one spot, with a 2% increase switching rates, which shows the increased competition driven by many new entrants to that market.
Gas: increase in churn rates in Eastern Europe, Western Europe stays the same
Two markets have faced by far the largest changes in recent years. In Estonia in 2015, the annual switching rate was 6.1%, which leapt to 11.7% the following year, only to drop back down again in 2017 to around 6%. In Ireland, gas customers'
13.9% and back up to an impressive 18.2% during 2015-2017.
132 A Strategic Overview of the Global Energy Markets

Despite opening up gas and electricity supply markets to competition, many Member States
in order to protect consumers against price volatility.
monopolies imposed by Directive 2003/55/EC gradually come to an end, to maintain price stability to protect consumers1. In 2016, according to a report by the Council of European Energy Regulators (CEER)2, nine countries
Bulgaria, Denmark, France, Hungary, Lithuania, Poland, Portugal, Romania, and Spain. Some, such as Cyprus and
while others such as Croatia, Latvia and Greece were doing so for natural gas.
a rate of return, a price cap, a discretionary regulation, or other ceilings.
this duality exists, regulated prices are available to all domestic consumers, who also have the choice to opt for
However, although competition now exists in the supply markets, European institutions are
The European Court of Justice (ECJ) has stated in two decisions3 that a public intervention measure on the selling price of natural gas is, by its very nature, an obstacle to the achievement of an internal market for natural gas.
However, the ECJ admits, by way of derogation, State intervention on the basis of Article 3.2 of Directive 2009/73/EC, if three cumulative conditions4 are met.
As for the European Commission, on November 30, 2016, it presented a new set of measures in a fourth energy package entitled Clean Energy for all Europeans where it pursues the goal of fully opening the energy market, in order to strengthen free competition. To do this, the
This is one of the objectives pursued by the draft directive on the electricity market.
In this context, Member States are progressively adapting their regulations to
Consequently, some Member States, such as Germany, the United Kingdom, Norway, Sweden, Finland, Austria, Estonia, Slovenia and the Czech Republic, have chosen
segments. Others, such as France, Italy, Lithuania, Poland, Portugal, Romania and Spain, have decided to maintain,
vulnerable consumers.
by the French Council of State5, the future of regulated
gas. Concerning gas, the French Council of State ruled that
abolishment is expected in the following months. However, concerning electricity, the administrative jurisdiction has taken a more comprehensive view: it admits that regulated
as they enable price stability to be maintained.
1 Compared with 2008, the total number of household consumers supplied at regulated prices for end-users in the EU in 2015 increased from 54% to 35% and from 49% to 25% respectively in the electricity and gaz markets (Council of European energy regulators, “Retail Markets Monitoring Report”, November 21, 2017).
2 CEER, Retail Markets Monitoring Report, mentioned above.
3 ECJ, Grand Chamber, April 20, 2010, Federutility, C-265/08, and September 7, 2016, ANODE, C-121/15.
4 The intervention must fulfill an objective of general economic interest, respect the principle of proportionality and include clearly defined, transparent, non-discriminatory and controllable public service obligations.
5 CS, July 19, 2017, ANODE, req. n°370321 and CS, May 18, 2018, ENGIE, req. n°413688.
133
Euro
pe

5-New Business Models & Services
Downstream energy new business models and servicesNew business models and new players are shaking up the downstream energy market. Digital levers and innovations such as self-consumption, storage, energy management platforms, and peer-to-peer marketplaces have been growing dynamically. New energy products and services are expected to represent up to 20% of a company’s total revenue.
• Downstream energy transformation ventures gravitate around four smart areas: smart homes, smart buildings and factories, smart mobility, and smart cities and communities. We analyze the evolution of each area in this chapter.
• The centralized model is not dead yet and major Utilities are still leading the market, but there is a strong evolution (if not revolution) and a growing transformation trend enabled by new technologies. All the traditional Utilities have now launched new business models to create new revenue
set up dedicated organizations to incubate, launch and scale those new business models and services, be it in dedicated business units (e.g. Enel-X or Centrica), in digital business incubators (e.g. EDF Pulse Studio, ENGIE Digital) or by getting closer with their energy services activities.
• Customers have also been evolving and are now willing to “manage energy their way”: developing their capability to generate and self-consume energy, entering new forms of energy sourcing to increase the share of renewables in their supply contracts, or aiming for more convenience at home. And when decentralized generation sources are coupled with storage solutions and digital energy management platforms, it impacts on the whole downstream power
industry. Combined with the development of e-mobility, this adds a level of complexity that some industrial customers want to manage directly by setting up smart grids in their own facilities.
As-a-Service business models are becoming mainstream.• According to Utilities executives in a Capgemini-IDC survey,
energy as a service and comfort as a service are, or are
service. Those new business models, along with others, will represent 5-10% of revenue in 3-4 years; the ones having
infrastructure, microgrid as a service, and generation and storage by households. Nevertheless, high revenues do not necessarily imply high margins. The services and business models having the most impact on gross margins are forecasted to be comfort as a service and energy as a service.
• This of course puts traditional downstream Utilities’ business models under pressure and explains why we are seeing a proliferation of innovative business models. Furthermore, beyond traditional Utilities, energy service companies (ESCOs), and electrical equipment providers, several players are entering the market or moving their value chains to develop
predict that in the next three to four years competition will come from non-traditional players such as GAFAMs (Google, Apple, Facebook, Amazon, Microsoft); energy equipment manufacturers (ABB, Alstom, GE, Siemens, etc.), telcos and electric car manufacturers.
New business models will represent 5-10% of the revenues in 3-4 years
will come from electric vehicle (EV) services, generation and storage at home, and microgrid as a service. However, energy as a service and comfort as a service will be the top margin contributors.
Microgrid as a service is viewed as a low-margin business model, with a third of organizations saying less than 5% of their company’s gross margins will be derived from it in three to four years, while an additional 38% of organizations estimate 5-9%.
Figure 5.1. Impact of the following business models on utilities’ revenue in three to four years
100%
80%
60%
40%
20%
0%
Local P2Penergy
exchangePlatform
Flexibility asa service
Wholesaleenergy trading
services
No impact
Comfort asa service
Energymarketplace
Energy asa service
Generationand
storage @home
Microgrid asa service
EV service/
36%
56%
8%
14%
78%
8%
11%
80%
9%
32%
58%
10%
12%
73%
16%
20%
46%
34%
6%
43%
52%
9%
25%
66%
8%
14%
78%
Source: IDC – Utilities New business models
134 A Strategic Overview of the Global Energy Markets
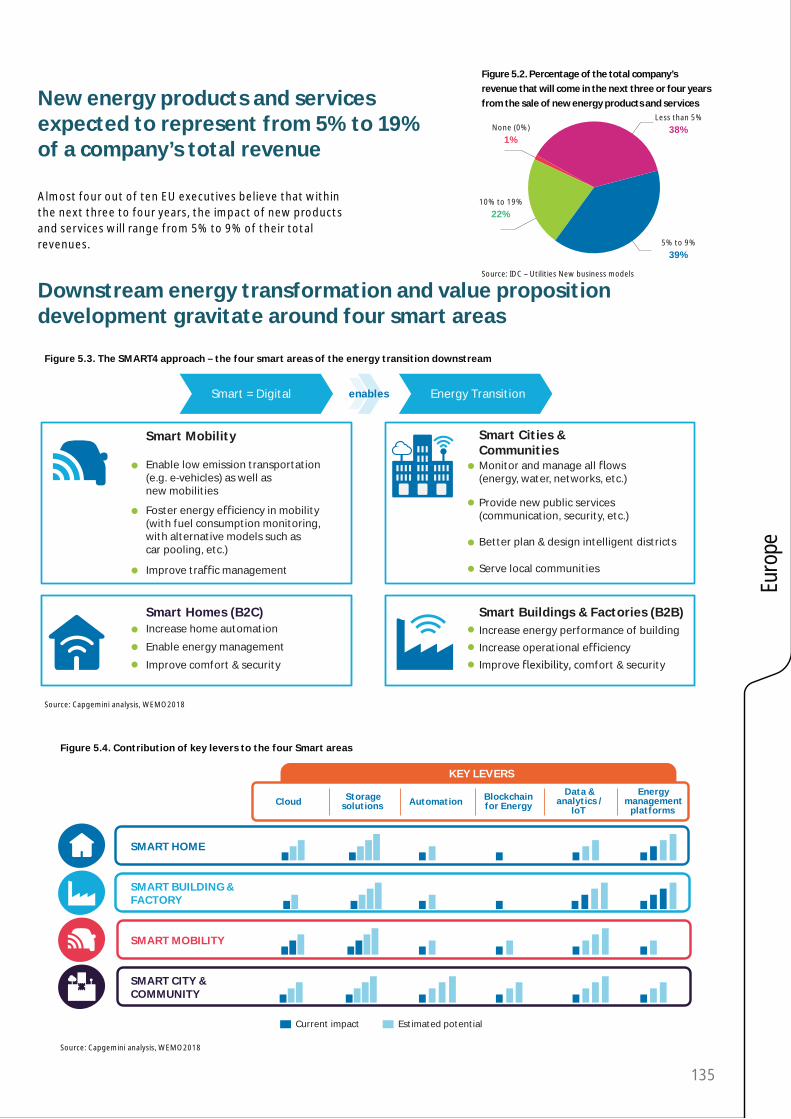
New energy products and services expected to represent from 5% to 19% of a company’s total revenue
Downstream energy transformation and value proposition development gravitate around four smart areas
Almost four out of ten EU executives believe that within the next three to four years, the impact of new products and services will range from 5% to 9% of their total revenues.
Figure 5.3. The SMART4 approach – the four smart areas of the energy transition downstream
Smart Cities &Communities Monitor and manage all ows (energy, water, networks, etc.)
Provide new public services(communication, security, etc.)
Better plan & design intelligent districts
Serve local communities
Smart Mobility
Enable low emission transportation(e.g. e-vehicles) as well as new mobilities
Foster energy e ciency in mobility(with fuel consumption monitoring, with alternative models such as car pooling, etc.)
Improve tra c management
Smart Homes (B2C)Increase home automation
Enable energy management
Improve comfort & security
Increase energy performance of building
Increase operational e ciency
Improve omfort & security
Smart Buildings & Factories (B2B)
Smart = Digital Energy Transition enables
Source: Capgemini analysis, WEMO2018
Figure 5.4. Contribution of key levers to the four Smart areas
Storagesolutions
Data &analytics /
IoT Automation Blockchain
for Energy
KEY LEVERS
Energymanagement
platforms
SMART CITY &COMMUNITY
SMART MOBILITY
SMART HOME
SMART BUILDING &FACTORY
Current impact Estimated potential
Cloud
Source: Capgemini analysis, WEMO2018
Figure 5.2. Percentage of the total company’s revenue that will come in the next three or four years from the sale of new energy products and services
Less than 5%
38%
5% to 9%
39%
None (0%)
1%
10% to 19%
22%
Source: IDC – Utilities New business models
135
Euro
pe

Figure 5.5. Heatmap of types of players on key levers
TRADITIONAL PLAYERS PLAYERS FROM ADJACENT SECTORS SPECIFIC PLAYERS
Smartbuilding& factory
Smartmobility
Smart home
Smart city &community
Utilities ESCOs*Vehicles
manufacturers
Netplayers
(GAFA…)
CPG-Retailers
TelCosSolar &storageplayers
OtherSpeci c small
players Construction
KEY
LEV
ERS
Electricalequipment
manufacturers
* ESCOs: Energy Service CompanyLevel of activity of the players
Source: Capgemini analysis, WEMO2018
Smart buildings: digital technologies are promoting a rapid growth in the smart building market
Data issue
In traditional construction and real estate (CRE) markets there are data issues that need to be addressed, such as When is data created? Who owns and controls it? How can high volumes of data be managed? Without answering these questions, the transformation of this sector is not realizing its full potential. But new players are coming to the market, in particular from the digital world.
Silicon valley is looking at the sector
market (US$ ) thanks to the attractiveness of the transformation of this traditional market.
accelerators actively targeting AEC. For example, new player in the market, Katerra, has just received a loan of US$865 million from Softbank.
IoT is coming of age with rapid growth and maturing solutions
Thanks to the fall in the cost of sensors, data storage, and
strategy. Revenue from IoT-enabled smart buildings technology is forecast to exceed US$8 billion in 2020.
IoT sensor deployment in smart buildings is likely to
The main sectors seeing this growth are commercial real estate, smart home and manufacturing & industrial automation according to the
Smart Commercial Buildings
Figure 5.6. Growth in Smart Building Connected Devices over time
27003300
4200
5300
6700
8400
11000
0
2,000
4,000
6,000
8,000
Mill
ions
of
devi
ces
10,000
12,000
2015 2016 2017 2018 2019 2020 2021
Year
Commercial Real Estate Smart Home Manufacturing & Industrial Automation Retail & Banking
Hospitality Healthcare Buildings Accumulated total
Source: Capgemini analysis, WEMO2018
136 A Strategic Overview of the Global Energy Markets

The economic opportunity is massive.
According to a study by the American Council for an Energy
to US$60 billion.
35% or more.
principles:
• Employees can use an app to control lighting and temperature in their workplace.
cleaning the air.• Elevators incorporate the Otis ReGen Drive device,
generating electricity while braking. In addition, the building is one of six European sites selected to test the recycled batteries for the Energy Local Storage Advanced
system (ELSA) program. This research project aims to use second-hand EV batteries to store electricity in buildings. The Ampere building already houses two batteries with a capacity of 12 kWh which supply, when needed, energy from the elevators braking and PV solar panels on the roof.
Energy Performance of Buildings Directive.The EU estimates that Europe’s buildings are responsible for 40% of energy consumption and 36% of CO2 emissions. Thirty-
the EU is creating incentives to foster this new market along four lines:
• The EU Building Stock Observatory monitors energy performance of buildings across Europe.
• The EU has set a target for all new buildings to be nearly zero-energy by 2020.
recommended improvements.• Financial support mechanisms in EU countries can help pay
Standards remain a key issue: there is a lack of interoperability for currently used protocols.
Data analytics are increasingly used to create value within commercial real estate building operations.
• Air quality monitoring is becoming mainstream and brings a new value-adding dimension to smart buildings.
Decentralized systems promise lots of added value but remain to be scaled up.
• Blockchain primer
Figure 5.7. Building Energies
Smart meters,demand response
Energy
Occupancy sensingLighting
Functionality checks,detector service
Fire
Condition monitoring,parking lot utilization
24/7 monitoring
Charging of hybridand electric vehicles
PEHV charging
Smart meters, useWater
Fans, variable airvolume, air quality
HVAC
Maintenance,performance
Elevators
Badge in, cameras,integration perimeter,doors
Access andsecurity
Source: Capgemini Consulting analysis
management systems can save from 13% to 66% on energy with a continuously optimizing system. Smart HVAC can result in cost savings of 24-32% depending on the building type. Other smart building components, like smart windows, can lead to savings of 19-26% 19-26% on cooling and 48-67% on lighting
137
Euro
pe

• Enables and stimulates the reuse of construction components
• Reduces waste
• Addresses sustainability issues
Leading companies are Saint-Gobain, Smartglass International, Ravenbrick, Sage Electronics, Hitachi Chemical, Asahi Corporation and Dupont
• Used to create construction plans
• Manages the project and controls tasks.
• Informs engineer on how the project should be constructed
• Creates and manages information on aconstruction project across the project lifecycle
• Manages smart equipment after the end of construction
• Allows collaboration between all the stakeholders of a project
• Alters light transmission properties when voltage, light or heat is applied
• Shorter assembly time
•
AI
BIM
Home energy management systems focus mainly on load management
Smart building: Improving construction
Smart home energy solutions are mainly related to load management. This consists of the following services:
• Smart meters that allow consumers to visualize and analyze their energy consumption. The objective is that once consumers understand the impact of appliances on the overall load, they will change their behavior and use less energy. An additional service is information about price signals from energy providers to reduce energy costs. Such
Electric’s Wiser Link.• An energy management system (EMS) can automatically
process price signals and follow settings chosen by
certain appliances.• Smart appliances such as smart thermostats for hot water
and heating or smart air-conditioners can be monitored remotely in order to increase comfort (right temperature at
when not needed). Smart appliances connected to the EMS, which processes price signals and can manage the load curve according to consumers’ settings, can thus reach a new level of optimization. Beyond heating and cooling appliances, this load management is particularly relevant for electric vehicles
Nest by Google (US), Tado (GER) and Netatmo (FRA) are key players in the European market. In 2018, Rexel launched
Energeasy Connect, a platform that can support many smart home services (comfort, security, thermostat).
The global smart meter market represented ~US$30 in 2016 and is forecast to grow by 6% CAGR until 2023, thanks to government regulation. The global smart thermostat market, valued at ~US$1 in 2017, will continue to boom in the
utilities with such services is the churn reduction.
Figure 5.8. Smarthome
Smarthome
Solar generationand optimization
Storage
Loadmanagement
Monitoring andvisualization
Potential Valu
e
Source: Capgemini Consulting analysis
138 A Strategic Overview of the Global Energy Markets

With the rise of distributed generation and storage, new solutions emerge to optimize energy generation and consumption as a whole
mobility
According to IDC Capgemini, 56% of utility companies have already deployed or will deploy in the next 2 years residential
Residential PV installations, small wind turbines, and
regulatory schemes, environmental awareness, distributed generation, and storage in houses and buildings, are booming. And while support mechanisms are moving from a Feed-
optimization of the generated power usage is becoming a crucial challenge.
to decrease energy bills. The choice of services depends
–
and be used during peak hours. – Peak shaving: in certain cases, the electricity bill depends a
lot on the peak electricity demand of a consumer e.g. the maximum demand seen by the grid. The battery can be used to reduce the demand seen by the grid by providing power momentarily.
pure players (Sonnen), utilities (CrowdNett by Eneco) or even car manufacturers (Nissan + Eaton, Renault Powervault, Tesla Powerwall) that are moving along the value chain with
announced in 2018 it will stop manufacturing residential batteries; and storage pure player Senec was acquired by EnBW.
• Regarding distributed generation systems, two main business models exist. – the most common one, mainly used to trigger the market,
is based on a FiT. Solar panels can be installed on a roof and the power produced sold to the grid. The FiT, which is
for the individual. In such cases, all the generation is valorized and the only challenge for the owner is to maintain the system properly. Therefore, no smart home services are needed.
– The self-consumption model is a pure behind the meter model: the generated power is consumed directly by the individual appliances. In some cases, the excess of power
consumption installation relies on the ability to consume and thus valorize all the generated power.
Beyond pure equipment providers and installers, basically
such as EDP, EDF, E.ON or ENGIE.
The solar generation peak (middle of the day) and the demand peak (in the evening) are not synchronized. This has two main solutions: the PV installation can be sized small enough to valorize all the energy or the generated power is consumed in a smarter way. For instance, an additional battery can store excess power in the day and supply power in the evening; smart appliances can then be activated to use this power (for air cooling, heating, EV and so on).
Again, various types of players have entered this market. Car
and coupled storage system in the UK. Huawei also launched
and battery interface.
• Generation by residential consumers is already a huge global market, mainly developed by equipment providers. Residential storage is a smaller market but with huge CAGR of 40-45% forecast until 2020 (see chapter 2). For instance, Italy installed about 8,000 home units in 2017 – twice the expected number – while Germany deployed 37,000 rather than the 31,000 forecast1.
The future of mobility is Connected, Autonomous, Shared & Electric.
With more concerns and opportunities in security, comfort and environment, mobility is reshaping to become smart mobility. Four major trends are changing mobility: Connectivity, Autonomous driving, Shared & Services and Electric, often summarized in the acronym CASE.
E-mobility participates in transforming the whole automotive industry.
technology, regulatory framework, OEMS & equipment services providers.
• The median range for EVs has extended by 56%: certain models can now drive well over 480 km on a single charge
1 PV Tech - EMMES139
Euro
pe

The EV charging business can be split into ten new business models impacting on the energy and mobility of tomorrow
Interviews show key trends about the future of mobility.
competitiveness, and charging infrastructure:
• 35% of consumers are happy to drive cars with a range of 400km (which is now the norm)
increasing to 37% with 15 minute charging.Charging accessibility is fundamental to improve the general acceptance of EVs.
• The EV charging value chain is a combination of energy supply, charging infrastructure and add-on services.
140 A Strategic Overview of the Global Energy Markets
• 35% of consumers say they would drive cars with a range of 400km.
EV annual sales have grown rapidly.
• EV annual sales are expected to reach 1.5 million units by the end of 2018, with an Europe’s market growth around 35% from 2016 to 2017.
Charging infrastructure and value chain are critical for the mass adoption of EVs.• Batteries prices are still decreasing:
– From 2014 to 2016, battery costs fell by more than 50% due to process improvements and economies of scale.
– Li-ion battery (with the highest energy density) prices decreased by 77% between 2010 and 2016, from US$1,000/kWh to US$227/kWh.
• EV charging infrastructure is the only critical factor that needs to be addressed to unlock the potential of e-mobility.
• There are now as many public charging points as there are gas stations in Europe.
• Reduced charging times are about to be rolled out, taking just 15 minutes instead of 30 for fast charging.
impact on companies’ business.An increasing number of vehicle manufacturers have disclosed plans to add more EVs to their product portfolio. More than US$90 billion has been invested by vehicle manufacturers globally in the battery and EV markets.
Utilities and power companies are scaling up their activities through mergers & acquisitions in the EV charging space:
• They are mainly targeting investment areas which they can use to leverage their know-how.
linked to other industrial value chains.• Vehicle-to-grid (V2G) charging services could be used during
grid from overload.
Figure 5.9. CASE
onnectivity
utonomousdriving
hared& Services
lectricMobility
Source: Capgemini analysis, WEMO2018

value chain, to review their investment strategies and to transform their business models through mergers and acquisitions or internal developments. The transformation imperative becomes even more salient as the ecosystem’s
mobility of tomorrow with a focus on the EV charging ecosystem sheds some light on the EV charging infrastructure’s evolving value chain, on opportunities for value-creation, and on development pathways.
141
• 80% of experts interviewed believe that the length of charging is the most crucial element that should be considered at public charging points.
The EV charging ecosystem can be split into ten business models focusing on value proposition, customer segments served, revenue streams, cost structure and key activities.
by the stability of their value proposition and revenue streams, four of them stand out: direct billing for charge point operation, smart platform development, PPP with potential delegation, and manufacturing:
• Manufacturing and PPP are the most stable as they were the
• Bundled vehicle and charging is at the other end of the spectrum as, until now, few OEMs have managed to
future:
• Bundled vehicle and charging, if players seize the
• Smart charging development (B2B).
EV charging infrastructure development is likely to match one of three scenarios:• In the best case, EV charging infrastructure will develop
quickly with varied and sustainable business models, and could lead to the disappearance of Internal Combustion Engines (ICEs) in 2040.
• In the worst case, by 2050 electric infrastructure fails to be
climate change have worsened as of 2050.• The BAU scenario could lead to decreased car ownership
as new generations favour new mobility models, and ICEs remain after 2050.
Figure 5.10. A classification of the EV charging ecosystem in ten business models
BM6
BM1
BM7
BM2
BM8
BM3
BM9
BM4
BM10
BM5
Operate public charging stations thanks to authentication methods and simple platform and bills consumers for their use
Numerous players now operate this BM
Direct billing forcharge pointoperation
Operate public charging stations and use them in order to attract consumers to retail locations and promote brands
Niche and particularlyinnovative BM
Indirect billing for charge point operation
Aggregate CPOs to maximize network
Some players developed this business model at early stage of EV market development
Smart Platformdevelopment
Use data generated by public ans semi-public charging to develop smart software and advisory services
Generate major interest among actors of electric mobility
Smart chargingservicesdevelopment
Optimize load management, energy production and distribution thanks to data collection and software development in order to develop end-to-
Entry door for Utilities
Digital Energy
Optimize load management, energy production and distribution thanks to data collection and software development in order to develop end-to-end
As opposed to digital energy, requires sizeable capital expenditure to develop and operate a network of charging infrastructure
End-to-EndEnergy
packages to customerspurchasing/renting an EVenabling them to reap full
Only business model whichrelies directly on EVs designand production
Bundled vehicleand charging
Develop, manage publicservices throughconcessions granted bylocal autorities withpotential delegating aftergiven period
At the intersection of direct billing for charging and smart platform
feature relies on a tight link with a local authority
Public Private Partnership(PPP)with potential delegation (Build, Own, Operate, optional Transfer)
Design and producechargers that match bothregulatory standards andcustomer needs
Primary business model toemerge on the EV charginginfrastructure market
Manufacturing
everyday life
Typical BM for EV chargingpure players
Charging As AService
Source: Capgemini analysis, WEMO2018
Euro
pe

There is an opportunity to create new business models along the EV charging value chain
Figure 5.11. companies
Energy Supply Charging Infra. Add-On Services
EnergyProd. &Distrib.
Batterymgt/
storage
ChargingStation
dev & prod.
ChargingStation
sales
ChargingStationInstal.
O&M Purchase& billing
Geo-services
Roaming/Access
AdditionalServices
“Natural” position of companies on the value chain InvestmentExpansion through internal development, partnerships and/or co-operations
Source: Capgemini Consulting analysis
While e-mobility is promising, challenges remain.
Four key issues have been raised by EV charging ecosystem players and they need to be considered to identity the winning business models:
• From “range anxiety” to “experience anxiety”: although the range of new EVs reaches beyond the 400-500 km barrier, purchasing an EV remains a radical move. The charging experience remains complicated due to heterogeneity of standards, unclear pricing schemes, and lack of interoperability among most markets. This is one of the most critical challenges for the EV market if it is to really
• Digital and data mastery are critical to win in the EV charging market: digital brings opportunities for
companies to adapt their business model. For backend systems, owning the operation brings opportunities for
marketing IT solutions. On the other hand, EV charging as a service or partnering provides fast setting up with high professionalism and low implementation costs.
• Client relationships will be key to winning in the new e-mobility world: while several business models emerges, those who develop excellent client relationships will succeed in sales of mobility and energy services.
• No clear leader stands out yet: while everyone agrees e-mobility business models are required to manage an ecosystem, no clear leaders stands out yet among vehicle OEMs, Utilities, start-ups or mobility companies.
pure players, OEMs & logistics, manufacturers, and IT solutions providers.
the current EV ecosystem by investigating and developing new business models along the various parts of the value chain.• Pure players are involved in upward activities, like EV charging points manufacturing, or downward ones, like
additional services.• Critical parts of the value chain are strongly linked to other industrial value chains as well, from manufacturing to IT/
telecom provision.
OEMs, Utilities and O&G are scaling up their mergers and acquisitions (M&A) activity in the EV charging space:
• Utilities & power companies continue to reshape their investment strategies and to transform their business models through M&A in this crowded EV ecosystem. They are mainly targeting investment areas which they can use to leverage their know-how.
142 A Strategic Overview of the Global Energy Markets

Smart cities
In response to the city’s contemporary challenges, horizontal and multi-stakeholder governance models are developing and digital is playing an increasingly central role.
• Two-thirds of the EU’s population live in cities, and smart
economic prosperity) are found in cities in all countries. Examining EU cities with at least 100,000 residents, 240 (51%) have implemented or proposed smart city initiatives.
way to handle urbanization while minimizing its impacts
and collaborative, mainly by using technical innovations to
• But in recent years, smart- cities have appeared to be
decentralized initiatives: platforms, start-ups and citizens invest in the city independently and overlap each other, which ultimately results in a collective urban intelligence.
Testbedareas
Open-data
platforms
Ressourcemanagement
systemsSmart
mobilitysystems
Support
CIVIL SOCIETY
EU
State
Region
Banks
UniversitiesTechnologyproviders
ConstructionUtilitiesSoftwaredevelopers
Civil society groupsLocal residents Final users(prosumers)
EXTERNAL STAKEHOLDERS
CIT
Y G
OV
ER
NM
EN
TS
OT
HE
R P
AR
TN
ER
SHIP
S
Utilities are a major driver of smart city initiatives.
Knowing that local governments cannot develop citywide initiatives on their own, smart city projects are an opportunity for Utilities to develop new business models. Centered around complex systems (EV charging stations, network automation, and advanced communication systems), those projects use operations and infrastructures mainly owned by Utilities, such as electricity grids, water and sewage networks, and parking.
• The global market potential of smart cities is estimated to reach US$400-1,600 billion by 2020. Nonetheless, Utilities appear to be unequally eager for smart city domains: for instance, waste
Utilities claim to have already invested, while the corresponding
Figure 5.12. Main partners for «smart city» initatives*
Utilities
21.4%
State or regional
organization
16.2%
Elected
15.5%
Privatecompanies
14.5%
Academia
11.4%
non-governmentorganizations
11.4%
Individualcommunity members
10.3%
* From municipality/administration point of view, Black & Veatch’s 2018 Smart Cities & Utilities Report survey. Source: 2018, Black & Veatch: “2018 Strategic directions: smart cities & utilities report”
143
Euro
pe

Digitized and connected cities are supported by smart grids, platforms and the Internet of Things.
and consumption, a smart grid enables new services and creates business opportunities for new and established players. Emerging stakeholders include: – Providers of solutions and organizations related to energy
services, which are addressing the energy market in a
etc). Their purpose is to facilitate customer participation (e.g. peer-to-peer trading, smart appliances).
– Smaller organizations, such as energy cooperatives, that are implementing solutions at a local level. These players are focusing on citizens’ engagement and energy communities.
and production capacity while reducing losses), smart grid initiatives are growing rapidly in Europe, totaling 950
– Amsterdam has launched a virtual power plant initiative in the Ecuplein district, which incorporates solar PV, load and home battery systems of 35 households.
– Electron, a UK energy tech company, plans to leverage blockchain technology to launch a trading platform, supported by National Grid and Siemens, allowing electricity consumers to be paid for adjusting their energy consumption.
• Digital platforms and big data can allow city authorities to aggregate the increasingly large and varied amount of data generated from cities, in order to harness value from it. Currently being tested in Copenhagen, Cisco Kinetic for
Cities (a smart connected digital platform) manages the data
integrated one, IoT technology can have numerous
rubbish bins. For instance, in 2015, the city council of Bristol, in the UK, launched its project Bristol is Open. Based on IoT initiatives, an open data portal is sharing information about
devices, such as willing participants’ smartphones
In 2018, the biggest challenge facing Europe’s smart cities is cybersecurity and privacy.• In numerous smart city initiatives, information is made more
accessible to citizens thanks to open data, which refers to all freely available data. For example, Copenhagen Solutions
portal. Its latest project, EnergyBlock, will use sensors to monitor energy production levels in rooftop greenhouses and gardens across Copenhagen’s Nordvest area. The data from these sensors will be shared via Copenhagen’s open data portal in an attempt to showcase renewable energy sources available within the area.
Europe with the implementation of GDPR (EU regulation on data protection and privacy) in May 2018. With this regulation, smart cities now need to guarantee the safety of data. To face this issue, Dijon imposed strict rules concerning the use of collected data. The city authority put in place an innovative legal set-up where it has full legal responsibility for all the data produced by the city sensors and networks.
144 A Strategic Overview of the Global Energy Markets

6-Financials
2017 showed an increase of revenues, inversing the downward trend of the last years
Main trends observed in 2017-18
After several years of decreased revenues (4-year negative CAGR), 11 out of 16 companies improved their revenues in 2017. This can be primarily attributed to the general increase in wholesale market prices compared to 2016 (see Fig. 6.1). In addition, Utilities’ revenues depend for a large part on other companies’ (mainly industrial) electricity consumption. The fact that the economic situation wasn’t good for Utilities in past years but got better in 2017 contributed to an increase in the volume of electricity consumed.
companies’+ Q4 revenues 2017/2016 DE-EPEX ES-OMEL FR-EPEX IT-IPEX NORDIC -
Nord Pool UK-EPEX
wholesale market prices 18.20% 31.82% 22.53% 26.19% 9.45% 9.05%
companies’ revenues 2017/2016 1.40% 7.70% -1.02% 5.92% 2.00% -0.52%
Source: Gestore Mercati Energitici, Capgemini Consulting analysis. Evolution for the companies of our sample grouped by country / region
It’s noticeable that the increase in revenues is slightly less than the rise in electricity prices. This may be explained by an
Fortum shows the highest revenue increase in 2017 – nearly 25%. In addition to favorable wholesale prices, the increase was mainly due to electricity demand growth in Northern countries, as well as the strengthening of Russian ruble and the integration of Ekokem, Hafslund and DUON.
Germany’s EnBW also succeeded in increasing its revenue, by 13.5%. It is also the only company showing a positive 2013-2017 CAGR. This is mainly due to the successful implementation of its 2020 growth strategy: expansion of renewable energies,
Despite high gross energy prices and the development of new services,
between existing players and newcomers is tending to lower the EBITDA margins, which is also tending to converge
A noticeable improvement in revenue levels in 2017 supported by the increase of wholesale market prices and a stronger economy
Due to important CAPEX requirements, Utilities are increasing debt level and leverage ratio as well as lowering the dividends per share
After a few years of uncertainties, the successful transformation of
markets, leading to an outstanding 2017 stock performance and an overall credit rating improvement
CO2 intensity continues to decrease pushed by heavier EU taxation on CO2 emissions, the implementation of more
and investors’ pushback
German companies have regained a better
constraints linked to the forecast decommissioning of nuclear assets in past years; they have also started to reap the rewards of their transformation plans
CO2
$
145
Euro
pe

EBITDA margin: an overall downward and converging trend
The average Utilities’ EBITDA margin has been falling year after year: from 20.7% in 2013 to 17.8% in 2017
the best year overall for the companies in our sample and 2017 the worst.
EBITDA margin’s evolution
2013 2014 2015 2016 2017
Utilities average 20.5% 20.0% 21.1% 18.4% 17.8%
Trend -
Despite a convergence tendency, the studied sample can be divided into three main groups:
Leading: CEZ, Fortum, Iberdrola, Orsted (ex-DONG Energy)
Leading companies have a the highest EBITDA margin. The margin does decline for most of them, but they still manage to keep it at a very high level. All these companies – Iberdrola excepted – are facing less competition in their native market (whereas German, British or French companies are, potentially, leading to a higher client churn rate).
Stable: French companies (EDF, ENGIE), Naturgy (ex-GNF), EDP, Enel
Stable companies have an EBITDA margin that remains around the sector’s average. Despite their decreased margins, they are in control of their OPEX and the changing environments. Note that some companies (such as EDF) have to comply with regulated energy prices, which reduces their ability to enhance their margin since they are among Europe’s cheapest energy providers.
restructuring of grids, and broadening of services.
E.ON’s low CAGR is the consequence of a change of scope, the company having transferred its conventional energy sources to Uniper in 2016.
Figure 6.2. EBITDA margins (2013-2017) and associated CAGR
20152013 2014 20172016
30%
35%
40%
50%
45%
25%
20%
15%
10%
5%
0%
EBIT
DA
mar
gin
s in
[%]
CAGR: Compound AnnualGrowth Rate (2013-2017)
Vattenfall -14%1
1
1
CEZ -7%2
2
Fortum -7%3
3
Iberdola -4%4
4
EDP -1%5
5
Ørsted (DONG Energy) 9%6
6 EDF -3%7
7
7
Enel -1%8
8
Naturgy (GNF) -3%9
9
RWE -16%10
10Engie -3%11
11
SSE 8%12
12
Centrica -14%13
13
EnBW 11%14
14
E.ON 16%15
15
Uniper (1) -4%1616
Sources: Tomson Reuters EIKON data (“Normalized EBITDA”), Capgemini Consulting analysis1 Uniper figures correspond to electricity generation only
Notes on EBITDA margin variations
• As a ratio between EBITDA and total revenues, the EBITDA margin
EBITDA margin (production capabilities, local economic situation,
prices movement, consumer preferences, competition between players, company’s core performance, etc.) but a high EBITDA margin means that the company’s OPEX is well managed.
Figure 6.1. 2016 & 2017 revenues in € billion and CAGR 2013-2017
30
40
80
70
60
50
5%
0%
-5%
-10%
-15%
-20%
-25%
-30%0
10
20
Co
mp
oun
d A
nnua
l Gro
wth
Rat
e (C
AG
R) 2
013-
2017
[%]
[€b
n]&
201
7R
even
ues
2016
Enel
Uniper
EDFEngie
RWE
E.ON
SSE1
Centrica
1
Iberd
rola
Naturg
y
(Gas N
atura
l
Fenosa) EnBW
EDP
Vattenfa
ll1
Ørste
d
(DONG Energ
y)1CEZ
2
Fortum
Sources: Tomson Reuters EIKON data (“Total revenue”), Capgemini Consulting analysis1 SSE, Centrica, Vattenfall, Ørsted (DONG Energy) and CEZ revenues are calculated using Thomson Reuters EIKON fixed exchanges rates2 Uniper figures correspond only to European generation revenues
Lagging: German companies (E.ON, EnBW, RWE, Uniper), British companies (SSE, Centrica)
Lagging companies have an EBITDA margin below the Utilities’ average. However, they have tended to increase their margin and thus reduce the gap between them and the stable companies. This is especially the case for the German companies (except RWE), highlighting the success of the transformation programs implemented.
146 A Strategic Overview of the Global Energy Markets

Net debt and leverage ratios are increasing
favourable conditions to borrow and maximize their investments. However, using too much debt is risky: companies must be able
must therefore be analyzed regarding the leverage ratio of the
the company to pay back its debt.
Currently, both net debt and leverage ratio have increased:
• Average net debt increase (2017 vs 2016): +5%• Average leverage ratio (2017 vs 2016): 2.85x vs 2.77x
The three companies having the highest increase in net debt levels are GermanEnBW and E.ON have faced challenges in recent years resulting in low EBIDTA for 2016: the multiple changes in regulation and laws are strongly impacting on these companies, as well as digital transformation. The tremendous growth of their EBITDA (2016-2017) should be considered as a return to normal situation. 2017 can be considered as a good year: EBITDA grew more than net debt (in %), their leverage ratio is divided by two and goes below the average of our
could explain a part of this phenomenon. It allows these companies to invest more, thus becoming more competitive.
RWEmentioned above, it prepared itself to sell its share in Innogy
investment, RWE raised its debt level (from 0.9x to 2.7x) but still remains under the sector’s average.
Top companies decreasing their net debt levels
Some companies have divided their debt by more than two. Following its acquisition by Fortum (46.67% of the capital), Uniper drastically reduced its debt level. Orsted reduced its debt divesting from its fossil fuel assets. The company wants to focus on renewable energies and plans to massively invest in wind farms in the coming years.
A special case with Fortum
Fortum’s net debt level has been rising steadily since the company entered Uniper’s capital. Nevertheless, its leverage ratio remains one of the lowest.
The dividends per share are globally stable or decreasing.
In 2017, all the companies in our study paid stable or lower DPS for 2016, except Enel (+33% vs 2016), E.ON (+43% vs 2016), EnBW and RWE (these two companies didn’t pay any dividends in 2016). As already mentioned, the energy sector is facing plenty of new challenges (digitalization, climate risk, competition), most of them requiring important investments.
DPS (+85%) over the 2013-2017 time period. This growth rate is mainly due to a systemic augmentation of Enel’s Free Cash
we can see that Enel’s DPS is still one of the lowest in our sample group.
Figure 6.3. Net debt and EBITDA in € million and leverage ratios for 2016 and 2017
2017 Net Debt [€m](2016-2017 evolution)
Leverage ratio2017
2017 EBITDA [€m](2016-2017 evolution)
Leverage ratio2016
Fortum 1,227 1,273 1.0x 0.0x(25.0%)(3,406.0%)1
Ørsted(DONG Energy) 633 2,246 0.3x 0.8x(-22.0%)(-57.0%)
RWE 11,753 4,415 2.7x 0.9x(-46.0%)(68.0%)
Vattenfall 7,674 3,389 2.3x 1.7x(-21.0%)(7.0%)
Centrica 4,774 2,428 2.0x 1.8x(-13.0%)(-13.0%)
EnBW 3,836 3,124 1.2x 2.3x(265.0%)(93.0%)
EDF 38,569 15,656 2.5x 2.5x(-8.0%)(-10.0%)
SSE 9,530 2,773 3.4x 2.8x(-19.0%)(22.0%)
CEZ 5,506 2,160 2.6x 3.0x(0.0%)(4.0%)
Engie 28,231 9,005 3.1x 3.2x(-3.0%)(-10.0%)
Enel 57,106 14,082 4.1x 4.1x(-2.0%)(-2.0%)
Naturgy (Gas Natural
Fenosa)19,687 3,892 5.1x 4.3x(-18.0%)(-3.0%)
Iberdrola 38,202 7,604 5.0x 4.3x(-7.0%)(18.0%)
E.ON 12,344 4,742 2.6x 5.5x(195.0%)(40.0%)
EDP 18,972 3,303 5.7x 5.9x(-8.0%)(-11.0%)
Sources: Thomson Reuters EIKON data (“Normalized EBITDA” & “Net Debt Incl. Pref. Stock &
1 2016-2017 Net Debt evolution is listed as 3406% for Fortum as in 2016 the net debt was €35 following a negative debt in 2015 of €-2,126 million
Net debt
Dividends Per Share (DPS)
Companies with leverage ratios above 5x are from Spain and Portugal
These companies’ leverage ratios reach almost twice the mean leverage ratio of the others. It is interesting to note
In the case of Iberdrola, the company’s increase in net debt (+18%) is mainly due to the integration of the Brazilian company Neoenergía (€2.817 million contribution to Iberdrola’s consolidated debt) and the investments undertaken in 2017. EDP’s situation is getting slightly better because the decrease of its EBITDA was more than compensated for by a debt reduction.
147
Euro
pe

E.ON seems to have had a huge increase in its DPS compared to 2016. However, we can see that its DPS decreased from 0.60 in 2013 to 0.21 in 2016 before reaching 0.30 in 2017. Indeed, in the 2013-2016 period, E.ON lost money every year but continued to pay (decreasing)
paid by RWE for the buyout of E.ON’s renewable energy assets possibly gave E.ON the capacity to increase its DPS for 2017.
French companies (EDF & Engie) are paying fewer dividends year after year. EDF is facing huge investments (e.g. Hinkley Point C in the UK) leading to an increase in its
stakeholder, might have impacted on the dividend strategy.
RWE and EnBW paid dividends in 2017. This has to be noted since these companies didn’t pay any in 2016 and 2015 (for RWE). RWE is selling its participation in Innogy to E.ON (for around €17 billion). In parallel, RWE is taking around 17% of E.ON’s capital and will focus on renewable energies (RWE took over assets involved in renewable energy production).
Stock is performing well globally
investors are regaining trust.
Despite overall uncertainty (regulatory changes, competition from new players, low economic conjuncture), Utilities have managed to turn around the downward trend of previous years. But in general, current share prices remain very low
Utilities have been forced to adapt and restructure themselves in a post-Fukushima era, with several constraints such as
prices (spot + term), the need for C02 reduction, renewables
(Germany, Italy).
To go further…
Beside savings plans and assets rationalization, German Utilities (particularly E.ON and RWE, +57.2% and +68.8%) are implementing new strategies with a clearer separation of activities (production and retail for RWE, networks and services for E.ON – through the Innogy transfer to E.ON, among others initiatives)
Enel (EBITDA exceeding forecasts, +6% turnover in 2017), as well as by its focus on mature markets (Italy, Spain, USA) and ongoing group digital transformation (e.g. creation of Enel X)
In France, 2017 was a complicated year. Nevertheless, EDFproduction mix is one of the lowest CO2 emitters in Europe.
Figure 6.4. Dividends per share in € and 2013-2017 evolution
1.60
1.40
1.20
1.00
0.80
0.60
0.40
0.20
0.00
Div
iden
ds
per
sha
re in
[€]
CEZ
-14%
SSE
+3%
Naturgy(Gas Natural
Fenosa)
+11%
Fortum
+0%
Centrica
-30%
Iberdrola
+2%
EDP
+8%
EDF
-60%
Enel
+85%
RWE
-50%
EnBW
-28%
E.ON
-50%
Engie
-53% 2013 20162014 2017 -x% 2013-2017 Evolution2015
Sources: Thomson Reuters EIKON data (“Dividend per Share DPS”), Capgemini Consulting analysis
Stock performance
DPS (Total dividends paid / ordinary shares outstanding) strategy of the company more than its economic health. Some companies invest their liquidity in R&D, new infrastructures or external growth instead of paying dividends: stockholders are making money through stock price increases. Some companies pay high dividends, irrespective of investments and their liquidity. This can be a strategy aimed at protecting the company from a take-over bid.
on DPS since the number of ordinary shares outstanding is increasing) or from banks (potential impact on DPS as an increase in the global level of debt is going to increase
In the end, the total amount of dividends paid depends on a company’s free cash
liquidity since the company is not leveraging at 100%.
148 A Strategic Overview of the Global Energy Markets

Overview: from stabilization to improvement
Rating trends remain mostly stable, and even tending toward an improvement. Transformation and cost cuttings plans have been successfully implemented. Companies have taken advantage of low interest rates and have stable operating conditions (some are recovering from sharp regulatory changes in the nuclear sector). The stabilization is reinforced by investments in regulated businesses and relatively high wholesale market prices.
Fortum downrated following Uniper acquisition
The long-term corporate credit rating of Fortum was downgraded following its announcement of the
accompanied by a negative outlook – by the combination of the following factors:
• Expected weakened credit metrics with possible decrease of funds from operations to debt to below 25% in 2018 (vs. 56.1% in 2016) and forecasted increase of net debt to
to cover long-term debts);• Doubts on Fortum’s capacity to conduct a coherent
if Fortum’s stake remains around 50%, it would not have the
Uniper’s supervisory board renewal in 2022;
strengthen its balance sheet at the date of the rating.
Three companies saw their ratings improvedS&P assigned BBB+ to Enel, recognizing the group’s increase
followed the publication of the 2018-2020 Strategic Plan which has been well received by markets for its focus on
contracted businesses.
Uniper’s rating was increased to BBB in April 2018, emphasizing
renegotiations of gas contracts and costs savings. S&P also
of the takeover by Fortum, which is considered to have limited
EDP’s rating has been reviewed in view of successful debt
performance. Sales of minority interests were also favorably received, as well as the takeover bid of China Three Gorges.
Figure 6.6. Standard & Poor’s credit ratings
31/122012
31/12/2013
31/12/2014
31/12/2015
31/12/2016
27/07/2017
27/07/2018
31/12/2011
CompanyRating
evolution2017/2018
Outlook
EDF
Iberdrola
Naturgy(Gas Natural Fenosa)
SSE
EnBW
Fortum
E.ON
Centrica
Engie
VattenfallØrsted(Dong Energy)
Enel
CEZ
Uniper
RWE (1)
EDP
BBB+
BB+
BBB+
BB+
BBB+
BBB+
BB+
BBB
BB+
BBB-
BBB-
BB+
BBB-
BBB-
BBB-BB+
A+
AA
A
A
A-
AA-
A-
A-
A-
A-
A-
A-
A-
A-
A-
A-
A-
A-
BBB+
BBB
A-
BBB+
BBBBBB
BBB
BBB
BBB
A+
A
A-
A-
A-
A-
A-
A-
BBB+
BBB
A-
BBB
BBB
A+
A
A-
A-
A-
A-
A-
A-
BBB+
BBB
A-
BBB
BBB
A+
A
A-
A-
A-
BBB+
BBB+
BBB+
BBB+
BBB
BBB+
BBB
BBB
A-
A-
A-
A-
A-
BBB+
BBB+
BBB+
BBB+
BBB+
BBB+
BBB+
BBB
A- A-
A-
A-
A-
A-
A-
A-
A-
A-
BBB+
BBB+ BBB+
BBB+
BBB+
BBB+
BBB+
BBB+
BBB+
BBB
BBB
BBB BBB
BBB
From stable to negative
Stable
Stable
Stable
Stable
From stable to negative
From stable to negative
From negative to stable
Stable
Stable
Stable
Stable
Stable
Stable
Stable
N/AN/AN/AN/AN/A
N/A
N/A
Sources: Companies’ websites, S&P long-term issuer rating data, Capgemini Consulting analysis
Figure 6.5. Utilities’ stock performance (July 2018)1
Share priceyear-to-year ratio
(2018/2017)
Share price / EUROSTOXX 50 ratio
(2018/2017)
Share priceratio
(2018/2013)
Share price / EUROSTOXX 50 ratio
(2018/2013)
EUROSTOXX 50
-1.9% 29.7% 0.0%
Naturgy (Gas Natural Fenosa)
33.6% 35.2% 36.2% 4.3%
0.0%
EnBW 61.0% -15.0% 64.2% -34.5%
E.ON 57.2% -32.2% 60.3% -47.7%
Centrica -31.3% -63.1% -29.9% -71.6%
SSE -5.3% -23.8% -3.5% -41.2%
Enel 46.0% 54.5% 49.9% 19.1%
EDF 41.4% -20.9% 44.2% -39.0%
Engie 36.5% -14.5% 39.2% -34.1%
Vattenfall 11.1% -20.4% 13.3% -38.6%
Fortum 30.7% 7.5% 33.3% -17.1%
EDP 24.1% 19.2% 26.6% -8.1%
CEZ 46.0% -28.8% 48.9% -45.1%
Iberdrola 30.4% 85.7% 33.0% 43.1%
RWE 68.8% -47.9% 72.1% -59.8%
Uniper 125.9% - -31.3% -63.1%
Ørsted(DONG Energy)
61.0% - 61.0% -15.0%
Sources: Thomson Reuters EIKON data (stock prices and index values from July 1, 2013,2014,2015, 2016, 2017, 2018), Capgemini Consulting analysis1
Credit ratings
149
– “Grand Carénage”, slipping new nuclear schedules and
of potential group activities separation decisions by
share price.
ENGIE continued its shift towards zero-emissions energies, by selling or decommissioning coal and oil assets and massively investing in renewables and biogas, power-to-gas; the fact that ENGIE appears strongly engaged in digital transformation is also probably well perceived by the markets.
In the UK, Centrica made progress on cost-cutting and balance sheet improvement in 2017. However, strong competition and increasing prices accelerated customer churn (>10% of British Gas customers in 2017) despite
Euro
pe

The evolving context is reducing carbon intensity
Thanks to a shift towards new ways of production and modernization of existing facilities, Utilities’ overall carbon intensity has been decreasing since 2013, except for Naturgy (ex-GNF) and EDP.
fuels and reach the goals set out in the 2015 Paris Agreement. However, carbon
to trigger high investments
increased from €5/t in early
by 2030 will be needed to reach the goals of the Paris Agreement1. In addition to this regulatory constraint, investors are pushing for cleaner energy production, thus impacting on strategic business decisions.
policies: e.g. in France, carbon tax is expected to rise from around €30 today to €86 in 2022, whereas in Germany the government rejected the additional carbon taxation. However, Utilities’ long-term strategy is very likely to follow the EU’s low carbon intensity policy.
Three groups of Utilities can be distinguished
Vattenfall and Orstedcarbon intensity levels during 2014-2017, by 28% and 26% respectively. They are converting their high CO2 intensity power plants: Vattenfall started the phase out by converting a lignite power station to natural gas and Orsted by biomass conversion of CHP plants. Vattenfall has observed the highest decline thanks to its dedicated goal of becoming free from fossil fuels within one generation by 2030, and Orsted is currently having higher output from wind power
their countries. E.ON showed a carbon intensity of less than 146 gCO2
investment in green energy sources. Even though, they have
Historically low-emission activities: EDF can reach the lowest carbon intensity level in Europe thanks to its nuclear production capabilities. Fortum’s carbon intensity has been around 181 gCO2/kWh for the last three years and it has
Gradual phase-out strategy:focusing on this subject for many years but with a less aggressive strategy. Despite extensive communication about its move towards low carbon emission since 2012, ENGIE is progressing at a slightly lower speed than its competitors (around 16% reduction since 2014) and remains at a relatively high level of emissions (350g/KWh in
RWE and EnBW CO2 emissions remain at a very high level due to coal
CO2
Figure 6.7. CO2 emissions from power and heat generation1
EDFEnel
Uniper5
EngieRW
E
E.ON
2
SSE
Centrica
Iberd
rola
Gas Natu
ral
Fenosa3
EnBW
Vattenfa
ll4
EDP
Ørste
d
(DONG Energ
y)Fortu
m
300
400
700
800
600
500
20%
0%
-20%
-40%
-60%
-80%
-100%
-120%0
100
200
CO
2 em
issi
ons
fro
m p
ow
er a
nd h
eat
gen
erat
ion
[g/k
Wh]
CA
GR
Co
mp
oun
d A
nnua
l Gro
wth
Rat
e 20
14-2
017
[%]
2017 2014-2017 CAGR201620152014
-4%-5%
2% 0%-7%
7%
-13%
0%-4%
-28%
-7%
-26%
-7%
Sources: companies 2017 and 2018 annual reports.1 The chart displays CO2 scope 1 emissions (meaning from in-house sources - gas transmission and electricity generation and excluding other Greenhouse gases).2 2017 indicators calculated from CO2 emissions and generation reported in the annual report as companies don’t communicate anymore on the CO2 intensity.3 Gas Natural Fenosa has excluded generation from nuclear sector in its average CO2 emission calculation. Nuclear representing 10% of the company mix for power generation, the total 2016 average CO2 emissions figure might be slightly lower.4 Vattenfall has reported its figures exluding lignite operations starting from 2015 despite divestments happened early 2016.5 No CAGR Calculated for Uniper for which only 2 years of data have been considered.
1
150 A Strategic Overview of the Global Energy Markets

Topic Box 6.1: In a more challenging environment, Utilities are implementing new investment strategies towards services and low carbon energyIn 2017-2018, European power companies continued to review their investment strategies and to transform their business models through mergers and acquisitions (M&A). Indeed, these companies continue to evolve in a more and
impacted by:
• Limited economic growth in most European countries, leading companies to improve their operational performance via restructuring and to propose new services;
• More competitive markets (emphasized by the entry of new players), forcing companies to constantly
• Increasing regulatory constraints regarding CO
2 prices, pushing companies towards low-carbon technologies.
Oil and gas companies position themselves as serious challengers Thanks to more revenues (following higher oil prices and cost-cutting policies), oil and gas companies are increasing their investment towards cleaner production and energy distribution. European oil and gas companies are now deploying aggressive investment strategies, going beyond their traditional business. This might position them as major players in the coming years:
• Total has proven its interest in green energy and
producer EREN RE. Total is also expanding its activity along the entire gas-electricity value chain while developing low-carbon energies thanks to its Direct Energie acquisition. Total is repositioning itself on the French and Belgian electricity supply markets as a leading alternative supplier by combining its 1.5 million clients portfolio with Direct Energie’s 2.6 million clients portfolio (Reference: Total).
• In late 2017, Shell acquired NewMotion, one of Europe’s largest electric vehicle charging providers. This highlights Shell’s intention to maximize the services
a range of refueling choices over the coming years. This will enable new technologies to co-exist with traditional transport fuels. Following its First Utility acquisition, Shell is also moving from a pure industrial and commercial energy provider to residentials.
• BPacquisition of Chargemaster, having the largest EV charging network in the UK.
One can also mention the growing appetite of non-European companies: Chinese state-controlled company China Three Gorges (CTG) unsuccessfully attempted to take over EDP for €9.1 billion (which was rejected due to the price being considered too low). This operation showed the increasing interest of Chinese investors in European energy assets (China has even become one of the major investors in Portugal).
Reacting to this evolution in their environment, companies are implementing two major strategies:
Utilities are shifting towards renewablesSome companies are splitting future energy sources from their conventional businesses, with an increased interest on distributed energy. Low carbon energy and renewable assets (separating from or decreasing exposure to conventional generation) are remaining at the top of acquisitions agendas, not only for reputational reasons but mainly due to changing business strategies around clean energy.
• Two major German Utilities, RWE and E.ON, were
formed Uniper, which took the conventional assets (e.g. gas and coal generation) while E.ON focused on renewables and energy networks. RWE put its green and retail businesses in a subsidiary called Innogy, which went public in 2016. Recently, RWE and E.ON agreed to break up RWE’s subsidiary Innogy and divide its assets between them in a €5.2 billion deal, making this one of
• Fortum expects the deal with Uniper to deliver an attractive payback that will support Fortum in accelerating the development and implementation of
competitive dividend.
Utilities are entering new markets, developing new servicesSome companies are entering new markets via acquisitions and external growth where they can leverage their know-how.
Enel, E.ON and ENGIE continue to make important
them to get access to new markets such as e-mobility,
energy storage. As an example, ENGIE fought its way into the fast-growing EV market, with its acquisition of Netherlands-based EV-BoX, one of the leading EV vehicle charging service providers.
151
Euro
pe

152 A Strategic Overview of the Global Energy Markets

153
Sout
heas
t AsiaSoutheast
Asia

154 A Strategic Overview of the Global Energy Markets
Gaurav Modi
Chief Executive Officer Capgemini Southeast Asia, Hong Kong &
Taïwan
Kiran Keshav
Group Sales Officer
WEMO 2018 Southeast Asia EditorialGaurav Modi & Kiran Keshav
South East Asia (SEA) is on the cusp of change
The increasing population and urbanization, resulting in multiple development and infrastructure initiatives, has led to a rising energy demand. However, there is still high reliance on fossil fuels with coal leading the mix. All 6 SEA countries considered for the purpose of this report have signed up to the Paris agreement, and are therefore required to reduce this reliance on fossil fuels and increase the renewables in the energy mix. The big challenge is to meet this increasing energy demand in an environmentally friendly manner.
Equally important to note is the fact that, according to the Global Climate Risk Index, four of the world’s 10
change are located in Southeast Asia: Myanmar, the Philippines, Thailand and Vietnam. Therefore, the impact of GHG emissions and global warming resulting in climate change has direct
the need for action is more urgent than elsewhere.
There are hurdles, however. Investment in renewable energy in SEA is only about 1.2% of the global
for 3.7% of the world’s emissions in 2017. This modest investment is attributable to policy uncertainty in most of the countries. Projects in the Philippines and Vietnam, for example, have been slow to proceed due to a lack of clear government policies and bankability concerns.
Nevertheless, progress has been made in the last couple of years, and most countries in the region have shown clear intent in embracing a greener energy mix. Singapore has been leading the way with solar photovoltaic panels and its Open Electricity Market that enables consumers to opt for green energy. Malaysia and the
Philippines have also been considering
stages in terms of opening up their markets to competition.
The region is also expected to
building LNG terminals as it is set to become one of the largest importers of global LNG. Singapore is also being developed as a regional gas hub to focus on gas trading. Such hub-based trading has become a key feature of gas markets in Europe and North America and allows for better transparency as well as enhancing
Singapore has made important moves towards liberalizing its gas market, providing the basis for more competitive price setting, and this should eventually enable development of such a hub-style market.
From a consumer perspective, the increase in energy demand is due to rising income levels, leading to higher ownership of appliances and a growing demand for cooling. Considering the fact that power prices in the region
subsidies and reliance on expensive imports, the increase in energy demand results in a very price-sensitive consumer market. Deregulation of the electricity market in Singapore is a step in the right direction to enable competitive pricing and give consumers the option of choosing the plan that best suits them.
Digital technologies such as big data, analytics, cloud and blockchain are also playing a key role in addressing some of these energy-sector challenges in SEA. A deeper understanding of energy data distribution and consumption analytics has helped energy companies
across the energy lifecycle. Investment in smart grids, smart buildings, and
in the region and is expected to increase in the coming years, which will
further improve data-driven analytical capabilities to better predict energy supply and demand.
South East Asia is poised for change – changing consumer demographics, changing energy demand, changing regulatory frameworks, and changing technology options. All of these are expected to play a major role in transforming the SEA energy market into a vibrant, eco-friendly, secure and
October 01, 2018

155
Hong Kong
Singapore
Taiwan
Philippines
Vietnam
Malaysia
In this Observatory, Southeast Asia (SEA) refers to a region covering the following six countries only
Sout
heas
t Asia

156 A Strategic Overview of the Global Energy Markets
Major energy events (2017 and H1 2018)
2017
Clim
ate
chan
ge
En
erg
ytr
ansi
tio
nC
om
pan
ies
Ele
ctri
city
Gas
Ru
les
Jan Feb March April May June July Aug Sept Oct2017
19 May:Taiwan amended Renewable Energy Development Act in January 2017, to create and support new markets for renewable power. The new law opened the country’s renewable energy sector to private renewable energy participation through T-RECs (Taiwan-Renewable Energy Credit)
17 March:MERALCO: launched advanced metering infrastructure (AMI) project, to transform its distribution network into a smart grid
12 July:
e-commerce platform for electricity was set up by two former Sunseap executives
5 june:Taipower to setup microgrids in Taipei, to cope with climate change
Source: Various industry sources - Capgemini analysis, WEMO2018

157
JanDecNov Feb March April May June July20182017 2018
20 February:Singapore: Carbon tax set at S$5 per tonne of greenhouse gases generated from next year to 2023
24 May:Siemens and TNB team up to transform Malaysia’s digitalization in its power generation services and energy management
Sout
heas
t Asia

158 A Strategic Overview of the Global Energy Markets
1-Climate Challenges & Regulatory Policies
Southeast Asia is moving towards a clean energy system, but high energy demand and cost pressures are the two key factors behind its slow progress.• Vietnam witnessed its highest ever
energy consumption during the past
• Oil continues to be the leading source of energy, though its share in the total primary energy demand has declined by around six percentage points, to 34%, since 2000.
Growth in energy demand will be highest in the power sector followed by industry, transport and buildings.
• Singapore’s imports of energy products grew by 2% from 172.8 Mtoe in 2015 to 176.3 Mtoe in 2016.
• Power generation in Malaysia is primarily dominated by gas and coal, accounting for 78% of the country’s energy mix (2017), and in the last
has emerged, adding 22% to the country’s energy mix.
coal, followed by gas, are expected to lead the future of energy production.
• By 2040, renewables are expected to account for the largest share of installed capacity (nearly 40%), but coal is likely to take the most prominent role in the generation mix (40%), and 70% of
ultra-supercritical technologies.• Concerns about air pollution in
several of the region’s largest cities continue to rise as the urban population and demand for mobility increase.
Climate Challenges in Southeast Asia - An Overview
Southeast Asia is witnessing rapid economic growth and development across all sectors, combined with a growing population and urbanization, as well as improving access to basic services. However, this impressive growth curve creates staggering energy challenges and raises acute concerns about environmental sustainability.
Energy demand is growing fast, driven by increasing industrial activities, rapidly growing populations and rising income levels. The region’s heavy reliance on fossil fuels for power generation and other needs is contributing to rising GHG emissions, a trend that presents a major policy challenge in the context of global climate targets.
• Energy consumption in the region is estimated to increase by up to 140% by 2040. One of the major challenges is to meet the rapidly growing energy demand in a timely manner while also chasing other crucial socio-economic and environmental objectives. These include enhancing energy security, reducing the environmental and health impacts of energy supply and achieving universal access to modern
energy services. This has prompted a number of countries in the region to evaluate the structures of their energy sector, including power market design, and identify opportunities for augmenting government investments towards environmental sustainability.
scaling up renewable energy investment and deployment while simultaneously focusing on other barriers that
regulatory environment.• Coal is projected to become the largest energy source from
2040 onward, and failure to move away from fossil fuels like coal may damage the international stature of ASEAN countries and also lead to failure in meeting their Paris Agreement targets. Reducing fossil-fuel subsidies and increasing the share of renewables in the energy mix could counteract fossil fuel dependence and achieve the NDCs.
• Food, health, energy; almost everything is at risk as the temperature rises along with ever increasing GHG emissions, and there will probably be more intense typhoons and cyclones as global temperatures increase, but the region also has the opportunity to lead in green technologies.
Lowering Carbon Emissions to meet the TargetRising CO2
the countries in the region. There is strong growth in low-carbon energy, but increased energy needs have led to rising consumption of all fuels. Coal alone accounts for almost 40% of the growth, and overtakes natural gas in the electricity mix (2040).Southeast Asia’s major six countries accounted for 3.7% of total global greenhouse gas (GHG) emissions in 2017. Hong Kong’s emissions will peak by 2020, at a time when it will have more electricity generation from natural gas in its fuel mix.

159
• Over the past 25 years, according to the International Energy Agency (IEA), energy demand in Southeast Asia has increased by over 150%. The IEA also forecast that the growth for energy demand in the region would increase another 80% from the current consumption, or reach 1,070 Mtoe by 2040 while electricity generation is expected to reach 1,104 TWh by 2040.
• Oil continues to be the leading source of energy, though its share of total primary energy demand has declined by around six percentage points, to 34%, since 2000.
• Coal demand has more than doubled since 2000, with an annual average growth rate of 8.8%. – In 2016, coal demand of around 110 Mtoe accounted for
17% of the total primary energy demand, of which the largest portion was for power generation
• Solid biomass plays a major role in Southeast Asia’s primary energy mix, accounting for 20% of total demand in 2016.
• Among the modern sources of renewable energy, hydropower has grown rapidly with expanded use.
Southeast Asian nations should focus more on energy security and
economic growth and market integration, and mitigate the
Sectoral Demand
ConsequencesAccording to the Global Climate Risk Index, four of the world’s
in Southeast Asia: Myanmar, the Philippines, Thailand and Vietnam. In these countries and others, climate change is likely to have major implications.
• Extreme weather events are also expected to worsen; events in the past, such as the 2013 Typhoon Haiyan in the Philippines, caused high death tolls and a rise in cross-border migration.
• Transboundary haze pollution1
already caused pressures between countries across SEA,
While haze can cause diplomatic rifts, it also provides an opportunity for countries to work together.
• Food security is another major concern, because a large proportion of Southeast Asia’s workforce is engaged in
vulnerable to climate change. Rice yields and Gross Domestic Product (GDP) in ASEAN countries are projected to decline by 50% and 6.7% by 2100, respectively.
Primary Energy Demand evolving at a noteworthy pace
Figure 1.1. Primary Energy Demand Evolution, 2000-2016 (million tons oil equivalent)
8%
41%
19%
26%
6%18%
34%22%
20%
6%
2000 2016
385Mtoe
643Mtoe
CoalOilGasBioenergyOther Renewables
Source: IEA, Southeast Asia Energy Outlook, 2017
Primary energy demand grew by around 70% between 2000 and 2016, rising to 643 Mtoe, while the GDP more than doubled over the same period.
• Rapid economic development has stimulated demand in a range of energy-intensive industries including steel, petrochemicals, paper, cement and aluminium. Growth in energy demand will be highest in the power sector followed by industry, transport and buildings.
• Among end-use sectors, energy demand in transport grew most rapidly, almost doubling between 2000 and 2016. Natural gas and biofuels constitute around 6% of transport
Asian countries, such as Malaysia, to increase the use of alternative fuels.
• Bioenergy is the dominant fuel in the buildings sector, meeting around 60% of energy demand. Since 2000, a 180% increase in electricity consumption (the fastest growing energy source in buildings over the period) has helped slow the growth in biomass use, doubling the share of electricity in the buildings energy mix.
1
awareness and concern in various countries beyond Indonesian shores.
Sout
heas
t Asia

160 A Strategic Overview of the Global Energy Markets
Southeast Asia’s growing energy demand
• Hong Kong has no indigenous fuels and has to import fossil fuels (mainly coal and oil products) to meet energy demands for electricity generation, transport, industry, etc. – Energy consumption in 2015 was 39.5
GJ per capita. For the period from 2005-2015, energy consumption per capita reduced by 4.1% (decreasing at an average annual rate of 0.4%).
• Singapore’s imports of energy products grew by 2% from 172.8 Mtoe in 2015 to 176.3 Mtoe in 2016, whereas exports of energy products witnessed an 8% increase, growing from 92.0 Mtoe in 2015 to 99.3 Mtoe in 2016. Imports of natural gas increased by 2.4% from 9.5 Mtoe in 2015
Gas (LNG) accounting for 23.4% of these imports. Electricity generation increased by 2.6% from 50.3 TWh in 2015 to 51.6 TWh in 2016.
• Power generation in Malaysia is mainly dominated by gas and coal, accounting for 78% of the country’s energy mix
emerged, adding 22% to the country’s energy mix. In 2005,
is expected to balloon to 180,000GWh by 2035.• The Philippines can indigenously satisfy energy needs. The
total production of all electricity producing facilities is 91 bn kWh, which is 122% of its own requirements. Electricity consumption grew considerably from 82,413,213 MWh (2015) to 90,797,891 MWh (2016). This increase was mainly driven by the growth of residential consumption at 12.7% from 22,747,049 MWh (2015) to 25,631,254 MWh (2016), due to high requirements for cooling systems.
• In Vietnam, electricity demand is expected to grow by 8% per annum on average until 2035, corresponding to a need for an additional 93 GW of power generation capacity during the period. Almost half of the new capacity is intended to be
• In 2016, Taiwan’s total supply of primary energy amounted to 146,590.0 103 Kilos Of Oil Equivalent (KLOEs), marking an increase of 0.34% over 146,095.7 103 KLOEs in 2015. In 2016, the per capita energy requirement was 4,998.36 liters of oil equivalent, representing an increase of 0.05% over 4,996.08 liters of oil equivalent in 2015.
Figure 1.2. Energy Potential by Country and by Technology
Ho
ng K
ong
Mal
aysi
aSi
ngap
ore
Taiw
anP
hilip
pin
esV
ietn
am
Biomass Geothermal Hydropower Wind Tidal Solar
1
2
3
6
5
4
Source: The ASEAN Post, September 2017
consumption, as rising opportunities and incomes in the region lead to higher ownership of appliances and increasing demand for cooling. Two-thirds of the increase in Southeast Asia’s electricity demand comes from the residential and services sectors, largely due to a rising urban population.
Energy usage in the transport sector remains dominated by oil
biofuels. Biofuels can bring energy security and environmental
is managed sustainably.

161
Energy Consumption: primary energy consumption and the underlying impact - current scenario
• Southeast Asia continues to witness increasing challenges in ensuring regional cooperation in dealing with climate change issues after the U.S. decision to withdraw from the 2015 Paris Agreement.
– For example, Vietnam’s delta river region, the rice producing section of the nation, is threatened by rising sea
insect infestations. – Following talks between U.S. President
Donald J. Trump and Vietnamese Prime Minister Nguyen Xuan Phuc, the US said it would continue to work together with Hanoi to address global challenges, including environmental protection.
• Southeast Asia aims to shift towards a clean energy system, but high energy demand and cost pressures are the two key factors behind its slow progress.
• Despite ambitious green energy targets set by several Southeast Asian nations in the past years, the region’s battle
• Strong economic growth and poor regional coordination have been mentioned by experts as basic causes for the persistently low share of renewables in the region’s energy mix.
The prevailing scenario
• With Southeast Asian energy demand likely to escalate by more than 80% between 2015 and 2040, as projected by the International Energy Agency (IEA), the government is facing the daunting task of producing large amounts of sustainable energy to meet the ever increasing demand for electricity. The cost of failing to curb GHG emissions will be high, as the region’s long coastlines are home to tens of millions of people, susceptible to sea level rises and severe typhoons aggravated by climate change.
increasing electricity demand requires a huge expansion in the region’s power system, with coal and renewables accounting for almost 70% of new capacity.
• Concerns about air pollution in several of the region’s largest cities is intensifying as population and demand for mobility increase. Strong growth in fossil-fuel consumption has led to a 75% increase in energy-related CO
2
and increased renewables deployment are vital for a more sustainable energy future.
Primary Energy Consumption - Vietnam witnessed its highest ever energy consumption during the
Figure 1.3. Primary Energy Consumption, 2013-2017 (million tons oil equivalent)
Hong Kong Singapore Malaysia Philippines Vietnam Taiwan
28
74
93
33
57
112
27
76
94
35
63
28
81
95
38
69
113
29
84
98
41
74
31
86
100
43
115
0
20
40
60
80
100
120
140
Mil
lion
To
ns
Oil
Eq
uiv
alen
t
2013 2014 2015 2016 2017
2.5%
4.1%
1.7%
6.9%
7.1%
0.7%
CAGR 2013-2017
75
114 114
Source: BP Statistical Review of World Energy, 2018
Sout
heas
t Asia

162 A Strategic Overview of the Global Energy Markets
• By 2040, renewable energy is expected to account for the largest share of installed capacity (nearly 40%), but coal takes the
ultra-supercritical technologies.• Demand for natural gas growth is also expected to intensify, by around 60% to 2040, due to rising consumption in power
generation and industry. The share of renewables (excluding solid biomass), including hydro, solar photovoltaic (PV) and wind power, will almost double as their deployment helps to meet rising electricity demand and to extend energy access.
Figure 1.4. Energy-related CO2 Emissions Growth, 2017 (million metric tons)
Ho
ng K
ong
Mal
aysi
aSi
ngap
ore
Taiw
anP
hilip
pin
esV
ietn
am
20162017
Emissions
2017Emissions
2017Emissions
6.7%
20162017
Emissions
3.6%
20162017
Emissions
0.6%
20162017
Emissions
7.3%
99Mt CO2
285Mt CO2
196Mt CO2
120Mt CO2
2016
3.7%227
Mt CO2
256Mt CO2
2016
1.5%
Source: BP Statistical Review of World Energy, 2018
Southeast Asia’s emissions overview
• Southeast Asia is a growing source of GHG emissions. The region has experienced rapid economic growth in recent years, and regional GHG emissions have rapidly increased, at nearly 5% per year over the last two decades.
• Deforestation and land use account for a majority
Asia is improving more slowly than in other areas of developing Asia or the world as a whole, while coal and oil have been rapidly rising as sources of primary energy.
• Climate mitigation requires a global energy transition, which has implications for regional relationships. Coal is projected to become the largest energy source from 2040 onward, which completely negates the respective NDCs.
• Taiwan had the majority of carbon emissions (0.9%) among other countries. “While carbon reduction is
stated the Taiwan’s Bureau of Energy. High electricity demand throughout 2017 has encouraged the increased usage of coal-burning power plants in Taiwan"1.
Southeast Asia’s major six countries accounted for 3.7% of total global emissions in 2017.
Figure 1.5. Southeast Asia’s Share in Global Emissions, 2017 (million tons CO2)
Americas, 22.2%EMEA, 28.9%
Rest of APAC, 45.1%
2017 Global Emissions
33,444Mt CO2
Hong Kong, 0.3%
Singapore, 0.7%
Malaysia, 0.8%
Philippines, 0.4%
Vietnam, 0.6%
Taiwan, 0.9%
SEA, 3.70%
Source: BP Statistical Review of World Energy, 2018
• Southeast Asia remains an important producer of oil, gas and coal, but also faces several challenges, especially in the short term.
• There is strong growth in low-carbon energy, but increased energy needs have led to rising consumption of all fuels.
• Coal alone accounts for almost 40% of the growth, and has overtaken gas in the electricity mix.
• The region’s power system has expanded to meet energy demand, with major components such as coal and renewables accounting for ~70% of the extended capacity.
• The mix of fuels and technologies varies
emerging preference for a combination of
deployment of renewables.
• Concerns about air pollution in several of the region’s largest cities are intensifying as the urban population and demand for mobility increase.
• Strong growth in fossil-fuel consumption has led to a 75% increase in energy-related CO2 emissions.
1 Taiwan News, 2018

163
Hong Kong: Lowering Carbon Emissions
• In Hong Kong, local electricity generation is the biggest contributor to carbon emissions making up about 70%. Despite a rising population and economy, emissions levels have remained at around 40-45 million tons of CO2e in recent years. Hong Kong’s emissions will peak by 2020 when it will have more electricity generation from natural gas in its fuel mix.
• The country’s current decarbonization route will help to reduce carbon intensity by around 50% by 2020 using 2005 as the base. This reduction would be equivalent to about 20% in absolute terms, which is substantial. Hong Kong’s 2030 target would take it to a 65-70% carbon intensity reduction from the 2005 level, which equates to about 26-36% in absolute terms.
Southeast Asia GHG Challenges - Regional Outlook
The continuous rise in temperature leads to various other problems, such as more frequent heatwaves, a reduction in agricultural production, sea level rise, scarcity of water resources, etc.• Hong Kong
GHG emissions from the last century. Apart from rising temperature, Hong Kong is experiencing heavy rain more frequently than before. The sea level is rising in Victoria Harbour. Hong Kong will continue to phase out coal for electricity generation, use more natural gas, and increase non-fossil fuel sources, which will enable Hong Kong to
• Energy consumption is one of the main sources of carbon in Singapore. Its household appliances, transport systems, and industrial and commercial activities all run on electricity and fossil fuel. A vibrant Singapore relies on consuming electricity. Singapore accounts for less than 0.2% of global emissions.
• In Malaysia, the mean surface temperatures have increased from 0.6°C to 1.2°C over 50 years (1969-2009) and are projected to increase from 1.5 to 2°C by 2050. While there
observed data, this is projected to change in both Peninsular Malaysia and Sabah and Sarawak.
• Due to its geographical location, climate and topography, the Philippines is ranked third on the World Risk Index 2018 for highest disaster risk and exposure to natural disasters. In the Philippines, the transportation sector accounts for the largest average of CO
2 emissions at 36.43%, followed by other industries at 20.22% in the same period of 1990 to 2014.
• Vietnam is considered one of the most damage prone regions in terms of climate challenges. Extreme climate events have become more frequent and more intense; its average temperature has increased by about 0.5°C; and its sea level has risen by approximately 20 centimeters, which is particularly disconcerting because of its 2,000 miles of coastline. These impacts present clear challenges for the Vietnamese – especially in the Mekong River Delta region, a crucial hub for food production. In 2016, Vietnam
commitment to reducing global GHG emissions and pursuing
• Although Taiwan is not a participant of the Kyoto Protocol, it is part of the global village and has the responsibility of reducing CO
2 emissions. In Taiwan’s industrial sector, the petrochemical industry is the largest emitter of GHG.
GHG emissions evolution• Hong Kong has set an ambitious carbon
intensity target of 65% to 70% by 2030 using 2005 as the base, which is equivalent to 26% to 36% absolute reduction and a reduction to 3.3-3.8 tons on a per capita basis. It is also predicted that carbon emissions will peak before 2020. – Hong Kong has acceded to the Paris
Agreement and will follow its reporting timeline. It has based its operational framework on the 4Ts1 and is using cleaner fuel and renewable energy to reduce GHG emissions.
• Singapore contributes around 0.11% of global emissions. The region’s NDC emissions target of a 36% reduction in emissions intensity below 2005 levels by 2030 is very weak compared to currently
Figure 1.6. Emissions Evolution, 2013-2017 (million tons CO2)
0
50
100
150
200
250
300
Mill
ion
tons
CO
2
2013 2014 2015 2016 2017
92
193
233
92141
266
90
193
241
98
158
272
91
204
246
107
184
268
93
219
252
112
195
275
99
227
256
120
196
285
2.0%
6.8%
8.6%
4.1%
2.4%
1.7%
CAGR 2013-2017
Hong Kong Singapore Malaysia Philippines Vietnam Taiwan
Source: BP Statistical Review of World Energy, 2018
Sout
heas
t Asia

• The GHG Act in Taiwan calls for GHG reductions based on 2005 GHG emissions levels. It aims for emissions to decline 5% by 2020, 10% by 2025, 20% by 2030, and 50% by 2050.
• The GHG Act targets six major sectors for GHG emissions reductions: energy, manufacturing, transportation, residential and commercial, agriculture and environmental management.
164 A Strategic Overview of the Global Energy Markets
implemented policies, which will lead to emissions in 2030 of 60 MtCO2e, or a 123% increase above 1994 levels.
• In 2011, Malaysia’s total GHG emissions were 290.23 Mt CO2e. Taking into consideration the drop in emissions from land use, land-use change and forestry (LULUCF), the net GHG emissions were 27.28 Mt CO2e. – Malaysia has undertaken a number of mitigation (emissions reduction) and
strategies to tackle climate change.• Proactive mitigation measures need to be implemented in the Philippines to avoid
a major rise in GHG emissions. Sectors such as transportation, power generation and household electricity may contribute to a six-fold emissions increase between 2015 and 2050.
Regional energy targets and subsequent sectoral mapping
Country Sector Key Targets & Policies
Hong Kong
Renewables Continue to phase out coal for electricity generation, use more natural gas, and increase non-fossil fuel sources,
Climate change Reduce carbon intensity from 65% to 70% by 2030 using 2005 as the base
Singapore Improve energy intensity by 36% by 2030 from 2005 levels
Renewables Increase solar PV capacity to 350 MW by 2020
Climate change Reduce GHG emissions by 16% below BAU level by 2020; stabilize emissions with the aim of peaking around 2030
Malaysiaaudits and building design
Renewables Increase capacity of renewables to 2,080 MW by 2020 and 4,000 MW by 2030
Transport Introduce 100,000 electric vehicles by 2020 with 125,000 charging stations
Climate change Reduce GHG intensity of GDP by 35% by 2030 from 2005 level, aiming for a 45% reduction with enhanced international support
Philippines
Improve energy intensity by 40% by 2030 from 2010 level. Decrease energy consumption by 1.6% per year against baseline forecasts by 2030
Renewables Triple the installed capacity of renewables-based power generation from 2010 level to 15 GW by 2030
Climate change Reduce GHG emissions by 70% from BAU level by 2030 conditional on international support
Vietnam Ensure most rural households have access to electricity by 2020
Increase commercial electricity savings to more than 10% of total power consumption by 2020 relative to BAU
Renewables Increase the share of non-hydro renewables-based power generation capacity to 12.5% by 2025 and 21% by 2030
Climate change Reduce GHG emissions from BAU level by 8% by 2030 and by 25% with international support
Taiwan Renewables Achieve a 20%-by-2025 renewable energy target
Climate changeMtCO2e) by 50% from BAU (428 MtCO2e) by 2030
1 4Ts framework, namely target, timeline, transparency and together, under which the 4Ts partners are encouraged to set their energy saving targets and timelines and to share their existing and planned energy saving measures

165
Topic Box 1.1: Government and private sector initiatives to reduce emissions challenges
Hong Kong
• Hong Kong has incidentally developed very few policy and economic incentives to promote and support green technologies. For example, the World Wildlife Fund (WWF) is distributing photovoltaic panels in Tai O, a village in Hong Kong. To prevent the grid from burning out, the supplier (CLP), has to control the energy input
Singapore
• With Singapore’s Smart Nation initiative, energy companies are adopting intelligent remote sensors,
the need of end users and customers through value-added applications: – ENGIE has partnered with Schneider Electric and
Nanyang Technological University in Singapore to build a test site for a 2.8 MW microgrid (expected to come online in 2018). Renewable Energy Integration Demonstrator in Singapore (REIDS), the Semakau project aims to develop a microgrid demonstrator
and islands.
Malaysia
• Green Technology Master Plan 2017-2030 - To transform
economy through the implementation of Green Catalyst Projects that would reduce carbon intensity by 40% by 2020.
by 13.113 million tons CO2e by 2030.• Transportation Sector - The launch of the Mass Rapid
Transit (MRT) phase one successfully removed 9.9 million cars in 2017 and is estimated to remove an additional 62-89 million cars between 2020-2030.
• Low Carbon Cities Framework – To introduce a carbon reduction blueprint for local authorities and developers when making decisions on greener solutions.
Philippines
• The Philippines’ GHG emissions are currently a minor contributor to global warming (in comparison to Vietnam and Malaysia). The following market-based instruments have been employed till date: –
Renewable Energy Act of 2008 – Received 119 Clean Development Mechanism (CDM)
project applications (out of which 70 have been registered)
– Also signed the Joint Crediting Mechanism (JCM) with Japan.
Vietnam
amount of spending toward climate change activities, green growth strategies and action plans. However, the program has not realized fully due to various bottlenecks, and some important activities remain underfunded or not funded at all.
Taiwan
• In 2014, the U.S. Environmental Protection Agency (EPA) and the Environmental Protection Administration
Environmental Partnership (IEP), a global network of experts working towards addressing environmental challenges. Other priorities such as climate change, electronic waste management, environmental education, mercury monitoring, air pollution, contaminated soil and groundwater are also addressed by EPA and EPAT.
Energy Transition towards Renewables
• In recent years, the region has embarked on a plan
security, energy access, economic competitiveness and social and environmental sustainability.
• The majority of countries have their own set of
power sources. However, despite the dominance of laws geared toward renewable energy-based power, most countries still lack comprehensive legal frameworks or mandates for renewable energy-based transport or heating and cooling.
Sout
heas
t Asia

166 A Strategic Overview of the Global Energy Markets
2-Energy Transition
Renewable energy and
immensely help countries to making up shortfalls in the Paris climate pledges.• Most SEA countries are facing
high energy demand growth, along with other challenges such as energy security, economic and environmental concerns.
across the various end-use sectors would complement renewable
to reconcile the objectives of energy sector expansion with sustainable development.
To achieve the set targets,
develop policy frameworks and robust institutions.• To support the deployment of
renewables in government and community buildings, the Hong Kong authorities aim to increase funding from US$25 million to US$127 billion
• Taiwan amended Renewable Energy Development Act in January 2017, to create and support new markets for renewable power. – The new law opened the country’s
renewable energy sector to private renewable energy participation, and made it possible for nonutility buyers to procure T-RECs directly from projects.
Renewable energy investment in the power sector exceeded US$3.5 billion in 2017.• Total investment by SEA in
renewable energy represented about 1.2% of global investment in renewable energy.
• The modest renewable energy
Southeast Asian economies with fast-growing electricity demand resulted mainly from policy uncertainty (eg. Bankability of Power Purchase Agreements (PPAs) for solar PV in Vietnam).
• While Hong Kong owed its position to public market activity (eg. Initial
than to increased renewable energy capacity, the rise in investments in Singapore is the result of a strong focus on solar rooftop deployment (and novel applications such as
Countries are taking concerted steps to address non-conducive conditions for renewable power generation.• Countries such as Hong Kong,
hydroelectric generation. – However, in October 2017,
Prosperity International of Hong Kong agreed a deal to develop a hydro power plant in Aceh with installed capacity of 1,000 MW and a total estimated investment of US$3 billion.
• In October 2017, Singapore installed
energy to power 45 four-room HDB units a year.
Rising energy needs and changing supply-demand dynamics are creating tough challenges for Southeast Asia’s policy-makers, but energy transition
During past decades, SEA has experienced rapid economic growth, boosting energy demand, hasty urbanization leading to growing environmental pressures and heavy reliance on costly fossil fuels. The logical solution for the region that is well endowed with wind and solar resources and with a high density of potential customers, is development of renewable energy.

167
Transformation of the global energy system forms the backbone of climate action
• With the majority of countries in the region facing high energy demand growth, supply-side interventions
energy needs while also addressing broader energy security, economic and environmental objectives.
the various end-use sectors would complement renewable energy
objectives of energy sector expansion with sustainable development.
• Most countries in the region have set
vary greatly in scope, time frame and objectives. – Some target the absolute reduction of energy
consumption (e.g. Vietnam), some aim to reduce energy
sectors (e.g., Malaysia, Singapore).
Buildings
• Tools that benchmark the energy performance of buildings have been used to reduce energy use in hotels in Vietnam and the Philippines.
• In Malaysia, building codes have been introduced to guide
• Malaysia’s strategy to promote demand-side management explicitly focuses on education and training to increase the number of registered electrical engineer managers and on promoting ISO 50001 for buildings and industries.
• As ownership increases, domestic appliances are expected to account for a major share of electricity consumption;
–could help reduce the increase in demand.
•
across the region for appliances such as air conditioners, refrigerators and electric motors, in order to contribute to a stronger regional market.
measuresDedicated policies, action plans and institutions focusing on
gathering, reporting and accessing frameworks; and awareness and capacity building programmes emerge as some of the key enabling factors. Innovative business models, such as energy service companies and public-private partnerships, are also
measures particularly in buildings and industry.
Figure 2.1. Carbon Management Hierarchy
Factors at the top of the hierarchy are more transformative and lasting in terms of reducing emissions
Avoid carbon intensive activities (rethink business strategy)
Replace high-carbon energy sources with low carbon energy sources
eliminated by the above
Avoid
Reduce
Replace
O set
(Alternate energy/ renewables)
Source: Capgemini Analysis
Government guarantees are crucial to the bankability of projects that are considered high risk due to either their size or where the new technology is used
Transport
• Singapore has a fuel-labelling and emissions scheme (including CO2 emission limits) that includes providing rebates or imposing surcharges on vehicle purchases.
Labeling Scheme in 2003 and has since made it much more stringent.
• The Philippines is currently discussing plans to introduce fuel-economy standards: –
using liquid biofuels as an alternative to fossil-fuel-based products.
• A global shift toward low-emissions mobility has already started and its pace is accelerating.
Sout
heas
t Asia

168 A Strategic Overview of the Global Energy Markets
–to modernize, embrace new technologies, drive global standards and export their products.
• The adoption of electric vehicle (EV) technology and increased use of biofuels in the transportation sector both have their fair share of implementation challenges.
– For liquid biofuels, clear incentive structures are needed to increase investments, as well as regulatory and policy frameworks to ensure a sustainable supply chain for feedstock.
• Necessary safeguards are also needed to ensure that these investments are sustainable and address indigenous concerns alongside largescale land conversion and agri-business projects.
–challenges associated with infrastructure development and the provision of low-carbon electricity will need to be addressed.
Industries
• implemented in the region, including energy audits, energy
meters, energy standards and labelling.
• In Singapore, for instance, large industrial emitters will need to improve how they measure and report greenhouse
gas emissions, in order for them to better understand and manage emissions.
– The Energy Conservation Act prescribes mandatory energy management practices, including appointing an energy manager, monitoring and reporting energy
improvement plans. – Recent enhancements in the Act call for Minimum Energy
Performance Standards to be applied to industrial equipment and systems, and the establishment of an energy management system for existing facilities.
•
• The Malaysian government launched a US$48 million fund in 2017, to help energy service companies (ESCOs) implement
• The Singapore Economic Development Board (EDB) is
and the energy savings are shared between the various stakeholders.
Oil continues to be the dominant source of energy, though its share of total primary energy consumption declined by around six percentage points during 2017 compared to previous year.• Fossil fuels that would see the highest increase in usage in
the next few decades are coal and natural gas. – Oil will slip down in the overall energy mix rankings due
to its price volatility and other environmental factors. However, coal and natural gas are more resistant to these issues.
• Natural gas is touted as a viable alternative – cleaner than other sources of fossil fuels. Though not as clean as renewable forms of energy, it can help reduce the region’s
plants can produce greenhouse gas emissions anywhere from 50% to 70%
• Among the modern sources of renewable energy, hydropower has grown rapidly with expanded use in Malaysia and Vietnam.
– So far, non-hydro renewables have played only a relatively limited role in the energy mix.
• Currently, average consumption of natural gas as a share of total energy consumption stands at 20.8%, while that of renewable energy is only 8.3%.
• When compared to solar or wind energy, fossil fuels are still more hazardous to the environment but the lure for SEA
fossil fuels.
Renewable Energy: a key element for cleaner transition and security
Figure 2.2. Energy Consumption by Fuel, 2017 (million tons oil equivalent)
0.0
10.0
20.0
30.0
40.0
50.0
60.0
70.0
80.0
Hong Kong Singapore Malaysia Philippines Vietnam Taiwan
Mil
lion
To
ns
Oil
Eq
uiv
alen
t
Oil Natural Gas Coal Renewables
Source: BP Statistical Review of World Energy, 2018

169
Natural gas is seen by some as a way station on the road to renewable energy
to remain popular. Thousands of such plants are indeed in the pipeline, although critics warn of falling utilization
Total investment in renewable energy represented about 1.2% of global investment in renewable energy for SEA.
Hong Kong
• Owed its position in Figure 2.3 to public market activity, rather than to the buildout of renewable energy capacity, in particular, the US$434 million initial public
active in biomass generation technology.
Singapore
• The rise in investments is the result of a strong focus on solar rooftop deployment (and novel applications such as
Malaysia
• Malaysian Investment Development Authority (MIDA) survey shows the export activities undertaken by top solar companies in 2016 amounted to US$250 million.
• Local sourcing activities in the same year were worth US$320 million.
Philippines
• Developers of more than 1GW of wind projects have been unable to progress because of the lack of a suitable regulatory framework.
were in cautious mood over the bankability of power purchase agreements.
Taiwan
• The Cabinet has relaxed regulations governing the
energy development.
Investment in renewable energy in the power sector exceeded US$3.5 billion in 2017
Figure 2.3. Renewable Energy Investment (US$ billion), 2017
Taiwan
Vietnam
Philippines
Malaysia
Singapore
Hong Kong
0.6
0.7
0.3
0.7
0.6
0.7
Investment in Renewable Energy (US$ Billion)
Source: BNEF, Global Trends in Renewable Energy Investment, 2017
Southeast Asia has the potential to leapfrog fossil fuel-based energy generation methods, but only if the renewable energy sector can attract investors. According to BNEF,
the modest renewable energy investment figures for the populous Southeast Asian economies with fast-growing electricity demand resulted mainly from policy uncertainty.
among coal power plants and rising concerns on long-term gas supply, which could strengthen the case for renewables. Factors such as mounting air pollution and cheaper renewable energy costs are presenting convincing arguments for governments to shrink the role of coal and gas in the region’s long-term energy mix.
Sout
heas
t Asia

170 A Strategic Overview of the Global Energy Markets
Policy uncertainty in countries like Philippines and Vietnam has led to modest investmentHong Kong• In 2017, China Everbright Greentech, raised new capital on
the Hong Kong Stock Exchange, partly to fund projects that will use agricultural and forest by-products to generate electricity and heat.
alternative energy IPO in Hong Kong since China Longyuan Power Group’s US$2.6 billion share sale in 2009.
Singapore• The Singapore Economic Development Board (EDB) secured
microgrids and energy management in recent months.• This includes Shanghai-based Envision Energy setting up its
global digital energy hub in Singapore, comprising a global digital R&D center and global headquarters for energy IOT and smart cities.
• Other investors include GCL (solar), Hover Energy (wind) and Jiangsu Linyang (smart meters, solar).
• These companies will establish their respective regional
Malaysia• Malaysia has been increasing its focus on the solar power
sector over the past few years.• The Energy Commission of Malaysia has a Request for
Proposal (RfP) document, calling for bids from prospective project developers for 460 MW of solar power capacity.
• Under the competitive bidding programme, a large majority (360 MW) will be located in Peninsular Malaysia in the west of the country, while the remaining 100 MW will be installed in the eastern states of Sabah and Labuan.
• In 2017, Scatec Solar and its partner companies closed deals on three PV projects in Malaysia, worth US$293 million.
Philippines• Vestas of Denmark, the world’s largest wind turbine
manufacturer, is working on 1,000 MW of wind power
policies for development of the technology.
expressed anew its concern about the lack of clear-cut policy from the Philippine government on incentives for wind-power projects.
Vietnam• In September 2017, Vietnam’s Ministry of Industry and Trade
(MOIT) issued Circular No. 16/2017/TT-BCT (“Circular 16”), which imposes a set of Model PPAs for grid-connected and rooftop solar power projects.
• The MOIT has ignored several key recommendations made by industry participants on the draft PPA issued in April 2017
Vietnam’s solar sector to overcome any bankability concerns
serious concerns regarding bankability shortfalls, despite an
Taiwan
• Taiwanese insurance companies have invested about NTUS$ 5.35 billion (US$178.3 million) in the renewable energy
US$49 billion, after the Cabinet eased the regulations in the Banking Act (in October 2017).
Evolution of Renewable Energy: hydro power
• large-scale hydroelectric generation. However, in October 2017, Prosperity International of Hong Kong agreed a deal to develop a hydro power plant in Aceh with installed capacity of 1,000 MW and total estimated investment of US$3 billion.
Hong Kong is taking concerted steps to address non-conducive conditions for hydroelectricity generation.
Figure 2.4. Hydroelectricity Capacity Evolution, 2013-2017 (GW)
2013 2014 2015 2016 20170
2
4
6
8
10
12
14
16
18
20
0.00 0.00 0.00 0 0.00
3.93 3.94
5.65 6.09
3.52 3.54 3.55 3.64.31
14.6815.70
16.6217.5
16.70
4.68 4.68 4.69 4.69 4.69
Cap
acit
y (G
W)
Hong Kong Singapore Malaysia Philippines Vietnam Taiwan
Source: International Hydropower Association (IHA), 2018 Hydropower Status Report

171
role in the Philippines
The Philippines’ hydropower sector has experienced limited capacity growth in recent years, but still accounts for 18% of total installed capacity, and there are significant projects under development. The development and trajectory of the country’s power sector to 2040 is guided by the ‘Philippine
Energy Plan’ which was published in 2017. The plan outlines that the country’s installed capacity will need to increase by some 40 GW to more than 60 GW to meet increasing demand. Hydropower is expected to make up the lion’s share of this growth in renewables.
Evolution of Renewable Energy: solar power
Hong Kong• Solar energy accounts for a minuscule
proportion of the electricity supply in Hong Kong.
• In 2017, the Hong Kong Government
systems at Shek Pik Reservoir and Plover Cove Reservoir.
• The two pilot systems, each of 100 kW capacity, have been in operation since February 2017 and October 2017 respectively, and can generate some 120,000 kWh of electricity per annum.
Singapore• Grid-connected installed capacity of solar
PV systems sharply increased from 59.7 MW in 2015 to 129.8 MW by the end of Q1 2017.
• As a densely populated city state with limited space for solar deployment, Singapore is placing emphasis on building
key focus.• Singapore is also positioned as a living lab for companies to
test and commercialize innovative urban solutions• In April 2018, REC, the leading European brand for solar PV
panels launched one of Singapore’s largest rooftop solar installations feeding around 2.6 million kWh annually into Singapore’s electricity grid.
Malaysia• Malaysia, a key exporter of PV cells and modules, is well
solar power usage.• The Net Metering Scheme (NEM) introduced in 2017 is
seen as a smart move to fuel the Malaysian solar market’s ambitious aspirations.
• The country wants to roughly quadruple the current solar PV capacity by 2020, which it hopes is enough to make it the second largest producer in the world.
• With the NEM in place, consumers can generate their own electricity with one meter installed and sell excess power to the national utilities.
Philippines•
years ago had no solar industry until the country launched
• Installed solar capacity climbed from 184 MW to around 900 MW in 2017 making the Philippines one of the top markets in the world in additions.
•
the second FiT program.
Vietnam• Vietnam is experiencing growing pains when it comes to
ambitious long-term targets and ensuring cheaper and wider access to electricity for all.
• The Ministry of Industry and Trade (MoIT) of Vietnam
July 2018 and reported to the Prime Minister, the new solar power projects added to the amended National Master Power Plan VII (March 2016).
• So far, the MoIT has approved more than 70 solar projects exceeding 3,000 MW, which will be commissioned before June 2019.
Taiwan• In October 2017, Taiwan government announced a subsidy
of 40% for rooftop solar panel costs with a goal to achieve 3 gigawatts of solar power capacity in Taiwan by 2020 and to encourage this, Premier Lai Ching-te announced “The citizens’ green rooftop participation and action plan,“ for consumers to generate electricity on their roofs with the government.
Figure 2.5. Solar Power Capacity Evolution, 2013-2017 (MW)
0
200
400
600
800
1000
1200
1400
1600
1800
2000
2013 2014 2015 2016 2017
15 33 60 126 129.873
160184
297 386
1 22132
765
885
392
620
842
1210
1733
Cap
acit
y (M
W)
Hong Kong Singapore Malaysia Philippines Vietnam Taiwan
Source: BP Statistical Review of World Energy, 2018
Sout
heas
t Asia

172 A Strategic Overview of the Global Energy Markets
Strong growth observed in solar PV installations across most countries One potential enabler of more rapid solar PV uptake is the close links many economies in Southeast Asia have with China, by far the world’s largest (and lowest cost) producer of photovoltaic cells, as well as to the Malaysian market, the world’s third-largest producer. Existing free trade agreements
Vietnam’s recently revised National Power Development Plan aims for 850 MW of capacity in 2020, rising to 12 GW by 2030. In mid-2017, Vietnam introduced the FiT scheme for utility-scale projects. The country has seen a recent surge in activity, and in 2017, EVN, the state-owned utility, announced plans for 350 MW of solar PV capacity due to come online in 2021.
Evolution of Renewable Energy: wind power
Wind energy resources vary across the region, with the greatest potential thought to be in the Philippines, which has estimated technical potential of around 70 GW
Hong Kong• Hong Kong has a number of small wind
projects, which together produce less than 1 MW, the largest of which is an 800 kW wind turbine on Lamma Island operated by HK Electric Company.
Singapore• In October 2017, Singapore installed its
power 45 four-room HDB units a year.
Malaysia• The Malaysian government is looking to
harness wind energy in regions such as Kudat and Kota Marudu, where studies have determined a potential of 300 MW wind energy generation.
Philippines•
energy comprising only a fraction (1.87%) of the country’s installed capacity of 22 GW in 2016.
Vietnam• Vietnam’s wind market is still in the early stages with a total
capacity of only 197 MW.• Following the construction of a wind power plant in
South-central Vietnam, four similar projects are set to break ground in the country’s Central region and Central Highlands.
• In June 2018, The Global Wind Energy Council (GWEC)
gathering leading national and international industry players to discuss the development of the sector with government.
Taiwan•
GW of capacity and Ørsted 900 MW.• The nation aims to add 3.8 GW of capacity to its existing
network of just 8 MW.
Figure 2.6. Wind Power Capacity Evolution, 2013-2017 (MW)
Hong Kong Singapore Malaysia Philippines Vietnam Taiwan
0
100
200
300
400
500
600
700
800
Cap
acit
y (M
W)
2013 2014 2015 2016 2017
0 00 0 0 0 033
283
387
427427
614 637 647682 692
Source: BP Statistical Review of World Energy, 2018
Wind power comprises just 1.87% of total installed capacity in the Philippines; Vietnam’s wind market is also in the early stages of development with total capacity of 197 MW
A key factor in the upswing in wind power activity in the Philippines has been the introduction of the FiTs in 2013, which ensured priority grid connection and power purchases. Vietnam’s wind resources, particularly along its 3,000 km of coastline, are also notable. Technical potential is estimated at around 27 GW, only a small fraction of which has been developed so far.

173
Evolution of Renewable Energy: biogas
of waste in a day, after completion of its construction by 2024.
Hong Kong• In December 2017, Keppel Seghers Hong
Kong and Zhen Hau Engineering won a contract for a large scale integrated waste management project, to include a desalination plant, in Hong Kong. –
integrated waste management facility for municipal solid waste and will treat 3,000 tonnes a day of mixed municipal solid waste, and the waste-to-energy plant will produce energy for the grid.
Singapore• On 17 July 2017, JFE Engineering
Corporation hosted a Site Inauguration Ceremony to mark the commencement of site activities for the upcoming US$30 million Waste to Energy (WtE) Research Facility in Tuas, Singapore.
• The facility will employ JFE’s High-Temperature Slagging
December 2018.
Malaysia• Malaysia is expected to attract US$0.73 billion in investment
for biomass projects between 2017 and 2018.• In H1 2016, MIDA approved 12 biomass projects worth
US$35 million.
Philippines• The Philippines is pushing ahead with its biomass production
and has a total of 18 biomass plants (as on April 2016).• Biomass energy has a crucial role in the Philippine energy
mix, supplying energy up to 30% of the 80 million people in the country. – Biomass is usually used for household cooking by the
rural poor.
Bioenergy use is undergoing fundamental changes
Industrial agriculture, particularly of sugar and palm oil, are conducive to producing power from biomass. While this is useful as an auto-generation scheme for businesses,
otherwise produce a large amount of methane gas. In the sustainable development scenario, bioenergy use undergoes two fundamental changes. In the residential sector, its consumption falls by more than 90%, as use of solid biomass is eliminated in all but the most marginal communities. In the transport sector, its use increases more than four-fold, as biofuels are increasingly used.
Figure 2.7. Biomass Capacity Evolution, 2013-2017 (MW)
Hong Kong Singapore Malaysia Philippines Vietnam Taiwan
0
200
400
600
800
1000
1200
2013 2014 2015 2016 2017
128128
128 128 128
984
670
1028 1052 1052
119 131 221
233 224
725.5 725.5 725.5 725.5 725.5
Cap
acit
y (M
W)
Source: BP Statistical Review of World Energy, 2018
Sout
heas
t Asia

174 A Strategic Overview of the Global Energy Markets
Key Developments: renewables policies (2017) and impact on Infrastructure
Regulatory frameworks include a wide range of support instruments (e.g. market support, investment support, R&D support, awareness campaigns) to support RE policy implementation.
Hong Kong• Only about 1% of Hong Kong’s electricity is generated from
renewable sources.• To support the deployment of renewables in government
and community buildings, the Hong Kong authorities aim to increase funding from US$25 million to US$0.13 billion. – The government expects yearly electricity generation
from renewables to hit 6 million/kWh, according to PV magazine.
Singapore• Singapore has announced a plan to install photovoltaic
panels wherever it can, including at SEA.
Malaysia• According to Energy, Green Technology, Science, Climate
Change and Environment Minister Yeo Bee Yin, Malaysian government wants to grow the renewable energy industry by opening up the market to foster competition in 2018.
• (FiT) system, where private, small-scale renewable power generators can sell the electricity they produce to the grid.
Philippines• In March 2018, in a presentation to energy industry
stakeholders, the Department of Finance said it was considering removing the zero-rated, value-added tax currently in place for the renewables industry.
• Developers have raised concerns to the government
the renewables industry to provide clean, sustainable and lower-cost electricity to end-consumers.
Vietnam• After introducing FiTs for wind, solid waste, small hydro and
biomass, Vietnam established a FiT for solar PV in 2017.
Taiwan• Taiwan amended Renewable Energy Development Act
in January 2017, to create and support new markets for renewable power. – The new law opened the country’s renewable energy
sector to private renewable energy participation, and made it possible for nonutility buyers to procure T-RECs
projects or via newly enabled renewable energy retailers.
Figure 2.8. Key Developments in Renewable Policy and Impact on Infrastructure
June 2018: Government to assess if residential and commercial rooftop solar PV systems can sell surplus electricity to the grid
the construction of rooftop PV arrays and providing additional tax incentives to property developersThe city’s Environment Bureau propose generous new rooftop solar FIT
Ho
ng K
ong
Mal
aysi
aSi
ngap
ore
Taiwan created a renewable energy credit (T-REC) scheme that allows companies to procure directly from renewable energy projects2018:version of the 2018 FIT scheme and announced a 3% bonus for rooftop solarGovernment is looking for US$ 59 Billion of private capital to fund the nation’s target of reaching 20% renewables by 2025
11 April 2017: Vietnam issued a long-awaited decision approving the mechanism on the development of solar power projectsThien Tan Group to invest US$2 billion in
large-scale solar power plants by 2020Wind energy projects are also being developed, such as a 98 MW wind power plant by Super Wind Energy Cong Ly Soc Trang in Soc Trang
November 2017: The Philippines Department of Trade and Industry (DTI) nine renewable energy projects worth US$562 millionAlsons Renewable Energy and Repower Energy will build Hydropower plants while Ormoc
Taiw
anP
hilip
pin
esV
ietn
am
2017: Engie, Schneider Electric and REIDS partner for micro-grid demonstrator to address
Strong focus on Energy storage, with German based VDE Renewables invests in Storage
EMA plans to make it easier for consumers to generate their own solar power and sell excess
December 2017: The Energy Commission of Malaysia completed second Large-Scale Solar
of capacityIn 2018, Companies plan mini-hydropower (range of 500 kW to 10 MW) development in Peninsular Malaysia
1 6
5
4
2
3
Source: WEO 2018 - Capgemini Analysis
To achieve the set targets, countries in the region have made
policy frameworks and robust institutions, and have taken steps toward the liberalisation of their energy markets to encourage competition in the sector
The majority of countries have some form of renewable energy national policy
and energy regulatory structures have created dynamic and competitive energy markets and attracted renewable energy investment from the private sector. Some countries have introduced additional incentives for the use of locally manufactured products. This was the case with the Malaysian FiT that provided an additional US cent 1/kWh (MYR 0.05/kWh) for the use of locally manufactured or assembled solar PV modules and inverters (SEDA, 2017).

175
3-Infrastructures & Adequacy of SupplyDriving factors for an integrated electricity market in SEA are growing regional electricity demand, diverse distribution of supply sources,
socio-economic circumstances.• One of the main priorities for SEA
is to develop coordinated planning of generation and transmission infrastructures. Lack of such mechanisms can severely undermine
Other important steps for market integration are harmonization of technical and market standards, and a higher degree of empowerment in the regulatory area.
Progress on integration of the electricity sector has been relatively slow due to major obstacles.• The member countries vary greatly
in their size, landscape, levels of economic development, and national energy resources. They also vary considerably in power sector regulations, market structure, and technical characteristics. All of these
energy cooperation.
Electricity accounts for the largest share of the increase
incomes in the region translate into higher ownership of appliances and increasing demand for cooling from 2017 to 2040, according to Southeast Asia Outlook 2017 report.• According to the same report, Two-
thirds of the increase in Southeast Asia’s electricity demand is expected
to come from the residential and services sectors.
• Industrial electricity demand is expected to more than double, pushed higher by the lighter industrial branches that are a mainstay of the region’s economic activity.
Gas trading in the region lacks transparent hub trading.• Southeast Asia is well endowed with
natural gas resources. Pipeline and LNG facilities exist, however, market and trading do not come close to the levels commensurate with Southeast Asia’s needs.
• The geographic diversity and relatively high dependence on LNG for its gas supply, where oil linked pricing and rigid destinations clauses persist, (at least for the medium term), along with low transparency,
Energy systems interconnection to bolster energy security
Achieving national energy security remains the main driver for energy transition, in order to protect
• Governments are increasingly concerned about the ability of existing markets and regulatory frameworks to continue
of electricity.• In countries transitioning to less carbon-intensive sources of
electricity, system operators are facing multiple challenges,
from the network to compensate for their intermittency.• The penetration of renewables requires not just large-scale
grid expansion, but also additional integration measures such as storage and demand-management options.
can provoke unplanned electricity outages that disrupt operations and create losses for manufacturing industries. –
facing electrical outages.
to attract direct foreign investment and manufacturing industries to the region.
• Attracting investment will be contingent on the incentives available to investors, which may be dampened by the presence of electricity price controls or fossil-fuel consumption subsidies, or terms that are unfavorable.
Energy connectivity, particularly the interconnection of grids and gas pipelines
energy, boosting trade and providing market access to low-carbon energy. A regional cooperation framework for disseminating new technologies will also hasten the development of non-conventional gas resources, such as coal bed methane and shale gas. The trading of gas by means of cross-border pipelines can generate exports for supplier countries while diversifying the energy mix, improving local air quality and supporting decarbonization efforts in destination countries.
Sout
heas
t Asia

176 A Strategic Overview of the Global Energy Markets
• The interconnection of energy networks and markets across Southeast Asia provides a key route towards a more resilient and secure energy system. –
to increase energy interconnections could lead to more
Transmission and distribution (T&D) losses
Transmission and distribution (T&D) networks have also been expanding rapidly in Southeast Asia, increasing by around 70% since 2000 to around 3.6 million kilometers (km). This rate of expansion is twice the world average. Many parts of the network need to be modernized to reduce T&D losses. Losses vary by country, from 6% in Malaysia to 9% in Philippines and Vietnam.
Figure 3.1. Firms experiencing electrical outages (% of firms)in selected Southeast Asian countries
Electrical outages and network losses can hinder industrial productivity and development
Philippines39.9%
Malaysia18.9%
Vietnam 26.3%
Source: World Bank (2017)
Electricity Consumption Trends: the future looks electric
region translate into higher ownership of appliances and increasing demand for cooling from 2017 to 2040, according to Southeast Asia Outlook 2017 report.
• Two-thirds of the increase in Southeast Asia’s electricity demand is expected to come from the residential and services sectors.
• Industrial electricity demand is expected to more than double, pushed higher by the lighter industrial branches that are a mainstay of the region’s economic activity.
Hong Kong• The total local consumption of electricity
in 2017 decreased slightly by 0.6% when compared with 2016. – As in the past, the largest category was
commercial users, taking up 66.2% of the total local consumption while domestic users came second, consuming 26.7% of the total electricity.
Singapore• Industries accounted for 43% of total electricity
consumption in 2017, followed by commerce and services (36%), household (14%) and transport (6%).
Malaysia• Malaysia’s total electricity consumption rose by 2% from 144
-TWh in 2016 to 147-TWh in 2017.
Philippines• According to DOE (Department of Energy), electricity
consumption in the Philippines increased to 94,370 gigawatt hours (GWh) in 2017.
• The energy undersecretary, Felix William Fuentebella, saw
According to a 2018 whitepaper by Eco-Business
(K-CEP) Air-conditioning will consume 40% of electricity in SE Asia in 2040Air-conditioning systems are to consume 40% of the electricity in Southeast Asia in 2040 at the present rate of consumption. Driven by higher average temperatures and a rising middle class, it is estimated that 700 million new air-conditioning units will be installed by 2030 and another
can reduce the consumption of electricity by 100 TWh, which is equivalent to the annual production of 50 power plants
cities can only happen through the use of centralized systems providing services to entire districts, such as in Marina Bay, Singapore, which is serviced by centralized air-conditioning facilities located at a depth of 20 meters (65 feet) underground, resulting in annual savings of 79 million KW.
Figure 3.2. Electricity Consumption, 2013-2017 (TWh)
0.0
50.0
100.0
150.0
200.0
250.0
300.0
Hong Kong Singapore Malaysia Philippines Vietnam Taiwan
TWh
CAGR 2013-20172013 2014 2015 2016 2017
0.7% 2.4%
3.7%
5.7%
7.1%
1.7%
Source: BP Statistical Review of World Energy, 2018

177
Though the region has adequate energy resources to meet its large and growing demand, most resources are highly concentrated in a few countries.
• A key element of the success of energy transformation in the SEA region will be how countries capitalize on opportunities for energy connectivity and trade.
• Increased interconnection could allow Hong Kong to access potential sources of clean energy and create a more balanced generation portfolio as opposed to current dependency on fossil fuels. – In a recent study by conservation group
WWF-Hong Kong, ‘More than half’ of Hongkongers will accept 5% rise in power bills to support renewable energy, further reinforcing the need for clean energy.
• Importing electricity will allow Singapore to enhance energy security by diversifying energy mix, both in terms of fuel type as well as supply sources. – Greater interconnections with neighbouring
countries would also support the establishing of a larger regional market for electricity trading, promoting investments and ultimately enhancing regional electricity supply security.
• In September 2017, Malaysia agreed a cross-border power deal with Thailand and Laos, that will enable it to purchase up to 100 MW of hydropower from Laos. – The utility companies involved are Electricite du Laos,
Electricity Generating Authority of Thailand and Tenaga Nasional.
– Malaysia has been selling electricity to Indonesia since last year, transmitting 70 MW from Sarawak to western
• Philippines is still far from joining that integration because of its very archipelagic geographic structure.
• However, energy-resource sharing between the Philippines’ major islands will soon be realized after the approval of the US$0.96 billion grid interconnection project of the National Grid Corporation of the Philippines (NGCP).
Figure 3.3. Electricity Trade flow in SEA region
Sarawak Sabah
Philippines
SumatraIndonesia
Singapore
VietnamMyanmar
Lao PDR
Cambodia
Thailand
Expected electricity trade ow
Source: WEMO Southeast Asia 2017
Energy Cooperation: The Only Way to Prevent ‘Lights Out’ in the Region
To advance regional economic integration, SEA countries need to work together to make the best use of the potential
standards. The ASEAN Power Grid and the Trans-ASEAN Gas
energy market. There is a pressing need to harmonize legal and regulatory frameworks, as well as technical standards for power connectivity and trade has been slow. Also, a new push is needed to share electricity supplies and jointly develop solar, wind, and hydro capacity that can be exported across the region via new interconnections. So
uthe
ast A
sia

178 A Strategic Overview of the Global Energy Markets
Role of Natural Gas in SEA Energy Security: A large increase in gas
natural gas markets
growing importer.
• Natural gas demand in Southeast Asia is expected to increase at a rate of 2% per year over the period 2016-2040, a marked slowdown from the more than 6% per year over the past 25 years. – Gas demand is expected to grow from
170 bcm in 2016 to some 270 bcm in 2040.
• Most of the growth is expected to come from the industrial sector (especially the light industry branches). – Gas demand is expected to grow faster
than production in the region, and net exports will gradually diminish.
• By the mid-2020s the region will become a net importer of gas. This has important implications for infrastructure development over the next decade.
• The three regional LNG exporters, Brunei, Indonesia and Malaysia, exported 50 Mt of LNG in 2017, accounting for 17% of global LNG exports. – The regional LNG importers, Malaysia, Singapore and
Thailand, imported 7.8 Mt in 2017, up 22% over 2016.• Malaysia has two LNG terminals with a combined capacity
of 7.1 Mtpa. The country commissioned its second terminal in September 2017 in Pengerang in the southern Malaysian state of Johor. The terminal is expected to be used as an LNG hub and for trans-shipment operations.
• Singapore commissioned a land-based terminal at Jurong in 2013 with an initial capacity of 6 Mtpa, currently being expanded to 11 Mtpa.
– Singapore’s strategic location and reputation as a global trading hub for other commodities makes it a frontrunner to become Asia’s LNG trading hub.
• There is a growing interest in LNG imports in SEA with more
2019-2023 (Philippines, Vietnam) and most of the existing importers in the region are looking to expand their imports.
Prospects for greater natural gas integrationThe role of gas in meeting growing energy demand in Southeast Asia and its increasing role as an important source
As gas imports rise, better interconnections of pipeline
possibility of much improved supply security.
Figure 3.4. Natural Gas Consumption, 2013-2017 (Billion cubic metres)
CAGR 2013-20172013 2014 2015 2016 2017
Hong Kong Singapore Malaysia Philippines Vietnam Taiwan
10.0
0
20.0
30.0
40.0
Bill
ion
cub
ic m
etre
s
50.0
60.0
6.4%
5.3%
-1.0%
2.82%
0.3%
6.7%
Source: BP Statistical Review of World Energy, 2018
Southeast Asia could become the fastest growing LNG demand center in the world• In the Philippines, the government intends to replace
depleting natural gas reserves by LNG imports. – An LNG hub project has been proposed in the Batangas
province, south of Manila, initially with an FSRU to be commissioned by 2020, and later with a 5-Mtpa onshore terminal. In addition, there is one private terminal under construction in the south of Luzon Island, the Pagbilao LNG terminal.
• Vietnam wants to complement its domestic gas production with LNG imports and intends to start importing LNG at the beginning of the 2020s. – The government has plans for two LNG terminals in
southern Vietnam and expects both terminals to come
online in 2023. The terminals have planned expansions which could bring Vietnam’s import capacity to 11 Mtpa.
• The Taiwanese Government aims to have 50% of the
as part of a drive to improve air quality and reduce pollution. – Taipower, which owns one-third of the country’s existing
gas-fuelled plants in the years ahead. – The company expects to announce a shortlist of preferred
bidders for the Taiching LNG supply by the end of Q3 2018 and for the Hsieh-Ho supply by the end of Q1 2019.

179
Topic Box 3.1: Singapore is being developed as a gas hub
• According to World Energy Outlook report 2017, Hub-based trading has become a feature of gas markets in North America, the United Kingdom and increasingly in Europe.
• These hubs provide a focus for physical gas trading, leading to more accurate price discovery through publicly available price reporting, backed by robust governance and regulation.
• These indices allow more advanced trading forms such as swaps, derivatives and futures, enabling risk to be better managed (for example, by allowing producers to lock in certain price levels, thus facilitating production investment, or buyers to purchase gas for a set time period and price).
• Disruptions to supply and demand can be met by rapid adjustments, thus enhancing security of supply
• Government price controls and other types of regulatory interventions must be absent, except those facilitating hub trading, notably rules enforcing access to infrastructure, so-called open access.
• Gas trading in the SEA region lacks this style of transparent hub trading.
– The region’s geographic diversity and relatively high dependence on LNG for gas supply, where oil-linked pricing and rigid destinations clauses persist, (at least for the medium term) and transparency is low,
– Nonetheless, several centers are being advanced as a basis for hub-based trading in the region, including Singapore.
• Singapore has made important moves towards liberalizing its gas market, providing the basis for more competitive price setting.
• These moves include creating a well-functioning domestic market for gas and greater transparency. – A spot market for local use of gas is being created,
including secondary markets for gas consumers, and third-party access to facilities such as gas storage is also under development.
– These moves put Singapore ahead of most countries in the region in terms of progress towards conditions that might enable a hub-style market to develop.
Operating and major planned LNG import terminals in Southeast Asia
Country Project Location Status Sponsors Start-up date Type Capacity (Mtpa)
Storage (Mtpa)
Malaysia Melaka Sungai Udang Port, Melaka
Operating Petronas 2013 3.8 260
Pengerang LNG Pengerang, Johor Operating Pengerang LNG 2017 Onshore 3.5 400
Philippines Pagbilao LNG Pagbilao, Quezon Under Construction
Energy World Corp.
2018 FSRU 3 130
Batangas LNG terminal (PNOC LNG hub)
Batangas, Luzon Planned Tbd 2020 FSRU 5
Singapore Jurong Jurong Island Operating SLNG 2013 Onshore 6 540
Jurong (expansion)
Jurong Island Under Construction
SLNG 2018 Onshore 5 260
Vietnam Son My LNG Son My, Binh Thuan Potential PetroVietnam Gas
2023 Onshore 1.8
Son My LNG (expansion)
Son My, Binh Thuan Speculative PetroVietnam
Gas
Onshore 7.2
Thi Vai LNG Thi Vai, Ba Ria-Vung Potential PetroVietnam
Gas
2023 Onshore 1 180
Thi Vai LNG (expansion)
Thi Vai, Ba Ria-Vung Speculative PetroVietnam
Gas
Onshore 1
Source: New And Emerging LNG Markets: The Demand Shock (IFRI)-June 2018
Sout
heas
t Asia

180 A Strategic Overview of the Global Energy Markets
Topic Box 3.2: Issues and Challenges for Regional Power Cooperation
Concerns Issues & Challenges Possible solutions
Licensing of cross-border players
licensing regime which may not allow foreign players to participate in cross border power trading/exchange
Non-discriminatory licensing systems that permit cross-border trade can help realize the neighboring or translational (via the third country) electricity power cooperation
between member states
cross-border power trade/exchange will not be commercially feasible
Utilities have to consult the respective authorities from time to time.
Complexity of entry and labor laws
Complex entry may hamper cross-border trades; the local employment laws may cause inconvenience to foreign experts
Utilities should assist their counterparts where possible, in tackling entry formalities
Information publication and
electricity industry
Some state-level electricity power information should be made known to the public to facilitate electricity power cooperation. But a few interconnection agreements or bilateral agreements between electricity departments are
disclosure is forbidden
Common information is to be exchanged via an information center (eg. existing forum and internet). Countries should jointly draft common clauses for non-disclosure of commercial elements
Double Taxation Agreement (DTA) among Southeast Asian nations
Without DTA, electricity power cooperation will be hampered by dual taxation. Although, to date, most countries have signed DTA
All Southeast Asian countries should establish DTA and other bilateral agreements between governments
Limitations of corporate tax, customs
power import and export
Currently most countries have no clear regulations or taxation of cross-border trade of electricity power, limitations on electricity import and export etc. and such vague taxation policies increase the business risk of trading
All nations should consider establishing clear policies for
trade limitations of all member states will consolidate the equality of electricity import and export
Expropriation For all cross-border investment, there is always a risk of expropriation
Agreements entered should contain provision to prohibit expropriation or limit any right to expropriate. If expropriation occurs, compensation should be made in accordance with international laws and standards. Events leading to expropriations should be made known in advance to investors
Source: ASEAN Power Cooperation Report (July 2017)

181
4-Supply & Final Customer
The surge in electricity demand is being driven by growing income levels, leading to higher ownership of appliances and a growing demand for cooling, adding to the need for a resilient power system.• Retail competition is being
introduced in Singapore and the Philippines.
• Malaysia continues to phase out subsidies, most recently for gasoline and diesel, while working towards doing same for electricity as well.
• Philippines’ power rates remain one of the highest in Southeast Asia as of end-2016 due to continued lack
of government subsidies, and the country’s dependence on expensive imported diesel, oil and coal.
and Petroleum Price Stabilization Fund continue to be implicit rather
As new players enter a deregulated market, companies are compelled to push for operational and
• Hong Kong is driving energy
non-residential consumers with low energy consumption.
• Taiwan’s current energy policy is developing clean energy and increasing the share of low carbon energy in electricity generation systems is expected to reach 20% for renewables, 30% for coal, and 50% for gas in 2025.
The prevailing scenario
• According to “Power Development Plan 2017 to 2040” by the Department of Energy (DOE), Philippines power rates are among the highest in the region, on a par with the level in Singapore (2017).
• The government of Malaysia has approved for the
Malaysia to be maintained for the period of 1 January 2018 until 31 December 2020. Malaysia has been using the same
Hong Kong remains very competitive compared to those in other major metropolitan cities such as Singapore, London, New York and Sydney.
regulation/de-regulation create high variances across countries
The surge in electricity demand is being driven by growing income levels, leading to higher ownership of appliances and a growing demand for cooling, adding to the need for a resilient power system.
• Electricity supply market structure
– De-regulated wholesale power markets without fuel subsidies.
– Single-buyer wholesale market with high fuel subsidies.
• Retail competition is being introduced in Singapore and the Philippines. – Singapore and the Philippines have the
• The context is made of government-
– Rising energy demand has made fossil-fuel subsidy reform a key issue for many governments, despite the associated
• Malaysia continues to phase out subsidies, most recently for gasoline and diesel, while working towards doing so for electricity as well. – Domestic consumers in Peninsular Malaysia enjoy the
– Prices are now set monthly based on movements in international markets, while residential LPG remains subsidized.
• VietnamStabilization Fund continue to be implicit rather than direct
Figure 4.1. Average retail electricity prices
0
2
4
6
8
10
12
14
16
18
USc
/kW
h
Hong Kong Singapore Malaysia Philippines Vietnam Taiwan
10.89
8.88
14.65
7.578.73
14.72
11.10
8.88
11.10
-2.5%15.10
+ 1.9%
0.0%
-24.3%
7 57
+ 0.4%
+ 6.2%
9.27
Note:1. USc/kWh excluding VAT but including all other applicable taxes and charges2. Data for January 2017
2016 2017 Year on Year (2016-2017)
7.60
Source: Capgemini Analysis, WEMO 2018
Sout
heas
t Asia

182 A Strategic Overview of the Global Energy Markets
Price Evolution, Privatization and its impact on end users’ buying behavior
As new players enter a deregulated market and companies are compelled to push for operational
Concerns Key Initiatives
Hong Kongnon-residential consumers with low energy
and on-peak charges
• Scheme of Control Agreement (SCA) between CLP Power and the Hong Kong SAR Government will launch a number of new initiatives to encourage the community to embrace low-carbon lifestyles by promoting the development of renewable energy (RE) and energy conservation
•
Energy Saving Fund will be introduced
Singapore Direct wholesale supply or through market service licensee (MSSL) for eligible consumers
• increasing by an average of 6.9% or 1.50 cents per kWh compared to the previous quarter
• per kWh
Malaysia Rebate for consumers with less than RM20 per month electricity bills, including subsidies to help lower income groups
• TNB announced to Bursa Malaysia that companies will have to pay more for their power supply from July 1 to December 2018 following the implementation of a surcharge of 1.35 Sen per kWh due to higher fuel and generation costs
• Government has implemented a number of initiatives by the Energy Commission, e.g. incentive based regulation framework (IBR), PPA renegotiation and New Enhancement Dispatch Agreement (NEDA)
Philippines The Electric Power Industry Reform Act (EPIRA) of 2001 encourages private player competition
• energy storage system is designed to end power reliability issues for a Philippines community (Paluan)
• In 2016, a total of 781 renewable energy service contracts were awarded with 15,910 MW potential capacity and 4.1 MW installed capacity
Vietnam Direct subsidies resulting in high regulation, with Electricity Purchase and Trading Corporation (EPTC) reselling the generated electricity
• in Ho Chi Minh City, giving a platform for companies to connect and
Taiwan Amendment to Electricity Act allows restructuring of state-owned Taipower and green
• Electricity sector in Taiwan is regulated by its state-owned electricity power utility company Taiwan Power Company (Taipower)
• Taiwan’s current energy policy is developing clean energy and increasing the share of low carbon energy in electricity generation systems systems is expected to reach 20% for renewables, 30% for coal, and 50% for gas in 2025

183
Topic Box 4.1: Case studies Singapore, Philippines & Vietnam
• Open Electricity Market in Singapore: As of 1st April 2018, households and businesses in Jurong will have the option to purchase electricity from a retailer. This reduces the reliance on SP group (SP Services) for electricity, where cost is based on a regulated
• In Singapore, the 2016 annual
from 21.7 cents per kWh in 2015 to 18.9 cents per kWh in 2016. This was mainly due to lower energy costs, which fell by about three cents from 16.3 cents per kWh in 2015 to 13.3 cents per kWh in 2016, as a result of lower gas prices.
• Since 2001, the Government has progressively opened up the electricity market to competition to promote more competitive pricing as well as give consumers more choice. From July 1 to Sept
of 1.5 cents per kilowatt hour (kwh) compared with the previous quarter. The increase is mainly due to the higher cost of natural gas for electricity generation.
The demand for electricity is projected to expand rapidly in most countries.
Figure 4.2. Singapore: Import & Export of energy products (2015-2016)
29%
66%
5%
99%
0% 0%
1%0%
2015Import: 172.8 MtoeExport: 91.99 Mtoe
2016Import: 176.3 MtoeExport: 99.31 Mtoe
30%
64%
6%
0% 0%
1%
99%
0%Export
Import
Crude oilPetroleum productsNatural gasCoal & peatOther energy products
Source: Singapore Energy Statistics, 2017
Power prices in the Philippines remained among the highest in Southeast Asia at Q4 2016 due to continued lack of government subsidies and the country’s dependence on expensive imported diesel, oil and coal.
The main reason for high prices is inadequate government subsidies. In addition, taxes, fees and other charges are also levied on the power industry sectors at generation, transmission and distribution levels.
• In Philippines, the cost of electricity generated from solar and wind has plunged in recent years, and prices are likely to fall by 50% by 2020 compared to 2017.
• The Philippines government privatized the country’s power industry in 2001, saying the move would help bring more
• Consumers have faced higher electricity bills since June 2018, after the energy regulator approved a hike in the feed-
payments to renewable energy (RE) developers. – The Energy Regulatory Commission (ERC) approved a new
FiT-All rate of 25.63 centavos per kilowatt hour (kWh), higher than the current 18.30 centavos per kWh.
• Singapore’s imports of energy products grew by 2.0% from 172.8 Mtoe in 2015 to 176.3 Mtoe in 2016. The exports of energy products registered an 8.0% increase, growing from 92.0 Mtoe in 2015 to 99.3 Mtoe in 2016. The bulk of energy imports and exports were petroleum products.
• Imports of NG increased by 2.4% from 9.5 Mtoe in 2015
accounting for 23.4% of these imports.• End-users’ consumption of NG declined 2.6% from
59,096.1 TJ in 2015 to 54,639.3 TJ in 2016, due to weaker demand from industry. In 2016, industry-related consumption of NG was 47,133.7 TJ, 4.2% lower than the previous year.
Sout
heas
t Asia

184 A Strategic Overview of the Global Energy Markets
Vietnam’s electricity market is dominated by Vietnam Electricity (EVN). The latter (via its subsidiaries) acts a single buyer of all electricity generated from on-grid independent power projects.Private companies, including foreign-invested ones, are only independent power producers that sell their generated power to EVN’s wholesaling subsidiaries.
To create a more competitive electricity market, the government aims to divide EVN-owned power plants and generation companies to become independent generators, wholesalers and retailers (except for power plants of economic, security or defense importance).
• In July 2012, only 31 generators directly
rose to 80. This is the most noticeable evidence of operating
policies in the region’s electricity market.
Energy Development Scenario
demand, the decrease of 5% of CO2 emissions in 2020 and then 15% in 2030 compared to the BAU scenario. Total cumulative CO2 emissions in the period 2016-2035 will decrease by 956 million tons.
• Among primary energy types, coal and oil consumption falls by 204.7 MTOE and 51.6 MTOE respectively while RE and natural gas use increases by 17.1 MTOE and 13.5 MTOE respectively.
• Regarding the primary energy mix per fuel type, coal still covers the major part but tends to be stable in the following years of the planning period at the proportion of 37.3% in 2025 and 38.4% in 2035.
• With the proposed scenario, the share of RE in the total primary energy supply could reach 28% in 2030, and then increase to 30.1% in 2035.
Topic Box 4.2: Singapore to launch Full Electricity Retail Contestability for competitive pricing in 2018
• Until April 2018, only business consumers with an average monthly consumption of at least 2,000 kWh were eligible to choose their electricity provider.
• In April 2018, Singapore carried out a soft launch of its Open Electricity Market in Jurong district, allowing households and small businesses to choose their electricity provider, and opening up a vibrant market
A total of 108,000 residential accounts and 9,500 business accounts were able to exercise this choice of electricity provider.
• The Open Electricity Market will be extended to the rest of Singapore from Q4 2018, allowing the remaining 1.3 million accounts (mainly households) to choose their
• Some salient features of the Singapore Open Electricity Market are: – Customized solutions to help customers easily switch
electricity providers. – An option for single consolidated bills for all utilities. – Seamless customer switching (next working day for
AMI1 metered customers). – Allow customers to adopt greener, sustainable
energy practices. –
reliable operations. – More pricing options for customers to enjoy greater
savings.
consumers, the Energy Market Authority (EMA) in Singapore exposed the retail electricity market to competition (since 2001).
1 Advanced Metering Infrastructure (AMI) meters, also known as smart meters, remove the need for manual reading and estimates of consumption.
Figure 4.3. Vietnam: Primary Energy Supply (Baseline vs. Proposed Scenario) (million tons oil equivalent)
24.61 35.4751.02 65.65
83.579.55
10.6615.78
23.0224.36
19.5422.11
29.79
37.96
44.27
4.83
18.81
19.89
20.23
20.57
0.14
0.03
0.04
0.04
0.06
11.93
17.69
20.32
29.03
45.08
0
50
100
150
200
250
Mill
ion
To
ns
Oil
Equ
ival
ent
Bas
elin
e Sc
enar
io
Pro
po
sed
Sce
nar
io
2015 2020 2025 2030 2035
Coal Gas Oil Hydro power Electricity RE
Source: Vietnam Energy Outlook Report, 2017Baseline scenario (BAU): Baseline economic growth Proposed scenario: Adjusting the energy demand based on assessments of economic energy saving in various economic sectors and the target of CO2 emission reduction of 15% in 2030 compared to the BAU scenario

185
5-New Business Models & Services
The market for digitalization in the energy sector is set to grow to US$64 billion by 2025, according to BNEF.
• centering on digital technologies and strategic uses of data, the sector is set for a paradigm shift from its current focus on hardware to the growing importance of software.
• Digital technologies like big data, analytics and machine learning, blockchain, distributed energy resource (DER) management and cloud computing can help overcome some of the energy sector’s key challenges.
Operations costs that comprise the major portion of buildings’ life cycles can be brought under control by adopting smart solutions such as building automation systems (BAS), integrated facility management
lighting systems.
• On average, commercial buildings use about 29% of their energy for lighting, 40% for HVAC purposes, and 31% for other uses such as equipment and cooking.
Blockchain technology is paving the way towards conceptual models for faster adoption of renewable energy.
• Blockchain is used in distributed energy, mainly rooftop solar, where peer-to-peer energy markets are forming and enabling consumers
to purchase energy, such as solar or wind, from a supplier.
• Blockchain can help with billing and payments for charging electric vehicles.
• registries, because some of the limitations around them dealing with
to verify.
Spending on technologies to enable smart cities programmes
reach US$28.3 billion in 2018, according to IDC.
• visual surveillance systems are already seeing a big push from governments
make communities more secure.• Together, these two use cases
represent more than 36% of overall spending throughout the forecast period (2018).
Innovation at the edge of the grid has outpaced internal innovation in the utility sector, creating disruption, while opening up opportunities for digital sector transformation. From a technology standpoint, digital grid transformation is fueled by the confluence and advancement of several classes of technology:
• IT — Big data, blockchain, API economy and meter data management. • Operational technology (OT) — Phasor measurement units and intelligent electronic devices.• Emerging energy technologies — Energy storage and combined heat and power.• Consumer technologies — Consumer energy management systems and electric vehicles.
Sout
heas
t Asia

186 A Strategic Overview of the Global Energy Markets
of energy are set to rise
According to Bloomberg New Energy Finance, the estimated global annual revenue from the digitalization of energy could be worth US$54 billion. In the future, that could increase by almost 19% to US$64 billion by 2025. Already, sales growth in the home energy management market reached US$22 billion in 2017 and is predicted to rise up to US$36 billion in 2025.
Digital technologies are set to take energy systems by storm – making them even more
intelligence and blockchain technology are starting to make their mark in the energy sector.
• A digitalized energy system will help countries address many challenges related to power generation: – Countries like Taiwan and the
Philippines often face power outage issues and skyrocketing utility bills due
• New technologies like machine learning, blockchain and cloud computing can be used to design a power system to better enhance demand response.
• A digital energy system will also help with balancing system reserves and tapping into power from self-generators such as owners of rooftop solar systems.
• A fully digital energy system can also help in forecasting and optimizing energy production. – For example, by forecasting wind and
solar output, hybrid systems can be better managed in terms of balancing the use of fossil fuel assets to ensure a smooth and uninterrupted supply of electricity
– This will also help with the integration of renewable energy into current power generation systems.
• Using blockchain technology, a peer-to-peer energy market can be created where electricity can be bought and sold at cheaper rates. – Even owners of home energy production systems like
rooftop solar and home wind turbines can participate in such a market by selling back the excess electricity generated into the local grid.
• As Southeast Asia marches towards a digital future, there will be added pressure on utilities providers to modernize their systems. –
companies but also consumers, who will enjoy savings in the long run.
Figure 5.1. Current State Of Digitalization Of The Energy Value Chain
Gene T n n bu n U e P u e
Early Stage Advanced Early Stage Pilot Projects Pilot Projects
Modernizing Power Plants, Automating
grid controls
Advanced algorithms for optimized
operations
Full Automation for grid stability optimization
Fast acting aggregated demand response
Virtual Power plants, aggregated balancing
Current State
Next Step
Maintain grid stability and reliability
Give the consumer more control Manage distributed, behind-the-meter generation
Generate revenue for technology Providers and cost savings for technology users
Optimize and forecast for energy production
Source: Bloomberg New Energy Finance, 2017

187
Blockchain’s potential in solving Southeast Asia’s Energy Challenges
Achieving national energy security remains the main driver for energy transition, in order to protect
• Energy experts in Southeast Asia have started to view the technology as an answer to the region’s escalating energy challenges.
• One of the most popular uses of blockchain in the energy sector is in powering a peer-to-peer energy market. – It is also used in managing localized demand response in a
• Also, blockchain enables the sale of electricity through location-based pricing, which could result in driving down customer electricity costs as they can purchase directly from the supplier and avoid heavy grid costs.
• In Hong Kong, New Energy Exchange Limited announced the formation of a strategic partnership with Elastos Foundation to jointly develop a clean energy blockchain project.
• In 2018, Singapore Power launched its blockchain marketplace platform that is promoting the transaction of
of energy generated by renewable sources – The unique attributes of blockchain provide much higher
levels of cybersecurity, increasing the transparency and integrity of the transaction.
• Energo Labs, a cleantech start-up that integrates blockchain into the energy sector in Asia and beyond, is set to strengthen its presence in Singapore: – The Energo regional hub in Singapore will host events that
promote discussion about smart cities and smart energy trading using blockchain technology.
– Energo is also in talks with local authorities and partners on launching peer-to-peer and electric vehicle smart charging pilot projects.
Blockchain could be the missing link in the renewable energy revolution
In the transition to a new energy world - decentralised, digitised and decarbonised - several use case applications have already been developed using blockchain technology, such as automated bill payments, electric vehicles charging and sharing, and renewable cryptocurrencies. In the future, blockchain technology could allow millions of energy devices such as water heaters, electric vehicles, batteries and solar PV installations to transact with each other at the electricity power distribution edge. The United Nations Framework Convention on Climate Change (UNFCCC) recently recognised the potential of blockchain to boost climate action.
Figure 5.2. Blockchain can coordinate traditionally centralized data flows throughout the power system
Secure power generation and supply data transcribed to blockchains allow for visibility, security and accuracy
Renewable energy credits based on actual production are semi-autonomously awarded and traded
Wholesale power is traded via smart contracts that minimize the need for brokers and indexing agencies
Blockchain-enabled sensors and controls allow for secure, centralized data and improved grid resilience
Real time customer-utility interactions
energy use and streamlined account management
Peer-to-peer microgrids run autonomously, with
and instant payments
Electric vehicles seamlessly connect with infrastructure executing transactions through ‘smart wallets’
Smart home appliances coordinate electricity purchase and use with the grid, promoting grid
Transmission and Distribution End UserGeneration
1234 123456 12345
Source: Mckinsey Company website, 2018
Sout
heas
t Asia

188 A Strategic Overview of the Global Energy Markets
Blockchain technology can help SEA to leapfrog in the development of its energy sectors
• At the end of 2017, Malyasian Prime Minister Najib Razak announced the formation of a national regulatory sandbox, which allows innovative technologies to be tested in a live environment without regulatory constraints. – SEDA (Sustainable Energy Development Authority
Malaysia) has submitted an application to test a peer-to-peer energy platform.
– This will allow solar producers to sell their excess electricity to consumers at an even lower rate than what the distribution system operator is willing to buy.
• The Philippine government believes that some 17% of the country has limited or no access to electricity and some believe that blockchain can provide a solution. – Energo Labs is combining blockchain technology with
microgrids to decentralize energy production and
grid resilience. – Energo Labs uses microgrids with a storage system so that
energy producers, such as those with solar panels, can sell energy to their neighbors.
– Blockchain technology is used to eliminate the need for a third party to carry out energy transactions while ensuring all data is still secure and transparent.
• In January 2018, Bamboo Capital JSC (Vietnam based) signed a memorandum of understanding with New Era Energy Ltd. to pilot carbon credit protocol on the blockchain: –
measuring the clean energy footprint that aims to take the carbon trading market to the masses.
• Taiwan has vowed to become the global blockchain development hub at the 2018 Asia Blockchain Summit held in
– On December 29, 2017, Taiwan’s legislature passed the Financial Technology Experimentation and Innovation Act,
– Taiwan tech startups have launched a variety of innovative blockchain-based solutions, including those for agriculture produce traceability systems, hotel management systems, and green power generation and storage.
Smart cities: key investments will be in intelligent transportation, data-driven public safety, and resilient energy and infrastructure
Spending on technologies to enable smart cities programmes in APAC, is set to reach US$28.3 billion in 2018, according to IDC.
surveillance systems are already seeing a big push from governments: – These two use cases represent
more than 36% of overall spending throughout the forecast period (2018).
• Smart cities can help to overcome the strain on urban resources brought upon by rapid urbanization, an aging population, and a changing energy climate.
• The Smart City Blueprint for Hong Kong, released in December 2017 by the Government, proposed measures to promote the development of Hong Kong into a smart city. – Recommendations cover six areas:
smart mobility, smart living, smart environment, smart people, smart government and smart economy.
– Many smart city-related tests will take place in Kowloon East, a core business district and area designated for trialing innovations.
Figure 5.3. The Five Pillars of Smart City Development
SmartGovernance
Transparency & open dataPolicy makingUse of ICT &e-government
SmartEnvironment
Renewable energySanitationWaterWastewatermanagementGreen Buildings
Smart IT &Communications
Cloud computing & analyticsSecurity & surveillance Disaster management
Smart mobility
Mixed-model accessElectric & hybrid transport
Smart Health
Electronic health& mobile health systemsRemote patient monitoring
Source: The Asean Post, 2017

189
Formation of Asean Smart City Network (ASCN) to boost adoption
• To successfully realize the Asean integration ideal, individual country programmes need to be linked, and best practices and successes shared.
• It makes the Asean Smart City Network (ASCN) - which includes regional capitals like Kuala Lumpur, Hanoi, Bangkok, Manila, Jakarta and Singapore, but also smaller cities like Johor Baru and Phuket an important development.
• Besides this, The ASCN will also link member cities with private investment and secure funding from multilateral funding institutions.
• Few areas of focus for ASCN will be smart mobility, particularly around electric vehicles and ride and car sharing along with connectivity of payments and trade digitization.
• The ASCN will also help attract investment from regions outside the Asean region; for instance, in March 2018, the Australian government pledged US$21 million) into Asean smart cities. – Smart technologies that can make city transportation,
urban energy usage, building and waste management
therefore cleaner and more sustainable) will help alleviate the challenges that accompany the rapid expansion of towns and cities across Asia.
– ASCN is an excellent start for governments, regulators, city planners and corporates to be on right side of innovation equation and sharing of best practices.
• Singapore has implemented a Smart Nation initiative for innovation in health and living, mobility and services to meet its priorities for sustainable development.
• Meanwhile, these initiatives have to be implemented in a pragmatic way, such as Singapore’s drive for smart mobility solutions, which have attracted Robert Bosch as its technology partner. –
is accessible to all users. –
congestion in Southeast Asia as one problem it could help solve.
• In Malaysia, Kuala Lumpur signed an agreement in January
management, town planning and incident response.• In the Philippines, the New Clark City development is
envisioned as an alternative to the congested capital Manila.
Hong Kong’s ambition to become a world-class
years to boost ‘smart city’ innovation in Hong Kong . These initiatives came amid long-standing criticism that the city lacked resources dedicated to technology and innovation. Lam has also introduced some features of the proposed smart city blueprint, that include creating an “e-ID” for every Hongkonger to facilitate online transactions, and installing multifunctional smart lamp posts to collect real-time data to
Sout
heas
t Asia

190 A Strategic Overview of the Global Energy Markets
Electrify.sg, makes it easy for businesses to choose clean energy
• Based on a consumer’s power consumption habits
party energy retailers. –
deciding on the most suitable option. –
• Eligible consumers currently have three options to buy power, through customized plans with energy retailers, at the variable wholesale market price for
• Before Electrify.sg, companies that wanted to buy
extensive online searches and make telephone calls for quotes to assess their options.
– By contrast, it only takes four steps to search, compare
• Electrify.sg has also launched PowerQuotes, a function
transport and telecommunications providers.• Founders of Electrify.sg also have long term plans
to expand in Vietnam, Thailand and Philippines, countries that are opening up their energy markets, as well as big energy markets such as Australia and the United Kingdom, in the coming years.
How does Electrify.sg work?
Source: www.electrify.sg
Step 1: TELL US WHO YOU AREThe user enters some basic information, such as who they are currently buying electricity from, their consumption and when their contract ends. Then they click on GET QUOTES NOW.
Step 2: CREATE AN ACCOUNTThe user creates a unique ELECTRIFY.SG account or logs in with a Google account. Secure authentica-tion through an SMS OTP provides extra security.
Step 3: CHOOSE YOUR PERFECT PLANThe user chooses their preferred electricity package. The packages have been dynamically generated by Fibonacci, the dynamic pricing engine, based on the user’s consumption
Step 4: SIMPLE PAYMENT AND AGREEMENTAfter the user has made their choice, they pay online and upload an image of NRIC (National Registration Identity Card) and other documents as required.
According to the year-old company, it has helped Singapore’s businesses save upwards of US$554,000 in electricity bills since it began operations. It has transacted US$3.79 million worth of electricity since it began its operation.

191
In H2 2018, the startup plans to replace its current model with one powered by Blockchain. Residential or business consumers can transact with energy retailers via a peer-to-
money. This will remove the need for middleman fees and reduce transaction cost. The Blockchain model is expected
to pare down costs for Electrify and its consumers. The use of “smart contracts” – digital contracts in the Blockchain
settlements. These can account for as much as 30% of the retail cost of electricity in traditional transactions.
ELECTRIFY’s new Marketplace 2.0
CONSUMER
Selects energyprovider
Smart Contractsentered into the
blockchain
Electricity retailSmart Contracts
List products
Listing deposits in ELEC
SYNERGY P2PSmart Contracts
ENERGY PROVIDERS
ELECTRICITYRETAILERS
SMALL-SCALEENERGY PRODUCERS
ELECTRIFYMARKETPLACE 2.0
Source: www.electrify.sg
• The ELECTRIFY ecosystem will operate as the consumer-facing, ELECTRIFY Marketplace 2.0, driven by smart -contracts and a peer-to-peer energy trading platform, Synergy.
• Synergy allows consumers to buy power directly from small-scale producers, such as residential rooftop solar and wind turbines.
• Synergy removes the middleman, and reduces energy costs for all consumers. So
uthe
ast A
sia

192 A Strategic Overview of the Global Energy Markets
for building energy management systems in Southeast Asia
The market for building energy management systems (BEMS) in Southeast Asia is set to grow at a CAGR of 12.2% from 2015 to 2020.
• IT solutions such as big data analytics, cloud computing and the Internet of Things (IoT) are enabling the development of BEMS that
energy performance.• These systems have large potential for
commercial and industrial buildings as they can also support remote
system optimization. – Singapore is leading in market
revenues, as its upgraded service
for energy management provide huge opportunities for development of BEMS.
Obstacles to smart building development • The slow pace of local government in Hong Kong in
implementing regulations and incentives particularly in the
smart building development.
buildings greener.
IOT push is on Smart Buildings• In September 2016, Singapore used Internet of
Things to create ‘smart buildings’, with 30 buildings becoming connected in a two year project to track energy consumption. – The country’s Building Construction Authority (BCA)
partnered with Microsoft for this project that will monitor cooling systems using machine learning and predict deviations that may result in energy waste, alerting managers via SMS or email to take action in advance.
Data challenges in implementation of smart buildings• While Asian government agencies have started to certify
their buildings with international standards such as the
in Energy and Environmental Design (LEED) or Singapore’s Green Mark 2015, more data is needed on indicators such as
• Better data management will allow agencies to create a
Operations costs that comprise the major portion of the building life cycle can be brought under control by adopting smart solutions such as building automation systems (BAS),
lighting systems. On average, commercial buildings use about 29% energy for lighting, 40% for HVAC purposes, and 31% for other uses such as equipment and cooking.
Figure 5.4. Smart Building Technology Market
1960sIsolated Building
Controls
1980s Stand-alone Building
management systems
2000sIntegrated buildings
portfolio
Robotics & Virtuality
OngoingInternet of Buildings
Evolution of Smart Building Market (APAC), 1960–2025
Typical Building Costs Over a 30-year Life Cycle
Construction 11%
Alterations 25%
Operations 50%
Others 14%
Source: Frost & Sullivan, 2017

193
Topic Box 5.2: Innovation at the edge of the grid drives utility sector transformation and requires digitally enabled delivery infrastructure• According to Gartner (2018), Digital business technology
platforms and edge computing are technologies with transformational impact that are expected to mature between 2020-2023, driven primarily by adoption and development outside the utility sector.
–mature and are also transformational for utilities as an asset-intensive industry.
– In addition to these technologies that have broad appeal across multiple industry sectors, two vertical technologies — advanced metering infrastructure and energy storage (grid scale) — will have a transformational impact on utilities.
– They address pressing industry needs for better visibility in customer consumption, as well as increased penetration of intermittent renewable sources.
• Technology:known as “strong AI” and “general-purpose machine intelligence” — would handle a very broad range of use cases, if it existed. Current AI technologies do not deliver AGI. Despite appearing to have human-like powers of learning, reasoning and adapting, they lack commonsense, intelligence, and extensive means of self-maintenance and reproduction.
• Way- forward: AGI is unlikely to emerge in the next 10 years, although research will continue. When it
combination of many special-purpose AI technologies.
the economic, social and political implications will be disruptive — and probably not all positive. There are currently no vendors of systems that exhibit AGI, but many companies are engaged in basic research. Examples are DeepMind (owned by Google), OpenAI and Vicarious.
Vehicle-to-grid (V2G)• V2G is a system that enables plug-in hybrid electric
vehicles (PHEVs) and/or electric vehicles (EVs) to communicate with energy providers (of both energy commodity and network services) to control energy
to the grid. V2G allows EVs and PHEVs to be treated by utility companies as distributed energy resources to balance loads.
• V2G remains in the conceptual stage and hasn’t progressed beyond the development of theoretical models and prototypes. However, utilities should continue tracking
impact on several critical areas resulting from energy
technology consumerization and the increased percentage of renewable distributed energy generation, the growth in consumer PV and energy storage solutions and EV sales.
• Business Impact: V2G can impact on several utility areas, including commodity management (demand response) and network operations (issues with the intermittency of renewable sources). While V2G is expected to have several applications, the most economical entry for this green innovation is the market for ancillary services.
Wireless Electric Vehicle Charging• Wireless electric vehicle (EV) charging is based
on inductive charging that uses the electromagnetic
Induction chargers typically use an induction coil to create an alternating EMF from within a charging base station. A second induction coil in the vehicle takes power from the EMF and converts it back into an electrical current to charge the battery. Technology could potentially enable dynamic charging for vehicles as they drive down the road.
• The technology remains in its infancy, and can only transfer small amounts of power over very short distances. It is based on an application of magnetic induction, which uses
current that transfers electricity from an energy source to a battery.
• mechanics to drive ongoing consumer engagement in energy conservation. Although typical strategies include contests and rewards for conserving energy; social media elements, such as communities; and indicators of status and success, including badges and leader boards,
designed to encourage ongoing interaction. It can be part of data and analytics for an energy management system, or a stand-alone program or application.
• By 2015,
by utilities. The largest energy savings were achieved by winners of utility sponsored contests (upward of 50%).
• However, results indicate that average savings among participants can fall in the 3% to 6% range. In 2016, the ACEEE continued to study results and found that games can reduce energy consumption by as much as 6.6%. However, it is not clear if energy savings persist after the game ends.
takeup is relatively low.
Sout
heas
t Asia

194 A Strategic Overview of the Global Energy Markets
Figure 5.5. Priority Matrix for Digital Grid Transformation Technologies, 2018
Transformational
High
Moderate
Low
API Economy
Less than 2 years 2 to 5 years
Years to mainstream adoption
5 to 10 years More than 10 years
Advanced Metering Digital Business Technology PlatformEdge ComputingEnergy Storage (Grid Scale)
Big Data Digital TwinDistributed GenerationElectric VehiclesInternet of Things in UtilitiesTransactive EnergyVirtual Assistants in Utilities
Advanced Distribution Management SystemsBlockchain In UtilitiesCombined Heat And PowerConsumer Energy StorageDemand- Response Management SystemsDistributed Energy Resource Management SystemEnergy Sharing Platform Industrial Operational IntelligenceIn-process HTAP LPWAMeter Data AnalyticsMicrogridsPhasor Measurement Units
Advanced Distribution Protection and Restoration DevicesCIM Integration StandardsConsumer Smart Appliances RF Networks for Utility Field ApplicationsSubstation intelligent Electronic Devices
Customer GatewaysElectric Vehicle Charging InfrastructureHome Energy Management
Drones (Commercial UAVs) in UtilitiesIT/OT Alignment IT/OT IntegrationMeter Data Management
Source: Gartner (Hype Cycle for Digital Grid Transformation Technologies, 2018)

195
6-Financials
Southeast Asia to spend US$500 billion on
2022) with over 32,700 active projects in the pipeline.• Indonesia leads in project activity with almost 30% of
the region’s total investment value, followed by the Philippines and Vietnam.
CLP Holdings and HK Electric Investments are projected to be able to pay investors dividend yields of 3.7-4.6% at the share prices under the new regulatory regime.• The Hong Kong government and the city’s two duopoly
power utilities have come up with the extension of the “scheme of control [SoC]” regime.
–8% in 2019 from the current 9.99%.
Market Overview - Major investments in power sector; few companies control the electricity generation and distribution market due to regulation constraints
more than US$505 billion. The Philippines has the highest number of active projects among SEA countries Coal is still a major fuel source at 29.9% in power generation spending in the region; renewable energy leads with 49.8%.
Hong Kong has no indigenous energy resources. The Government considers the private sector to be in the best position to supply all its energy requirements
• According to Fitch Ratings, CLP Power Hong Kong Limited (CLP HK) has an ‘A’ rating with a stable outlook (the ratings
which typically contributes around 70% of CLPH’s total EBITDA).
Figure 6.1. EBITDA margins and associated CAGR, 2013-2017
5%
15%
25%
35%
45%
55%
65%
75%
85%
EB
ITD
A M
argi
ns
(%)
HK electric (HEC) 4.5% (Hong Kong)
China Resources Gas 1.3% (Hong Kong)
Towngas 0.0% (Hong Kong)
Singapore Power 14.2% (Singapore)
Tenaga (TNB) 3.8% (Malaysia)
Manila electric (MERALCO) 4.4% (Philippines)
2013 2014 2015 2016 2017
CAGR (2013-2017)
Source: Thomson Reuters EIKON Data (“Normalized EBITDA”), Capgemini Analysis WEMO 2018
However, the new regulatory period will span 15 years through to end-2033 compared with the previous 10 years, providing stability and visibility over a longer period when increasingly stringent emissions requirements will demand investments in
Sout
heas
t Asia

196 A Strategic Overview of the Global Energy Markets
CLP and HK Electric have reached an agreement with the government - the cap on returns will be cut to 8% in 2019 from the current 9.99%.
According to Fitch Ratings, CLPH’s capex will remain elevated over 2017-2020 mainly due to the heavy capex requirements of CLP HK:
monopoly, vertically integrated, wholly regulated electricity business in the Kowloon district and New Territories region.
• Fitch also estimated a moderate dividend payment growth in 2018.
According to JPMorgan (2018), CLP can maintain its absolute dividend per share by raising payouts to 61% in 2019 (from 55.7% in 2017).
• But HK Electric has acknowledged that it must pay its owners all of its distributable income, and also expects its dividend yield to remain at a relatively high 4.6% in 2019, compared to 5.9% in 2018.
TNB has revised its existing dividend policy, from a dividend payout ratio of 30-50% to 30-60% in FY2017.
• The company also announced an annual dividend payout of RM 3.5 billion.
• TNB recognized its low earnings for FY2017 (6.3% lower
cost from new borrowing acquired during the year and the rise in deferred taxation expense due to higher capitalization of assets.
Figure 6.2. Dividend per Share in US$ (2013-2017)
2013 2014 2015 2016 2017
0.040.05
0.050.05
0.030.03
0.040.07
0.04
0.33
0.04
0.19
0.04
0.34
0.13
0.05
0.23
0.04
0.35
0.11
0.05
0.29
0.04
0.36
0.13
0.05
0.48
0.05
0.38
0.11
0.35
HK electric (HEC)(Hong Kong)
China Resources Gas(Hong Kong)
Towngas(Hong Kong)
CLP Group(Hong Kong)
Singapore Power(Singapore)
Tenaga (TNB)(Malaysia)
Manila electric (MERALCO) (Philippines)
0.0
0.1
0.1
0.2
0.2
0.3
0.3
0.4
0.4
0.5
0.5
Div
iden
d p
er S
har
e (U
S$)
Source: Thomson Reuters EIKON Data (“Dividend per Share DPS”), Capgemini Analysis WEMO 2018

197
Credit Ratings, 2013-2018
Figure 6.3. Credit Ratings by Standard & Poor's, 2013-2018
Credit ratings by Standard & Poor’s
Company 2013 2014 2015 2016 2017 2018 Outlook
HK electric (HEC)
China Resources Gas
Towngas
CLP Group
Tenaga (TNB)
Manila electric (MERALCO)
TaiPower
A- A- A-
AA- AA- AA- AA- A+ A+ Stable
A+ A+ A+ A+ A+
A A A A A A Stable
BBB+ BBB+ BBB+ BBB+ BBB+ BBB+ Stable
BBB- BB+ BB+ Stable
twAA- twAAA twAAA Stable
Source: Thomson Reuters EIKON Data, Capgemini Analysis WEMO 2018
Topic Box 6.1: Southeast Asia’s Rating Trends
Rating trends across utilities in SEA remain mostly stable, supported by a stable regulatory framework and moderate demand growth. Anticipated regulatory developments and planned capital expenditure (capex) can be generally accommodated within the rating headroom.
Hong Kong:strengths support the stable outlook on Hong Kong’s
system against negative shocks.• In May 2017, Moody’s Investors Service downgraded
Hong Kong’s local currency and foreign currency issuer ratings to Aa2 from Aa1 and changed the outlook to stable from negative.
• HK Electric and HK Electric Investments Limited have maintained high credit ratings, and in February 2018, Standard & Poor’s changed the outlook to stable.
Singapore: According to Moody’s Investors Service,
state’s very high per-capita income, diverse and competitive
framework and low susceptibility to event risk.• Most large power generation companies in Singapore
generation assets.
Malaysia: According to Fitch Ratings, the Malaysian rating
position as a net external creditor that is supported by sustained current account surpluses and the large external assets of its private sector, besides falling government debt
• Central government debt declined to 50.8% of GDP by the end of 2017 from 52.7% of GDP at at the end of 2016. However, the rating is constrained by weaker governance standards and lower levels of income per capita and human development compared to the median for sovereigns rated in the ‘A’ category.
According to Moody’s, Tenaga Nasional Berhad’s (Tenaga,
August 2017 (FY2017) are in line with Moody’s expectations and continue to support its ratings. The outlook on the rating is stable.
Philippines: S&P Global Ratings has raised its outlook for the Philippine economy, citing strong economic growth, healthy external position, and improving policy making.• A higher credit rating translates to more foreign
investments, and lower borrowing costs for both the government and private sectors.
• S&P has upgraded Meralco’s long-term corporate credit rating from ‘BBB-’ to ‘BB+’ with a stable outlook, which indicates that the company has “adequate capacity” to
conditions or changing circumstances may lead to a
Sout
heas
t Asia

198 A Strategic Overview of the Global Energy Markets

199
Aust
ralia
Australia

200 A Strategic Overview of the Global Energy Markets
WEMO 2018 Australia EditorialJan Lindhaus & Anastasia Klingberg
Australia has progressed its management of the climate change journey over the last year. Investment in renewable projects has increased over 2016/17, federal policies were created to assist in managing the stresses of a disruptive industry. Governments at State and Federal level increased their focus on predominately renewable supply, but with increased pressure on
for the end consumer.
Australia did not encounter any disruptions to supply due to energy shortage in 2017/18, but the good-news story stops there: The inquiry of Australia’s competition regulator (ACCC) into retail electricity prices revealed a 56% increase in residential customer prices and 35% increase in residential customer bills between the period 2007/08-2017/18.
The control and reduction of consumer energy prices was the primary focus over the last two years, resulting in the Federal Government’s National Energy Guarantee (NEG). Just when State Governments were getting to closer to endorse the NEG, Australia was again shaken by a change in Federal Government outside its election cycle. At the time of publishing the NEG’s future is again uncertain and as we draw closer to an election the question still remains: will Australia continue the push to meet its emissions and renewable energy targets or will we see a change of direction, following the United States’ disengagement of Climate change policies. 2019 is shaping up to be an exciting year in Australia’s Energy Market.
Climate Change
Australia is on track to meet both its 2020 and 2030 emissions targets. It will exceed its 2020 target by 3.6% and has had a consistent reduction in emissions projections for 2030 since 2012. This is making us optimistic that the 2030 target can be achieved as well. Lower electricity demand, phase down of HFC
implementing policies at state level, are likely to be the key driving forces to achieve the 2030 target. An accelerated uptake of electric vehicles might lead to an unexpected increase of consumption and remains to be monitored.
Let us take a closer look at the relevant key policies that Australia has progressed over the 2017 /18 period:
• National Energy Guarantee (NEG): Electricity retailers are to use a mix of renewable and non-renewable sources to ensure reliable energy supply while reducing emissions simultaneously. All Australian states and territories must still agree to ratify the policy.
• HFC phase-down: The Government has initiated the phase down of HCF imports from January 2018 to meet international commitments of the Montreal protocol. The aim is to reduce generation of substances that deplete the ozone layer of the atmosphere.
• RET: Australian Government supports the uptake of renewable energy through the Renewable Energy Target (RET). The scheme is expected to deliver at least 23.5% of Australia’s electricity generation from renewable sources by 2020
Energy Transition
As the momentum for adoption of renewable energy continues to build through 2018, Australia appears to be well-positioned to meet its 2020 Renewable Energy, mostly driven by state-level initiatives.
Accord to the Clean Energy Regulator
has now been committed to achieve the objective: 700 MW of renewables projects were completed in 2017 and nearly 5,000 MW were under construction by the end of the year.
Generation in renewable energy were largely driven by wind and solar, both of which recorded increase in percentage
in 2017, contribution of wind in the nation’s electricity generation was at par with hydro, both accounting for about 6% share. Large scale solar and wind projects attracted investment worth A$11.7 billion in Australia, which is an increase of 150% from 2016.
More than 1.1 GW of solar PV was installed in the small-scale market in 2017, eclipsing the previous best record in 2012 as per the CER. More than one
solar panels installed on their roof, which represents the highest rate per capita in the world.
Commencement of the operation of the world’s largest lithium-ion Tesla battery at Neoen’s Hornsdale Wind Farm in South Australia thrust energy storage into (global) spotlight. It already proved its mettle responding quickly when
generators to help stabilise the electricity system.
Infrastructures and Adequacy of Supply
Thorough planning by the Australian Energy Market Operator (AEMO) ensured a robust system performance in the NEM during the summer of 2017/18. No consumers experienced interruptions to their electricity supply due to shortages. This was achieved by the generation of an extra 2,000 MW that were sourced as follows:
• Reopening of three mothballed gas-powered-generators across South Australia, Queensland and Tasmania enabled generation of 833 MW of additional electricity into the National Energy Market (NEM)
• 867 MW of additional resources was procured through demand-response programs via the Reliability and Emergency Reserve Trader (RERT)

201
Supply and Final Customer
In the backdrop of unsustainable electricity price rises in Australia, the ACCC produced a report identifying the root causes and developed recommendations to address these:
• Network Cost: Very high reliability standards caused increased expenditure in certain networks while it was unclear if consumers are willing to pay for marginal increases in security of supply.
• Wholesale Cost: The sudden closure
resulted in shortage of supply and excess demand in the market. This consequently drove prices up as the shortfall had to be compensated through more costly sources of generation like hydro and gas.
creation of shortage of supply by generators) as another root cause driving cost.
• Environmental: Most state governments implemented excessively generous solar feed-in
to the producers of solar energy were then funded at the expense of higher network and wholesale prices charged from end consumers.
• Retail Cost and Margins: Excessively high prices charged for standing
left limited options for consumers to switch.
The percentage share of each driver is quite evenly distributed across regions. Network and wholesale account for 72–79% of the cost stack, followed by retail costs, retail margin and environmental costs which together contribute 21–28%.
New Business Models and Services
Fast paced technological changes are rapidly reshaping Australia’s energy market, transforming it from a centralised system dominated by few players to a more decentralised, heterogeneous environment. Secondary participants and new entrants are creating a new dynamic and thus more opportunities to innovate and improve.
• Experimentation in wave, bio energy and battery storage technologies is driving growth in innovative renewable generation.
• Blockchain technology and its application in energy trading is gaining traction.
• Big data, analytics and IoT are being leveraged by city councils and businesses to improve
city development and ensure consumer retention.
Traditional players invest in the exploration of new business models, fostering of promising start-ups (locally and globally), working with new and unusual partners.
F inancials
Generation and Retail
The power generation market continues to be dominated by GenTailer AGL despite growing competition. The energy retail market is largely covered by Origin Energy along with its Tier 1 competitors AGL and Energy Australia.
• In 2017, AGL accounted for the largest market share in generation capacity across regions of Victoria, South Australia and NSW. Streamlined cost reduction programs and rising wholesale electricity prices helped AGL improve its bottom-line.
• Origin Energy continued to dominate the electricity and gas retail market across Queensland, South Australia and NSW, along with AGL.
Network Service Providers
The AER decisions in the current regulatory period led to lower total network revenues of electricity and gas,
and reduced capital expenditure.
• Regulated electricity and gas network revenues are forecast to decline by an average 13.5% and 12% respectively.
AEMO has also abolished the Limited Merits Review (LMR) regime removing the right of Network Service Providers (NSPs) to apply for LMR of most of the decisions of the Australian Energy Regulator (AER). This will assist in reducing the uncertainty around network pricing and ensure that the downward momentum facilitated by AEMO is maintained in the long run.
Whilst Australia stabilised its approach to Energy Transition in 2017/18 and began addressing its consumer pricing concerns, we look towards 2019 and wonder on the possibilities on where Australia’s Energy Transition will head.
We look forward to reporting to you in our next edition of WEMO.
Jan Lindhaus
Vice President, Head of Energy & Utilities Australia
Anastasia Klingberg
Industry Practice Lead Energy & Utilities, Australia
Aust
ralia

202 A Strategic Overview of the Global Energy Markets
Major energy events (2017 and H1 2018)
2017
Clim
ate
chan
ge
En
erg
ytr
ansi
tio
nC
om
pan
ies
Ele
ctri
city
Gas
Ru
les
Jan Feb March April May June July Aug Sept Oct2017
16 March:Prime Minister Malcolm Turnbull announced plans for Snowy Hydro 2.0, which would expand the original scheme to include 2000 MW of pumped hydro storage
31 March:Closure of Victoria's Hazelwood power station
29 March:Origin Energy signed a contract with South Australian power station, Pelican Point, to purchase gas for at least A$11 per gigajoule
21 April:AGL launched a rebranding campaign with an intention to remove its coal generation to zero by 2050
08 May:To boost its digital transformation drive, Energy Australia roped in MuleSoft’s Anypoint Platform to
omnichannel services to consumers and obtain a 360 degree view of each customer and their energy consumption
17 Oct:National Energy Guarantee proposed as the new energy policy, which requires electricity retailers to use a mix of renewable and non-renewable sources to be able to provide a reliable energy supply and reduce emissions
will be taken only if all state governments and coalition parties ratify the agreement
24 March:Government initiated discussion paper on the review of Australia’s climate policies and post 2030 emissions pathway
02 June:The Australian Government released a Low Emissions Technology Roadmap developed by CSIRO, which explores the scope for new technologies like carbon capture storage, energy storage, smart meter and smart buildings to reduce greenhouse gas emissions from the energy sector
09 June
“Blueprint for the future: Independent Review into the Future Security of the National Electricity Market”, was released, which recommended the introduction of Clean Energy targe
26 April:Australian government announced to impose export limits from 1 July 2017 on LNG producers that draw more gas from the domestic market than they supply into it
22 May:Electric Vehicle Council launched to drive uptake of electric vehicles in Australia

203
Aust
ralia
JanDecNov Feb March April May June July20182017 2018
18 Dec:As a part of its digital transformation initiative, AGL has selected SAP’s S/4 HANA platform
ERP planning
06 June:Endeavour Energy roped in Cognizant for its digital transformation project, which will leverage the SAP S/4HANA suite and a range of SAP Cloud solutions. Likewise, many companies across generation, distribution and retail businesses are leveraging digital transformation to reduce cost for their future operations
10 July:AER released a draft on Rate of Return Guidelines wherein it announced plans to reduce the return on debt, to ensure a balance between system reliability and
help keep energy prices down
01 Jan:Australian government commenced phase down of HFC import, as a part of its agreement in Montreal protocol to reduce greenhouse gas emissions
09 May:Australian Government agreed to the Consumer Data Right model that will allow consumers to share their electricity consumption data with price comparison service providers and help them compare and switch
01 Dec:
largest lithium ion battery by Tesla in South Australia, which has a total generation capacity of 100 MW and 129 MWh of energy storage, that is capable of powering more than 30,000 homes
20 Dec:Snowy Hydro 2.0 feasibility study approved and reveals that it is
further work to be undertaken to reach
19 Dec:Final report on 2017 review of Australia’s climate policies was released

204 A Strategic Overview of the Global Energy MarketsA Strategic Overview of the Global Energy Markets204
electricity retailers to invest in enough dispatchable energy resources to tackle peak demand, while maintaining the emissions threshold when purchasing electricity.
• Currently in a consultation phase, NEG has been facing criticisms for its less ambitious and non-inclusive approach.
In absence of a robust federal climate policy, state and territories are playing crucial roles in driving the Australian energy transition – all except Western Australia have renewable energy and/or net emissions targets in place
• South Australia, Australian Capital Territory (ACT) and Tasmania are leading the pack in the renewable race with the later two having a target of 100% renewables by 2020 & 2022 respectively
• From having no formal targets in place, both NSW and
in policy support for renewables in the last two years.
Australia’s emissions have increased in the past three years and the momentum is expected to continue till 2030. Despite the upward trend, estimates suggest that Australia is on track to meet its 2020 target of reducing emissions to 523 MtCO2e (i.e. 5% below 2000 level)
• Lower emission from manufacturing and electricity sector, as well carbon sequestration from regrowing forests, have been driving down emission projection for 2020 between 2012-2017.
• As of 2017, the estimated emission for 2020 stands at 551 MtCO2e and this number is expected to decline further with the forthcoming projection updates.
• Moreover, Australia is expected to overacheive the cumulative emissions reduction required between 2013-2020, by 3.6%.
The country has also set an ambitious target of reducing emissions 26-28% below 2005 level by 2030, and is on track to achieve that as well
• Despite an upward trend in Australia’s emissions for last three years, the country is optimistic in meeting its 2030 target. This is evident from the falling 2030 emissions estimates with each projections update from 2012-2017.
• Lower electricity demand, phase down of HFC and progress in implementing policies at state level, are likely to be the key driving forces.
Government is considering implementing the National Energy Guarantee (NEG) as Australia’s future energy policy to deliver more reliable
subject to several debates and criticisms
• The policy which has been designed in collaboration with Energy Security Board and COAG Energy Council requires
Australian government has put forth a set of policies to reduce greenhouse gas emissions, however, some of these are currently subject
might need to increase further to meet the country’s long run emissions target. The government has committed to review these
timeframe of Paris Agreement, to ensure
reduction targets.
1-Climate Challenges & Regulatory Policies

205
Aust
ralia
205
Australia’s greenhouse gas emission projections
Australia’s emissions have risen in the past three
till 2030.
• A major factor in this growth has been the rapid expansion of the LNG sector, which is expected to grow further as more plants commence their operation in 2018.
• However, increased emissions from LNG are expected to
generation – an especially strong growth in solar generation is expected – compensates for the electricity demand growth.
• In addition, decline in emissions intensity of generation due to the Renewable Energy Target (RET) and the announced closures of coal power stations like Hazelwood and Muja are
the decline in projected emissions in 2020.
Emissions in 2030 are projected to grow by 3.5% above 2020 levels, mostly driven by transport and agriculture sectors; emissions in other sectors are projected to stabilize or grow slowly in the post 2020 period.Cars and light commercial vehicles are projected to continue to be the largest source of transport emissions till 2020, after which emissions from heavy vehicle activity for freight will continue to persist, aligned to the projected growth in Growth Domestic Product (GDP) and rising demand for consumer goods.
Increase in agriculture emissions will be underpinned by rising food demand; beef cattle is projected to continue to be the biggest contributor to sectoral emissions, followed by sheep and dairy cattle.
• Closure of Hazelwood, Muja and Liddell power stations coupled with increase in renewable generation to meet RET is expected to drive down emissions from electricity sector till 2030.
• Emissions in direct combustion sector are expected to be mainly driven by production growth in LNG plants till 2020, after which no further facility expansions are projected till 2030.
• Fugitive emissions expected to increase from LNG production and coal mines, as under-construction LNG plants ramp up to full production from 2018, coupled with increase in coal production.
• 2018 are expected to lower long term emissions from industrial processes and product use.
• Increase in recycling and methane capture rates are likely to marginally reduce wastewater emissions from domestic, commercial and industrial sources between 2017 to 2020, after which it is expected to remain stable till 2030.
Figure 1.1. Annual emissions in Australia, 2015-2030 (million metric tons)
520
530
540
550
560
570
580
2015 2016 2017 2020E 2030E
Mill
ion
Me
tric
To
ns o
f C
O2e
538543
554551
570
Source: Australia’s emissions projections 2017, Dept. of Environment and Energy – Australian Government (Dec 2017)
Figure 1.2. Sectoral breakdown of emission projections, 2017-2030 (million metric tons)
0
20
40
60
80
100
120
140
160
180
200
2017 2020 2030
Mill
ion
Me
tric
To
ns o
f C
O2
e
Year on Year Growth: 2017 vs. 2020 | 2020 vs. 2030
Electricity: -8% | -1%
Direct Combustion: +8% | -2%
Transport: +5% | +10%
Agriculture: +4% | +9%
Fugitives: +4% | +4%
Industrial processes and product use: 0% | -6%
Waste: -9% | 0%
LULUCF*: -100% | NA
Source: Australia’s emissions projections 2017, Dept. of Environment and Energy – Australian Government (Dec 2017) * Land Use, Land Use Change and Forestry

206 A Strategic Overview of the Global Energy MarketsA Strategic Overview of the Global Energy Markets206
Despite the continuous rise in emissions, Australia is on track to achieve its emission reduction target of 5% below 2000 levels i.e. 523 MtCO2e by 2020.
• This is evident from the steady decline in 2020 emission estimates with each projection update, over the last six years between 2012-2017; this trend is expected to persist in near future as well.
– As per 2017 estimate, total emission in 2020 was projected to be 551 MtCO2e , a downward revision of 1.4% since
– This is largely owing to higher projected carbon sequestration1 in re-growing forests and lower projected emissions from mining, manufacturing and electricity sector.
Australia expected to not only meet the 2020 emission reduction target but also overachieve the amount of cumulative emissions reduction required through the period till 2020, by 3.6%.
• As per 2016 estimates, Australia was expected to overachieve on its 2020 target by 97 MtCO2e (without carryover).
• In 2017, this estimate on overachievement increased to
2
reducing emissions.
Figure 1.3. Evolution of emission projections for 2020 over time (million metric tons)
693 685
593656
559 551
0
100
200
300
400
500
600
700
800
2013projections
2012projections
2014projections
2015projections
2016projections
2017projections
Mill
ion
Met
ric
Tons
of
CO
2-e
Change over 2016 projection: reduction
by 8 million metric tons of CO2-e -1.4%
Source: Australia’s emissions projections 2017, Dept. of Environment and Energy – Australian Government (Dec 2017)
Figure 1.4. Projected cumulative surplus in emission reduction between 2013-2020, above 2020 target (million metric tons)
97
166
69
0
20
40
60
80
100
120
140
160
180
Mill
ion
Me
tric
To
ns o
f C
O2
e
Change in projection: 2016 vs 2017
Cumulative emission reduction over & above 2020 target: 2016 projection
Cumulative emission reduction over & above 2020 target: 2017 projection
Source: Australia’s emissions projections 2017, Dept. of Environment and Energy – Australian Government (Dec 2017)
1 Carbon sequestration is the process of capturing and storing atmospheric carbon dioxide in plants, soil, geological formation and ocean. It is one of the methods of reducing the amount of carbon dioxide in the atmosphere with the goal of avoiding dangerous global climate change

207
Aust
ralia
207
For 2030, Australia has a target of reducing emissions to 442-430 MtCO2e i.e. 26% to 28% below 2005 levels. Estimate for emissions in 2030 has been falling with each projections update, thus indicating that the country is on track to achieve its 2030 target as well.
• As per 2017 estimates, total emission in 2030 is projected to be 570 MtCO2
to:
– Lower electricity demand and falling technology costs in the electricity sector
– Progress in implementing policies including the Government’s National Energy Productivity Plan (NEPP)
(HFCs)
– Higher projected carbon sequestration in regrowing forests
– Lower than forecast emissions from mining and manufacturing than projected in 2016.
According to 2017 projection update, approx. 122 MtCO2e lesser cumulative emission reduction of CO2e is required between 2020-2030 to meet the 2030 target, compared to 2016 update.
• 2017 estimate indicates that cumulative emission reductions of 868 MtCO2 2e is required over the period 2021-2030 to meet Australia’s 26% and 28% targets respectively.
• This estimate stood at 990 MtCO2 2e in 2016 projection update.
• The decline in emission reduction requirement is primarily driven by new policy measures undertaken by the government.
Figure 1.5. Evolution of emission projections for 2030 over time (million metric tons)
786724
801
592 570
0
100
200
300
400
500
600
700
800
900
2013projections
2012projections
2014-2015projections
2016projections
2017projections
Mill
ion
Met
ric
Tons
of
CO
2e
Change over 2016 projection: reduction
by 22 million metric tons of CO2e -3.7%
Figure 1.6. Projected cumulative emission reduction required between 2021-2030 to meet 2030 target (million metric tons)
121-122
0
200
400
600
800
1,000
1,200
Change in projections: 2016 vs 2017
990-1,055868-934
Net emissions reduction task: 2017 projections
Net emissions reduction task: 2017 projections
Mill
ion
Met
ric
Tons
of
CO
2 e
990:
26%
red
ucti
on
on
2005
leve
l
1,05
5: 2
8% r
educ
tio
n o
n 20
05 le
vel
868:
26%
red
ucti
on
on
2005
leve
l
934:
28%
red
ucti
on
on
2005
leve
l
Source: Australia’s emissions projections 2017, Dept. of Environment and Energy – Australian Government (Dec 2017)

208 A Strategic Overview of the Global Energy MarketsA Strategic Overview of the Global Energy Markets208
Review of climate change policies in operation
Consistent with the timelines of the Paris
domestic policies are on track to meet the energy and emission targets. Australia is one of those
timeframe with the Paris agreement
• In 2017, the Australian Government reviewed its current policies in operation which include:
– Emission Reduction Fund (ERF) and Safeguard Mechanism: ERF is a incentive based initiative that enables Australian businesses, local councils, landholders and others to earn carbon credits from projects which reduce or avoid greenhouse gas emissions. These carbon credits are then purchased by Clean Energy Regulator on behalf of the Australian government and can also be sold to other
has been in operation since July 2016, puts emission limits on Australia’s largest emitters to ensure that emission reductions purchased by the Australian Government
above business-as-usual levels elsewhere in the economy.
– Renewable Energy Target (RET): It supports growth and employment in the renewable energy sector by providing
energy projects. Household use of solar energy has surged under the Renewable Energy Target. Australia has one of the highest number of solar panels on roofs per capita in the world, representing 17% of Australian households. The scheme is expected to generate at least 23.5% of Australia’s electricity from renewable sources by 2020.
– The National Energy Productivity Plan (NEPP): It consolidates national, state and territory government to provide an economy wide work plan that aims to accelerate a 40% improvement in Australia’s energy productivity by 2030. Measures under the National Energy Productivity Plan are already delivering cost savings and emissions reductions.
– Provides benchmarks for organizations seeking to make their operations, products, services, buildings, precincts or events carbon neutral. The Carbon Neutral Program provides a framework for certifying carbon neutrality
• New policies and measures are also underway to meet the emission reduction targets:
– National Energy Guarantee (NEG): The Australian government proposed the National Energy Guarantee in October 2017. The policy requires electricity retailers to use a mix of renewable and non-renewable sources to be able to provide a reliable energy supply and reduce
emissions simultaneously. For the NEG to be implemented, all of the states and territories must agree to ratify the
COAG Energy Council meeting in August 2018.
– HFC phase-down: Government has initiated the phase down of HCFs imports from January 2018 to meet international commitments of the Montreal protocol that aims to reduce generation of substances that deplete the ozone layer of the atmosphere.
ERF will continue to play a critical role in helping Australia meet its emission reduction target. Many projects contracted under ERF currently are expected to deliver emission reduction beyond 2020 and will contribute to Australia’s 2030 emissions reduction target.
• ERF comprises of three interrelated elements namely:
– Crediting: This refers to carbon crediting that enables businesses, community organizations and local councils to earn carbon credits for undertaking approved emission
carbon in forests and soils. Participants receive one Australian carbon credit unit for every ton of emissions they reduce or avoid. As a next step, these carbon credits are purchased by Clean Energy Regulator (on behalf of the Australian government) through an action or bid process.
– Purchasing: Participants register a project and bid to enter into a 10 year contract with the government. During the contract tenure, participants are obligated to earn carbon credits by undertaking approved emission reduction activities and sell the same to the government for auction
the contractual obligations, the project proponent may need to compensate by buying carbon credits from other project owners. Participants may also sell carbon credits achieved under the ERF privately to entities wanting
reduction projects are registered under ERF.
– Safeguard Mechanism: It is designed to ensure emissions reductions purchased by the Australian Government
in emissions above business-as-usual levels elsewhere in the economy. The Safeguard Mechanism does this by placing emission limits (or baselines) on Australia’s largest emitters. Facilities covered by the Safeguard Mechanism are required to reduce emissions or purchase carbon credits to ensure net emissions remain below the baseline.
New approach in ERF Safeguard Mechanism
• In 2017, Australian government reviewed ERF and its Safeguard Mechanism and as an outcome it released a consultation paper that proposed an approach, to make the

209
Aust
ralia
209
mechanism fairer and simpler. This includes:
– Updating baselines by transitioning all facilities to calculated baselines over 2018-19 and 2019-20
– Updating baselines annually for actual production,
enable growth.
• Under the current proposed rules, new facilities and
will be using the calculated baseline approach, whereas, for new investments operational after 2020, baselines will be set with respect to government benchmarks once the approach for existing facilities is settled.
• Many industry experts have criticized the new approach and are of the opinion that if baselines are continually
inevitably be wiped out.
Figure 1.7. Emission Reduction Fund contract portfolio (as of 15th June, 2018)
Vegetation
A$396 million paid
Delivered abatement
31.6 million tons
Portfolio of abatement
Completed: 16
Projects revoked: 16
Total remaining A$249 millionA$1.9 billion currently committed
A$2.55 billion scheme funding
Remaining delivery
160.4 million tons
Contracts on hand
429
125.5 million tons
192 million tons
24.5 million tons
Agriculture 18.1 million tons
Savanna burning 13.5 million tons
5.2 million tons
Industrial fugitives 4.0 million tons
Transport 1.2 million tons
Auction 1 A$13.95/ton
Auction 2 A$12.25/ton
Auction 3 A$10.23/ton
Auction 4 A$10.69/ton
Auction 5 A$11.82/ton
Auction 6 A$13.08/ton
Auction 7
Average across auctions A$11.97/ton
A$13.52/ton
461Projects under contract
revoked projects
To
tal c
ontr
acte
d ab
atem
entContract portfolio
Average price per ton of abatement
NA16
QLD156
NSW201
ACT0
TAS9
VIC22
SA9
8 multi-state
projects
WA31
9National projects
Source: 7th auction contract portfolio, Clean Energy Regulator, June 2018
The Australian Government has allocated A$2.55 billion to purchase carbon credits through the ERF, using a competitive process of auctioning; approx. A$2.30 billion have already been paid or committed for the purchase.
• government has declared to have purchased carbon credit (in other words, contracted emission abatement) worth 192 million tons from 461 projects at an average price of A$11.97. Lower registration rates owing to administrative complexity has resulted in lesser competition, thus driving up the auction price since late 2017 i.e. auction 5.
• Of the 192 million tons of emission reduction contracted, 16.4% abatement has already been delivered while 83.6% is yet to be delivered –vegetation sector dominates the abatement portfolio.
• Of the 461 projects currently contracted under ERF, 3.5% are already completed, while 93% are in progress - New South Wales and Queensland dominate the contract portfolio and they together account for 77% of total projects contracted in ERF.
210 A Strategic Overview of the Global Energy MarketsA Strategic Overview of the Global Energy Markets210
Australia’s other domestic policies are also having
country is on track to achieve both its 2020 and 2030 emission reduction targets
• RET: Australian Government supports the uptake of renewable energy through the Renewable Energy Target. The scheme is expected to generate at least 23.5% of Australia’s electricity from renewable sources by 2020. The policy has two components - the large-scale Renewable Energy Target of 33,000 GWh by 2020 which encourages investment in large scale renewable projects, and the small-scale Renewable Energy Scheme which helps home-owners and small businesses to install eligible small-scale renewable energy systems and solar hot water systems.
– Large scale RET: Eligible large-scale renewable energy generators, like solar and wind farms, hydro-electric and
Large-scale RET. Electricity retailers are legally obligated to
Clean Energy Regulator each year and this operates as a subsidy to renewable energy generators. In August 2017, more than 70% of the estimated capacity required to reach the 2020 target had been accredited.
– Small-scale Renewable Energy Scheme: Assists homeowners and small businesses with upfront costs of installing small-scale wind, hydro and solar panel systems. This scheme has assisted Australian households to install more than 1.8 million solar PV systems and one million solar water heater systems. In August 2017, Australia hit a milestone of 6,000 MW capacity across 2.8 million small-scale installations of renewable energy systems which is
• NEPP: Aims to boost competitiveness and growth, help families and businesses manage their energy costs and reduce emissions. Key achievements include:
– Tighter energy standards for equipment: To accelerate
program, new proposed standards have been consulted on for air conditioners, commercial refrigerated display cabinets, industrial fans, swimming pool pumps, lighting,
refrigerators and freezers. These measures will deliver an
emissions by 45 MtCO2e (cumulative to 2030).
– Expansion of the Commercial Building Disclosure program: Requires most sellers and lessors of large
to prospective buyers and tenant. From 1 July 2017 the mandatory disclosure threshold for buildings size was lowered from 2,000 square meters to 1,000 square meters. This is expected to generate A$50 million savings in new energy and about 3.5 MtCO2e reduction till 2019.
– Further improvements to NEPP are underway, which include:
– Commercial launch of the Victorian Residential in April 2018
homes, helps homeowners identify and prioritize upgrade opportunities to reduce energy costs and subsequently improve the health and comfort of their
driven by broad use of this Scorecard is expected to result in greenhouse gas reduction outcomes. The Victorian Government has committed to funding the Scorecard program until 2020.
– Implementation of the Australian Government’s Smart Cities Plan, including the A$100 million a year Sustainable Cities Investment Fund, that aims to accelerate the deployment of clean energy, renewable
• The
audit greenhouse gas emissions, and how to achieve carbon
– Some of Australia’s best known organizations are part of a
–that deliver additional environmental or social outcomes such as improved water quality, increased biodiversity and indigenous employment.
New policies and measures developed
Work is underway on additional policies to reduce emissions in the electricity sector through a National Energy Guarantee, and to meet international commitments of the Montreal Protocol through
National Energy Guarantee:
• What is National Energy Guarantee?
– A policy mechanism designed to retain existing resources and encourage new investment in the National Energy Market (NEM) while ensuring that emissions standards are met and the system operates reliably.
– On 17 October 2017, the Australian Government announced to accept the recommendation of the Energy Security Board for a new National Energy Guarantee, which replaces the 50th recommendation of the Finkel Review.
– The Government will work with the independent Energy Security Board and with the states and territories through

211
Aust
ralia
211
the Council of Australian Governments Energy Council to implement the new policy.
– For the NEG to be implemented, all of the states and
on the NEG is due to be made at the COAG Energy Council meeting in August 2018.
• Operation Mechanism of NEGIf implemented, NEG will require energy retailers to ensure that the electricity they contract for or purchase meet the 2 key targets:
– Reliability Guarantee: Requires electricity retailers to invest in enough dispatchable energy resources (e.g. coal, gas, hydro, battery storage, demand response) to cover a set amount of their peak load in a region if a shortfall is predicted.
– Emission reduction guarantee: Requires electricity retailers
purchase from the wholesale market to be aligned with Australia’s emissions reduction commitments under the Paris Agreement.
– If the federal government does manage to get all the states and territories on board, the reliability component of the NEG will start in 2019 and the emissions component will succeed the RET in 2020.
• How will NEG impact NEG prices?
– As per initial estimates by Energy Security Board (ESB), the NEG will reduce household power bills by approximately A$120 per year between 2020 and 2030.
– This savings will receive a further boost from the additional A$280 million per year reduction expected from the entry of 6000 MW of new renewable generation in next few years, under RET.
• How will NEG contribute to emissions abatement?
– Currently, the government has set the emissions abatement component of the NEG at 26% i.e. the lower limit of Australia’s 2030 emission reduction target, under Paris Agreement.
– This, however represents only a minor reduction from what is expected under a ‘business as usual’ scenario.
Figure 1.8. Potential new energy projects under NEG (in MW)
0
500
1,000
1,500
2,000
2,500
3,000
3,500
4,000
4,500
5,000
Ne
w la
rge-
scal
e r
ene
wab
les (
MW
)
2017 2020 2021 2022 2023 2024 2025 2026 2027 2028 2029 2030
4,470
670 670 670 670 670 670 670 670 670 670 670
New projects committed and deployed in 2017
New projects committed under NEG assuming linear emissions trajectory (best case scenario)
Source: Clean Energy Council
• According to the ESB, renewable energy will account for 28-36% of total energy generation in 2030 under the NEG (including hydro and rooftop solar).
• This suggests that between 250 and 670 MW of large-scale renewable projects will be deployed each year from 2020-2030.
• Considering that approximately 4300 MW of renewable energy projects are currently committed or under
renewable projects, over the next 10 years.
212 A Strategic Overview of the Global Energy MarketsA Strategic Overview of the Global Energy Markets212
Background
• Refrigerants Australia (a peak organization responsible for the supply chain of refrigerants both in bulk and in equipment) had recognized that most of the gases used in refrigeration and air conditioning have high global warming potential and as such it is imperative to reduce the emissions from such gases. Hence, in early 1990s the organization started encouraging import and use of next generation of refrigerants i.e. HFCs in Australia, which were considered
impact compared to previous generation of gases.
• From the late 2000s, however, there was an increasing focus on reducing greenhouse emissions even further and by 2007 Refrigerants Australia launched the policy proposal that HFCs should be subject to a phase-down.
• In 2010, this proposal was launched by the US, Canada and Mexico in the Montreal Protocol, and the Australian Government came on board in 2012. Refrigerants Australia actively supported both domestic and international moves to agree to a phase-down of HFCs.
• In October 2016, nearly 197 countries across the globe agreed to phase down HFC as a part of the Montreal protocol. The agreement called for an international phase-down of 85% of HFCs for developed countries by 2036, with developing countries reducing use of HFCs by 80% a decade later. On October 28th 2017, the Australian Government
from 1 January 2018.
Australian Target:
• HFC phase-down for Australia includes restriction on the maximum amount of bulk gases (e.g. cylinders) that can be imported in the country and does not apply to gas imported in pre-charged equipment such as air conditioners or refrigerator. The annual import limit is currently at 8 CO2e per year.
• Australia has a target to phase-down use of HFCs by 85% within 2036 and is ahead of the global phase-down since it begins a year early than the Montreal Protocol.
Impact of HFC phase-down
• HFC phase-down along with other measures like improvement in equipment maintenance is expected to reduce emissions by up to 80MtCO2e till 2030.
• and pave the way for the introduction of state-of-the art refrigeration and air conditioning equipment.
Potential replacements for HFCs
• There are a number of potential replacements for HFCs- several refrigerants with no or very low global warming potential are now available in Australia, which may be appropriate for use in the same applications as HFCs. This includes natural refrigerants like ammonia, carbon dioxide and hydrocarbons, as well as manufactured substances like
•
but could be hazardous in case of systems that require a
State, Territory and Local government policies
All of Australia’s states and territories, with the exception of Western Australia, now have strong renewable energy targets and/or net zero emissions targets in place; South Australia, ACT and Tasmania have emerged as the front runners in the renewable energy race, with Queensland and Victoria catching up fast.
South Australia (SA):
• Policy
– Has a 50% by 2025 renewable energy target, a “zero net emissions” target for 2050 and introduced a new Energy Plan in 2017.
• Renewable power
– As of August 2017, SA had the highest capacity of
– increase in share of renewable energy largely driven by an increase in wind power and a decrease in coal generation.
– Completed construction of world’s biggest lithium-ion battery storage facility in December 2017 and has plans of installing a 150MW solar thermal power plant that will supply 100% of the state government’s electricity needs.
• Household solar penetration
– 30.5% of households with rooftop solar PV – second highest proportion after Queensland.
Australian Capital Territory (ACT):
• Policy
– Legislated target of 100% renewable energy by 2020 and net zero greenhouse gas emissions by 2050, at the latest.

213
Aust
ralia
213
• Renewable power:
– The ACT Government has been progressively transitioning
large-scale renewable energy reverse auctions aimed at purchasing renewable energy from wind and solar projects at the lowest price –this supported 600 MW of wind power and 40MW of large scale solar projects. The ACT completed
the territory on track to reach 100% renewable electricity by 2020.
• Household solar penetration.
– Approximately 14% of ACT households have solar PV - The
major political parties have provided bipartisan support for its renewable energy target.
Figure 1.9. Renewable energy policy and performance status across states and territories
Solar Households (%)
Renewable Energy Targets
50% by 2025 100% by 2020 100% by 2020 50% by 2025 25% by 2020; 40% by 2025
20% by 2020 50% by 2030
Net zero emissions target
Progress since 2016
Net zeroemissionsby 2050
SA Energy plan – completion of 100 MW lithium ion battery plant, Renewable Technology Fund and a 150MW solar thermal power plant
Net zeroemissionsby 2050
Net zeroemissionsby 2050
Net zeroemissionsby 2050
Net zeroemissionsby 2050
Net zeroemissionsby 2050
31% 14% 13% 32% 15% 15% 25% 11%
State/Territory SA ACT TAS QLD VIC NSW WA NT
Renewable Energy Target legislated
New renewableenergy target andzero net emissions target
Powering Queensland Plan -Largest number of large-scale renewable projects under construction
RenewableEnergyTargetLegislated as part of the Climate Change Act, 2017
Continuedpolicysupport.Largestcapacity ofnew projectsunderconstruction
Growing penetration of rooftop solar
Expert paneland consultationon approachto RenewableEnergy Target – implementation by mid 2018
Source: Australia’s emissions projections 2017, Dept. of Environment and Energy – Australian Government (Dec 2017)
Robust planning at state and territory level, coupled with existing and announced closures of coal plants (such as Liddell Power Station) are expected to help Federal Government achieve its 2030 emission reduction target, even without any action from the Federal Government.
• increase in renewable energy - The greatest capacity and number (respectively) of large scale wind and solar plants under construction in 2017 are in New South Wales and Queensland respectively, which is expected create thousands of jobs in construction and operation of plants.
• Queensland, South Australian and Western Australian households continue to lead in the proportion of homes with rooftop solar.
• Energy storage gains popularity as part of state and territory energy policy - Northern Territory, ACT, Capital Territory, South Australia, Victoria and Queensland are rolling out or planning for battery storage to provide greater grid security. In December 2017, SA completed construction of world’s largest lithium ion battery storage facility at the Hornsdale Wind Farm in collaboration with Tesla, which reportedly is
performing well and delivering rapid response to change in frequency.
Tasmania (TAS):
• Policy
The Tasmanian Government has committed to 100% renewable energy by 2022 and net zero emissions by 2050.
• Renewable power
More than 90% electricity in Tasmania is generated from hydro power and it has the second highest capacity of new renewable energy per person (excluding large hydro), after South Australia. Tasmania’s major hydro resources are ideally positioned to supply large-scale pumped hydro energy storage to the mainland grid as renewable supply increases and coal plants close in future. Pumped hydro energy storage schemes predicted to deliver up to 2,500MW of power are also being considered by ARENA.
• Household solar penetration
13.2% of Tasmanian households have solar PV.

214 A Strategic Overview of the Global Energy MarketsA Strategic Overview of the Global Energy Markets214
• Household solar penetration
Victoria has 15% of households with solar PV.
New South Wales (NSW):
• Policy
The state has witnessed one of the most dramatic positive shifts in policy support for renewable energy since 2016. In November 2016, the NSW Government announced its plan to reach net-zero emissions by 2050 and The NSW Renewable Energy Action Plan was developed to support the achievement of the national target of 20% renewable energy by 2020. In 2017, the state government allocated A$500 million from its Climate Change Fund over the next
The government consulted on a range of initiatives including those aimed at attracting investment in new generation capacity and ensuring energy security.
• Renewable power
New South Wales had the greatest capacity of new renewable energy under construction in 2017, which amounted to 1,018MW of large-scale renewable energy. This
the Australian Renewable Energy Agency’s Competitive Solar Round, boosting NSW’s lead in large scale solar. A sixth solar farm is under construction near Goulburn and will be
and demonstrating a more reliable and diverse renewable energy model.
• Household solar penetration
15% of households with solar PV.
Western Australia (WA):
• Policy
Despite its excellent renewable energy resources, Western Australia has lagged behind other states on renewable energy. It is the only state or territory without a target to increase renewable energy or achieve net zero emissions by 2050.
• Renewable power
Although there is an absence of a formal renewable energy and emissions reduction targets, the state government has committed to investing in research into renewable energy and battery technology. A commitment of A$19.5 million has been made to renewable energy projects in Albany including the deployment of wave energy technology, development of common user infrastructure to facilitate connection of wave energy with the State’s electricity grid, and the establishment of a Wave Energy Centre of Excellence.
• Household solar penetration
The third highest proportion (25.4%) of households with solar PV.
Queensland (QLD):
• Policy
In July 2017, the Queensland Government announced a new emissions target to achieve net zero emission by 2050, in addition to its target of 50% renewable energy generation by 2030.
• Renewable power
Queensland has experienced strong growth in its large-scale renewable energy industry, with almost 1,200MW
commercial arrangements as of July 2017. Australia’s largest solar power plant has also been approved near Wandoan in Queensland and when built, the 1,000MW solar farm will be among the largest solar power plants in the world. The Powering Queensland Plan, worth A$1.16 billion (released in 2017), aims to deliver stable energy prices, ensure long-term security of electricity supply, transition to a cleaner energy sector, create new investment and jobs, improve large-scale renewable project facilitation, planning and network connection.
• Household solar penetration
It has the highest proportion i.e.32% of households with solar PV and target to install 1 million solar rooftops or 3,000MW of solar photovoltaics by 2020.
Victoria (VIC):
• Policy
In 2017, Victoria government legislated its renewable energy target of 25% by 2020 and 40% by 2025 and a net zero emissions target by 2050. The aim of Victoria’s targets is to encourage investment in renewable energy and increase the number of jobs, particularly in regional Victoria. The Victorian Government has proposed a reverse auction scheme to achieve its renewable energy targets, designed to deliver up to 1,500MW and 5,400MW of new, large-scale renewable energy projects by 2020 and 2025 respectively. Additionally, the state is also imposing some restrictions on fossil fuels which are a key driver of climate change and results in very high emissions in the state. For example, the Victorian Government has imposed a gas exploration moratorium which puts a permanent ban on onshore unconventional gas exploration in the state, with a moratorium on conventional onshore gas exploration until the end of June 2020.
• Renewable power
Has successful large scale renewable projects in place which include the 30MW Kiata Wind Farm and the 66MW Gellibrand Wind Farm that commenced operation in late 2017 and mid 2018 respectively. A proposal for a 250-wind
Pty Ltd was presented in 2017 to the Victorian government, which if built, could potentially provide 18% of Victoria’s electricity needs, capable of powering 1.2 million homes.

215
Aust
ralia
215
Northern Territory (NT):
• Policy
After very little progress in the past few years, pursuing a 50% renewable energy target by 2030 is a major step
targets or policies were in place to encourage renewable energy. In 2017, a panel of experts was established, which formulated a Roadmap to Renewables report to provide the Northern Territory Government with advice, options and recommendations on how best to achieve the target.
• Renewable power
The Northern Territory has also taken steps on energy storage. At the end of 2017, the state government-owned electricity provider installed a 5MW battery storage system in Alice Springs to support increased generation from solar power.
• Household solar penetration
Has the lowest proportion i.e11% of households with solar panels, despite the high electricity cost.
Topic Box 1.1: Criticisms of National Energy Guarantee policy
Despite the government’s push towards implementing the National Energy Guarantee (NEG), the policy is facing opposition from some of the states and criticisms from renewable experts and industry analysts.
• Emissions obligation proposed under Australia’s National Energy Guarantee lacks ambition; various activists group, industry experts and representative bodies are urging the state governments to torpedo the policy in its current form or lend support only on basis of select conditions.
– The policy propagates deployment of 2,500-6,700 MW of renewable energy projects between 2020-2030, however, since 4,300 MW of large-scale renewable energy projects are already in process currently, this implies no or very little renewable energy projects to be installed between 2020-2030.
– Moreover, the Energy Security Board designed the NEG policy assuming the lower or the bare minimum limit of 2030 target i.e. 26% cut in energy sector emissions from 2005 levels by 2030. However, the policy does not yet have any provision for reducing the emissions beyond the stipulated level and thus, is not aligned to the comparatively robust renewable energy target set by some of the states - John Grimes, the chief executive
solar industry) was of the opinion that NEG’s emissions reduction target for electricity of 26% on 2005 levels by 2030 was considerably less ambitious than Queensland’s state target of achieving 50% renewables
by 2030.
– State-based renewable energy schemes such as the Victorian Renewable Energy Target and the Powering Queensland Plan will be acknowledged under NEG, however, any new renewable energy capacity installed as part of these schemes will be incorporated into the national emissions reduction target of 26%. A number of states have expressed opposition to this requirement, claiming that it will result in some states taking on more of the emissions reduction burden than others.
– As an alternate, the Smart Energy Council as well as environmental groups including Australian Conservation Foundation put forth that, the states should consider providing support only on the condition that the Australian government increased the
they should deal themselves out of driving emissions reduction.
• The policy has also been criticized for not being inclusive enough in its approach.
– As a part of the proposed plan, NEG will apply only to National Electricity Market (NEM) which excludes Western Australia and Northern Territory – this implies that post 2020 these two regions have no emission reduction targets in place.
Implementing the NEG requires consensus from the states and territories, with any jurisdiction having the power to reject the policy. It is also possible for jurisdictions to abstain in deliberations of the
of Australia to the National Farmers Federation, to the Clean Energy Council (the peak body for the renewables industry), is urging the government and the states to come to terms, and settle the decade-long climate and energy wars.

216 A Strategic Overview of the Global Energy MarketsA Strategic Overview of the Global Energy Markets216
2-Energy Transition
Robust growth in rooftop solar industry
• More than 1.1 GW of solar PV was installed in the small-scale market in 2017, eclipsing the previous best record in 2012.
• As per data by Clean Energy Regulator, more than one in
on their roof, which represents the highest rate per capita in the world.
Commencement of operation of the much touted Tesla battery at Neoen’s Hornsdale Wind Farm in South Australia
• Installation of the world’s largest lithium-ion battery in 2017 thrust energy storage into spotlight.
• It already proved its mettle responding quickly when the
generators to help stabilize the electricity system.
2017 was overall marked as a year of positive developments in the renewable energy front, despite the marginal decline of 2% in renewables share, owing to low hydro output
• Clean Energy Regulator announced that there are enough projects now committed to meet the 2020 Renewable Energy Target: 700 MW of renewable projects were completed in 2017 and seven times that amount were already under construction by the end of the year.
• Generation in renewable energy were largely driven by wind and solar, both of which recorded increase in
contribution of wind in nation’s electricity generation, was at par with hydro, both accounting for about 6% share.
• Tasmania continues to lead in renewable energy with 88% penetration rate – however, lower rainfall in catchment area pushed down its hydro output and therefore the penetration rate from 2016.
Boom in large-scale renewable projects, driven by declining prices of solar and wind
• Large scale solar and wind projects attracted investment worth A$11.7 billion in Australia i.e. 150% higher than 2016.
• Tremendous amount of activity witnessed in wind sector with 547 MW of new capacity added in 2017- the third highest amount in the history of the Australian wind industry.
As the momentum for adoption of renewable energy especially around solar and wind continues to build through 2018, Australia appears to be well-positioned to meet its 2020 Renewable Energy, mostly driven by state-level initiatives.

217
Aust
ralia
Renewable Energy Generation in Australia
Clean energy industry is on the verge of a major breakthrough – 16 renewable energy projects were completed in 2017, which amounted to 701 MW of capacity and 34 renewable projects were under construction at the end of 2017, which is expected to generate 2,563 MW of capacity, on completion.
• Although 2017 was a record year for the renewable energy sector, contribution of renewable energy in Australia’s total electricity generation fell slightly from 17.3% in 2016
decline in hydro generation due to reduced rainfall in catchment areas.
• Wind and solar continued to drive electricity generation from renewable sources - both exhibited increase in their percentage share over 2016.
– A key driver of investment in renewable generation has been the large-scale renewable energy, which has made a remarkable progress evident from the 450 MW of large-scale solar capacity that has now been built across the country, up from just 34 MW at the end of 2014. Additionally, 21 large-scale solar projects also commenced their construction at the beginning of 2018.
– Rooftop solar experienced a robust growth in 2017 owing to growing interest from the commercial sector as well as a growing number of households investing in solar panels.
– 2017 was a successful year for wind power as well, with 547 MW of new capacity installed and more than a dozen projects actively underway.
State governments have undertaken various initiatives to maximize their share of the billions of dollars in investment on renewable energy, as well as to help reduce emissions. Tasmania recorded the highest penetration in renewable energy, followed by South Australia.
Tasmania:With its extensive hydro power network supplying more than 90% of the state’s energy needs, Tasmania has traditionally been Australia’s renewable energy leader. However, below average rainfall in catchment areas compared to previous year, resulted in lower penetration of renewable energy in 2017.
• In April 2017, Tasmanian government announced the ‘Battery of the Nation’ initiative which encourages undertaking studies and projects that would boost Tasmania’s clean energy generation. As a part of the initiative, the state government is collaborating with ARENA and focusing on studies into three areas including – role of Tasmania in future NEM, pumped hydro storage assessment and hydropower system improvement.
• The state is currently undertaking feasibility studies which has the potential to double the state’s renewable energy capacity from 2,500 MW to 5,000 MW through pumped hydro storage, wind farms and upgrades to existing hydro power facilities.
• north-west being touted as ‘Australia’s wind farm capital’ - The Robbins Island Renewable Energy Park is a proposal for a 450 MW project, with the possibility of being expanded to 1,000 MW , which would make the wind farm the largest in the Southern Hemisphere.
Figure 2.1. Electricity Generation: Renewable vs. Fossil
17.3%
82.7%
16.9%
83.1%
Renewables Fossil fuel
Annual Electricity Generation
0%
10%
20%
30%
40%
50%
60%
70%
80%
90%
100%
% sh
are
in t
ota
l re
new
able
ge
nera
tio
n
Total: 41,944 GWh
Renewable Generation by Technology Type
Total: 38,138 GWh
2016 2017
Hydro Wind Small-scale solar PV
Bioenergy Large-scale solar PV Medium-scale solar PV
Solar thermal
Renewable Energy Penetration by State
5%
12%
13%
16%
48%
93%
8%
11%
14%
16%
45%
88%
0% 20% 40% 60% 80% 100%
% share of renewable in total electricity generation
2017 2016
42.3%
33.9%
30.8%33.8%
16.0%20.3%
8.6% 9.7%1.2%
1.0%
2017
2018
1.8%
0.4%0.1%0.1%
Queensland
New South Wales
Western Australia
Victoria
South Austral ia
Tasman ia
Source: Clean Energy Australia – Clean Energy Council (April 2018 and 2016)
217

218 A Strategic Overview of the Global Energy MarketsA Strategic Overview of the Global Energy Markets218
South Australia:
• South Australia had set a robust target of 50% renewables by 2050, which it had almost achieved in 2017, with 45% of the state’s electricity coming from renewable sources. However, renewable energy penetration recorded a decline over 2016, primarily owing to two factors:
– Restrictions on wind output by Australian Energy Market Operator (AEMO): In the wake of a massive blackout in 2016, AEMO introduced a rule since July 2017 that required a minimum amount of “synchronous” generation, which if not met would restrict the wind output to a maximum 1,200 MW unless four gas units are operating in the state: In July 2017, wind output was curtailed thrice in the month as strong winds in southern states pushed wind generation very near to full capacity, but the withdrawal
gradually relaxing the constraints as it undertakes more studies on how the system can be managed with growing share of variable renewables – in late 2017, it published a notice increasing the maximum wind output to 1,295 MW from 1,200 MW.
– Gas deal signed between Engie and Origin Energy, amid
deal was intended to meet the gap in energy supply post closure of Hazelwood coal plant, which supplied electricity to SA through the interconnector. As a part of the deal, Engie’s Pelican Point generator started operating both its units continuously from second half onwards which resulted in two to three times as much as gas powered electricity generation in the second half of the year.
• In March 2018, the state elected a Liberal government which is currently focusing on two key elements including - a A$200 million interconnection fund to improve the state’s connectivity with the National Electricity Market and a A$100
grants.
• The new government has also promised support for storage at the household level and has backed the 220 MW Bungala Solar Farm situated near Port Augusta. Once completed, it will be Australia’s largest solar farm, generating enough electricity to power 82,000 Australian households.
Victoria:
• Victoria started undertaking and driving the transition to renewable energy more seriously from August 2017, when it legislated its state based renewable energy target of 25% by 2025 and 40% by 2050.
• The state government intends to meet these targets through the Victorian Renewable Energy Auction Scheme, which is a reverse auction to fund 650 MW of new renewable energy,
scheme is the largest renewable energy reverse auction in
energy projects in Victoria.
• It is a condition of the auction that the successful projects will begin commercial operation before the last quarter of 2020, with an overarching goal of reducing greenhouse emissions by 16% by 2035, and eventually achieving its legislated net-zero emissions target by 2050.
Western Australia:
• WA has traditionally lagged behind other states in terms of renewable energy target, but during 2017 more than 1000 MW of wind and solar projects were seeking connection
• In late 2017, the WA government announced that state-owned power utility Synergy will set up a green power fund with investment from the Dutch Infrastructure Fund.
• The Australian Energy Market Operator (AEMO) estimates that another 700 MW of new renewable energy capacity will be required to meet WA’s share of the Renewable Energy Target.
NSW:
• The government’s Climate Change Fund Strategic Plan aims to double the state’s level of renewable energy capacity to more than 10,000 MW by 2021 - NSW was one of the leading states for new large-scale renewable energy projects at the beginning of 2018, with the government approving 11 large-scale solar energy plants in the previous 12 months.
• Notable projects currently under construction or beginning in 2018 include the 170 MW Finley Solar Project in the Riverina, the 270 MW Sapphire Wind Farm in New England and the co-located White Rock Wind and Solar Farms, which will generate almost 400 MW of renewable energy upon completion.
Queensland:
• In 2017, only eight percent of Queensland’s electricity came from renewables, however, the state is poised to witness a remarkable growth in the share of renewable electricity generation over the coming years, driven by variety of policies and programs that are underway to help the state meet its Renewable Energy Target.
• As part of the A$1.16 billion Powering Queensland plan, the government’s Renewables 400 initiative held a reverse auction for up to 400 MW of new renewable energy capacity, including 100 MW of new storage. Renewables 400 attracted 115 proposals from 79 businesses, adding up to more than 9000 MW of new capacity, which is more than 20 times the amount needed.
• Several areas of Queensland have emerged as large-scale solar hubs, including Townsville in North Queensland and the Darling Downs west of Toowoomba ; it also has the largest number of rooftop solar installations among any state or territory, as well as eight of the top ten solar postcodes in the country.

219
Aust
ralia
219
Investments in Renewable Energy
Australia is witnessing an unprecedented construction boom in large-scale renewable energy projects. According to Bloomberg New Energy Finance data, large-scale wind and solar project activity pushed investment in Australia up 150% to a record A$11.7 billion in 2017
Several factors have contributed to this spike in investment including:
• Extraordinary cost reductions in renewable energy:
– New renewable energy such as wind and solar power is now cheaper than new coal or new gas plants and the trend is likely to continue through 2050.
– The cost of renewable energy in power purchasing agreements (PPAs) is also steadily declining making it a highly competitive option for businesses seeking contracts for energy supplies. For example:
– During 2017, Origin Energy sold the Stockyard Hill Wind Farm to Goldwind Australia for A$110 million and agreed to buy all the power generated by it for less than A$60/MWh.
– Meridian Energy signed up for more than twice the amount of renewable energy it had intended in early 2018 while negotiating PPAs (Purchasing Power Agreements) for its retail business Powershop Austral.
• Additional support from the Australian Renewable Energy Agency and the Clean Energy Finance Corporation:
– Clean Energy Finance Corporation (CEFC) have made
commitments of more than A$4.3 billion for projects worth over A$11 billion (as at 30 June 2017).
– Australian Renewable Energy Agency (ARENA) have made commitments of more than A$1 billion coupled more than A$2.5 billion in co-funding (as at 30 June 2017).
– ARENA also recently announced a A$370 000 funding for a micro-grid designed to test the feasibility of a local energy marketplace of connected energy users who can buy and sell locally produced renewable energy. The virtual micro-grid will incorporate solar PV serving around 200 dairy farms.
• Various state and territory government initiatives:
– The government is supporting carbon capture and storage (CCS) to capture emissions from power plants and industrial sites. It has also introduced a Bill to the Parliament to remove the CEFC’s prohibition from investing in CCS technology.
– South Australian government has invested up to A$110 million for a new concentrated solar thermal power plant in Port Augusta and supplementing funding would also be made available through ARENA and the CEFC, if required.
Figure 2.2. Projected Average Levelized Cost of Energy (A$/MWh)
0
20
40
60
80
100
120
140
160
180
200
92 91
138
172
83
123
76 8179
61
87
109
93
135
75 81
70
49
69
87
96
145
75 80
Me
an L
CO
E (A
$/M
Wh)
Wind Large-scale SolarPhotovoltaic
Large-scale SolarPhotovoltaicwith storage
Solar Thermalwith storage
Gas CCGT Gas OCGT Supercritical coal Ultrasupercriticalcoal
2020 2030 2050
Alternative Energy Conventional Energy
Source: Clean Energy Australia — Clean Energy Council (April 2018 and 2016)

220 A Strategic Overview of the Global Energy MarketsA Strategic Overview of the Global Energy Markets220
By 2050, cost for alternative energy (including wind and solar) is expected to decline by an average of 40%; highest decline is likely to be witnessed in solar PV with storage and solar thermal with storage segments.
• Cost for both large-scale solar PV with storage and solar thermal with storage is expected to fall 37% by 2030 and a further 20% by 2050.
• expansion opportunities for energy storage market, driven by favorable public policies and innovation around storage technology.
With a substantial project pipeline, the country is well placed to experience a robust year in 2018 and is on track to meet its 2020 Large-scale Renewable Energy Target.
• The Clean Energy Regulator (CER) had previously estimated that approximately 6,000 MW of large-scale generation capacity has to be built between 2016 and 2019 to meet the target of 33,000 GWh of renewable energy by 2020.
• 6,532 MW of new large-scale generation have been announced since 2016, and in 2017, CER chair David Parker highlighted that Australia has already reached a major milestone ahead of schedule.
– Out of 6,532MW of new large-scale generation announced, close to 96% i.e. 6,239 MW (amounting to 42 projects)
or expected to commence in 2018.
– Furthermore, the CEC highlights that projects in the 2018 construction pipeline (i.e. currently under construction or will commence soon) are poised to deliver about A$9.7 billion in investment, with a total of 5,354 direct jobs created at the construction sites.
Queensland will witness the bulk of the construction, followed by South Australia, Victoria and NSW.
• Of the 42 large-scale renewable projects that reached
pipeline, 18 are from Queensland, followed by South Australia with eight and Victoria and New South Wales with seven projects each.
• Western Australia and Tasmania currently have one project each in the construction pipeline.
• The total of 42 also incudes 12 projects across the states of NSW, Queensland and Western Australia that were funded by ARENA Australian Renewable Energy Agency (ARENA) through a A$91.7 million grant in 2016.
Solar is an important emerging player in the energy mix and solar farms will continue to proliferate across Australia beyond 2018.
• Smart Energy Council estimates that the nation’s large-scale solar capacity is set to soar by 2.5 to 3.5 GW, with nearly 30 new solar farms scheduled to come online in 2018 alone, the majority being in Queensland and NSW – this estimate is aligned to the statistics released by Clean Energy Council, which states that 3.1 GW of solar are under construction or will commence soon in 2018, with Queensland accounting for nearly 46% of the new capacity.
• Meanwhile, merchant development1 is gathering pace, indicating the attractive economics of large-scale solar in Australia. Although merchant projects have typically
future energy prices and the requirement from most major Australian lenders for a PPA, the market now seems to have
2 partner. More projects are starting to proceed on a merchant basis, often as a result of accessing funds from overseas in the form of private equity.
Figure 2.3. Large scale renewable energy projects under construction or starting in 2018
NT
QLD
WA
SA
VIC
TAS
NSW
10MWWA$20
million investment
30 jobs
1,521 MWW
A$2,400 million
investment1,325 jobs
112 MWW
A$280 million
investment208 jobs
1,364 MWW
A$1,980 million
investment850 jobs
TOTALS
6,239 MW
A$9,780million investment
5,354 jobs
787MWW
A$1,240 million
investment425 jobs
2,445 MWW
A$3,861 million
investment2,516 jobs
Source: Clean Energy Australia – Clean Energy Council (April 2018)

221
Aust
ralia
221
Outlook for small-scale renewable energy also looks promising- almost 1.1 GW of rooftop PV was installed in the small-scale market in 2017 and given the rate at which electricity prices are increasing, solar industry is expected to exhibit a strong growth in 2018 as well
•
electricity, making solar and storage increasingly attractive
are now available like merchant development - this medium-scale section of the market has been driving a large part of the growth over the last few years.
• In addition, households in outer suburbs and regional towns will continue to turn towards small-scale renewable energy to help protect them from future price hikes.
• As per Solar consultancy SunWiz, high electricity prices coupled with good momentum in the sector and a robust market is likely to drive rooftop solar PV installation in residential and SME market to more than 1.2 GW in 2018.
The rooftop solar sector has reported a shortage
backdrop of unprecedented level of industry activity
• At the end of 2017, many established solar retailers were reporting that the increased level of activity sometimes made
all the work that was coming in, and these market conditions helped trigger a steady increase in the number of accredited solar installers.
• As per statistics released by the Clean Energy Council, the number of installers accredited by end of 2017, had grown to 4,941 which was slightly more than the 4,824 registered at the end of 2012, which was the previous highest year for the sector.
• The number of new accredited installers per month increased from 60 in 2016 to 96 in 2017, registering a 60% growth.
The way forward, beyond 2018
• energy, evident from the large-scale pipeline, the dynamics will inevitably change once the 33,000 GWh target is met.
• out is most likely to continue being fueled by other drivers
investment from industrial users and large corporates as they
• 3 under the Large-scale Renewable Energy Target (LRET)4 is likely to decrease, as the amount of renewable energy built
in excess of the volume needed to meet the 2020 RET, thus resulting in excess supply and price fall.
1 Merchant developers build commercial buildings and sell it out for profit
2 Off take is an agreement that is negotiated usually before the construction of a natural resource facility in order to secure a market for the future output of the facility. The off-take partner or lender wants a guarantee that some of its product will be sold and negotiates with the buyer to purchase or sell a portion of its future production
3 Large-scale generation certificates (LGCs) are based on the amount of eligible renewable electricity produced by the generators above their baselines. These certificates act as a form of currency and can be sold at a negotiated price to the retailers, who are required to surrender a set number of certificates to the Clean Energy Council (CEC) each year
4 LRET is a scheme that encourages investment in renewable power stations to achieve 33 000 GWh of additional renewable electricity generation by 2020. Power stations accredited in the LRET are able to create LGCs (Large Scale Generation Certificate) for electricity generated from that power station’s renewable energy sources and can sell of the LGCs to liable entities (mainly the retailers) and help them meet their compliance obligation with Clean Energy Council

222 A Strategic Overview of the Global Energy MarketsA Strategic Overview of the Global Energy Markets222
Energy Storage Investments in Australia
The most crucial milestone in energy storage was achieved in 2017 with the construction and commissioning of the world’s biggest lithium-ion battery in South Australia, installed by Tesla and owned by Neoen.
• Tesla also reported a surge in sales of its commercial energy storage products and has won a number of other contracts since then, including the 20 MW battery that will be linked to the 196 MW Bulgana Wind Farm in Victoria, and will provide Australia’s biggest greenhouse with 100% renewable energy.
The way forward - adoption of battery storage technology expected to gain further traction in coming years
• German battery maker Sonnen announced that it would be transferring its operations from Sydney to Adelaide - it will manufacture 50,000 energy storage systems in Adelaide over
year deal with the South Australian Government.
• A number of companies are also either exploring or actively planning to build new pumped hydro facilities, including Genex Power’s project at Kidston near Townsville in North Queensland and Tilt Renewables’ pumped hydro plant project at a decommissioned quarry north of Adelaide.
Figure 2.4. Residential energy storage system installation
0
5,000
10,000
15,000
20,000
25,000
Inst
alla
tio
ns (
000’
)
Total Installations 2015-2017
500
6,750
20,789
2015 2016 2017
NT
0%
QLD
19%WA
5%SA
11%
VIC
17%
TAS
4%
NSW
42%
Installations by State, 2017
Source: SunWiz, 2018 Battery Market Report, March 2018
• The lithium-ion battery is situated alongside the Hornsdale Wind Farm and has been constructed in partnership with the South Australian Government and Neoen, the French company that owns the wind farm.
• The battery has a total generation capacity of 100 MW and 129 MWh of energy storage - this is reportedly capable of powering more than 30,000 homes.
• It is charged using renewable energy from the wind farm and then delivers electricity during peak hours to help maintain the reliable operation of South Australia’s electrical infrastructure.
Impact of the installation:
• the Tesla battery proved its worth responding quickly when
delivering 100 MW into the national electricity grid in 140 milliseconds.

223
Aust
ralia
223
Household battery activity is gaining momentum in the country, driven by VPP and other state government initiatives like ‘Battery of the Nation’ initiative by Tasmania. Investment in domestic battery storage systems is expected to increase as prices come down to a level where they become
• storage systems were installed in 2017, representing a three-fold increase on the installations in 2016.
• On a state-by-state basis, nation’s highest storage installation was estimated to be in NSW, followed by Queensland, Victoria and South Australia.
• SunWiz predicts that 300 MWh of distributed systems will be built across 33,000 installations, along with 136 MWh of projects by the end of 2018 – this is expected to more than double the number of storage systems installed since 2017.
Hydro power has traditionally been Australia’s leading form of renewable energy and it accounted for almost 34% of Australia’s clean energy and 5.7% of total electricity generated in 2017. There are more than 120 active hydro power stations in Australia, with most of the nation’s hydroelectricity generated by Hydro Tasmania’s network of power plants and the Snowy Mountains Hydro Scheme in New South Wales.
• Overall hydro output in 2017 was low compared to the previous year principally due to below average rainfall in catchment areas compared with the year before.
• With the support of ARENA, Australian National University
across Australia, mostly in NSW and Victoria – according
Australia attain the 100% RET.
• Initial studies from the ‘Battery of the Nation’ initiative of
in the state and is currently examining four large and nine small scale pumped hydro projects, boosting its capacity and creating a battery for the mainland.
• South Australia is undertaking a feasibility study into a
Australia to make use of seawater.
• Queensland plans to redevelop the Kidston mine site which will co-locate a large scale solar farm with a large scale pumped hydro project.
Proposal to expand the Snowy Hydro Scheme likely to be a game-changer for renewable energy in Australia
• In March 2017, Snowy Hydro announced plans to carry out a A$29 million feasibility study into a pumped hydro expansion of the Snowy Mountain Scheme which originally began in 1949 and generates on average around 4,500 GWh of clean energy each year.
• The feasibility study released in December 2017, showed
when complete, it will increase the Snowy Hydro Scheme’s generation capacity by up to 2,000 MW, and at full capacity will provide approximately 350,000 MWh of energy storage.
• Snowy 2.0 will act like a giant battery by absorbing, storing and dispatching energy – Pumped hydro works like a conventional hydro-electric scheme, but instead of releasing the water after energy generation, it will recycle or pump water back to the upper reservoir and store it there for further reuse at the time of peak demand. Snowy 2.0 can
also absorb excess wind capacity overnight to pump water uphill to reservoir, before letting it down again to spin turbines and generate electricity at times of peak demand.
Figure 2.5. % share of hydro in total Australian electricity generated in 2016 vs. 2017
7.3%
5.7%
92.7%
94.3%
0% 10% 20% 30% 40% 50% 60% 70% 80% 90% 100%
2016
2017
Hydro Others
Source: Clean Energy Australia – Clean Energy Council (April 2018 and 2016)

224 A Strategic Overview of the Global Energy MarketsA Strategic Overview of the Global Energy Markets224
it accounted for almost 34% of Australia’s clean energy and 5.7% of total electricity generated in 2017.
• 2017 saw a tremendous amount of activity in the wind sector, with 15 new wind farms either under construction or
• 547 MW of new capacity was added in 2017 (the third-highest amount added in the history of the Australian wind industry), which amounted to 4,816 of installed capacity at the end of 2017.
• The largest project in 2017 was the Ararat Wind Farm, with
additions.
• On a state-by-state basis, South Australia accounted for the largest share of 38% in total wind generated by the nation in 2017, followed by Victoria (32%) – rest of the states including Tasmania, Western Australia, NSW & ACT together accounted for 30% share in total wind generation.
Figure 2.6. % share of wind in total Australian electricity generated in 2016 vs. 2017
5.4%
5.7%
94.6%
94.3%
10% 20% 30% 40% 50% 60% 70% 80% 90% 100%0%
Hydro Others
2016
2017
Source: Clean Energy Council (April 2018)
Figure 2.7. Cumulative installed wind capacity (in MW)
8181,311
1,701 1,987 2,2202,584
3,233
3,818 4,181 4,3504,816
2007 2008 2009 2010 2011 2012 2013 2014 2015 2016 20170
1,000
2,000
3,000
4,000
5,000
6,000
Cap
acit
y (M
W)
Source: Clean Energy Council (April 2018)
2017 was a record year for Australia as it achieved a total installed capacity of more than 1.1GW, surpassing the previous best in 2012. Small-scale solar PV accounted for about 20% of Australia’s clean energy and 3.4% of total electricity generated in 2017.• In 2017, installed capacity of the solar PV systems increased by
50%, whereas the number of annual new-built increased by only 35%. This is because fewer systems with larger capacity were installed i.e. more commercial sized systems were installed, targeting the small and medium sized businesses.
• Annual installations rebounded in 2017, largely driven by falling price of solar panels and the rising cost of grid power.
• In 2017, Queensland had the highest penetration both in terms of number of annual solar PV and capacity installed - Eight out of the top ten solar postcodes were in Queensland, continuing a trend of several years.
• the agriculture sector - Leading egg producer Pace Farms invested A$3.2 million in three separate solar projects across its New South Wales operations in 2017.
• South Australia which already has a well-developed rooftop solar PV industry had relatively lesser new installations in 2017, compared to other regions.
• The strong growth witnessed in small scale solar sector has translated into increased employment opportunities, with the number of new Clean Energy Council Accredited Installers per month growing by 60% in 2017.
Figure 2.8. Regional Split 2017
Regional Split: 2017
States Solar PV installed annually (% share) Annual installed capacity (% share)
QLD 27% 28%
NSW 25% 23%
WA 19% 17%
VIC 17% 17%
SA 9% 10%
TAS 1% 1%
NT 1% 1%
ACT 1% 1%
TOTAL 179,457 1,125 MW

225
Aust
ralia
225
Figure 2.9. % share of small-scale solar (up to 100 KW) in total Australian electricity generated in 2016 vs. 2017
2.8%
3.4%
97.2%
96.6%
0% 10% 20% 30% 40% 50% 60% 70% 80% 90% 100%
2016
2017
Small-scale solar PV Others
Source: Clean Energy Council (April 2018)
Figure 2.10. Annual solar PV installations and installed capacity (up to 100 KW)
0
50
100
150
200
250
300
350
400
Num
ber
of
sola
r P
V s
yste
ms
inst
alle
d a
nnua
lly (‘
000)
2007 2008 2009 2010 2011 2012 2013 2014 2015 2016 2017
4 14 66 198 361 343 200 180 141 133 179
0
200
400
600
800
1000
1200
Inst
alle
d c
apac
ity
(MW
)
Solar PV systems installed annually Annual installed capacity of solar PV
6 20 85
383
855
1,013
811 801707 749
1,125
Source: Clean Energy Australia – Clean Energy Council (April 2018)
Topic Box 2.1: Revolution in rooftop solarSmall-scale rooftop solar panel installations have been steadily increasing in Australia under
Australian households now have solar panels installed on their roof, and this represents the highest rate per capita in the world.
• Rooftop solar experienced its best ever year in 2017 in terms of installed capacity and continues to gain momentum owing to growing interest from the commercial sector, as well as a growing number of households investing in solar panels.
• As of August 2017, the number of small-scale solar panel installations on Australian household roofs passed 1.8 million, with a capacity of six GW—enough to power more than 1.8 million homes or every home in Sydney.
• According to AEMO’s forecasts, 25-40% of Australia’s electricity will be coming from rooftops solar by 2040, and 45% by 2050.
• While the commercial sector has been the biggest driver of growth in the rooftop solar segment, organizations such as universities, schools and government bodies have
new projects commissioned in 2017 include Australia Post’s 2.1 MW rooftop solar system at its Chullora sorting centre in Sydne- the largest single-roof solar system in Australia, and the installation of a 1.8 MW rooftop solar system at Charles Sturt University’s Wagga Wagga campus.
• Recognizing the important role that communities and household solar play in Australia’s transition to a low emissions economy, the Federal government announced the A$5million Solar Communities Program in 2017- this was aimed at providing funding for community groups in selected regions across Australia to install rooftop solar PV, solar hot water and solar, connected battery systems at their facility to reduce emissions, electricity cost and support transition to renewable energy.
While high penetration of rooftop solar is a positive outcome for Australia, this also
going forward, which needs to be addressed to
• Australian households, especially those with rooftop solar are expected to adopt more residential batteries to store solar energy, as their prices fall and the technology
Energy Resources (DER) represents a huge disruption for the National Electricity Market.
• AEMO now to predict the demand for electricity from households, given the rapid deployment of solar and batteries that the market operator has no visibility over – as a part of the national accreditation scheme, they can only track where rooftop solar is installed but not how much electricity is being generated. Therefore, AEMO faces the challenge of balancing supply and demand, and
• If these small scale assets are orchestrated collectively, it has the potential to displace the need for grid scale power stations and consequently cut the electricity bills, however, if these are not monitored and optimized fully, it could lead to instability in future Australian electricity system and even higher energy costs.
• In order tackle these plausible challenges, AEMO has proposed for developments in DER monitoring and management standards and also the way distributed resources are integrated. The key suggestions put forth include:
– Incentivizing people to allow access to their solar and battery storage devices and appliances
– New market rules to allow these unregulated assets to be properly valued as part of the energy mix.

226 A Strategic Overview of the Global Energy MarketsA Strategic Overview of the Global Energy Markets226
3-Infrastructures & Adequacy of Supply
AEMO focused on various initiatives to
summer, especially related to demand supply forecasting
• AEMO is investing in tools, systems, on-site meteorologist and weather forecast suppliers for real time alerts, to improve their preparedness in case of adverse situations.
• Initiatives are being undertaken to improve visibility on Distributed Energy Resources (DER), in order to factor that into demand forecasting models – AEMO intends to continue improving its demand and supply forecasting models including forecasting peak demand with the help of machine learning techniques.
• forecast – it is exploring options like satellite imagery to improve the Australian Solar Energy Forecasting System (ASEFS), which provides forecast on large-scale solar farms and residential rooftop PV.
Thorough planning by AEMO ensured a robust system performance in the NEM during the summer of 2017/18– no consumers experienced interruptions to their electricity supply due to shortage
• to meet market demand during the summer of 2017/18 and accordingly undertook various initiatives to generate additional resources amounting to 2,000 MW- of this, 98% amounting to 1,974 MW was ultimately generated.
• The additional resources were sourced by:
– Reopening three mothballed gas-powered-generators across South Australia, Queensland and Tasmania which led to generation of 833 MW of additional resources in NEM
– 867 MW of additional resources was procured through demand response programs via Reliability and Emergency Reserve Trader (RERT).
In collaboration with Transmission Network Service Providers (TSNPs), AEMO completed all network upgrades and ensured network availability during summer of 2017/18
• Upgraded Heywood Interconnector and access to full capacity of the Murraylink Interconnector, both increased the capacity at South Australia and Victoria.
• All risk management activities pertaining to planned maintenance were completed before summer, to ensure continuous network availability.
• The number of unplanned transmission outages reduced
2016/17.
During the summer of 2017/18, AEMO successfully met the objective of delivering a
by collaborating closely with TSNPs and other industry participants.
For summer 2018-19 and future years, AEMO aims to pursue further initiatives on improving forecasting mechanisms, ensuring provision of strategic reserves and unlocking potential of distributed resources.

227
Aust
ralia
227
Increased generation and demand resources in the NEM for summer 2017/18
the risk of load shedding arising from withdrawal and temporary discontinuation of some generation capacity from the market due to commercial reasons. Accordingly, it had planned action points to bring about 2,000 MW of additional resources to the NEM, of which ultimately 1,974 MW were made available. This included two major components.
Market generation resources worth 833 MWAfter AEMO highlighted the potential supply shortfall for the summer of 20017/18, the market responded by returning previously mothballed gas-powered-generation (GPG) capacity worth 833 MW to service. This included:
• Pelican Point Power Station (South Australia), which returned to full capacity from July 2017, adding 240 MW
• Tamar Valley Power Station (Tasmania), which returned its combined-cycle gas turbine (CCGT) plant to service from May 2017, adding 208 MW
• Swanbank E Power Station (Queensland) was operational earlier than projected, from December 2017, adding 385 MW.
generation reserves worth 1,141 MW through existing RERT (Reliability and Reserve Trade) arrangementsRERT is a function conferred on AEMO under the National Electricity Rules (NER) that allows AEMO to reserve contracts and procure additional generation or load reduction capacity (not available to the market) if needed, to ensure reliability of supply and maintain system security.
• A total of 1,141 MW of resources was available via RERT in the summer of 2017/18, including generation resources worth 274 MW and demand resources worth 867 MW.
• RERT generation resources : Emergency diesel generation amounting to 170 MW in South Australia and 104 MW in
• RERT demand resources: Of the 867 MW of resources available through demand response programs, Victoria accounted for 712 MW, followed by 129 from NSW and
delivered through the joint AEMO/ARENA demand response trial.
– The demand response trial is a three year initiative that started in summer 2017/18 to pilot demand response projects across Victoria, SA and NSW. The trial has delivered 141 MW in year 1 and is expected to deliver
– The pilot projects require energy users from both commercial and industrial segments to volunteer to conserve their energy for short periods during peak demand events and dispatch the reserves to AEMO, in lieu of usage charges/monetary incentives under RERT agreement.
Figure 3.1. Additional resources for summer 2017/18 (in MW)
Cap
acit
y (M
W)
1, 974 MWTOTAL0
100
200
300
400
500
600
700
900
800
Victoria South Australia Queensland Tasmania New South Wales
34
Total re-opened generation resources
833 MW
Total RERT generation resources
274 MW
Total RERT demand response resources
867 MW
Re-opened generation RERT generation resources RERT demand response resouces
240
385
208
104
170
71226
129
Source: Summer 2017-18 operations review (May 2018)

228 A Strategic Overview of the Global Energy MarketsA Strategic Overview of the Global Energy Markets228
Figure 3.2. AEMO/ARENA demand response trial for summer 2017/18, by sector and region
15%
15%
30%
40%
Demand response resources from
AEMO/ARENA trial: 141 MW
Residential
Commercial Industrial
Network
18
61
62
0 10 20 30 40 50 60 70 80
South Australia
New South Wales
Victoria
Capacity (MW)
Source: AEMO Summer 2017-18 operations review, May 2018
Improved performance of generators and fuel availability during the period of summer
Generators cooperated with AEMO to minimize the amount of time of generation unavailability during summer due to planned maintenance outages. This included identifying planned outages and moving them to either before or after summer where possible
• systems when generators were bidding to supply to the market.
• AEMO also observed a noticeable improvement in the accuracy of generator’s bidding capacity under high ambient temperatures compared to summer 2016/17.
• Generator bids and plant/unit availability issues were communicated promptly and accurately with AEMO well in advance.
• As a part of the future plan, AEMO intends to continue working with generators to further enhance communication on plant availability, to improve market transparency and short-term reserve management.
Throughout summer, AEMO worked closely with industry participants to secure fuel supplies for gas,
accurately in their bids
Gas
• Longford Gas Plant in Victoria provided the four southern NEM regions (excluding Queensland) with more than twice the amount of gas as all other south-east Australian gas plants combined during the past summer.
• generation (GPG) occurred on 30 November 2017, when an unplanned outage at Longford reduced gas supplies to Victoria and was not capable of meeting forecast demand for GPG. In order to address this, AEMO issued a notice of a threat to system security in the Victorian gas market to increase gas supplies and enable GPG plants to continue operating to meet electricity demand.
•
Hydro
• Despite the reduction in hydro output in Tasmania over 2016,
across the NEM to operate under their normal operating and market conditions.
• There was no report of any hydro generator unavailability due to lack of water, before or during summer.
AEMO plans to continue to work with generators and the AER on improvements to the provision of information on any fuel limitations that may impact capacity or reserves in the NEM. Quality information provided to AEMO is essential for the security and reliability of the grid, and to maximise transparency for AEMO in its decision-making.

229
Aust
ralia
229
Maximizing network availability and network upgrades in Australia
AEMO worked proactively with Transmission Network Service Providers (TNSPs) to ensure network availability during the critical summer period of 2017/18, which resulted in a robust system performance during that time.
Through the Power System Security Working Group, AEMO and TNSPs undertook various action initiatives including:
• Completion of risk management activities like maintenance
• No planned maintenance on days of high demand during summer, especially where lack of Reserves (LOR) shortfalls
• Completion of planned interconnector and other transmission network upgrades before summer, to support inter-regional energy transfers. This included:
– Upgrade of the Heywood Interconnector with an aim to increase the capacity at both ends i.e. South Australia and Victoria, through commissioning of two control schemes that ElectraNet has started working on since late December 2017
– Improving ability to access the full capacity of the Murraylink Interconnecter between South Australia (SA) and Victoria, during very high demand conditions.
• Introduction of proactive tripping schemes at SA wind farms to increase the power export capacity from SA to Victoria and ensure stable operation of the SA network in the unlikely event of the interconnector failing.
• In collaboration with TSNPs, AEMO is working to enhance the existing network through the implementation of other schemes that maximize the transmission capacity – like, short-term and emergency ratings of transmission elements that temporarily increase transfer capability under extreme operating conditions.
Outcomes of the actions for summer 2017/18
• Proactive collaboration between AEMO and TSNPs ensured
before summer, and there were no planned outages at peak times – AEMO allowed a total of 20 planned outages during summer and all of them were completed before the peak,
capacity.
• Voltage maintenance in low loads condition emerged as a key issue during the summer periods, which AEMO managed without any breach of operating limits. However, it intends to
market impacts.
– It plans to collaborate with the Energy Security Board and AEMC to explore market design changes that incentivize avoidance of minimum load conditions.
Figure 3.3. Number of unplanned transmission outages in NEM regions over summer 2017/18 vs. 2016/17
2016/17 summer 2017/18 summer
NSW VIC QLD SA TAS0
5
10
15
20
25
30
35
No
. of
un
pla
nn
ed o
uta
ges 29
12 11 9
6
25
8
23
Source: AEMO Summer 2017-18 operations review (May 2018)
There were unplanned transmission network outages in all NEM regions but none had an impact on reserve levels, system security, or reliability.
• There was a reduction in the number of unplanned outages across the NEM compared to summer of 2016/17 - this was
assets for the summer period.
• A reduction in the continuous rating of Basslink interconnector between Victoria and Tasmania, in early summer reduced some supply capacity in Victoria, however this risk was managed with the RERT AEMO procured as part of summer preparedness - Basslink’s capacity reduced from 594 MW to 478 MW, and it remains at this level until further notice.

230 A Strategic Overview of the Global Energy MarketsA Strategic Overview of the Global Energy Markets230
Operational Improvements
AEMO has been working with generators to improve its understanding of asset performance under severe operating conditions and also updated its forecasting tool to improve the visibility of risks in the power system and enable informed decision making. It has also implemented a range of additional
• AEMO is engaging with each scheduled generator in the NEM to better understand restrictions and risks of partial outages that could apply under high summer temperature conditions.
• understand the risk of unexpected reductions in the availability of scheduled generating units on days of extreme heat.
• It is also implementing a more robust process for generators to communicate the recall capability of their out-of-service generating capacity, to improve decision-making on intervention strategies.
Lack of Reserves (LOR) Thresholds
• they take into account risks of unexpected reductions in reserves due to factors not covered in the existing Rule. As
will also take into account a measure of reserve forecast uncertainty due to the risk of partial outages of scheduled
levels of demand and the availability of variable renewable generation.
• In October 2017, AEMO proposed changes to the National
the criteria and thresholds for AEMO to intervene in the NEM during peak demands. AEMC approved this proposition and
Improved Forecasting Mechanism
• AEMO is continuously developing its operational forecasting capabilities (especially around variable output) which is crucial in maintaining the demand supply balance in the system amidst growing share of solar and wind in the nation’s electricity supply. Current initiatives include:
– Updating demand forecasting models to take into account latent heat build-up and the modelling of micro-climate zones leading to improved forecasting accuracy during extreme conditions.
– Collaborating with weather forecasting suppliers to obtain detailed alerts on weather-related events that could impact power system operation.
– Developing tools and systems to provide real-time alerts when weather events cause forecasting uncertainty to increase.
– Deploying a resident meteorologist (from the Bureau of
– Rapid deployment of DER in the NEM presents challenge in short term forecasting. As a part of its future plan to address this issue, AEMO intends to:
– Leverage machine learning techniques to procure solar generation forecasts for 100KW to 30MW facilities
– Develop a Market Participant 5-minute forecast interface (MP5F) that will enable solar and wind facilities
– Model price elasticity for synchronized DER and demand response which responds to price signals
– In March 2018, implemented a project to improve the Australian Solar Energy Forecasting System using satellite imagery – this is expected to improve the forecasting for summer 2018/19.
Operator Training
• Increased operating training requirement from four days a year to 120 hours a year with focus on topics like system restart, dealing with complex environmental impacts on the power system, reserve and contingency management-
realized in the coming summers.
• The additional training provided to NEM operators ahead of summer was found to be valuable for the preparation for peak period. Through use of the NEM Simulator,
to simulated scenarios, which increased their situational awareness and ensured faster response time to events.

231
Aust
ralia
231
Topic Box 3.1: Additional jurisdiction actions in South Australia
AEMO, in collaboration with the local Transmission Network Service Providers and the South Australian government has been undertaking various initiatives to avoid repetition of the 2016 state-wide black out scenario, in events of peak demands
• In November 2017, AEMO reported on a range of actions that were underway arising from the South Australia black system which occurred in September 2016. A key focus of this work was to avoid a cascading failure of the South Australian power system in the event of an unexpected loss of the Heywood Interconnector, which connects South Australia to Victoria, using a control system called a System Integrity Protection Scheme (SIPS).
• On 21 December 2017, ElectraNet (the TNSP for South Australia) successfully completed the commissioning, and armed the automatic load shedding component of the South Australian SIPS- this materially reduces the risk of a black system in the event of the loss of the Heywood Interconnector. The basis of ElectraNet’s design was the detailed power system analysis undertaken by AEMO.
• ElectraNet and AEMO intends to work more closely in 2018 to further enhance the SIPS, and explore opportunities for other technologies to participate in the system security services in South Australia.
• AEMO has also published recent studies outlining the minimum number of synchronous machines required to maintain system strength in South Australia. Operating procedures are currently in place to ensure a minimum number of synchronous generating units are in service in South Australia at all times, until a permanent technical solution (addressing system strength issues like non-synchronous plant stability, synchronous plant stability, operations of protection equipment and voltage management) is commissioned, which is expected to be operational by mid-2020. The permanent technical solution proposed by AEMO refers to a framework that intends to understand how a portfolio of technology can support the services expected to be delivered by a robust power system. The portfolio of technical solutions are related to:
– Supply side, which includes controlled generation from synchronous and non-synchronous generators
– Network side, which includes transfers between regions (AC interconnection, DC interconnection), transfers within regions (transmission and distributed networks) and stabilizing devices (like grid reactor, grid capacitor, static synchronous compensator and synchronous condenser)
– Demand side, which includes solar PV, battery storage, load from large industrial, residential and commercial segments.
• AEMO’s operating procedures identify the conditions and generator dispatch combinations needed to satisfy the system strength requirements. Where natural market
strength, AEMO has powers under the National Electricity Law and National Electricity Rules (NER) to direct the necessary resources into service - for example, in order to avoid the repetition of the massive blackout of 2016 in South Australia, AEMO introduced a rule in the state since July 2017, that required a minimum amount of “synchronous” generation, which if not met would restrict the wind output to a maximum 1,200 MW unless four gas units are operating in the state. However, currently AEMO is gradually relaxing the constraints as it undertakes more studies on how the system can be managed with growing share of variable renewables.
• During summer 2017-18, AEMO issued 22 directions to South Australian generators to ensure the correct level of system strength was maintained at all times and these were security directions, for the provision of fault current.

232 A Strategic Overview of the Global Energy MarketsA Strategic Overview of the Global Energy Markets232
4-Supply & Final Customer
• In order to address this issue, on 16th October 2017, the federal Government passed the Abolition of Limited Merits Review Bill 2017 which removes the right of Network Service Providers (NSPs) to apply for LMR of most of the decisions of the Australian Energy Regulator (AER).
same across regions. Network and wholesale account for 72–79% of the cost stack, followed by retail costs, retail margin and environmental costs which together contribute 21–28%While the relativities are generally similar, there are some
• followed by South Australia, NSW and Tasmania
•
• Retail cost and margins are higher in Victoria
• Environmental costs are higher in South Australia and lower in Queensland.
electricity prices revealed a 56% increase in residential customer prices and 35% increase in residential customer bills between the period 2007/08-2017/18
• Network cost: Largely driven by increased expenditure due to very high reliability standards set for some networks without prior understanding consumers’ willingness to pay for marginal increases in reliability.
• Wholesale cost: Arising mainly from the sudden closures
supply and excess demand in the market, which was then compensated through costly sources of generation like hydro and gas.
• Environmental: Most state governments implemented
subsidies and payouts to the producers of solar energy were then funded at the expense of higher network and wholesale prices charged from end consumers.
• Retail cost and margins: Excessively high prices charged
to switch to other retailers and they end up paying more than what they need to for electricity.
Abolishment of limited merits review (LMR) regime introduced in 2017, is expected to keep the network costs at check
• LMR regime allowed network owners to appeal regulatory decisions and challenge determination of network revenue by AER, in case of exceptional situations.
• However, this power was misused by most of the network service providers and it became more of a routine than
network pricing.
In the backdrop of an unsustainable electricity pricing situation, ACCC put forth few recommendations to address the rising cost challenge - it is imperative that the government implements these recommendations on a priority basis and also conduct proactive review to ensure that the implementations are on track.

233
Aust
ralia
233
Rising customer electricity prices and factors driving supply chain cost in NEM
Australia is facing a challenging time in electricity market with high prices and rising bills placing enormous pressure on household budgets and business viability. A retail pricing inquiry by Australian
chain which has resulted in a stark increase in prices over time
Network cost:
• Network costs have accounted for the largest share in
time from 2007–08 to 2017–18.
• investments in order to replace ageing assets, meet stricter
forecasts at the time of rising peak demand. These large
billions of additional dollars were largely recovered from the
• The framework that governs regulation of monopoly infrastructure was loosened, leaving the regulator with
limited ability to constrain excess spending by network owners. Moreover, reliability standards for some networks were set too high without taking into account consumers’ willingness to pay for marginal increases in reliability.
Recommendation by ACC:• Immediate steps should be taken by NSW, QLD and TAS state
governments to remedy the past over-investment of their
network.
• write-downs of regulatory asset base and rebates on network
Figure 4.1. Change in average residential customer effective prices (c/kWh) from 2007/08 to 2017/18, NEM-wide, real A$2016/17 (excluding GST)
913
7.3
10.10.4
1.9
1.7
2.5
1
2.4
2007/08 2017/18 (estimated)
0
5
10
15
20
25
30
35
Cen
ts/k
Wh
Network cost : +4 | 47%
Wholesale cost : +2.8 | 38%
Environmental cost : +1.6 | 375%
Retail cost: +0.8 | 47%
Retail margins: +1.4 | 140%
Growth between 2007/08 – 2017/18
19.0
29.6
Source: ACCC, Retail Electricity Pricing Inquiry—Final Report, June 2018
Figure 4.2. Change in average residential customer bill from 2007/08 to 2017/18, NEM-wide, real A$2016/17 (excluding GST)
0
200
400
600
800
1,000
1,200
1,400
1,600
1,800
A$/
cust
om
er
2007/08 2017/18 (estimated)
Network cost : +148 | 27%
Wholesale cost : +96 | 21%
Environmental cost : +84 | 382%
Retail cost: +30 | 28%
Retail margins: +68 | 105%
Growth between 2007/08 – 2017/18
549 697
464
56022
106
108
138
66
135
1,120
1,636
Source: ACCC, Retail Electricity Pricing Inquiry—Final Report, June 2018
• Residential consumers have faced a 56% increase in electricity real price and 35% increase in their bills.
• Bills have increased at a comparatively lower rate than the prices because of declining average electricity usage between 2007/08 and 2017/18, owing to higher number of customers with solar PV.
• Solar customers are paying, on average, A$538 less per year than non-solar
concerns are most acute for those who have not installed solar PV.

234 A Strategic Overview of the Global Energy MarketsA Strategic Overview of the Global Energy Markets234
Wholesale cost:Key factors driving wholesale costs include:
• Demand supply imbalance: Despite demand being relatively stable in the wholesale market over the past few years,
facilities have resulted in tightening of supply or excess demand leading to price rise. Over 5,500 MW of generation capacity was retired or mothballed between 2012 and 2017, with less than 3,000 MW of new investment over this same period, indicating a lack of orderly transition in the NEM. Also, the steady growth in intermittent renewables indicated more variability in generation availability, which has added to the tightness of supply on some occasions when wind and solar output have been low.
• Concentration in the NEM: All regions of the NEM are highly concentrated. In each NEM region the current three most
for more than 70% share in generation and more than 80% share in dispatch capacity. Market concentration in the NEM has recently increased further through both acquisitions
government consolidated the generation assets of three businesses into two, and in NSW, both generators owned
• Increase in cost of generation, especially rise in gas prices: Gas is a an important fuel source of generation,
However, a ramp-up of LNG exports linking domestic gas to international prices along with government moratoria on
availability of gas at a low price. Gas-powered generators have also faced increasing fuel costs, which appear to be
latter half of 2017 and early 2018, they remained at higher levels relative to three years ago.
Recommendations by ACCC• Additional resources generated through demand responses
services should be directly made available to wholesale market.
• Promotion of competition allowing A wide range of providers to participate in the demand response services is essential, to
Environmental cost:
• Federal and state governments have introduced environmental policies to encourage greater uptake of
and reduce carbon emissions. However majority of these schemes impose costs on retailers that are recovered through consumer’s electricity bill.
• Environmental cost comprises of:
– Large scale Renewable Energy Target (LRET) and Small scale Renewable Energy Scheme (SRES) within national schemes: These schemes require retailers to purchase
sources and surrender the same to the regulator, in proportion to the overall amount of energy consumed by the retailer’s customers. Increase in prices of LGCs and the number of STCs that must be surrendered, driven by rapid uptake of rooftop solar PV has increased retailers’ cost which was passed on to consumers bill.
–
Premium FiT scheme was introduced to encourage uptake of rooftop solar and it was done by providing payments to households and businesses for the electricity generated through solar panels. Distributors funded these payment costs through increase in network prices charged to consumers. As more households and businesses participated in the scheme, value of payments increased putting an upward pressure on cost.
Recommendations by ACCC• Costs of schemes like Premium FiT, should be borne by state
governments through their budgets, as Queensland has done for the next three years.
• Ongoing scheme eligibility rules should be reviewed and tightened to ensure underlying costs are minimized.
Figure 4.3. Quarterly gas generators’ fuel costs and average spot gas prices across all mainland NEM regions, Q1 2015 to Q2 2018 (A$/GJ nominal)
0
2
4
6
8
10
12
A$/
giga
jou
les
2015 Q1 2015 Q2 2015 Q3 2015 Q4 2016 Q1 2016 Q2 2016 Q3 2016 Q4 2017 Q1 2017 Q2 2017 Q3 2017 Q4 2018 Q1 2018 Q2
Average spot gas price Weighted average fuel cost
Source: ACCC, Retail Electricity Pricing Inquiry—Final Report, June 2018
1 A national framework that regulates the connection, supply and sale of energy (electricity and gas) to grid-connected residential and small business energy customers. It was developed to provide same level of consumer protections to all customers irrespective of the location
235
Aust
ralia
235
Retail cost and margin:Retailer cost comprises of:
• Costs to Serve (CTS) which essentially refers to operating cost: Main drivers include increase in the level of bad debts and cost of debt collection arising from the group of vulnerable consumers who are the newly arrived migrants with low energy literacy and little or no experience in having a choice of provider. Cost of regulatory compliance
as a result of individual states implementing derogations from the National Energy Customer Framework1 (NECF) - for example, Victoria has not joined the NECF and retains its own regulatory framework and licensing process). Divergence and duplication of reporting requirements occurring even within the NECF states like SA, NSW, QLD, TAS and ACT.
• Customer Acquisition and Retention Costs (CARC)—includes the costs of acquisition channels (third party comparison websites, door-to-door sales, telemarketing), other marketing spend, retention teams etc.: Increasing cost of acquiring third party channels and commercial comparators, advertising and marketing have pushed up the CARC.
Recommendations by ACCC• Victoria should join the NECF to streamline regulatory
obligations and reduce retailers’ costs to serve.
• Future derogations from the NECF should be limited to
addressed by a NECF-wide rule change.
AER’s role in regulating the rising network cost
• AER plays a crucial role in determining the regulated revenues for all electricity network service providers in the NEM and Northern Territory. At the start of each regulatory period,
the maximum amount the network can recover from its retail customers through their electricity bills. This is largely based on the annual benchmarking activity that AER undertakes to
and transmission network providers. In the 2017 State of the Market Report, AER forecasted that network revenue decisions (informed by benchmarking) would result in a 13.5% decline in network revenues which would in turn
reduce the real average residential electricity charges by
periods.
– Benchmarking process: This is based on three top down techniques including Productivity index numbers, Econometric operating expenditure cost function models and Partial performance indicators which analyses relation
– Revenue determination process: An electricity network provides the AER with a revenue proposal outlining its
which is then assessed by AER against relevant criteria and tests of the National Electricity Rules. Where a network business’ proposed expenditure meets the criteria and
proposal. Where relevant regulatory criteria and tests are not met, the AER does not accept the proposal and
regulatory requirements. Benchmarking activity helps in determining that threshold level.
• In July 2018, AER released a draft on Rate of Return Guidelines which outlines the approach to setting the allowed rate of return for regulated gas and electricity network service providers. Rate of Return essentially comprises of return on debt and equity and account for about 50% of network providers’ allowed revenue. Higher returns attracts over investment from the NSPs, the cost of which is recovered largely through higher customer bills. In order to prevent this, AER announced plans to reduce the return on debt in its new guideline, to ensure a balance between
would help keep energy prices down.
• The AER estimates that its draft guideline would result in a 45 basis point reduction in the overall rate of return for network businesses, compared to its previous determination in 2013.
• The AER has tried previously to reign in network costs, but has repeatedly been forced to allow for a compromise after its decisions were appealed or taken to the courts. However, in late 2017, the limited merits review regime, which enables networks to successfully challenge AER determinations on allowable network revenues, was abolished. This will limit the
framework and the ACCC recommends limited merits review of AER decisions should not be reinstated in the future as well.

236 A Strategic Overview of the Global Energy MarketsA Strategic Overview of the Global Energy Markets236
Trends in electricity prices across jurisdictions in NEM
Aligned to the trend in overall NEM, network and wholesale costs account for the largest share of 72-79% of the cost stack across all regions. While there is an increase in the overall cost stack in all states on a cent/kWh basis, the drivers of price changes vary between states
Victoria:
• It recorded the lowest percentage increase in residential
• Although network cost increased by 35%, it was primarily driven by the costs of the state mandated distributor-led rollout of smart meters that accounted for 1.9 cents/kWh of the 3.1 cents/kWh increase in network cost registered between 2007/08- 2017/18 - the remaining is accounted by distribution and transmission cost.
• the largest increase was due to the combined increase in retail costs and margins - Victoria has the highest retail cost and margin of the NEM regions.
• Retailers operating in Victoria incur additional regulatory costs as a result of the state not having joined the NECF - many retailers pointed to the regulatory divergence between Victoria and the rest of the NEM as being a source of additional operating expenditure.
• in environmental cost arising from schemes like – Victorian Premium FiT
and discounts to entities producing renewable energy and ensuring GHG emissions reduction, at the expense of higher prices charged from electricity customers.
NSW:Network costs are the primary driver of price increases between 2007–08 to 2017–18 in NSW. Imposition of high network reliability standards on distributors, following the outages in 2004, led to higher costs.
The NSW Government introduced highly prescriptive standards that were deterministic and focused on the input standards that distributors should achieve in planning the network, rather than the outputs of reliability that should be achieved.
Figure 4.4. Change in average Victorian residential effective price (c/kWh) from 2007/08 to 2017/18, NEM-wide, real A$2016/17 (excluding GST)
Network cost : +3.1 (1.9 from smart metering) | 35%
Wholesale cost : +2.4 | 32%
Environmental cost : +1.7 | 850%
Retail cost: +1.3 | 68%
Retail margins: +1.2 | 55%
Growth between 2007/08 – 2017/18
0
5
10
15
20
25
30
35
Cen
ts/k
Wh
2007/08 2017/18 (estimated)
8.8
7.5
20.5
0.21.92.2
11.9
9.9
1.93.2
3.4
30.3
Source: ACCC, Retail Electricity Pricing Inquiry—Final Report, June 2018
Figure 4.5. Change in average NSW residential effective price (c/kWh) from 2007/08 to 2017/18, NEM-wide, real A$2016/17 (excluding GST)
2007/08 2017/18 (estimated)
0
5
10
15
20
25
30
Cen
ts/k
Wh
Network cost : +4.0 | 49%
Wholesale cost : +2.2 | 31%
Environmental cost : +0.4 | 29%
Retail cost: +0.3 | 16%
Retail margins: +2.8 | NA
Growth between 2007/08 – 2017/18
8.212.2
7.2
9.41.4
1.8
1.9
2.22.8
18.7
28.3
Source: ACCC, Retail Electricity Pricing Inquiry—Final Report, June 2018

237
Aust
ralia
237
South Australia:
• South Australia recorded the highest increase in residential
amongst the highest electricity prices in the world.
• The primary drivers of cost increases in South Australia have been wholesale costs and environmental costs.
• The state has a very high penetration of solar PV - environmental costs are thus driven by high costs of premium FiT schemes which are recovered through additional network charges from customers that are paid to solar PV households as incentives.
• Since the closure of Alinta’s Playford and
2016, output supply was compensated through more expensive sources like gas-
powered-generation which pushed up the wholesale prices
– Post May 2016, gas-powered generators have represented about two thirds of dispatched generation in South Australia and set the price 23–53% of the time - additional gas capacity became available during 2017 with the second unit of Pelican Point restarting.
–of A$50–75/MWh in 2015 to A$100–300/MWh in 2016.
Figure 4.6. Change in average South Australian residential effective price (c/kWh) from 2007/08 to 2017/18, NEM-wide, real A$2016/17 (excluding GST)
2007/08 2017/18 (estimated)
0
5
10
15
20
25
30
35
40
Cen
ts/k
Wh
Network cost : +3.7 | 37%
Wholesale cost : +6.1 | 69%
Environmental cost : +3.4 | 1700%
Retail cost: +1.2 | 86%
Retail margins: +0.1 | 7%
Growth between 2007/08 – 2017/18
10.113.8
8.9
15.00.2
3.6
1.4
2.6
1.4
1.5
22.0
36.5
Source: ACCC, Retail Electricity Pricing Inquiry—Final Report, June 2018
South-east Queensland:
• The primary drivers of cost increases in south east Queensland were network costs and wholesale costs.
• In Queensland, reliability standards were set that required incremental improvements in network reliability over time, by reference to a Minimum Service
However, these standards were prescriptive and had a strong focus on inputs rather than outcome.
• Queensland also experienced relatively high electricity demand in 2015/16 and 2016/17 as temperatures soared above the average. However, due to lack of competition in the market, generators like Stanwell and CS Energy (which together control two-thirds of the state’s electricity supply) leveraged this situation and most of this excess demand was met through additional capacity
Market prices are usually determined by generator receiving the price of the lowest priced bid which can satisfy demand, but due to market concentration in Queensland, prices set locally were much higher than usual.
• generators in Queensland retired since 2011 and the reduction in output was then compensated through expensive means of generation like gas and hydro during mid-2014, mid-2016 and early 2017.
• Despite recording an increase of 225% since 2007/08, overall, in 2017/18 south east Queensland recorded the lowest environmental costs - this was largely owing to the removal of premium FiT charges that were recovered through higher network costs.
Figure 4.7. Change in average south east Queensland residential effective price (c/kWh) from 2007/08 to 2017/18, NEM-wide, real A$2016/17 (excluding GST)
2007/08 2017/18 (estimated)
0
5
10
15
20
25
30
35
Cen
ts/k
Wh
Network cost : +6.3 | 78%
Wholesale cost : +4.0 | 63%
Environmental cost : +0.9 | 225%
Retail cost: +0.8 | 47%
Retail margins: +0.2 | 33%
Growth between 2007/08 – 2017/18
8.114.4
6.3
10.3
0.4
1.3
1.7
2.5
0.6
0.8
17.1
29.4
Source: ACCC, Retail Electricity Pricing Inquiry—Final Report, June 2018

238 A Strategic Overview of the Global Energy MarketsA Strategic Overview of the Global Energy Markets238
Tasmania:
• The primary drivers of cost increases in Tasmania were network costs and environmental costs.
• networks, driven primarily by excessive reliability standards and a regulatory regime tilted in favor of network owners at the expense of electricity users.
• Funding of environmental schemes like Premium FiT scheme through increased network cost charged from customers is the main driver of environmental cost- these are expected to make up an increasing proportion of a residential electricity consumer’s bill going forward.
Figure 4.8. Change in average Tasmanian residential effective price (c/kWh) from 2007/08 to 2017/18, NEM-wide, real A$2016/17 (excluding GST)
2007/08 2017/18 (estimated)
0
5
10
15
20
25
30
Cen
ts/k
Wh
7.7
7.2
0.11.3
16.3
12.2
9.1
22.8
26.1
Network cost : +4.5 |58%
Wholesale cost : +1.9 | 26%
Environmental cost : +1.9 | 1900%
Retail cost: +1.5 | 115%
Growth between 2007/08 – 2017/18
Source: ACCC, Retail Electricity Pricing Inquiry—Final Report, June 2018
Measures to improve customer experiences and outcomes
The approach to policy, regulatory design and promotion of competition in electricity sector has not been in favor of consumers in recent past. However, measures are now being gradually adopted to
Pricing Inquiry
Strategies to encourage consumer engagement.
• In August 2017, eight retailers including AGL, Alinta, Energy Australia, Origin, Momentum Energy, Simply Energy, Red Energy and Lumo Energy made a number of commitment to the Prime Minister to encourage consumer switching – this
• The eight retailers also agreed to support a rule change that would require retailers to contact customers prior to
Improving easy accessibility to electricity consumption and pricing data.
• Majority of households in NSW, Queensland, the ACT, South Australia and Tasmania are still metered using accumulation meters which are manually checked periodically. In contrast, smart meters, which have been rolled out in Victoria,
provide richer data, including half-hourly measurements of consumption - as part of the Power of Choice reforms, retailers are now progressively rolling out smart meters in other NEM regions.
• On 9 May 2018, the Australian Government agreed to the Consumer Data Right (CDR) model and ACCC was named as the lead regulator. CDR, which will be implemented in banking sector initially and later extended to energy and telecommunications, will enable consumers to share their transaction, usage and product data with service providers and comparison services. This right will improve the consumer’s ability to compare and switch between goods and
• The COAG Energy Council has also been developing a framework1 to enhance the availability of and access to electricity data, and the Energy Security Board is developing a data strategy2.
1 The COAG Energy Council initiated a project to streamline the process and facilitate timely access to consumer consumption data. The Department of the Environment and Energy is coordinating this project with the support of consultants
2 The data strategy is focused on principles to guide how data is managed, and mechanisms that identify what data, how it is handled, who should have access and where it can be published.

239
Aust
ralia
239
Tools to assist consumers to choose a retailer and switch.
• In 2017, many residential customers switched electricity retailers or plans- Victoria and south east Queensland had the highest switching rates of 27% and 25% respectively, followed by 19% in NSW and 16% in SA.
• However, for many consumers, switching retailers is not a simple task, and although there are third party intermediaries who can provide this service to consumers seeking switch of retailers, ACCC highlights that they may not always provide recommendations in interest of the consumers. Therefore, their activities require close monitoring and should have penalty provisions for any breaches.
Figure 4.9. Residential customers on standing offers in non-price regulated jurisdictions, 2014–2018
0%
5%
10%
15%
20%
25%
30%
35%
40%
% o
f cu
sto
mer
s
11% 10% 9%7%
36%
30%
25%
21%18%
16% 15% 14%12% 11%
26%
22%19%
Jun 2014 Jun 2015 Jun 2016 Jun 2017 Dec 2018
Victoria NSW South Australia South east Queensland
Source: ACCC, Retail Electricity Pricing Inquiry—Final Report, June 2018Note: Figures for Victoria for December 2017 is not included as it is reported annually and figures for south east Queensland
Consumers are now moving away from
• accordance with the standard retail contract at the price
high.
•
Australia where there are options of alternate retailers -
retailer margins.
• While consumers have been encouraged to participate in
• However, over the past four years, there has been a trend
• As an alternate there have been some developments in Australia around automated switching services – According to ACCC, automated switching providers are still a relatively new feature of the electricity market, but if enough consumers start using a service of this kind, it has the potential to place
customers:
– CHOICE (Australian Consumers’ Association) has launched an automatic switching service – Transformer uses a consumer’s bill to determine whether a consumer can save
structure
– RoboSave: Reads a consumer’s bills, scans the market
consumer’s behalf
– Energy Bill Doctor: Provides a free service where consumers can upload a bill and the tool will seek a cheaper power plan for the consumer.

240 A Strategic Overview of the Global Energy MarketsA Strategic Overview of the Global Energy Markets240
Topic Box 4.1: Drawbacks of the current regulatory framework for consumer protection and the proposed scheme by ACCC
The government currently lacks robust framework and principles by which they can manage and
of market change and technological disruptions. Guidance outlined by ACCC in its Retail Price Inquiry Final Report is expected to lead to regulations that are more clearly aimed at
Concerns with the current regulatory framework.
• The National Energy Retail Law (NERL) and National Energy retail Rule (NERR) were designed for a retail
or less homogenous products and services. However, the NEM has evolved over the past decade, shifting from a highly centralized retail market with a small number of state-owned retailers, to many retailers and several retail
complex body of regulations over time.
• Under the NERL, there is no mechanism for a broad-based
• Incremental and ad hoc approach employed to address poor retailer behavior and consumer harms, has not
or consumer protections. Since 2012, there have been 10 changes to the retail rules, and there are a further eight open or pending rule change proposals registered with the AEMC. These rule changes along with other associated changes to the electricity rules, AER guidelines, and procedural changes have resulted in the NEM being in a constant state of regulatory change since the introduction
industry and consumer stakeholders to keep pace with the continuous rule changes.
• ACCC also highlighted concerns regarding the ever increasing suite of rules that are more prescriptive in nature than directive, which are increasing costs and largely being circumvented by retailers and some state governments according to their convenience.
ACCC proposes a framework focused on best outcomes for consumers.
• The ACCC suggests NERL and NERR to apply a hybrid approach in policy that balances prescriptive and non-prescriptive elements to ensure that mandates to certain activities are clearly highlighted and state based derogations are limited.
• It also proposes for a more principles-based approach over time that will require a regulatory shift in the NERL and NERR and a change in retailers’ approach to regulation. Energy businesses, including retailers, have reportedly indicated a willingness to take steps in this direction.
• In order to signal a strong focus on consumer outcomes, the COAG Energy Council could establish ministerial principles focused on consumer outcomes – these principles should include direction on governments’ expectations around regulation to protect vulnerable consumers.
• ACCC also highlights that in addition to implementing its
whole consumer electricity regulatory framework should be conducted within three years after the implementation of the recommendations and no later than June 2022.

241
Aust
ralia
241
5-New Business Models & Services
Blockchain technology and its application in energy trading is gaining traction
• With the electricity market decentralized and electrical energy becoming an asset on a blockchain, consumers are gradually trading electricity within a peer-to-peer market.
• Australian blockchain-based energy companies like PowerLedger is working to implement peer to peer trading platform to facilitate solar trading between residents of Yolk Property Group in Western Australia.
Big data, analytics and IoT are being leveraged by city councils and businesses to improve
development and ensure consumer retention
• As a part of the Smart Cities and Suburbs Program, city councils are investing in smart technologies to facilitate programs like smart meters, smart lighting, smart environment monitoring that will improve livability and
• Major utilities players like Energy Australia is investing in big data, cloud and Hadoop to provide customers with real time data and improve customer engagement.
Boom in Distributed Energy Resources (DER) resulting in a paradigm shift in the NEM, from a centralized structure with few dominant players to a more competitive framework with households and small businesses participating in the national grid
• ARENA has allocated A$12.5 million to fund initiatives that aims to support growth of distributed solar PV and batteries, and thus help distributed energy resources in homes and businesses to contribute to grid reliability.
• In collaboration with Energy Network Australia, AEMO is exploring means to integrate DER with the national grid in
in supply.
Experimentation in wave, bio energy and battery storage technologies is driving growth in innovative renewable generation
• Several research projects are being explored to harness the power of the tides, this includes - an online web atlas of Australia’s national wave energy resource, a hydrodynamic tidal model to map the scale and distribution of the nation’s tidal energy resources, as well as prototype that will leverage wave energy to generate hydro electricity.
• Local governments (like South Australian government) are inviting tenders for investing in bio energy projects.
• South Australia also witnessed the successful implementation of the Tesla battery storage project and in addition to that, several other large-scale battery projects are also in pipeline across states of South Australia and Queensland.
Fast paced technological changes are rapidly reshaping Australia’s energy market – electricity market has transformed from a centralized system dominated by few players to a decentralized system with several participants.

242 A Strategic Overview of the Global Energy MarketsA Strategic Overview of the Global Energy Markets242
Rapid growth in DER, driven by increased consumer awareness and consumer uptake, is paving way for a new decentralized business model in Australia’s NEM
DER driving more participation in the national electricity grid.
• Growth in DER is shaping Australia’s electricity market transition from a centralized system of generation, transmission and distribution dominated by few players to a decentralized system with several participants in the energy system.
• As deployment of rooftop solar PV and battery storage technology increases rapidly, customers are more proactively connecting to the grids and energy markets - generation and storage at home is very appealing in countries with low population density and/or high solar radiation and Australia tops the ranking of current deployment.
ARENA allocating A$12.5 million to activities focused on DER.
• of it i.e. A$7.5 million has been allocated to pilot projects focused on increasing network hosting capacity through advanced monitoring and control schemes to manage power
real time to ensure secure operation of the grid and system; the rest i.e. A$5 million has been allocated for desktop studies, feasibility studies or modelling to investigate how to successfully integrate high penetrations of DER.
• The funding initiative aims to support increasing shares of distributed solar PV and batteries, and help distributed energy resources in homes and businesses to contribute to grid reliability.
• ARENA CEO Ivor Frischknech highlighted that by 2022, it aims to ensure that the entire electricity system operates securely and reliably with 100% of demand met from behind-the-meter assets in combination with rooftop solar, batteries and other demand management options within homes and businesses.
AEMO’s partnership with Energy Network Australia to explore means of integrating DER with the national grid in a better way.
• Despite the robust growth of DER, connecting it to the grid can, in technical terms, be quite complex. Australia’s electricity system was originally designed to deliver large-scale centralized generation to customers with traditional
distribution networks to end customers.
• The rise in distributed generation is leading to periods during which power is being exported from distribution networks onto the transmission system resulting in a two way power
occasions but also imposing strains on network leading to reliability and safety issues.
• In order to ensure a better integration of this two-way system, AEMO has proposed a central platform which can interface with aggregators, transmission and distribution network providers simultaneously. Three ways have been explored by which the central platform may be designed and delivered :
– Single Integrated Platform (SIP): It will be a regulated entity and serve as a one-stop-shop that provides market participants the opportunity to participate anywhere in the NEM without having to develop separate systems or tools to integrate with the various individual distribution platforms. This will operate on a set of agreed standard interfaces to support the participation by retailers, aggregators and VPP platform companies. Distribution business will be linked to the platform and they will provide information on local constraints to AEMO. AEMO would consider this information and economically dispatch these resources. This entire process will help the SIP to simultaneously solve local security constraints and support wholesale market entry.
– Two Step Tiered Regulated Platform: This model would
interface operated by local distribution network which will help them liaise with the DER providers/participants and secondly an interface between the distribution network‘s platform and AEMO. Using this model, participants can communicate directly with the distribution level platform for the local constraint issues and the distribution network would optimize these resources by coordinating with the aggregators servicing the area. As a next step, distribution networks would provide an aggregated view of each transmission connection point to AEMO, which will then leverage this information to determine the overall system security and economic dispatch.
– Independent Distribution System Operator (DSO): Under this model the independent DSO (which is a separate entity from AEMO) would work with the distribution utility to optimise the dispatch of the DER based upon local system constraints that are provided by the network business, provide the aggregated bids to AEMO for incorporation into the larger dispatch. This option will be
more costly.

243
Aust
ralia
243
Innovation in renewable generation increasingly gaining traction
Wave technology: Despite being an underutilized resource currently, wave technology has the potential to be a game changer and a leading source of renewable power generation in future – several projects are underway to harness the power of tide
The Australian Wave Energy Atlas
• It is an initiative by CSIRO which was completed in 2017 and had also attracted funding of A$1.32 million from ARENA.
• The project delivered a searchable, free and publicly available online web atlas of Australia’s national wave energy resource and marine management uses.
• It also provides best practice guidelines on physical impact assessments for wave energy developments in Australia’s marine domain.
Other developments
• Initiatives by Perth-based Carnegie Clean Energy: The company has been long at the forefront of wave energy, and in the latter half of 2017, it announced plans for a new wave energy project as well as a National Wave Energy Research Centre at Albany, on the Western Australian coast. It also unveiled an upgraded version of its trademark product.
to convert kinetic energy from ocean swell into electrical power. Carnegie will design, manufacture and install an
during the 2019/2020 summer and this is expected to generate far more electricity than its predecessors.
• Tidal Energy in Australia: This is a joint research project of CSIRO, the Australian Maritime College at the University of Tasmania, the University of Queensland and industry partners, which will focus on developing a hydrodynamic tidal model to map the scale and distribution of the nation’s tidal energy resources.
• Prototype by Sydney based company Wave Swell Energy:
blowhole. The company will build a A$7 million large-scale unit on the seabed near the coast of King Island that will feed into Hydro Tasmania’s grid, and at peak times will provide up to half the island’s power.
Bioenergy: Bioenergy power plants accounted for almost 10% of Australia’s clean energy and 1.7% of total electricity generated in 2017
• According to the Federal Government’s Australian Energy Statistics, Queensland produced the most bioenergy of any state in 2016/17, primarily due to the large number of bagasse cogeneration plants associated with the sugar industry in the northern and central coastal region. In August 2017, South Australian government invited tender for investing in bio energy projects which are expected to have storage facilities as well.
• Other key bio energy projects include:
– Worsley Multi-Fuel Cogeneration Plant: This is the largest project completed in 2017 and is expected to
189 km south-east of Perth
– 2.4 MW combined solar and methane plant by The Northern Adelaide Waste Management: The two fuel sources use a shared turbine interconnector to feed
electricity back into the South Australian grid. Combining
– MSF Sugar’s 24 MW Green Energy Power Plant at Tableland Mill: This was one of the few major new bioenergy projects at an advanced stage of development in 2017. The A$75 million plant will use bagasse from local sugar operations to produce power when it is completed in mid-2018
– 40 MW waste-to-energy power plant at Kwinana in Western Australia: Construction of this A$400 million plant is scheduled to begin in second quarter of 2018 and the project is being led by Phoenix Energy and co-sponsored by Macquarie Capital. Spanish infrastructure and renewable energy company ACCIONA and waste management company Veolia are also involved.
large-scale battery storage
• Declining lithium ion prices have also provided further impetus to this technology. Apart from the much talked about Tesla battery in South Australia, (touted as the largest battery in the world) there are a number of other large-scale battery projects in the pipeline. This includes:
– World’s second biggest lithium-ion battery, the ESCRI project to be located in South Australia
– 4,000 MWh lithium-ion battery storage facility attached to SolarQ’s solar farm in Queensland and a large-scale battery proposed for Neoen’s site south of Cairns in Queensland.

244 A Strategic Overview of the Global Energy MarketsA Strategic Overview of the Global Energy Markets244
Advancements in emerging technologies like blockchain, IoT, big data and cloud are resulting in innovative services like blockchain powered trading platform, low-cost and low energy consumption based IoT network, smart lighting and smart environment monitoring services
Increased potential for blockchain technology in Australia’s energy sector
development of smart cities and improve competitiveness in the electricity market
Blockchain application in energy trading
• requirements for reporting, transparency, and dissemination of data. Costs have gone up and revenues have gone down and therefore blockchain technology is helping to address these issues by providing a transactional platform that is highly secure, reliable, low cost, and fast.
• Origin Energy is working with the Australian blockchain startup Power Ledger to test a new energy trading platform.
plant operation, natural gas processing and both commercial and domestic power delivery - as a part of the project, the company will use the trial trading platform to connect customers who want to either buy or sell excess energy, with blockchain creating a robust record of energy allocation.
• In 2018, PowerLedger also initiated a peer to peer trading project with Yolk Property Group at White Gum Valley – this project will enable solar energy trading between residents
leveraging a blockchain platform which will serve as a secured transactional layer.
Blockchain based operations are expected to be more attractive, driven by ‘behind the meter’ deployment.
• Blockchain processes require very high computing power and energy to operate, and given the high energy costs in Australia, blockchain specialist were not too keen on investing in this domain till date.
• However, in April 2018, IOT Group struck a landmark deal with Hunter Energy of NSW to build a blockchain center
provide the center a direct access to wholesale prices and help avoid additional costs from retailers and transmission. Power at wholesale cost is expected to make blockchain related operations more attractive in the energy sector and drive its adoption in near future.
Australian business harnessing big data to improve customer experience and remain ahead of competition.
• multiple participants in the electricity market, customer satisfaction is emerging as a major battleground for Australian utilities.
• In order to combat the customer churn rate and drive more business value, utilities companies are investing a lot of stake in IoT platform, Business Intelligence and big data tools to get detailed customer insights, their preferences and
• For example – Energy Australia is using Oracle Big Data Cloud and Oracle R for Hadoop to analyze and improve the way they engage with their customers. Oracle’s Big Data solution is enabling the company to identify customer trends, draw insights and provide a better, more seamless experience for
boost customer loyalty.
IoT is being increasingly leveraged by Australian cities and councils to facilitate the development of smart cities.
• The Australian government has invested A$50 million through the Smart Cities and Suburbs Program that aims at supporting those projects which apply smart technology to improve the livability of metropolitan cities.
• NBN Co, the Australian National Broadband Network has also expressed interest in supporting smart initiatives especially the IoT network through a collaboration of cities and councils.
• The city of Adelaide is planning a network rollout of 10 gigabit starting 2018 to facilitate smart programs such as smart city lighting with Cisco, smart environment monitoring, along with other programs like smart waste bins, smart parking.
• In partnership with Cisco and Telstra, Sunshine Coast created the Smart City Framework - a portfolio of 13 services which includes programs related to smart power, smart lighting as well as other areas like smart water, smart waste management, smart transport etc.
• The Wyndham City Council in Victoria is using “temperature sensors built into LED streetlights to generate a real-time

245
Aust
ralia
245
like ageing infrastructure and tight emissions reductions targets are driving the utilities toward cloud solutions
Cloud has the potential to address a number of challenges in the utilities sector and energy
cycles and faster IT services and infrastructure at lower cost.
• In June 2018, Endeavor Energy roped in Cognizant to help them transform and automate their customer experience, energy market and business processes.
• As part of the engagement, Cognizant will digitally transform Endeavour Energy’s procurement and supplier management,
S/4HANA suite and a range of SAP Cloud solutions such as SuccessFactors, Ariba and Concur, as well as the SAP Industry Solution for Utilities.
• Some companies are also leveraging cloud technology
productivity levels.
• In 2017, A$2 million was invested from the Clean Energy Innovation Fund in clean-tech company Wattwatchers, to expand production of its measurement technology that helps better manage energy use and costs - Wattwatchers leverages internet devices, advanced control analytics and cloud-hosted management interface to provide real time data showing where and when energy is being consumed. The multi-channel auditor device can be used to inform customers of energy usage and identify energy waste or poor performance.
In its 2018 update to the ‘Sector Competitiveness Plan’, National Energy Resources Australia (NERA) highlighted that that despite the challenges, Australia’s energy resources sector remains one of the principal sources of revenue underpinning the nation’s economy. However, it emphasizes the need for more advancements to improve the sector’s competitiveness when compared with global peers. NERA further highlights how automation and digital technologies – whether leveraged
intelligence, robotics, drones or remote operating vehicles – can deliver opportunities for the industry and help it in cost
high-resolution heat map” for their community.
• City of Gold Coast initiated a large scale roll out of smart meter and connected street lighting in early 2018 which helped to test varying levels of energy consumption via metered and unmetered streetlights.
• The City of Ipswich is using sensor networks to support its smart city plans - the sensor networks lay the platform for testing technology in the areas of lighting management, solar energy, water and waste management, precinct maintenance,
Thinxtra launched the Sigfox Low Powered Wide Area Network (LPWAN) technology to provide a low-cost operating framework for Internet of Things Technologies.
• Thinxtra’s LPWAN technology requires far less power and provides much longer battery life for devices that require transmission of small amount of data and intermittent
internet connectivity.
• More than 150 local businesses have already partnered with Thinxtra to leverage its network technology, which includes - smart water meter service companies that enable large water users to detect leaks and smart logistics solution providers with cold chain monitoring trackers to increase traceability of food and reduce wastage.
• Thinxtra’s IoT network provides connectivity to cloud at lowest level of energy consumption and is complementary to RFID and Wi-Fi technologies.
• The CEFC has committed up to A$10 million to assist the expansion of Thinxtra, through the Clean Energy Innovation Fund.

246 A Strategic Overview of the Global Energy MarketsA Strategic Overview of the Global Energy Markets246
Topic Box 5.1: Carbon Capture and Storage (CSS) to play a pivotal role in CSIRO Low Emissions Technology Roadmap
The Australian Government released a Low Emissions Technology Roadmap in June 2017, developed by CSIRO, which explores the scope for new technology to reduce greenhouse gas emissions from the energy sector. The country is taking keen interest in four technology areas
technology in Australia and presented a comprehensive plan for its deployment.
• Government programmes are targeting four priority areas for CCS technology development: i) improving the knowledge base of Australia’s CCS resource; ii) demonstrating domestic low emission technology capacities and capabilities; iii) building Australian skills and capacity and iv) strategic partnering with ARENA and clean energy R&D community for funding.
• Australia’s delivery of CCS projects, driven by support from the government and private sector activities in CSS R&D. Some of the notable projects include:
– Chevron’s Gorgon project (Western Australia): Touted as world’s largest CSS facility, this commercial-scale project is expected to commence capturing
year three to four million tons of carbon dioxide will be injected into undersea storage, reducing emissions from the facility by 40%.
– The CarbonNet Project: This is investigating the potential for a commercial scale CCS network in the Gippsland region of Victoria. The network could integrate multiple carbon dioxide capture projects in the Latrobe Valley, transporting carbon dioxide via a common-use pipeline and injecting it deep beneath the Gippsland Basin to be securely stored within suitable geological formations. If proved viable, CarbonNet could enable innovative new industries in Gippsland securing jobs, boosting skills and attracting investment while strengthening Victoria’s energy security.
– The Cooperative Research Centre for Greenhouse Gas Technologies Otway: This research facility is
storage of carbon dioxide, which provides technical information on the injection, storage and monitoring of carbon. This storage research programme has successfully injected more than 80,000 tons of carbon dioxide into geological storage facilities in Victoria’s Otway Basin and is investing a further AUD 41 million (including private capital) between 2016 and 2020 to reduce the cost of carbon dioxide storage monitoring.
– The National Geosequestration Laboratory delivers innovative research solutions to support Australia’s carbon storage, energy and resources industries. For example, it is the lead research partner for the South West Hub CCS project in Western Australia.
• Funding of CSS projects:
– The CCS Research Development and Demonstration Fund: This provides funding for carbon capture and storage projects and supports the Australian Government’s commitment to reduce the technical and commercial barriers to the deployment of large-scale CCS projects.
– The Australian Government has also introduced to Parliament proposed changes to the Clean Energy Finance Corporation Act 2012 to allow the Clean Energy Finance Corporation to invest in CCS.

247
Aust
ralia
247
6-Financials
• borrowing and equity costs have reduced the forecast revenue requirements for most network businesses.
• With respect to operating expenditure, AER forecasts an increase for both gas transmission as well as distribution network providers - largest rise is forecasted for Victoria’s AGN network. However for electricity networks, AER’s decision forecasts a reduction in operating cost for some
regulatory period and increase for some companies driven by regulatory changes.
Despite growing competition, the generation market continues to be dominated by AGL, while the retail market is largely catered by Origin Energy along with AGL and Energy Australia
• In 2017, AGL accounted for the largest market share in generation capacity across regions of Victoria, South Australia and NSW - streamlined cost reduction programs and rising wholesale electricity prices helped AGL improve its bottom-line.
• Origin Energy continued to dominate the electricity and gas retail market across Queensland, South Australia and NSW, along with AGL.
• Energy Australia is also quite dominant in electricity and gas retail market of NSW.
For the current regulatory period of 2016/17-2021/22, AER forecasts reduction in electricity and gas network revenues
• According to the current round of AER decisions, regulated electricity and gas network revenues are forecast to fall by an average 13.5% and 12% respectively, from the previous regulatory period.
AER decisions in the current regulatory period have lowered total network revenues
expenditure.
Generation capacity
AGL Energy is a dominant player in generation market, across most of the regions in NEM
Victoria
• In Victoria, AGL Energy, EnergyAustralia and SnowyHydro together account for the major share of 78% in capacity generated.
• Engie controlled 23% of the market until decommissioning its Hazelwood plant in March 2017, post which its market share dropped to 10%.
South Australia
• AGL Energy is the dominant generator, with 42% capacity.
• EnergyAustralia and they together account for 39% of the capacity share.
• Before retiring its Playford power station in 2012 and Northern power station in 2016, Alinta had an 18% market
share in South Australia.
NSW
• Privatization of state owned generation completed in 2015.
• EnergyAustralia, Origin Energy, AGL, Snowy Hydro and Sunset Power were the successful bidders.
• AGL, Origin Energy and Snowy Hydro emerged as the state’s leading generators with 71% market share in the region.

248 A Strategic Overview of the Global Energy MarketsA Strategic Overview of the Global Energy Markets248
Queensland
• In Queensland, state owned corporations Stanwell and CS Energy control 65% of generation capacity, including power purchase agreements over privately owned capacity.
• Origin Energy.
• The degree of market concentration increased in 2011, when the Queensland Government dissolved state owned generation businesses Tarong Energy and re-allocated its capacity to the remaining two state owned entities – Stanwell and CS Energy.
Tasmania
• The state owned Hydro Tasmania owns nearly all generation capacity.
• of the Tasmanian Economic Regulator regulates the price
ensures adequate volumes of these products are available.
Figure 6.1. Market shares in generation capacity across regions, 2017
0%
20%
40%
60%
80%
100%
Mar
ket
shar
e
Interconnector, 5%
Origin Energy, 6%
Engie, 10%
Snowy Hydro, 22%
Energy Australia, 25%
AGL, 31%
Interconnector 15%
Origin Energy, 15%
Engie, 17%
Snowy Hydro, 4%
Energy Australia, 7%
AGL, 42%
Sunset Power, 8%
Origin Energy, 23%
Snowy Hydro,19%
Energy Australia, 10%
AGL, 29%
Interconnector, 11%
Others, 7%
Alinta Energy, 4%Arrow Energy, 5%
Intergen, 10%
Stanwell, 30%
CS Energy, 35%
Origin Energy, 9%
Hydro Tasmania 96%
Interconnector, 4%
Victoria South Australia NSW Queensland Tasmania
Source: State of the Energy Market, May 2017 (updated Aug 2018)
Electricity Retail Market
Australia’s electricity retail market continues to be dominated by the key players- AGL, Energy Australia and Origin Energy
Queensland
• Origin Energy dominates the electricity retail market in the state, both from residential and small customers perspective.
• In total, 25 retailers supply electricity to small customers in the Queensland electricity market, which is split between South East Queensland, and the rest of Queensland, where the supplier is Ergon Energy.
• Origin and AGL together supply over half i.e. 53% of Queensland customers.
South Australia
• Majority of the electricity supply in the state is accounted by AGL, for both residential and small customers.
• While a total of 21 retailers supply electricity to small customers in South Australia, the ‘big three’ retailers - AGL (43%), Origin Energy (23%) and EnergyAustralia (10%) supplied around 76% of that market.
NSW
• Origin Energy is the largest supplier in NSW, to both residential and small business customers.
• 30 retailers supply electricity to small customers in New South Wales - around 86% of these customers are supplied by AGL (23%), Origin Energy (34%) and EnergyAustralia (29%).
ACT
• ActewAGL remains the dominant retailer for both residential and small customers in the ACT – it caters to 91% of small customers.
• Despite signs of decreasing market concentration in previous years following Origin Energy entering the market in September 2014, ActewAGL’s market share fell by just 1 per cent in 2016–17.

249
Aust
ralia
249
Figure 6.2. Electricity retail market share across regions, 2017
0
20
40
60
80
100
Res
iden
tial
cus
tom
ers
South East Queensland
South Australia
ActewAGL AGL Aurora Energy Energy Australia Origin Energy Other retailers
New South Wales ACT Tasmania
Smal
l bus
ines
s cu
sto
mer
s
Res
iden
tial
cus
tom
ers
Smal
l bus
ines
s cu
sto
mer
s
Res
iden
tial
cus
tom
ers
Smal
l bus
ines
s cu
sto
mer
s
Res
iden
tial
cus
tom
ers
Smal
l bus
ines
s cu
sto
mer
s
Res
iden
tial
cus
tom
ers
Smal
l bus
ines
s cu
sto
mer
s
Source: Annual Report on Compliance and Performance of the Retail Energy Market, November 2017
Gas Retail MarketThe availability and uptake of gas varies across jurisdictions. In the ACT, 70% of households are supplied with gas, followed by 55% of households in South Australia and 42% in New South Wales are supplied with gas
Queensland
• In total, four retailers supply gas to small customers in Queensland, and of these, two big retailers supply almost all customers- these are Origin Energy and AGL with approximately 80% and 20% market share respectively.
South Australia
• Seven retailers supply gas to small customers in South Australia.
• Around 88% of customers are supplied by the ‘big three’ retailers –Origin Enery, AGL and EnergyAustralia with the remaining 12% supplied by Alinta Energy, Simply Energy and Savant Energy Power Networks.
NSW
• Eleven retailers supply gas to small customers in New South Wales.
• Despite the number of retailers, the big three retailers i.e. AGL, Energy Australia and Origin collectively supply 94% of all small customers, a 2% decrease from 2015/16.
ACT
• Following the trend in the electricity retail market, ActewAGL is the main retailer in the gas market as well.
Figure 6.3. Gas retail market share across regions, 2017
0
20
40
60
80
100
Queensland South Australia New South Wales ACT
Res
iden
tial
cus
tom
ers
Smal
l bus
ines
s cu
sto
mer
s
Res
iden
tial
cus
tom
ers
Smal
l bus
ines
s cu
sto
mer
s
Res
iden
tial
cus
tom
ers
Smal
l bus
ines
s cu
sto
mer
s
Res
iden
tial
cus
tom
ers
Smal
l bus
ines
s cu
sto
mer
s
ActewAGL AGL Energy Australia Origin Energy Other retailers
Source: Annual Report on Compliance and Performance of the Retail Energy Market, November 2017
Tasmania
• The Tasmanian Government-owned incumbent, Aurora Energy, sells electricity to all residential customers and almost all small business customers in the state.
• Electricity prices remain regulated in the ACT and Tasmania.

250 A Strategic Overview of the Global Energy Markets
Earnings performance of AGL and Origin Energy
AGL’s earnings rebounded in 2017 after two
•
and production assets, which impacted the company’s gas revenue and margins.
• of strengthening wholesale electricity prices and the ongoing
decline in gas margins.
Origin Energy registered a cumulative loss of around A$3.5 billion since 2015, primarily owing to LNG dominated write-downs.
• In August 2017, Origin announced a A$1.2 billion of
LNG project (APLNG), which followed the A$1 billion worth of impairment charge on APLNG announced by Origin in the beginning of the year.
• In addition, some of its traditional oil and gas assets worth
Lattice Energy.
• The other impairments include A$578 million on the Browse Basin project, it purchased from Karoon Gas in 2014 for A$860 million.
Figure 6.4. Five year earnings performance of AGL and Origin Energy, 2013-2017 (A$ million)
-2,500
-2,000
-1,500
-1,000
-500
0
500
1,000400 581 241
-398
530404 539
-728 -612
-2188
2013 2014 2015 2016 2017
Net
pro
t af
ter
tax
AGL Origin
Source: Thomson Reuters

251
Aust
ralia
Benchmarking of Regulated Electricity Network Revenue and Costs
According to the current round of AER decisions, regulated electricity network revenues are forecast to fall by an average 13.5%. Electricity network revenues are forecast to total A$12 billion annually in the current regulatory cycle, of which distribution networks is expected to account for almost 80%.
• The previous round of regulatory determinations between 2012/13-2016/17 was made amid rising network cost to
safety standards, and respond to forecasts made at the time
markets exerted upward pressure on the costs of funding investment.
• borrowing and equity costs have eased accordingly. Lower
years, have reduced the forecast revenue requirements for most network businesses.
and maintenance cost requirements as part of the revenue determination process.
• In the current regulatory cycle, electricity transmission networks on an average are allowed to spend over 10% higher than the previous period and distribution networks are mandated ti spend 17% lower than previous period on operating and maintenance costs per year.
–of AER benchmarking in regulatory assessments, which
networks and hence determined lower maintenance spend for them, to avoid the impact on customer bill.
– However, AER also determined rising operating costs for some distribution companies driven by new regulatory obligations on the businesses, including new regulatory information reporting processes, changes to the connections charging framework, and Power of choice requirement.
– Electricity network revenues primarily comprises of return on capital, depreciation and operating expenditure/cost. Operating cost or network costs are paid by the electricity consumers through network charges in their bill. Therefore an increase in operating cost is expected to have a positive impact on revenue determination and vice versa.
– However, for some network providers like Transgrid, AusNet (Transmission) and SA Power Networks, AER has reduced the allowed revenues in the current regulatory period, despite determining an increase in operating cost. This may be attributed to the lower allowed rate of
operating expenditure on revenue.
Figure 6.5. Change in electricity transmission and distribution network revenues and operating cost – previous (2012/13 – 2016/17) vs. current (2017/18-2021/22) regulatory period
-40%
-30%
-20%
-10%
0%
10%
20%
30%
y-o
-y g
row
th
22%
-15%
-11%
-24%
18%
6%8%
24%
-12%
Powerlink
TransGrid AusNet
ElectraNet
TasNetwor
-18%-22%
-36%
-25%
EnergexErgon Energy
AusGridEndeavour
Energy EssentialEnergy
-22% -23%-25%
-31%
-6%
-28%
7%12%
4%6%
8%
-4%
24%21%
14% 14%
AusNet CitiPower Jemena PowrcorUnited Energy
-15%
-19%
-36%
8%
-2%
-26%
SA PowerNetworks
TasNetworksActewAGL
Transmission Distribution
Change in revenue Change in operating cost
Source: State of the Energy Market, May 2017 (updated Aug 2018)

252 A Strategic Overview of the Global Energy Markets
Benchmarking of Gas Network Revenue and Costs
AER’s decision for the current regulatory period, forecasts an average 12% decline in regulated gas network revenue, compared to the previous period - revenues are forecasted at A$1.4 billion per year in the current cycle.
• Decrease in revenue forecast by AER is largely driven by the
cost of funding investments and therefore requirement for higher revenues might not be necessary to recover the investment cost.
In the current regulatory period, AER forecasts increase in operating expenditure for both gas transmission as well as distribution network providers.
• Gas transmission networks are forecast to spend around A$59 million per year on operating expenses and gas distribution networks are forecast to spend over A$460 million annually on these costs – largest rise is forecasted for Victoria’s
AGN network.
• AER’s decision on the forecast operating expenditure for South Australia’s AGN distribution network, involved a 6% increase in the current regulatory period compared to the previous one- The AER found the network had operated
of expenditure, with increases to cover higher costs in some areas.
• Operating costs for the ACT’s ActewAGL network are forecast to rise by 16% over the same period mainly owing to compliance issues and business-to-business harmonization.
Figure 6.6. Change in gas transmission and distribution network revenues and operating cost – previous (2012/13 – 2016/17) vs. current (2017/18-2021/22) regulatory period
Change in revenue Change in operating cost
14%
-27%
-30%
15% 16%
9%
RBP APA VIS Amadeus-40%
-30%
-20%
-10%
0%
10%
20%
30%
y-o
-y g
row
th
-12%
-17%
9%
16%
20%
Jemena ActewAGL AGN- Victoria Multinet AusNetAGN-
South Australia
-12% -13%
-20%
4%
11%
6%
Transmission Distribution
Source: State of the Energy Market, May 2017 (updated Aug 2018)

253
Aust
ralia
Earnings performance of Citipower, Powercor and AusNet
AusNet’s earnings rebounded in 2017/18, after registering a nearly 50% decline a year ago.
•
•
Yarram and Mickleham and lower revenues associated with the new Electricity Distribution Price Review period (2016-20).
• However, in 2017/18, disciplined cost management measures undertaken by the management resulted in strong operating cost performance and improved the NPAT.
Victoria Power Networks has been recording steady growth in its earnings over the last few years
• over A$150 million in annual savings across both operational and capital expenditure.
• In 2017/18, continuous improvement programs have delivered a further A$17 million in annual savings through additional productivity gains throughout its operations and
reduced EBITDA margins of its unregulated subsidiary Beon
fro the year.
• AusNet’s NPAT, takes into account earnings from both gas and electricity distribution as well as electricity transmission, while NPAT of Victoria Power Network takes into account earnings from electricity distribution business only.
Figure 6.7. Five year earnings performance of Citipower, Powercor and AusNet, 2013-2017 (A$ million)
0
100
200
300
400
500
600
4368 112
188
123
178
23
489
255 291
Net
Pro
t af
ter
Tax
Victoria Power Networks (comprises of Citipower and Powercor) AusNet
Source: Annual Reports

Figure A.1 Peak load, generation capacity and electricity mix (2017)
2,1%
-0,1% -2,7%
-1,4%
2,1%
-2,1%3,7%
0,7%
1,1% 10,1%-1,6% 1,5% -9,3%-17,3%-2,6%-21,6%1,4%-5,5% 0,9%
4,0% -3,4% 2,3% -17,8%-3,8% 2,8% 1,5% -0,2% -4,7%
-3,9%
6,7%
5,3%
2,2%
2,6% -1,3% -5,1%2,1%
1,6% 0,9%2,1% 7,3% -2,3% 3,7% -5,3%
5,1% -3,9% 8,2% 3,6%0,7% 4,2% 7,3% 4,2% 5,9% -4,2% 6,1% -4,9% -4,3%0
50,000
100,000
150,000
200,000
DE FR IT ES PL SE NO NL AT BE RO PT CH CZ FI GR DK BG IE HU SK HR HR SI LT CY LV EE
Tota
l gen
erat
ion
cap
acit
y an
d p
eak
load
[MW
]
Fossil fueled capacity
Low carbon capacity
Peak load 2016
1,040,309MW
2016
945,721MW
2017
Total installed capacity in Europe
-9.10%
MW2017
MW2016
%Change
Fossil fuel capacity
Total
Low carbon capacity
363,332
945,721
532,174
429,777
1,040,309
610,532
-15.50%
-9.10%
-12.80%
Source: ENTSO-E database – Capgemini analysis, WEMO2018
Figure A.2 Share of renewable generation capacity by country (2017)
CodeCountry
AT
BE
BG
CH
CY
CZ
DE
DK
EE
ES
FR
FI
GR
HR
HU
IE
IT
LT
LU
LV
NL
NO
PL
PT
RO
SE
SI
Renewablegeneration
4,356
1,912
444
30,847
4,821
33,846
7,112
1,825
279
3,148
25,104
670
755
3,458
694
259
217
8,388
1,149
6,993
105,708
8,124
6,204
4,381
9,836
3,978
329
875
Totalgeneration
capacity
25,032
17,616
20,845
2,831
104,526
16,392
133,132
19,799
39,389
12,073
1,757
15,784
130,729
4,778
8,569
10,510
3,509
1,738
2,929
31,976
33,329
21,579
208,229
19,957
39,037
16,730
3,816
7,721SK
Austria
Belgium
Bulgaria
Switzerland
Cyprus
Czech Republic
Germany
Denmark
Estonia
Spain
France
Finland
Greece
Croatia
Hungary
Ireland
Italy
Lithuania
Luxembourg
Latvia
Netherlands
Norway
Poland
Portugal
Romania
Sweden
Slovenia
Slovakia
Share of renewablesin generation
capacity
17%
11%
16%
30%
29%
25%
18%
15%
16%
15%
19%
14%
9%
33%
20%
15%
7%
26%
3%
32%
51%
51%
31%
22%
25%
9%
11%
273,800936,696EU 28 29%
24%
Source: Capgemini analysis, WEMO2018
254 A Strategic Overview of the Global Energy Markets
Appendix Figures

Figure A.3 Yearly (2017 and 2018) and winter (2016/2017 and 2017/2018) average electricity spot prices
60
50
40
30
20
10
0
60
50
40
30
20
10
0
Ave
rag
e p
rice
[€/M
Wh]
A
vera
ge
pri
ce[€
/MW
h]
DE - EPEX ES - OMEL FR - EPEX IT - IPEX NORDIC - Nord Pool UK - EPEX
DE - EPEX ES - OMEL FR - EPEX IT - IPEX NORDIC - Nord Pool UK - EPEX
Year 2016Year 2017H1 2018
Winter 2016/2017Winter 2017/2018
40.31
28.96
34.23
52.22
39.61
36.71
44.98
53.94
37.68
51.38
47.1251.16
29.4326.89
53.16
42.7439.99
48.53
34.51
32.76
50.98
42.35
50.52
38.03
52.43
43.41
32.7430.67
50.94
45.96
Source: Power Exchange websites – Capgemini analysis, WEMO2018
Figure A.4 Electricity spot prices on the main European markets (2017 and H1 2018)
7-d
ay r
olli
ng a
vera
ge
pri
ces
[€/M
Wh]
85
75
65
55
45
35
25
15
DE - EPEX FR - EPEXES - OMEL IT - EPEX NORDIC - Nord Pool UK - EPEX
Jan. Feb. March April May Jan. Feb. March April May
201820172016 2017
June July Aug. Sept. Oct. Nov. Dec.
Source: Power Exchange websites – Capgemini analysis, WEMO2018
255

Figure A.7 Residential electricity price breakdown (as of June 2018)
DK LV ESSE DE NLPT HRSISK LU PLAT CYBECZ GRIEFRFI ITLT
RO BGGB MTEE HU
100%
90%
80%
70%
60%
50%
40%
30%
20%
10%
0%
Energy
Distribution
Energy Taxes
VAT
20% 19%17%
20%17% 17% 17% 17% 16% 17%
18%
7%
17%19%
14%17% 17% 21%
16%20%
19%9%
12%11%
5%
15% 17%
5%
47%
1%
13%19% 24%
21%
9%
16%
32% 31%
13%
19%
10%17% 21%
12% 10% 0%11% 6%
3%23%
9%19%
15%
6%0%
0%
19%
55%
41%
32%29%
32%
43%35%
19% 18%
35%39%
37%
28% 29%35% 35%
39%32% 32% 35%
20%
30% 16%
26%21%
21%
13%
14%26% 28% 29% 30% 31% 31% 31% 33% 34% 34% 35% 36% 36% 36%
37%37%
40%41% 42% 43% 47%
50% 53%54%
58%
62%
82%
Source: HEPI by E-Control Austria, MEKH and VaasaETT, 2017; AER; EA, analysis by VaasaETT - WEMO2018
Figure A.5 Status of electricity price regimes (2017)
CountryExistenceof regulated prices of(year of price control removal)
No (2001) No
No (2006)
No (2013)
No
No (2007)
No (2013)
No
No
No (2011) No
No (2007) No
No (2014)
No (2007) No
YesYes
Yes
No
Yes
Yes
YesYes
NoNo
NoNo
NoYes
NoNo
NoYes
YesYes
NoYes
NoNo
NoNo
No
No
No
No
NoNo
NoNo
Non-householdsHouseholds
AT
BE
BG
CZ
DK
EE
FI
FR
DE
GR
HU
NoNoHR
IE
IT
LV
LT
LU
NL
PL
PT
RO
SK
SI
ES
SE
UK
Source: CEER-ACER, National regulators – Capgemini analysis, WEMO2018
Figure A.6 Electricity retail market size (2017)
Country Number of electricitycustomers (in thousands)
6,076
5,860
4,839
5,901
50,200
2,800
561
28,825
3,600
36,865
7,425
5,347
2,236
37,131
1,656
286
1,125
7,743
2,900
16,936
6,076
9,157
5,346
937
2,454
30,115
AT
BE
BG
CZ
DE
DK
EE
ES
FI
FR
GR
HU
2,372HR
IE
IT
LT
LU
LV
NL
NO
PL
PT
RO
SE
SI
SK
UK
Source: Eurogas – Capgemini analysis, WEMO 2018
256 A Strategic Overview of the Global Energy Markets

Figure A.8 Status of gas price regimes (2017)
CountryExistence of regulated prices
(year of price control removal)
No (2002) No
No (2007) No
No (2007) No
No
No (2007)
No (2007)
No (2014)
No (2007)
No
No
YesYes
Yes
No No
Yes
YesYesbut on goingdiscussions)
YesYes
YesYes
No
NoNo
YesYes
Yes
No
No
No
No
Yes
Yes
Yes
Yes
NoYes
Yes
NoNo
NoNo
No
NoNo
No
Non-householdsHouseholds
AT
BE
BG
CZ
DK
EE
FI
FR
DE
GR
HU
NoYesHR
IE
IT
LV
LT
LU
NL
PL
PT
RO
SK
SI
ES
SE
UK
Source: CEER-ACER, National regulators – Capgemini analysis, WEMO2018
Table A.9 Gas retail market size (2017)
CountryNumber of gas customers
(in thousands)
1,346
3,268
87
2,844
21,179
420
52
7,556
31
11,311
325
3,468
661
23,203
562
86
443
7,152
Not developed market
6,852
1,382
3,282
37
136
1,506
2,302
AT
BE
BG
CZ
DE
DK
EE
ES
FI
FR
GR
HU
647HR
IE
IT
LT
LU
LV
NL
NO
PL
PT
RO
SE
SI
SK
UK
Source: Eurogas – Capgemini analysis, WEMO 2018
Figure A.10 Residential gas price breakdown (as of June 2017)
DK LVESSE DE HRNL PTSISK LUAT BE PL CZFR GBIEIT LT
ROBG EEHU GR
100%
90%
80%
70%
60%
50%
40%
30%
20%
10%
0%
Energy
Network
Taxes
VAT
22%
33% 35% 36% 37% 38% 39% 39% 40% 40% 43% 46%47% 47% 48% 52% 53%
55% 55% 55% 55%
60%64%
68%69%26%
51%
24%
12%
39%
33% 32%30%
39%
38% 30%
33% 32%
36%35%
32%22%
36%
24%
31%
26%
23%16% 8%
24%
31%
0%
25%
35%
10%
11%12%
11%
3%3%
10%
4% 4%0%
6%0%
9%
2%
0%
2%
0%0%
0% 8%
3%
20%17%
16% 17%14%
18%17%
20%17%
19%17% 17% 17% 17%
12%16% 16%
7%
21%
11%19%
17% 20%17%
5%
Source: HEPI by E-Control Austria, MEKH and VaasaETT, 2017; AER, EA, analysis by VaasaETT - WEMO2017
257

258 A Strategic Overview of the Global Energy Markets
Churn/SwitchFree (by choice) movement of a customer from one supplier to another
CHP/CogenerationCombined Heat and Power. System of simultaneous generation of electricity and heat. The output from cogeneration plants is substantially better than it would be if they produced only electricity
Clean CoalNew technologies and processes allowing electricity generation from coal while lowering CO2 emissions
Clean Dark Spread/Clean Spark Spread
between electricity’s spot market price and the cost of electricity produced with coal plus the price of related carbon dioxide allowances while the Clean Spark Spread is the same indicator but with electricity produced with natural gas
CCGT/Combined cycle power plantCombined Cycle Gas Turbine. Thermal
turbines, where electricity is generated
combustion in the turbines, and secondly by using energy from the product of the gas combustion process in boilers, which supply heat to steam turbo-generators. This process provides high levels of thermal output (55 to 60%, compared with only 33 to 35% for conventional thermal power plants)
Decentralised generationProduction of electricity near the point of use, irrespective of size and technology, capacity and energy sources
Demand responseAny program which communicates with the end-users regarding price changes in the energy market and encourages them to reduce or shift their consumption
DG CompetitionEuropean Union’s Directorate General for Competition which role is to enforce the competition rules of the Community Treaties
DG TRENEuropean Union’s Directorate General for Transport & Energy that develops EU policies in the energy and transport sectors
Distributed generationAny technology that provides electricity closer to an end-user’s site. It may involve
a small on-site generating plant or fuel cell technology
EBITEarnings Before Interest and Taxes. EBIT may also be called operating income; i.e. the product of the company’s industrial and
operations are taken into account. EBIT
performance of companies
EBITDAEarnings Before Interest, Taxes, Depreciation and Amortization. EBITDA
companies
Eligible customerElectricity or gas consumer authorised to turn to one or more electricity or gas suppliers of his choice
ENTSO-EEuropean Network of Transmission System Operators for Electricity. ENTSO-E, the unique association of all European TSOs, was created at the end of 2008 and is operational since July 1, 2009. All former TSOs associations such as UCTE or ETSO are now part of ENTSO-E
ENTSO-GEuropean Network of Transmission System Operators for Gas. ENTSO-G was created at the end of 2009 and comprises 32 gas TSOs from 22 European countries
EPREuropean Pressurized Reactor. Third generation of nuclear plant technology using advanced Pressurized Water Reactor (PWR)
ERUEuropean Reduction Unit. A unit referring to the reduction of greenhouse gases, particularly under the Joint Implementation where it represents one ton of CO2 reduced
ETSEmissions Trading Scheme. An administrative approach used to control pollution by providing economic incentives for achieving reductions in the emissions of pollutants. The European Union Emissions Trading Scheme has been in operation since January 1, 2005
EUAEuropean Union Allowances. Quotas allocated by the National Allocation Plans in compliance with the European Trading Scheme
ACERAgency for the Cooperation of Energy Regulators, created under the EU Third Legislative Package, adopted in April 2009
Backwardation/Contango“Contango” means that long-term prices are more expensive than short-term prices, depicting a relaxed short-term market, whereas “backwardation” reveals more
short-term prices than in the long-term
Base loadThe minimum amount of electricity delivered or required over a given period, at a constant rate
Bilateral contracts/OTCA contractual system between a buyer and a seller agreed directly without using a third party (exchanges, etc.). Also named as OTC for Over The Counter
Exchangeable or tradable CO2 allowances or quotas within the European Trading Scheme and Kyoto protocol (see EUA)
CAPEXCapital Expenditure, funds used by a company to acquire or upgrade physical assets
CCSCarbon Capture and Storage. Technologies used for isolating carbon dioxide from
lower amount of CO2 is emitted into the atmosphere
CDMClean Development Mechanisms, a mechanism under the Kyoto Protocol through which developed countries may
or removal projects in developing countries, and receive credits for doing so which they may apply towards meeting mandatory limits on their own emissions
CEER/ERGEGCouncil of the European Energy Regulators and European Regulators Group for Electricity and Gas. ERGEG was dissolved with the creation of ACER, all ERGEG works are found in CEER website
CER
issued for emission reductions from Clean
Development Mechanism (CDM) project activities
Glossary

259
while absorbing the infrared radiation returning to space, preventing the heat from escaping. Excessive human emissions including carbon dioxide, methane and other gases contribute to climate change
Guarantee of Origin
that was generated from renewable sources. In this way the quality of the electricity is decoupled from the actual physical volume. It can be used within feed
HHI
accepted measure of market concentration. It is calculated by squaring the market share
then summing the resulting numbers. The HHI number can range from close to zero to 10,000
Hub (gas)Physical or virtual entry/exit points for natural Gas
Hub (retail)Inter Company Data Exchange platform primarily enabling Suppliers and Distribution companies to exchange client related data and making supplier’s switching more reliable
IEDIndustrial Emissions Directive, a European Union Directive that sets strict limits on the pollutants that industrial installations are allowed to spew into the air, water and soil. Installations have until 2016 to comply with the limits
Installed capacityThe installed capacity represents the maximum potential net generating capacity of electric utility companies and auto- producers in the countries concerned
IPCCIntergovernmental Panel on Climate Change, the leading body for the assessment of climate change, established by the United Nations Environment Programme (UNEP) and the World Meteorological Organization (WMO)
current state of climate change and its potential environmental and socio- economic consequences
JIJoint Implementation, a mechanism under the Kyoto Protocol allowing industrialised
EurelectricProfessional association which represents the common interests of the Electricity industry at pan-European level
European Commission (EC)A governing body of the European Union that oversees the organization’s treaties, recommends actions under the treaties, and issues independent decisions on EU matters
European CouncilA body formed when the heads of state or government of European Union member states meet. Held at least twice a year, these meetings determine the major guidelines for the EU’s future development
European Parliament (EP)The assembly of the representatives of the Union citizens
EWEAEuropean Wind Energy Association
FIDFinal Investment Decision
ForwardsA standard contract agreement for delivery of a given quantity at a given price, for a given maturity (OTC markets)
FuturesA standard contract agreement for delivery of a given quantity at a given price, for a given maturity (organized exchanges).
exchanges (weekly, half-yearly, quarterly, monthly, annually). Maturity Y+1 corresponds to the calendar year after the current year
GECFGas Exporting Countries Forum. GECF is a gathering of the world’s leading gas producers
GIEGas Infrastructure Europe. GIE is the association representing gas transmission companies (GTE), storage system operators (GSE) and LNG terminal operators (GLE) in Europe
tradable
The warming of the atmosphere caused by the build up of ‘greenhouse’ gases, which allow sunlight to heat the earth
countries with a greenhouse gas reduction commitment to invest in emission reducing projects in another industrialised country as an alternative to emission reductions in their own countries
Kyoto ProtocolThe United Nations regulatory frame for greenhouse gases management, adopted in December 1997. It entered into force in February 2005 and ends in 2012. It encompasses 6 greenhouse gases: CO2, CH4, N2O, HFC, PFC, SF6
LCOE (levelized cost of energy)LCOE is the cost of electricity produced by a generator calculated by accounting for all of a system’s expected lifetime costs (including
taxes, insurance and incentives), which are then divided by the system’s lifetime expected power output (kWh).
LCPDLarge Combustion Plant Directive, a European Union Directive that aims to
and particulates by controlling the emissions of sulphur dioxide, oxides of nitrogen and dust from large combustion plant. All combustion plant built after 1987 must comply with the emission limits in LCPD. Those power stations in operation
plant’. Existing plant can either comply with the LCPD through installing emission abatement (Flue Gas Desulphurisation)equipment or ‘opt-out’ of the directive. An existing plant that chooses to ‘opt-out’ is restricted in its operation after 2007 and must close by the end of 2015
LNG
been subjected to high pressure and very low temperatures and stored in a liquid state. It is returned to a gaseous state by the reverse process and is mainly used as a peaking fuel
Load balancingMaintaining system integrity through measures which equalize pipeline (shipper) receipt volumes with delivery volumes during periods of high system usage. Withdrawal and injection operations into underground storage facilities are often used to balance load on a short-term basis

260 A Strategic Overview of the Global Energy Markets
supplied during periods of relatively low
On-peakOn-peak energy is electric energy supplied during periods of relatively high system
OPECOrganization of the Petroleum Exporting Countries
Open seasonA period (often 1 month) when a pipeline
and others for potential new transportation capacity. Bidders may or may not have to provide “earnest” money, depending upon the type of open season. If enough interest is shown in the announced new capacity, the
and prepare an application for construction before the appropriate regulatory body for approval
OPEXOperational Expenditure, expenditures that a business incurs as a result of performing its normal business operations
P/EPrice / Earning ratio. The ratio of the share price to the Earning per share (EPS). P/E ratio is one of the tools most commonly used for valuing a company share
Peak loadThe highest electrical level of demand within a particular period of time
Peak shavingReduction of peak demand for natural gas or electricity
PPU (Programmations pluriannuelles de l’énergie) Multi-year Energy Programming, a tool for planning and steering national energy policy,
the period 2016-2023, targeting all energy sources, in order to achieve the national objectives set by the LTE
RESRenewable Energy Sources. Energy (electricity or heat) produced using wind, sun, wood, biomass, hydro and geothermal. Their exploitation generates little or no waste or pollutant emissions
ShippersThe party who contracts with a pipeline operator for transportation service. A
that the volume of gas delivered to the transporter is consistent with nominations.
in the pipeline and the volume delivered by the pipeline back to the shipper is brought into balance as quickly as possible
Solar Power EuropeEuropean Photovoltaic Industry Association. The association that represents the photovoltaic (PV) industry towards political institutions at European and international level.
Spot contractShort-term contract, generally a day ahead
Take-or-pay contractContract whereby the agreed consumption has to be paid for, irrespective of whether the consumption has actually taken place
Third Energy PackageThird Energy Package. A legislative package proposed on September 19, 2007 by the EC in order to pursue the liberalisation of the electricity and gas markets
TPAThird Party Access. Recognised right of each user (eligible customer, distributor, and producer) to access in a non
transmission or distribution systems in exchange for payment of access rights
UFC Federal Union of Consumers
UnbundlingSeparation of roles according to the value chain segment (generation, transmission, distribution, retail) required by European Directives for enabling fair competition rules
UNEPUnited Nations Environment Program
energy savings (electricity, gas, fuel, …) at end-users’ site, like a home or a business. They are tradable or not
Load factorRatio of average daily deliveries to peak-day deliveries over a given time period
Market couplingMarket coupling links together separate markets in a region, whereas market splitting divides a regional market into prices zones.
and makes them converging wherever
border market coupling also drives better use of interconnection capacity
Merit orderThe merit order is a way of ranking available sources of energy, especially electrical generation, in ascending order of their short-run marginal costs of production, so that those with the lowest marginal costs
meet demand, and the plants with the highest marginal costs are the last to be brought on line
MeteringMeasurement of the various characteristics of electricity or gas in order to determine the amount of energy produced or consumed
NAPNational Allocation Plan. List of selected industrial and power installations with their
system)
NEEAPs
providing detailed roadmaps of how each Member State expects to reach its energy
NREAPsNational Renewable Energy Action Plans, plans providing detailed roadmaps of how
each Member State expects to reach its legally binding 2020 target for the share
consumption
NominationA request for a physical quantity of gas under a
NTCNet Transfer Capacity. NTC is the expected maximal electrical generation power that can be transported through the tie lines of two systems without any bottlenecks appearing in any system

261
1. ACCC: Australia Competition and Consumer Commission2. 3. ACT: Australian Capital Territory4. ADIT: Accumulated Deferred Income Tax5. AEMC: Australian Energy Market Commission6. AER: Australian Energy Regulator 7. AGA: Advanced Grid Analytics8. AMI: Advanced Metering Infrastructure9. 10. APGCC: ASEAN Power Grid Consultative Committee11. ARENA: Australian Renewable Energy Agency12. ARFVTP: Alternative and Renewable Fuel and Vehicle
Technology Program13. ARRA: American Recovery and Reinvestment Act14. ASEAN: Association of Southeast Asian Nations15. BAU: Business-as-usual16. Bcm: Billion cubic meters17. BNEF: Bloomberg New Energy Finance18. CAFÉ: Corporate Average Fuel Economy19. CapEx: Capital Expenditure20. CC: Contestable Consumers21. CCA: Climate Council Authority22. CCC: Climate Change Commission23. CEVS: Carbon Emissions-Based Vehicle Scheme24. CO
2: Carbon dioxide25. CO2e: Carbon dioxide Equivalent26. COAG: Council of Australian Governments27. COP22: 22nd Conference of the Parties 28. CPP: Clean Power Plan29. CREZ: Competitive Renewable Energy Zones30. CRI: Climate Risk Index31. CRM: Customer relationship management32. CSI: California Solar Initiative33.
Research Organization34. DER: Distributed Energy Resource35. DES: Distributed Electricity and Storage36. 37. DOE: Department of Energy38. DSO: Distribution System Operator39. DSM: Demand-side Management40.
Assistance Scheme41. EBITA: Earnings before Interest, Taxes,
and Amortization42. EBITDA: Earnings before Interest, Tax, Depreciation
and Amortization43. EC: Energy Commission44. ECF: Equity Crowd Funding45. 46. 47. EIA: Energy Information Administration48. EMA: Electricity Market Authority49. EPA: Environmental Protection Agency
50. EPS: Earnings per Share51. ERCOT: The Electric Reliability Council of Texas52. ETS: Emissions Trading Scheme53. EV: Electric Vehicle 54. FERC: The Federal Energy Regulatory Commission55. FFO: Funds from Operation56. FFR: Fast Frequency Response57. FPSS: Future Power System Security 58. FPA: Federal Power Act59. FRC: Full Retail Contestability60. GCF: Green Climate Fund61. GDP: Gross Domestic Product62. GHG: Greenhouse Gas63. GIS: Geographic Information System64. GJ: Gigajoules 65. GMI: Grid Modernization Initiative66. GMLC: Grid Modernization Lab Consortium67. 68. GTFS: Green Technology Financing Scheme69. GW: Gigawatt70. HEV: Hybrid Electric Vehicle71. IA: Investment Allowance72. IBR: Incentive Based Regulation73. ICT: Information and Communication Technologies74. IEA: International Energy Agency75. IEC: International Energy Consultants76. IFC: The International Finance Corp77. INDC: Intended Nationally Determined Contribution78. IoT: Internet of Things79. IPP: Independent Power Producer80. IPv6: Internet Protocol version 681. ISO: International Organization for Standardization82. IVR: Interactive Voice Response83. kgoe: Kilograms of oil equivalent84. KW: Kilowatt85. KWh: Kilowatt-hours86. LCOE: Levelized Cost of Energy87. 88. 89. LRET: Large-scale Renewable Energy Target90. LSS: Large Solar Scale91. M2M: Machine to Machine92. MDM: Meter Data Management93. MIDA: Malaysian Investment Development Authority94. MMBTU: Million Metric British Thermal Units95. MMT: Million Metric Tonnes96. MMTPA: Million Metric Tonnes Per Annum97. MNCAA: The Mayors National Climate Action Agenda98. MOU: Memorandum of Understanding99. MSCI: Morgan Stanley Capital International100. Mtoe: Million Tonnes of Oil Equivalent101. MW: Megawatts102. MWh: Megawatt-hours103. NAFTA: North American Free Trade Agreement
List of Acronyms

262 A Strategic Overview of the Global Energy Markets
104. NDC: Nationally Determined Contributions105. NEA: National Environment Agency106. NEB: National Energy Board107. NECF: National Energy Customer Framework108. NEPA: National Environmental Policy Act109. NEM: National Electricity Market110. NEMS: National Energy Modeling System111. NGV: Natural Gas Vehicle112. NIA: National Irrigation Administration113. NIC: Network Interface Card114. NOL: Net Operating Loss115. NREP: National Renewable Energy Program116. NSPS: New Source Performance Standards117. NSW: New South Wales118. OECD: Organization for Economic Co-operation
and Development119. PACE: Property Assessed Clean Energy120. PHEV: Plug-in Hybrid Electric Vehicle121. PEV: Plug-in Electric Vehicle122. PBR: Performance-Based Ratemaking123. PPAs: Power Purchasing Agreements124. PPP: Public Private Partnership125. PV: Photovoltaic126. RGGI: Regional Greenhouse Gas Initiative127. RE: Renewable Energy128. REP: Retail Electric Provider129. RES: Renewable Energy Sources130. RET: The Renewable Energy Target131. RIT-T: Regulatory Investment Test for Transmission132. RPS: Renewable Portfolio Standards133. RRO: Regional Reliability Organizations134. RTO: Regional Transmission Organization135. SCA: Scheme of Control Agreement136. SCC: Social Cost of Carbon137. 138. SEA: Southeast Asia139. 140. SMOC: Streaming Media Online Charging System141. SoC: Scheme of Control142. SRES: Small-scale Renewable Energy Scheme143. SSR: Summer Saver Rebate144. S&P: Standard & Poor’s145. TCF: Trillion cubic feet 146. ToU: Time-of-Use147. TWh: Terawatt Hours148. T&D: Transmission and Distribution149. UNCED: United Nations’ Conference on Environment
and Development150. UNFCCC: United Nations Framework Convention on
Climate Change151. USTDA: United States Trade and Development Agency152. 153. VES: Vehicular Emissions Scheme154. VPP: Virtual Power Plant
155. VRE: Variable Renewable Electricity156. VWEM: Vietnam Competitive Wholesale
Electricity Market157. WSD: Water Supplies Department158. WTE: Waste-to-Energy159. WTO: The World Trade Organization160. YTD: Year to date161. ZEV: Zero-Emission Vehicle

263
Country Abbreviations and Energy Authorities
Countries Abbreviation Regulators Ministries or authorities for energy-related topics
Austria AT E-Control
Ministry of Agriculture, Forestry, Environment and Water Management: www.bmlfuw.gv.at/
Environment Agency: www.umweltbundesamt.at/
Competition Authority: http://www.bwb.gv.at/
Belgium BE
CREG (national)
http://economie.fgov.be/BRUGEL (Brussels)CWAPE (Walloon)VREG (Flanders)
Bulgaria BG DKER Ministry of Economy and Energy: www.mi.government.bg/
Canada CA NEBNational Energy Board: www.neb-one.gc.caMinistry of Energy: http://www.energy.gov.on.ca
Croatia HR HERA Ministry of Economy, Labour and Entrepreneurship: www.mingo.hr/
Czech Republic CZ ERUMinistry of Industry and Trade: www.mpo.cz/
www.compet.cz/
Denmark DKDERA
NordREG
Energy Agency: www.ens.dk/www.evm.dk/
Ministry of Environment: www.mim.dk/
Estonia EE ETIwww.mkm.ee/
Competition Authority: www.konkurentsiamet.ee/
Finland FIEMV
NordREG
Ministry of Employment and the Economy: Ministry of Environment: Competition Authority:
France FR CRE Ministry of Ecology, Sustainable Development and Energy: www.developpement-durable.gouv.fr/
Germany DE BNetzAFederal Environment Ministry: www.bmu.de/Energy Agency: www.dena.de/Competition Authority: www.bundeskartellamt.de/
Greece GR RAEMinistry of Development: www.mindev.gov.gr/el/Ministry of Environment, Energy and Climate Change: www.ypeka.gr/Competition Commission: www.epant.gr/
Hungary HU MEH www.mekh.hu/
Hong-Kong HK EMSDElectrical and Mechanical Services Department: www.emsd.gov.hkEnvironment Bureau: http://www.enb.gov.hk/en/
Ireland IECER (Republic of Ireland)
Department of Communications, Energy & Natural Resources: www.dcenr.gov.ie/Energy/NIAUR (Northern Ireland)
Italy IT AEEGMinistry of Environment: www.minambiente.it/Ministry of Economic Development: www.sviluppoeconomico.gov.it/Competition Authority: www.agcm.it/
Latvia LV SRPKMinistry of Economy: www.em.gov.lv/Competition Council: www.kp.gov.lv/
Lithuania LT REGULA Ministry of Economy: www.ukmin.lt/Luxemburg LU ILR www.eco.public.lu/
Malaysia MY ST Energy Commission : www.st.gov.my
Mexico MX SENERSecretaría de Energía de México: www.gob.mxComisión Federal de Electricidad: http://www.cfe.gob.mx
Netherlands NL DTe
www.rijksoverheid.nl/
Energy Council: www.algemene-energieraad.nl/Competition Authority: www.nmanet.nl/
Norway NONVE
NordREGOil and Energy Ministry: www.regjeringen.no/Competition Authority: www.konkurransetilsynet.no/
Philippines PH ERC Energy Regulatory Commission: www.erc.gov.phPoland PL URE Ministry of Economy: www.me.gov.pl
Portugal PT ERSEMinistry of Economy: www.min-economia.pt/Directorate General for Energy and Geology: www.dgeg.pt/
Romania RO ANRE Ministry of Energy and Resources: www.minind.ro/Singapore SG EMA Energy Market Authority: www.ema.gov.sg
Slovakia SK URSOMinistry of Economy: www.economy.gov.sk/Ministry of Environment: www.enviro.sk/
Slovenia SI AGEN Ministry of Infrastructure: www.mzip.gov.si/
Spain ES CNMC Ministry of Industry, Energy and Tourism: www.minetur.gob.es/Ministry of Agriculture, Fishing & Food: www.mapa.gob.es/Ministry of Ecologic Transition: www.miteco.gob.es/
Sweden SEEI
NordREGMinistry of Energy: www.regeringen.se/Competition Authority: www.kkv.se/
Switzerland CH BFEFederal Department of Environment, Transport, Energy and Communications: www.uvek.admin.ch/Competition Authority: www.weko.admin.ch/
Taiwan TW BOE www.moeaboe.gov.tw
United Kingdom UK OFGEMDepartment of Energy and Climate Change: www.decc.gov.uk/Competition Authority: www.gov.uk/government/organisations/competition-and-markets-authority
United States of America USA DoE U.S. Department of Energy (DoE): https://www.energy.gov/
Vietnam VN MOIT Ministry of Industry and Trade: www.moit.gov.vn

264 A Strategic Overview of the Global Energy Markets
Report Sponsor
Philippe Vié+33 1 49 67 42 [email protected]
Project Manager
Alexandra Bonanni+33 1 49 67 42 [email protected]
Editorials
Colette Lewiner [email protected]
Perry [email protected]
Randall [email protected]
Gaurav [email protected]
Kiran [email protected]
Anastasia [email protected]
NORTH AMERICA
Ajay [email protected]
Sabyasachi Roy +91 90511 [email protected]
EUROPE
Partners
"Switching and pricing" insights-VaasaETT-
Christophe Dromacque+358 (0)4 4906 68 [email protected]
Hanna Launonen+358 (0)4 4906 68 [email protected]
"Capacity Mechanisms" and "Will regulated energy
+ 33 (0) 1 53 57 71 95
Paul Courtade + 33 (0) 1 72 69 70 28
Elisabeth Creux+ 33 (0) 1 72 69 70 72
Climate Change
Alain [email protected]
Piotr [email protected]
Anne-Sophie [email protected]
Energy Transition
Marianne [email protected]
Alain [email protected]
Victor [email protected]
Ozlem [email protected]
François [email protected]
Guillaume [email protected]
Thomas Andre Benestad [email protected]
Gry-Helene [email protected]
Team and AuthorsGuilain Silve [email protected]
Infrastructure and Adequacy of Supply
Electricity
Yann de [email protected]
Madeleine [email protected]
Colette Talbot [email protected]
Lamya [email protected]
Gas
Bakr [email protected]
Akram Al [email protected]
Hubert Clé[email protected]
Emmanuel [email protected]
Naim Bou [email protected]
Supply and Final Customer
Caroline Coquin [email protected]
Julien Cossé [email protected]
Salma Zouari [email protected]
David [email protected]
New services and New Business Models
Florent Andrillon
Alain [email protected]
Arhur Arrighi de [email protected]
Gabrielle [email protected]
Benjamin Vergnhes-Henniaux [email protected]
Piotr [email protected]

265
Dorian Pons [email protected]
Pierre Henri De la [email protected]
Anne Sophie [email protected]
Pettersen, Gry Helene [email protected]
Laukeland, Astrid K [email protected]
Financials
Bénédicte Martin [email protected]
Patrice [email protected]
Badr [email protected]
Gabrielle [email protected]
Florian Schall
Ozlem [email protected]
SOUTHEAST ASIA
Kiran [email protected]
Sabyasachi Roy +91 [email protected]
Vandana Chaudhary+91 97690 [email protected]
Brinta De +91 72599 [email protected]
AUSTRALIA
Anastasia [email protected]+61 3 9613 3619
Sabyasachi Roy +91 90511 [email protected]
Sreeja Dutta+91 98369 [email protected]
Marketing & Communication
Vito Labate [email protected]
Mayank [email protected]
+33 1 47 54 51 08
Kunal [email protected]
Biplab [email protected]
Florence Lièvre+33 1 47 54 50 00
Coordinator
Gaelle [email protected]

266 A Strategic Overview of the Global Energy Markets
About VaasaETTVaasaETT is a research and advisory consultancy dedicated to customer related issues in the energy industry. VaasaETT advises its clients based on empirical evidence brought about from extensive research in the area of customer behavior, competitive market behavior and consumer-centric dynamics (including smart
smart grid). VaasaETT’s unique collaborative approach enables it to draw on an extensive network of several thousand energy practitioners around the world who can contribute to its research activities or take part in industry events it organizes allowing VaasaETT to integrate global knowledge and global best practice into its areas of expertise.
VaasaETT’s truly global focus is
support having been provided to a diverse array of organizations on
large industry players, the European Commission, Government and public research bodies in Europe, Japan, the UAE, the Middle East and Australia.
More information at www.vaasaett.com
of France’s leading independent
33 partners.
Founded in 1993, the Firm has become a key player in French business law and also has a highly regarded
lawyers regularly advise on both domestic and international matters, and clients primarily include large French and overseas corporations.
In addition, the Firm works with an extensive network of referral law

267

The information contained in this document is proprietary. Copyright © 2018 Capgemini. All rights reserved.
A global leader in consulting, technology services and digital transformation, Capgemini is at the forefront of innovation to address the entire breadth of clients’ opportunities in the evolving world of cloud, digital and platforms. Building on its strong 50-year heritage and deep
their business ambitions through an array of services from strategy to operations. Capgemini is driven by the conviction that the business value of technology comes from and through people. It is a multicultural company of 200,000 team members in over 40 countries. The Group reported 2017 global revenues of EUR 12.8 billion.
Visit us at
www.capgemini.com/utilities
About Capgemini