Welsh Housing Conditions Survey 2017-18: Energy …...2 1. Background The Welsh Housing Conditions...
42
Statistician: Abigail Woodham ~ 0300 025 1053 ~ [email protected] This report is also available in Welsh Enquiries from the press: 0300 025 8099 Public enquiries : 0300 025 5050 Twitter: @StatisticsWales Welsh Housing Conditions Survey 2017-18: Energy Efficiency of Dwellings 23 October 2019 SB 44/2019 The Welsh Housing Conditions Survey (WHCS) 2017-18 collected information about the condition and energy efficiency/performance of all types of housing in Wales. The Survey included all tenures, but not vacant dwellings. This bulletin contains information on energy efficiency of dwellings and energy saving measures. Unless otherwise stated differences discussed within this release are statistically significant. This bulletin contains only a selection of the results, further breakdowns can be found on our results viewer. Main points Homes in Wales have become significantly more energy efficient over the last decade, with social housing having the highest percentage of dwellings in EPC bands C or above. Flats were more energy efficient than houses; 55% of flats had an EPC band C and above compared with 25% of houses. Dwellings in rural areas tend to be less energy efficient than dwellings in urban areas. 7% of dwellings in Wales used at least one type of renewable energy in 2017-18 compared with less than 1% in 2008. 65% of dwellings in Wales are constructed of cavity masonry and 26% are constructed of solid masonry. Most dwellings in Wales (82%) used gas to heat their homes. Condensing-combi boilers were the most common boiler type (66%). About this bulletin This bulletin provides a national assessment of energy efficiency of dwellings, across all tenures, as measured by the Welsh Housing Conditions Survey (WHCS) 2017-18. This report also includes information on renewable energy, fuel usage and heating systems and makes comparisons to data on energy efficiency of dwellings from the Living in Wales Property Survey 2008 . In this release Background 2 Energy Performance 3 Energy Efficiency Measures 14 Construction Type 18 Renewable Energy 22 Heating Systems 26 Annex 35 Key Quality Information 38
Transcript of Welsh Housing Conditions Survey 2017-18: Energy …...2 1. Background The Welsh Housing Conditions...

Statistician: Abigail Woodham ~ 0300 025 1053 ~ [email protected] This report is also available in Welsh
Enquiries from the press: 0300 025 8099 Public enquiries : 0300 025 5050 Twitter: @StatisticsWales
Welsh Housing Conditions Survey 2017-18: Energy Efficiency of Dwellings
23 October 2019
SB 44/2019
The Welsh Housing Conditions Survey (WHCS) 2017-18 collected
information about the condition and energy efficiency/performance of all types
of housing in Wales. The Survey included all tenures, but not vacant
dwellings. This bulletin contains information on energy efficiency of dwellings
and energy saving measures. Unless otherwise stated differences discussed
within this release are statistically significant. This bulletin contains only a
selection of the results, further breakdowns can be found on our results
viewer.
Main points
Homes in Wales have become significantly more energy efficient over the
last decade, with social housing having the highest percentage of
dwellings in EPC bands C or above.
Flats were more energy efficient than houses; 55% of flats had an EPC
band C and above compared with 25% of houses.
Dwellings in rural areas tend to be less energy efficient than dwellings in
urban areas.
7% of dwellings in Wales used at least one type of renewable energy in
2017-18 compared with less than 1% in 2008.
65% of dwellings in Wales are constructed of cavity masonry and 26% are
constructed of solid masonry.
Most dwellings in Wales (82%) used gas to heat their homes.
Condensing-combi boilers were the most common boiler type (66%).
About this bulletin
This bulletin provides a
national assessment of
energy efficiency of
dwellings, across all
tenures, as measured by
the Welsh Housing
Conditions Survey
(WHCS) 2017-18.
This report also includes
information on renewable
energy, fuel usage and
heating systems and
makes comparisons to
data on energy efficiency
of dwellings from the
Living in Wales Property
Survey 2008 .
In this release
Background 2
Energy Performance 3
Energy Efficiency
Measures 14
Construction Type 18
Renewable Energy 22
Heating Systems 26
Annex 35
Key Quality
Information 38

2
1. Background
The Welsh Housing Conditions Survey (WHCS) 2017-18 collected information about the condition
and energy efficiency/performance of all types of housing in Wales. The Survey included all
tenures, but not vacant dwellings. The WHCS is very much a standard housing conditions survey
and where appropriate it has been adapted to meet the needs of housing policy in Wales. It is
similar to those previously conducted in Wales and those of other UK nations. Where possible,
comparisons to other UK nations have been made, using the most up to date data available at the
time of preparing the publication. (See Key Quality Information).
Information gathered in the WHCS allows properties to be assessed for energy efficiency, Welsh
Housing Quality Standard (WHQS), fuel poverty and the Housing Health and Safety Rating System
(HHSRS). It will also help improve the housing domain in the Welsh Index of Multiple Deprivation
2019 update and underpin two of the Well-being of Future Generations National Indicators for
Wales, specifically dwellings free from hazards and dwellings with adequate energy performance.
Policy Context
Two of the six cross-cutting priority areas of the national strategy Prosperity for All are Housing and
Decarbonisation.
The Welsh Government’s Decarbonisation Programme requires that the carbon demand of Welsh
Homes reduces by 80% (of 1990 levels) by 2050. A programme for the next term of government is
being developed. The use of WHCS data in combination with other research will inform the
programme direction on what works and how to target resources most effectively.
Since 2011, the Welsh Government have invested more than £240 million to improve the energy
efficiency of more than 45,000 homes of those on low incomes or living in the most disadvantaged
areas of Wales through the Warm Homes Programme. Further investment of £104 million is being
provided for the Welsh Government Warm Homes for the period (2017-2021).
The Welsh Government’s Fuel Poverty Strategy ended in December 2018. Data from the Welsh
Housing Conditions Survey will be used to develop outcome focussed objectives for the new
Strategy which is currently in development. The Welsh Government’s energy efficiency strategy
was set out for ten years: 2016 to 2026. The strategy indicates that taking action now and making
plans for energy efficiency in the future will:
• contribute strongly across our wellbeing goals;
• be the most cost-effective means of meeting our commitments to reduce carbon emissions; and
• directly address fuel poverty by reducing the cost of heating the homes of vulnerable people.

3
2. Energy performance
This section provides analysis of the Welsh Housing Conditions Survey (WHCS) 2017-18 data
relating to the energy performance and environmental impact of dwellings. Dwellings were
awarded two classifications, both of which used the Standard Assessment Procedure (SAP);
Energy Efficiency rating (widely referred to as the Energy Performance Certificate (EPC)
banding)
Environmental Impact (EI) rating.
Both ratings are divided in to bands A to G, with band A being awarded to the best performing
dwellings and G to the worst.
The SAP rating system is the methodology used by the Government to assess and compare how
much energy a dwelling consumes and how much carbon dioxide it emits, based on standardised
occupancy conditions. The assessment is based on standardised assumptions for occupancy and
behaviour. This enables a like-for-like comparison of dwelling performance. The ratings are
expressed on a scale between 1 and 100, where 100 represents no energy cost.
The EI rating is based on the dwelling’s impact on the environment in terms of carbon dioxide
(CO2) emissions associated with running the dwelling.
The most recent SAP methodology, SAP 2012, was used in the Welsh Housing Conditions Survey
2017-18. SAP 2012 is used by the other UK nations in their latest data meaning comparisons can
be made. The Living in Wales Property Survey 2008 data has also been updated using the SAP
2012 methodology for comparative purposes. For more detail on SAP rating methodology, please
see Key Quality Information.
Table 1.1: EPC and EI bands
EPC/EI band SAP/EI Rating
A 92-100 (most efficient)
B 81-91
C 69-80
D 55-68
E 39-54
F 21-38
G 1-20 (least efficient)
Energy efficiency
As previously reported the average SAP rating for dwellings in Wales was 61 which is equivalent to
EPC band D. Further breakdowns of average SAP ratings, along with UK comparisons were
included in the headline results and breakdowns for Wales can also be found on the results viewer.
This bulletin focuses mainly on the EPC bands rather than the average SAP ratings.

4
Chart 2.1: EPC bands, Wales, 2008 and 2017-18
Sources: Welsh Housing Conditions Survey 2017-18
Living in Wales Property Survey 2008
(a) There were no dwellings in EPC band A captured in LIW 2008 and the WHCS 2017-18 but administrative
data shows that there are some dwellings in Wales with EPC band A
In Wales, the percentage of dwellings in EPC band D or above increased between 2008 and 2017-
18, whereas the percentage of dwellings in bands E or below decreased.
As part of the Welsh Government aim to achieve net zero carbon emissions by 2050, a
recommendation has been made to the Welsh Government by the Decarbonisation of Homes
Advisory Group, to set a target to retrofit the Welsh housing stock in order to achieve an EPC band
A rating (recognising that not all homes will be able to achieve this). A recommendation has also
been made to Welsh Government to ensure that by 2025, all newly built homes in Wales must be
built to be low carbon, energy and water efficient and climate resilient.
28% of dwellings in Wales had an EPC rating of band C or above. When compared with the other
UK Nations, Wales has the lowest percentage of dwellings in EPC band C or above;
England1 - In 2017-18, 30% of dwellings had an EPC rating of band C or above.
Scotland2 - In 2017, 42% of dwellings had an EPC rating of band C or above.
Northern Ireland3 - In 2016, 49% of dwellings had an EPC rating of band C or above.
The differences between the UK nations could be attributed, at least in part, to the age and type of
the dwelling stock. Wales has the oldest stock and the lowest proportion of dwellings with an EPC
rating of band C or above; Northern Ireland has the newest stock and the highest proportion of
dwellings with an EPC rating of band C or above.
1 English Housing Survey 2016: Energy report 2 Scottish house condition survey: 2017 key findings 3 Northern Ireland House Condition Survey Main Report 2016

5
Welsh Housing Quality Standard (WHQS)
The Welsh Housing Quality Standard (WHQS) is the Welsh Government standard of housing
quality for social housing. The WHQS was first introduced in 2002 and aims to ensure that all
dwellings are of good quality and suitable for the needs of existing and future residents. The Welsh
Government set a target for all social landlords to improve their housing stock to meet the WHQS
as soon as possible, but in any event by 2020.
The WHQS measures 42 individual elements within seven categories:
• in a good state of repair
• safe and secure
• adequately heated, fuel efficient and well insulated
• contain up-to-date kitchens and bathrooms
• well managed (for rented housing)
• located in attractive and safe environments
• as far as possible suit the specific requirements of the household (e.g. specific disabilities).
Chart 2.2: EPC bands by tenure, Wales, 2008 and 2017-18 (a)
Sources: Welsh Housing Conditions Survey 2017-18
Living in Wales Property Survey 2008
(a) Living in Wales data has been updated to SAP 2012 so direct comparisons can be made.
(b) The proportion of private rented dwellings in bands B and C is based on small sample sizes and is therefore
less robust and should be treated with caution.
(c) There were no dwellings in EPC band A captured in LIW and the WHCS but adminstrative data shows that
there are some dwellings in Wales with EPC band A.

6
In 2017-18, social housing was far more energy efficient than the other tenures, with 50% of
dwellings having an EPC rating of band C and above. This is likely to be a result of improvements
made to social housing as part of the WHQS and because social housing dwellings tend to be
newer. The energy efficiency of dwellings in the owner-occupied and private rented sectors are
broadly similar with 24% and 25% of dwellings having an EPC rating of band C or above
respectively.
English housing stock 4 was broadly similar to Wales although with slightly better energy efficiency
across all tenures. The housing stock in Scotland5 had a similar pattern where the social housing
tenure was the most energy efficient, with the energy efficiency of owner occupied and private
rented dwellings being broadly similar. Across all tenures, dwellings in Scotland were more energy
efficient than in Wales. Dwellings in Northern Ireland6 had much better energy efficiency across all
tenures than dwellings in Wales. This was highest in the social housing tenure with owner
occupied and private rented dwellings being broadly similar to one another.
Across all tenures in Wales, the percentage of dwellings with an EPC rating of band B and C
increased between 2008 and 2017-18 and the percentage of dwellings with an EPC rating of band
E, F and G decreased. The social housing tenure saw the largest increase in the percentage of
properties with an EPC rating of band B or C from just 14% in 2008 to 50% in 2017-18. The private
rented sector has seen the greatest reduction in properties in bands E, F and G, decreasing from
64% in 2008 to 21% in 2017-18. It should be noted that the private rented sector has seen the
largest growth in numbers, most of this being newly built let to buy properties, so this could account
for some of the change.
4 English Housing Survey 2016 5 Scottish House condition survey 2017 6 Northern Ireland House Condition Survey 2016

7
Chart 2.3: EPC bands, by age of dwelling, Wales, 2017-18
Source: Welsh Housing Conditions Survey 2017-18
(a) The percentage of 1919 to 1944 dwellings in EPC bands B and C is based on small sample sizes and is
therefore less robust and should be treated with caution(b) There were no dwellings in EPC band A captured in
the WHCS but administrative data shows that there are some dwellings in Wales with EPC band A.
(b) There were no dwellings in EPC band A captured in LIW and the WHCS but adminstrative data shows that
there are some dwellings in Wales with EPC band A.
As expected, chart 2.4 shows that newer dwellings have better energy efficiency ratings. Dwellings
built before 1919 have the lowest proportion with EPC band B or C (7%) which increases to 59%
for dwellings built after 1980.

8
Chart 2.4: EPC bands,by type of dwelling, Wales, 2017-18
Source: Welsh Housing Conditions Survey 2017-18
(a) The proportion of flats in band E,F and G is based on small sample sizes and is therefore less robust and
should be treated with caution. This category includes purpose built flats, converted flats and flats plus non-
residential dwellings.
(b) There were no dwellings in EPC band A captured in the WHCS but administrative data shows that there are
some dwellings in Wales with EPC band A
For all types of dwelling, the most common EPC band rating was D, with the exception of flats
where this was B and C combined. Detached dwellings show a different pattern to the other
dwelling types, as less than half of detached dwellings have an EPC band D rating. There are also
a higher proportion of dwellings in the lowest EPC bands for detached dwellings compared to the
other type of dwellings.
Changes to dwelling type categories mean it is not possible to directly compare EPC bands across
dwelling types with 2008. However, when comparing ‘flats’ and ‘houses’, which included
bungalows, the 2008 data also shows that flats are more energy efficient than houses, as in 2017-
18.

9
Chart 2.5: EPC bands, by type of area, Wales, 2017-18 (a)
Source: Welsh Housing Conditions Survey 2017-18
(a) Using the ONS definition where an area is considered rural if it is outside of settlements with a population of
more than 10,000.
(b) There were no dwellings in EPC band A captured in the WHCS but adminstrative data shows that there are
some dwellings in Wales with EPC band A.
Dwellings in rural areas tend to be less energy efficient than dwellings urban areas. This is likely to
be because dwellings in rural areas tend to be older and there are more detached dwellings in rural
areas. There are also fewer dwellings in the social housing tenure in rural areas, and these tend to
be the most energy efficient type of dwelling.
Adequate energy performance (SAP65 or above)
Generally, the Welsh Government considers a dwelling with an Energy efficiency (SAP) rating of
65 or above to have adequate energy performance. (More information can be found on the
National well-being indicators and WHQS webpages). Under this assumption, in 2017-18, 47% of
dwellings in Wales had adequate energy performance, an increase compared with 2008 when 11%
of dwellings had adequate energy performance. The key messages for breakdowns by tenure, age
of dwellings, type of dwelling and urban/rural areas are similar to those for EPC bands. Charts and
commentary on these breakdowns can be found in the Annex and further breakdowns can be
found in the results viewer.
Environmental Impact (EI) rating
The EI rating is based on the dwelling’s impact on the environment in terms of CO2 emissions
associated with running the dwelling. Standard running conditions and the gross floor area (m2) are
taken into account to ensure that dwellings of different sizes can be compared. The EI rating is
expressed on a scale of 1 to 100, where 100 represents a carbon neutral dwelling. EI ratings are
divided into bands from A to G using the same bands as those used by the EPC ratings, where
band A represents dwellings with the highest EI rating and band G represents dwellings with the
lowest EI rating.

10
In 2017-18, the average EI rating for all dwellings in Wales was 57, which is equivalent to EI band
D. This was an improvement on the average EI rating of 45 (band E) in 2008.
Chart 2.6: Environmental Impact (EI) bands, Wales, 2008 and 2017-18
Sources: Welsh Housing Conditions Survey 2017-18
Living In Wales Property Survey 2008
The environmental impact of dwellings in Wales has improved between 2008 and 2017-18. There
was a decrease in the percentage with a worse environmental impact (EI bands E or below) and
an increase in the percentage of dwelling with a lower environmental impact (EI band D and
above).

11
Chart 2.7: Enviromental Impact (EI) bands, by tenure, Wales, 2008 and 2017-18 (a)
Sources: Welsh Housing Conditions Survey 2017-18
Living in Wales Property survey 2008
(a) Living in Wales 2008 data has been updated to SAP 2012 so direct comparisons can be made
(b) The proportion of private rented dwellings in bands A,B, and C in 2008 is based on small sample sizes and is
therefore less robust and should be treated with caution
Since 2008, the percentage of dwellings in bands E, F and G has decreased across all tenures and
the percentage of dwellings in bands A, B and C has increased across all tenures. In 2017-8,
across all tenures, the most common EI band was band D. The social housing sector had a higher
proportion of dwellings in bands C and above (44%) compared with owner occupied and private
rented dwellings (13% and 16% respectively).

12
Chart 2.8: Environmental Impact (EI) bands, by age of dwelling, Wales, 2017-18
Source: Welsh Housing Conditions Survey 2017-18
(a) The proportion of dwellings built pre1919 in EI bands A, B and C is based on small sample sizes and is
therefore less robust and should be treated with caution
Unsurprisingly, newer dwellings had better EI ratings; 46% of dwellings built after 1980 had an EI
rating of band C or above compared with 11% of those built between 1945 and 1964. The
percentage of dwellings with an EI rating of band E or below decreases from 60% of dwellings built
before 1945 to 12% for dwellings built after 1980.
Chart 2.9: Environmental Impact (EI) bands, by type of dwelling, Wales, 2017-18
Source: Welsh Housing Conditions Survey 2017-18

13
Flats have a better environmental impact rating than all other types of dwelling. 50% of flats had an
EI rating of band A, B or C, which was much higher than all other dwelling types. Flats were the
only dwelling type with a higher percentage in EI rating bands A, B and C than in EI bands E, F
and G.
The distribution of EI bands was broadly similar across all types of house, with the exception of
detached dwellings. For houses, the most common EI band was band D, with the exception of
detached dwellings where the E, F and G bands (combined) was the most common.solild
The Average EI rating was broadly similar across all types of housing ranging from 58 for detached
dwellings to 62 for semi-detached. The average EI rating was higher for flats (67) meaning flats
had less of an environmental impact than houses in terms of CO2 emissions associated with
running the dwelling.
It is not possible to directly compare EI bands across dwelling types with 2008 as the dwelling type
categories have changed. However, the 2008 data also shows that flats had better EI ratings than
houses, as in 2017-18.
Chart 2.10: Environmental Impact (EI) bands by type of area, Wales, 2017-18 (a)
Source: Welsh Housing Conditions Survey 2017-18
(a) Using the ONS definition where an area is considered rural if it is outside of settlements with a population of more
than 10,000.
Dwellings in urban areas had better Environmental Impact Ratings (with higher percentages of
dwellings in EI bands D and above and lower percentages of dwellings in EI bands E or below)
than dwellings in rural areas. This is likely to be impacted by the different mix of types and age of
dwellings in rural areas compared to urban areas.

14
3. Energy efficiency measures
This section contains information about dwelling characteristics and measures taken which can
contribute towards improving their energy efficiency such as construction type, insulation, double
glazing of windows, and low energy lighting. Generally, newer dwellings tend to have more energy
efficiency measures, so charts on age of dwelling have not been included in this section, but can
be found on the results viewer.
Chart 3.1: Energy efficiency measures present in dwellings, Wales, 2017-187
Source: Welsh Housing Conditions Survey 2017-18
(a) A dwelling is considered to be have double glazing if 80% or more of the windows are double glazed.
(b) Dwellings with low energy lighting in all rooms.
(c) Renewables includes solar panels, solar photovoltaics, wind turbines, biomass and heat pumps.
In 2017-18, the most common type of energy efficiency measure was roof insulation, with 97%
(where applicable) and the least common type of energy efficiency measure was renewables with
7%.
7 Note that the percentages in this chart are based on eligible dwellings only. i.e. flats without a loft are not included in the
roof insulation percentage as it is not applicable for this category

15
Roof insulation8
97% of dwellings in Wales had roof insulation (where applicable). This is an improvement on the
results observed in 2008 and 2004, where the figures were 84 per cent and 86 per cent
respectively.
Chart 3.2: Roof insulation present, by tenure, Wales, 2008 and 2017-18 (a)
Sources: Welsh Housing Conditions Survey 2017-18
Living in Wales Property Survey 2008
(a) Includes houses and top floor flats.
The proportion of dwellings with roof insulation varied by tenure with social housing having the
highest proportion of dwellings with roof insulation (100%) and private rented having the lowest
(94%). The private rented sector has seen the biggest increase since 2008 when 86% of dwellings
had roof insulation compared to 95% and 99% of owner-occupied and social housing dwellings
respectively.
As can be expected, the proportion of dwellings with roof insulation in 2017-18 was higher for
newer dwellings, ranging from 95% in pre 1919 dwellings to 99% in post 1980 dwellings. A similar
pattern was seen in 2008. Flats9 and terraced houses had the lowest proportions with roof
insulation with 95% and 96% respectively and bungalows and semi-detached houses had the
highest with 99% and 98% respectively, although these differences were not statistically
significant. Different dwelling type categories were used in 2008 so it is not possible to directly
8 Includes houses and top floor flats. 9 Only includes top floor flats

16
compare but when breaking down by flats and houses, there wasn’t much variation in the
proportion with roof insulation in 2008, with 94% for flats and 95% for houses.
There wasn’t much variation between urban and rural areas in both 2008 and 2017-18 (98% and
97% in 2017-18 and 95% for both urban and rural in 2008)
As part of the property survey, surveyors inspected the roof space to establish the thickness of the
loft insulation installed. According to building regulations, the thickness of insulation will vary
depending on the material you use and manufacturer's specification. In 45% of dwellings the
insulation was over 200m thick (up from 27% in 2008. A further 33% of households had between
125mm and 200mm of insulation compared with 28% in 2008. Surveyors found that 23% of
households had 100mm of insulation or less10 compared to 45% of households in 2008.
Double glazing11
In 2017-18, 93% of dwellings in Wales had double-glazed windows compared to 82% in 2008.
Chart 3.3: Dwellings with Double Glazing by tenure, Wales, 2008 and 2017-18
Sources: Welsh Housing Conditions Survey 2017-18
Living in Wales Property Survey 2008
When broken down by tenure, 97% of dwellings in the social housing tenure had double glazed
windows compared with 93% in owner-occupied and 87% in private rented dwellings respectively.
There has been an increase in the proportion of dwellings with double-glazing across all tenures
since 2008, with the private rented sector seeing the biggest improvement, although this remains
the tenure with the lowest proportion of dwellings with double glazed windows.
10 Includes dwellings with no insulation. 11 Includes dwellings where at least 80% of the windows are double glazed.

17
Chart 3.4: Dwellings with double glazing by age of dwelling, Wales, 2017-18 (a)
Source: Welsh Housing Conditions Survey 2017-18
(a) Includes dwellings where at least 80% of the windows are double glazed.
As can be expected, newer dwellings are more likely to have double-glazing with 98% of dwellings
built after 1980 having double-glazing compared to 83% of dwellings built before 1919. A similar
pattern was found in 2008, ranging from 96% in dwellings built after 1980 to 70% in dwellings built
before 1919.
There was less variation when the percentage of dwellings with double glazing is broken down by
dwelling type, ranging from 90% in detached dwellings to 95% in bungalows. It was not possible to
compare the same groups with 2008, but when comparing houses and flats, the proportions of
dwellings with double glazing weren’t very different, with 83% for houses and 80% for flats.
Urban dwellings were more likely to have double glazed windows with 95% compared to 89% in
rural areas in 2017-18. This was also seen in 2008 when 85% of dwellings in urban areas had
double glazing compared to 78% in rural areas.
Thermostatic radiator valves
The analysis in this section only refers to dwellings where it is possible to install thermostatic
radiator valves. 82% of applicable dwellings in Wales in 2017-18 had thermostatic radiator valves12
compared to 56% in 2008.
In 2017-18, when broken down by tenure, the social housing tenure has the highest percentage
(90%) of dwellings with thermostatic radiator valves compared with 82% for owner occupied and
72% for private rented dwellings. In 2008, owner occupied dwellings had the highest percentage of
12 A dwelling is considered to have thermostatic radiator valves if they are present on more than 50% of radiators.

18
dwellings with thermostatic radiator valves with 58%, compared to social housing and private
rented dwellings with 52% and 47% respectively.
Interestingly, dwellings built after 1980 had the highest percentage with thermostatic radiator
valves in 2008 (66%) but in 2017-18 the newer (post 1980) dwellings had the lowest percentage
(79%). The addition of thermostatic radiator valves to compatible heating systems is a cost
effective way of increasing the energy efficiency of a dwelling which could explain the increase in
older dwellings. In 2017-18, dwellings built between 1945 and 1964, and between 1965 and 1984
had the highest percentage of dwellings with thermostatic radiator valves with 86% and 87%
respectively. In 2008, the percentage of dwellings using thermostatic radiator valves was similar
across all pre 1980 age groups (53% to 56%).
In 2017-18, detached dwellings had the highest percentage of dwellings using thermostatic radiator
valves (88%) whereas flats had the lowest (78%).
The percentage of dwellings using thermostatic radiator valves in 2017-18 was similar across
urban and rural areas with 82% and 83% respectively. This was not the case in 2008 where there
was a higher percentage of dwellings with thermostatic radiator valves in rural areas (61%)
compared to urban areas (54%).
Wall and construction type
Chart 3.5: Construction type of dwellings, Wales, 2017-18
Source: Welsh Housing Conditions Survey 2017-18
(a) Concrete includes frame, boxwall, and other types of concrete.
The majority of dwellings in Wales (92%) are constructed using masonry. 65% of dwellings are
made of cavity masonry, 26% from solid masonry, and 1% from crosswall masonry. 4% of
dwellings are constructed with a timber or steel frame and 4% are constructed of concrete.
19
Chart 3.6: Type of wall and insulation, Wales, 2017-1813
Source: Welsh Housing Conditions Survey 2017-18
(a) The “other” category refers to other wall types (steel frame and timber frame).
The Survey recorded details of the type of walls in dwellings in Wales and also whether they were
insulated. In 2017-18, 70% of dwellings had cavity walls, and 28% had solid walls. Of the dwellings
in Wales with cavity walls, 68% are insulated. Of the dwellings in Wales with solid walls, 19% are
insulated.
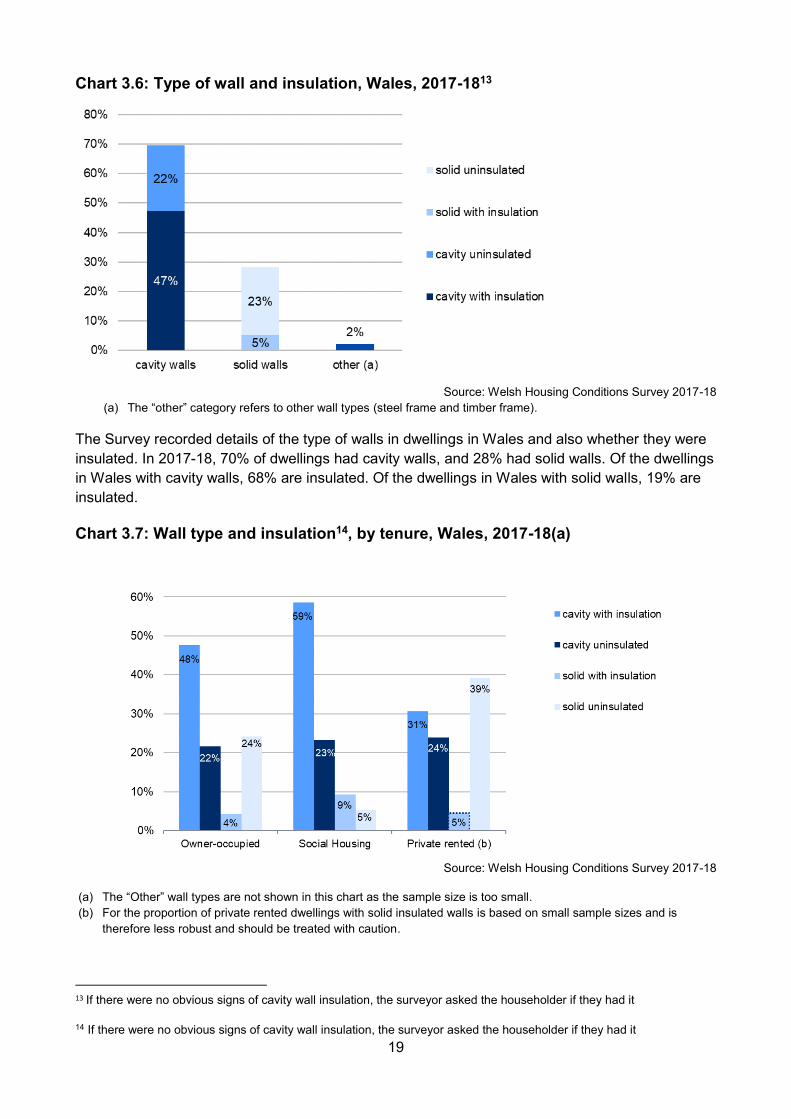
Chart 3.7: Wall type and insulation14, by tenure, Wales, 2017-18(a)
Source: Welsh Housing Conditions Survey 2017-18
(a) The “Other” wall types are not shown in this chart as the sample size is too small.
(b) For the proportion of private rented dwellings with solid insulated walls is based on small sample sizes and is
therefore less robust and should be treated with caution.
13 If there were no obvious signs of cavity wall insulation, the surveyor asked the householder if they had it
14 If there were no obvious signs of cavity wall insulation, the surveyor asked the householder if they had it

20
Social housing had the highest proportion of dwellings with insulated cavity walls with 59%. The
proportion of dwellings with uninsulated cavity walls was similar across all tenures. The private
rented sector has the highest proportion of uninsulated solid walls with 39%.
Chart 3.8: Estimated number of dwellings by wall type and insulation, by tenure, Wales, 2017-18 (a)
Source: Welsh Housing Conditions Survey 2017-18
(a) The “Other” wall types are not shown in this chart as the unweighted numbers are too small.
(b) The number of private rented dwellings with solid insulated walls is based on small sample sizes and is
therefore less robust and should be treated with caution
When looking at the numbers rather than proportions, owner-occupied is the tenure with the
highest number of insulated cavity walls with 441,000 properties, compared to social housing and
private rented with 139,000 and 55,000 respectively. It should be noted that this reflects that the
split of tenures in Wales.
There are around 606,000 uninsulated (cavity and solid) dwellings most of which (424,000) are
owner occupied.

21
Chart 3.9: Wall type and insulation by age of dwelling, Wales, 2017-18 (a)
Source: Welsh Housing Conditions Survey 2017-18
(a) The “Other” wall types are not shown in this chart as the sample size was too small.
(b) The proportion of pre 1919 dwellings with insulated cavity walls is based on small sample sizes and is therefore
less robust and should be treated with caution.
(c) The proportion of post 1980 dwellings with solid walls is based on small sample sizes and is therefore less
robust and should be treated with caution.
(d) Insulated and uninsulated solid walls have been combined due to small sample numbers.
As expected, the majority (84%) of pre 1919 dwellings had solid walls. The proportion of dwellings
with insulated cavity walls is higher in newer dwellings and the proportion with solid walls is lower.
Over two thirds of dwellings built after 1945 had insulated cavity walls

22
Chart 3.10: Wall type and insulation by type of dwelling, Wales, 2017-18 (a)
Source: Welsh Housing Conditions Survey 2017-18
(a) The “Other” wall types are not shown in this chart as the sample size was too small.
(b) Insulated and uninsulated solid walls have been combined due to small sample numbers.
Semi- detached houses had the highest proportion of dwellings with insulated cavity walls (59%)
and terraced houses had the lowest (27%), although this difference was not statistically significant.
Terraced houses were far more likely to have solid walls (50%) than other types – this is likely to
be because terraced houses tend to be older and traditionally built.
Rural dwellings were more likely to have solid walls, but this could be because rural dwellings tend
to be older. 35% of dwellings in rural areas had insulated cavity walls compared with 25% in urban
areas.
Low energy lighting15
In 2017-18, 26% of dwellings used low energy lighting in all of their rooms, an increase from 4% in
2008. The proportion of dwellings using low energy lighting in 2017-18 didn’t vary much by tenure,
ranging from 26% in owner-occupied and private rented dwellings to 29% in social housing. There
was a similar pattern when looking at tenure in 2008, although the sample size for private rented
dwellings was small and therefore not statistically significant.
15 Dwellings where low energy lighting is used in all rooms

23
Chart 3.11: Dwellings using low energy lighting by age of dwelling, Wales, 2017-18 (a)
Source: Welsh Housing Conditions Survey 2017-18
(a) Dwellings where low energy lighting is used in all rooms.
Generally, newer dwellings are more likely to have low energy lighting in all rooms, with dwellings
built after 1980 having the highest proportion (33%) and dwellings built between 1919 to 1944
having the lowest proportion (21%). The sample sizes for dwellings with low energy lighting in all
rooms in 2008 was too small to break down by age of dwelling.
There wasn’t much variation between urban and rural areas with 25% of dwellings in rural areas
using low energy lighting compared to 27% in urban areas. In 2008, 4% of dwellings used low
energy lighting in both urban and rural areas.
Renewable energy
Surveyors were asked to record whether households used renewable energy technologies such as
photovoltaic (PV) panels, solar panels, wind turbines, biomass fuel or heat pumps. 7% of dwellings
in Wales use at least one of these renewable energy sources in 2017-18 compared with less than
1% in 2008. Due to small sample sizes, further breakdowns for 2008 were not possible.

24
Chart 3.12: Dwellings using renewable energy, by tenure, Wales, 2017-18
Source: Welsh Housing Conditions Survey 2017-18
(a) The proportion of private rented dwellings using renewable energy is based on small sample sizes and is
therefore less robust and should be treated with caution.
A similar percentage of dwellings in the owner occupied and social housing tenure made use of
renewable energy (7% and 8% respectively). The sample size for the private rented sector is small
and is not statistically significant.
There were differences in the percentages of different types of dwellings using renewable energy;
detached dwellings had the highest percentage (13%) compared to the other types of houses,
which ranged from 4% to 7%. Flats had the lowest percentage of dwellings using renewable
energy, but this was based on a small sample size and is not statistically significant.

25
Chart 3.13: Dwellings using renewable energy, by type of area, Wales, 2017-18 (a)
Source: Welsh Housing Conditions Survey 2017-18
(a) Using the ONS definition where an area is considered rural if it is outside of settlements with a population of
more than 10,000.
In 2017-18, the percentage of dwellings that used at least one source of renewable energy in rural
areas was higher than in urban areas (10% rural, 5% urban).

26
4. Heating systems
This section covers the types of boilers, heating systems and fuels used in dwellings in Wales, and
how this has changed over time. Breakdowns by household characteristics have not all been
included but can be found in the results viewer.
Type of heating system
The main form of heating is defined as the predominant system present at the household. If a
household has, for example, two gas fires and two storage heaters, the primary system is the one
that is present in the main living area. Since 1986 the use of central heating as the main form of
heating has greatly increased. The percentage of dwellings with central heating as the main form
of heating has remained at 95% since 2008.
There are three main types of heating covered in the WHCS:
central heating system: most commonly a system with a gas fired boiler and radiators which
distribute heat throughout the dwelling (but also included in this definition are warm air
systems, electric ceiling/underfloor and communal heating). It is generally considered to be
a cost effective and relatively efficient method of heating a dwelling. Communal systems
use heat generated in a centralised location for residential space and water heating. This
could be from:
o a central boiler using any fuel which supplies a number of dwellings
o waste heat from power stations distributed through community heating schemes
o heat from a local CHP (combined heat and power) system.
storage heaters: predominately used in dwellings that have an off-peak electricity tariff.
Storage heaters use off-peak electricity to store heat in clay bricks or a ceramic material,
this heat is then released throughout the day. However, storage heating can prove
expensive if too much ‘on-peak’ electricity is used during the day.
room heaters: this category includes all other types of heaters such as fixed gas, fixed
electric or portable electric heaters. This type of heating is generally considered to be the
least cost effective of the main systems and produces more carbon dioxide emissions per
kilowatt Hour (kWh).

27
Table 4.1: Type of heating system, Wales, 1986-2017-18
Sources: Living in Wales Property Survey 2004 and 2008, and
Welsh Housing Conditions Survey 1986, 1998, and 2017-18
(a) The figures shown for central heating include night storage heaters for survey years up to 2008.
(b) Other heating methods include storage heaters and room heaters.
The percentage of dwellings with central heating increased from 67% in 1986 to 95% in 2017-18.
Chart 4.2: Heating system and main fuel type, Wales 2017-18
Source: Welsh Housing Conditions Survey 2017-18
(a) Includes mains gas, bulk LPG and bottled gas (propane).
(b) For example, gas fires, coal fires, log burners, electric fires.
The proportion of dwellings in Wales with gas central heating16 was 82 per cent, compared with 85
per cent in England17 and just 24 per cent in Northern Ireland (67 per cent of dwellings in Northern
Ireland had oil central heating). At the time of publication there was no comparable figure for
Scotland, however 79 per cent of Scottish18 dwellings used mains gas as the primary heating fuel
compared with 80 per cent of dwellings in Wales.
16 Includes mains gas, bulk LPG and bottle gas (propane). 17 English Housing Survey: Energy 18Scottish House Condition Survey: Key findings
Per cent
Survey Year Central Heating (a) Other Heating Method (b)
1986 67 33
1998 87 13
2004 93 7
2008 94 6
2017-18 94 6
82%
10%
3%4% 2%
Gas central heating (a)
Oil central heating
Other central heating
Electric storage heater
Fixed room heating (all fuels) (b)

28
Chart 4.3: Dwellings with central heating, by tenure, Wales, 2008 and 2017-18
Sources: Welsh Housing Conditions Survey 2017-18
Living in Wales Property Survey 2008
The owner occupied sector had the highest proportion of dwellings with central heating in 2008 and
in 2017-18 (95% and 96% respectively), although the differences between the tenures are not
statistically significant. Social housing has seen the biggest increase in the proportion of dwellings
with central heating since 2008 (from 92% to 96%).
There was little variation by age of dwelling for most of the construction age groups, with the
exception of post 1980 dwellings, which were less likely to have central heating compared to other
dwelling ages (91% in 2008 and 92% in 2017-18).
Chart 4.4: Dwellings with central heating, by type of dwelling, Wales, 2017-18
Source: Welsh Housing Conditions Survey 2017-18

29
Flats were less likely to have central heating (81%) compared to the other dwelling types which
were broadly similar ranging from 94% in bungalows to 99% in detached houses.
In 2008, flats were also less likely to have central heating (79%) compared to houses (95%).
Chart 4.5: Dwellings with central heating, by type of area, Wales, 2008 and 2017-18 (a)
Sources: Living in Wales Survey 2008 Welsh Housing Conditions Survey 2017-18
(a) Using the ONS definition where an area is considered rural if it is outside of settlements with a population of
more than 10,000.
In both 2008 and 2017-18, dwellings in rural areas were less likely to have central heating
compared to urban areas, although these differences are not statistically significant. The proportion
of dwellings in urban areas with central heating stayed the same between 2008 and 2017-18
whereas the proportion of dwellings in rural areas with central increased from 90% in 2008 to 92%
in 2017-18.
Type of boiler
The size, type and make of boiler can all affect how much energy is used and how the home and
hot water is heated. The different types of boiler are19:
Standard: provides hot water or warm air for space heating with the former also providing
hot water via a separate storage cylinder.
Back: Located behind a room heater and feeds hot water to a separate storage cylinder.
They are generally less efficient than other boiler types.
19British Gas guide to types of boilers

30
Combination: Provides hot water or warm air for space heating and can provide hot water
on demand negating the need for a storage cylinder, therefore requiring less space.
Condensing: Standard and combination boilers can also be condensing. A condensing
boiler uses a larger, or dual, heat exchanger to obtain more heat from burning fuel than an
ordinary boiler, and is generally the most efficient boiler type.
Passive flue gas heat recovery devices20 can be installed on some types of boiler to help reduce
fuel use. These are retrofit devices that extract waste heat from the products of combustion (flue
gases) which can then be used for the purpose of pre-heating domestic hot water (or the central
heating circuit). By doing so, the amount of gas used to heat domestic hot water (or provide space
heating) can be reduced, thereby increasing the overall efficiency of the boiler.
Chart 4.6: Type of boilers in dwellings, Wales, 2008 and 2017-18 (a)(b)
Sources: Welsh Housing Conditions Survey 2017-18
Living in Wales Survey 20018
(a) Only includes dwellings with boilers.
(b) The number of combined primary storage unit boilers in 2008 and 2017-18, and the use of heat pumps in 2017-
18 are too small to include (they equate to less than 0.5%) and so are not shown on the chart.
20 BEIS report on passive flue gas heat recovery

31
In 2008 the most common type of boiler was a combination boiler with 34% of boilers in dwellings
being of this type and the least common was condensing boiler with 4%. In 2017-18 the most
common boiler type was condensing-combi boiler (66%), which is the most efficient boiler type.
The least common was back boiler (4%) which is the least efficient boiler type.
In 2017-18, dwellings in the social housing tenure were most likely to have condensing-combi
boilers (87%) compared to 59% of owner occupied dwellings and 72% of private rented dwellings.
Condensing-combi boilers were also the most common boiler type across all dwelling age groups.
Dwellings built between 1945 and 1964 had the highest proportion of dwellings with a condensing-
combi boiler (75%) and dwellings built post 1980 had the lowest (52%).
Dwellings in rural areas were less likely to have condensing combi boilers than dwellings in urban
areas in both 2008 and 2017-18 .
In 2017-18, 70% of dwellings in Wales have the potential to install a passive flue gas heat recovery
device, of these dwellings only 3% used a passive flue gas heat recovery device.
Type of heating fuel
There are a number of different types of fuels that can be used to heat homes.
Chart 4.7: Main heating fuel in Wales, 2008 and 2017-18
Sources: Welsh Housing Conditions Survey 2017-18
Living in Wales Property Survey 2008 (a) Includes mains, bulk LPG and bottled gas. (b) Includes house coal, smokeless fuel, anthracite nuts, wood and biomass. (c) Includes heating from communal boilers, and other renewable (in 2008). The proportion of dwellings using
“other” main heating fuels in 2008 is based on small sample sizes and is therefore less robust and should be treated with caution.

32
Gas was the most common fuel type by far in 2008 and 2017-18, with four out of five dwellings
using gas; followed by oil (1 in 10) then electricity (1 in 20). The proportion of dwellings using solid
fuel as their primary heating fuel has decreased from 3% in 2008 to 1% in 2017-18.
Chart 4.8: Main heating fuel, by tenure, Wales, 2017-18 (a)
Source: Welsh Housing Conditions Survey 2017-18
(a) “Other” is not shown due to small sample sizes. (b) Includes mains, bulk LPG and bottled gas. (c) Includes house coal, smokeless fuel, anthracite nuts, wood and biomass. The proportion of private rented and
social housing dwellings using solid fuel is based on small sample sizes and is therefore less robust and should be treated with caution.
The most common heating fuel across all tenures was gas. Dwellings in the social housing tenure
were more likely to use gas as a heating fuel (87%) than the owner-occupied (81%) and private
rented sectors (80%). Owner occupied dwellings were more likely to use oil than the other tenures
and the private rented sector was more likely to use electricity than the other sectors. There was a
similar pattern in 2008.

33
Chart 4.9: Dwellings using gas as main heating fuel, by age of dwelling, Wales, 2008 and 2017-18
Sources: Welsh Housing Conditions Survey 2017-18 Living in Wales Property Survey 2008
In both 2008 and 2017-18, there is some variation in the proportion of dwellings using gas as the
main heating fuel by age of dwelling. Dwellings built before 1919 are least likely to use gas as the
main heating fuel.
Chart 4.10: dwellings using gas as the main heating fuel, by type of dwelling, Wales, 2017-18
Source: Welsh Housing Conditions Survey 2017-18

34
In 2017-18, the percentage of dwellings in Wales using gas to heat their homes varies between
dwelling types. Terraced houses have the highest percentage of dwellings using gas (92%).
When comparing flats and houses, flats are less likely to use gas than houses (75% and 83%
respectively). Flats are more likely to use electricity than houses (20% and 4% respectively). A
similar pattern was seen in 2008.
Chart 4.11 Main heating fuel, by type of area, Wales, 2017-18(a)(b)(f)
Source: Welsh Housing Conditions Survey 2017-18
(a) Does not include “other” due to small sample sizes. (b) Using the ONS definition where an area is considered rural if it is outside of settlements with a population of
more than 10,000. (c) Includes mains, bulk LPG and bottled gas. (d) The proportion of urban dwellings using oil is based on small sample sizes and is therefore less robust and
should be treated with caution. (e) Includes house coal, smokeless fuel, anthracite nuts, wood and biomass. The proportion of urban dwellings
using solid fuel is based on small sample sizes and is therefore less robust and should be treated with caution. (f) The number of dwellings with community heating from boilers, and community heating from CHP/waste heat are
too small to include (they equate to 1% and less than 0.5% for urban and rural respectively) and so are not shown on the chart.
For both urban and rural dwellings, the most common heating fuel type was gas, although urban
dwellings were more likely to use gas (93%) than rural dwellings (59%). This may be because
dwellings in rural areas are less likely to be linked to the gas mains. 28% of rural dwellings used
oil, which is much higher than the overall proportion for Wales (10%). Rural dwellings also have a
higher proportion using solid fuels (4%) when compared to Wales as a whole (1%).
There was a very similar pattern for 2008.

35
Annex
Chart A1: Adequete energy performance (SAP65 or above), by tenure, Wales, 2008 and 2017-18 (a)
Sources: Welsh Housing Conditions Survey 2017-18
Living in Wales Property Survey 2008
(a) 2008 and 2017-18 data are based on SAP 2012 so are comparable.
(b) The proportion of private rented dwellings with adequete energy performance in 2008 is based on small sample
sizes and is therefore less robust and should be treated with caution.
There was an increase in the proportion of dwellings with adequate energy performance across all
tenures between 2008 and 2017-18, however this varied by tenure. Social housing had the highest
proportion of dwellings with adequate energy performance in both years. The owner occupied and
private rented sectors had broadly similar proportions of dwellings with adequate energy
performance in 2017-18.

36
Chart A2: Adequate energy performance (SAP65 or above), by age of dwelling, Wales, 2008 and 2017-18 (a)
Sources: Welsh Housing Conditions Survey 2017-18
Living in Wales Property Survey 2008
(a) 2008 and 2017-18 data are based on SAP 2012 so are comparable.
(b) The proportion of 1919-1944 dwellings with adequete energy performance in 2008 is based on small sample
sizes and is therefore less robust and should be treated with caution.
As expected, the proportion of dwellings with adequate energy performance is higher for newer
dwellings. The proportion of dwellings with adequate energy performance increased across all
dwelling ages between 2008 and 2017-18.
Chart A3: Adequate energy performance (SAP65 or above), by type of dwelling, Wales, 2017-18
Source: Welsh Housing Conditions Survey 2017-18

37
Flats had the highest proportion of dwellings with adequate energy performance (69%). The
proportion of dwellings with adequate energy performance ranged from 36% (bungalows) to 49%
(terraced).
Changes to dwelling type categories mean it is not possible to directly compare adequate energy
performance across dwelling types with 2008. However, when comparing ‘flats’ and ‘houses’,
which included bungalows, the 2008 data also shows that there was a higher proportion of flats
with adequate energy performance , as in 2017-18.
Chart A4: Adequate energy performance (SAP 65 or over) by type of area, Wales, 2017-18 (a)
Source: Welsh Housing Conditions Survey 2017-18
(a) Using the ONS definition where an area is considered rural if it is outside of settlements with a population of more than 10,000.
Rural areas have a lower proportion of dwellings with adequate energy performance when
compared with dwellings in urban areas. This is likely to be because dwellings in rural areas tend
to be older and less likely to be connected to the gas network. There is also a higher proportion of
detached dwellings in rural areas. In addition, there are fewer dwellings in the social housing
tenure in rural areas, and these tend to be the most energy efficient dwellings.
Further breakdowns can be found on the results viewer.

38
Key quality information
This section provides a summary of ‘Welsh Housing Conditions Survey 2017-18: Energy Efficiency
of dwellings’ quality information. Please note that a detailed Quality Report on the Welsh Housing
Conditions Survey (WHCS) statistics has been published on the WHCS website, which measures
quality against five dimensions: Relevance, Accuracy and Reliability, Timeliness and Punctuality,
Accessibility and Clarity, and Comparability and Coherence.
Background to the WHCS
There was a critical gap in the Welsh Government’s knowledge about housing conditions in Wales.
The last comprehensive collection of data on housing conditions in Wales prior to the WHCS 2017-
18 was the Living in Wales Property Survey in 2008. In June 2016 permission and funding was
given for the Housing Conditions Evidence Programme (HCEP). The Programme is managed by
Knowledge and Analytical Services (KAS) within the Welsh Government and encompasses two
work streams:
The Welsh Housing Conditions Survey (WHCS) 2017-18; and
The Housing Stock Analytical Resource Wales (HSAR): Essentially a repository capturing a
range of data on the characteristics, fabric, condition and energy efficiency of the housing stock
in Wales. Where possible at individual property level.
The WHCS was carried out by the Building Research Establishment (BRE) on behalf of the Welsh
Government. Fieldwork ran from August 2017 to April 2018. Property inspections were carried out
by qualified surveyors, who performed a visual assessment of the interior and exterior of the
property. The inspections lasted around 40-50 minutes, with around 20 minutes spent inside on a
room by room inspection. The surveyor also inspected the plot of the property and made an
assessment of the local neighbourhood. For full details of the topics included in the Survey see the
Survey Form, available on the WHCS website.
Response Rates
A sample of addresses was drawn from eligible households taking part in the National Survey for
Wales 2017-18. A total of 2,549 full WHCS surveys were achieved across the 22 local authorities
of Wales which enables national level estimates. A consent rate of 58% was achieved by the
National Survey for Wales interviewers, and of those, a conversion rate of 78% was achieved by
the BRE surveyors. The overall response rate was 45%.
95% confidence intervals have been calculated for key WHCS variables and are included in the
Results Viewer, available on the WHCS website.
How is the WHCS used?
Key information gathered in the WHCS allows properties to be assessed for energy efficiency, cost
of repair , the Welsh Housing Quality Standard (WHQS), fuel poverty and the Housing Health and
Safety Rating System (HHSRS). It will also help improve the Housing domain in the Welsh Index of

39
Multiple Deprivation 2019 update and underpin two of the Well-being of Future Generations
National Indicators for Wales, specifically dwellings free from hazards and dwellings with adequate
energy performance. The WHCS 2017-18 is closely linked to the Welsh Government’s
Decarbonisation Programme and is recognised as one of the crucial data sources, especially for
the domestic buildings working group. The survey will also be used to provide data for many other
housing, environmental and social policy needs e.g. the impact of poor housing on health,
education and economic activity.
Who are the users of the WHCS?
The survey is used for policy making purposes by the Welsh Government mainly for housing and
environmental areas, but also social policy needs. There are a wide range of other users of the
survey including: Welsh Government Sponsored Bodies; local authorities across Wales; Public
Health Wales; Third Sector Organisations; other UK government departments and local
government organisations; other public sector organisations; academics; private companies; the
media; and members of the public.
Strengths and Limitations
Detailed information on the strengths and limitations of the WHCS is provided in Section 3.1
(Relevance) of the Quality Report, available on the WHCS website.
Technical Report
Detailed information on the methodology used in the WHCS can be found in the survey technical
report, available on the WHCS website.
Glossary
A detailed Glossary is available on the WHCS website which provides definitions for the key terms
found in this report.
Interpreting the results
Some questions on the physical inspection form were only answered by the surveyor for a sub-
sample of properties and other questions were not answered where the question was not
applicable.
Where a relationship has been discussed between two factors, this does not mean it is a causal
relationship. More detailed analysis is required to identify whether one factor causes change in
another, or if other factors are actually more important.
The results are weighted by households and persons within each household and calibrated to
Wales levels. Weighting for non-consent is also applied.
Statistical Significance
A selection of key measures in the Results Viewer include approximate 95% confidence intervals.
Confidence intervals were calculated using the statistical package Stata. These provide an
indication of the precision of the estimates. A confidence interval can be calculated around a

40
survey estimate and gives a range within which the true value is likely to fall. There is a 95%
chance that the 95% confidence intervals include the true value. In general, the smaller the sample
size the wider the confidence interval. As a rough guide to interpretation, when comparing two
variables, if the confidence intervals around the estimates overlap, it can be assumed that the
estimates are not statistically significantly different – this approach is not as rigorous as doing a
formal statistical test, but is straightforward, widely used and reasonably robust. Unless stated
otherwise, differences in this report are significant.
Coherence
Links to other UK Housing Surveys
All countries of the UK reported on the energy efficiency or energy usage of their dwellings within
the period 2016 – 2017-18. The latest results can be found at the links below.
English Housing Survey 2016: Energy Efficiency
English Housing Survey 2017: Energy
Scottish House Condition Survey: Energy Efficiency
Northern Ireland House Condition Survey: Northern Ireland Housing Statistics 2017-18 – energy
Note that Scotland’s estimates are based on unweighted figures.
Changes to SAP
The SAP methodology has been through two major updates since the 2005 version used for the
LiW 2008 modelling, first to SAP 2009 and then SAP 2012. In addition, the RdSAP methodology
for SAP 2012 was updated in November 2017. This doesn’t change the SAP calculation but
changes the way that inferences are made for elements of the SAP calculation that are not directly
measured in a non-intrusive survey. This series of updates along with continual improvements to
the models used to calculate SAP, have introduced numerous changes to the way SAP is
calculated. One such change that is likely to have had a more significant impact is the adjustment
to the U-values that was made in the November 2017 update for certain categories of wall. U-
values for solid walls and uninsulated cavities built before 1966 were revised downwards (i.e.
made better) and U-values for insulated cavity walls built before 1975 were revised upwards (i.e.
made worse). Most changes will affect each tenure in a similar way however because social
housing has a different profile to private housing (e.g. more insulated cavity walls) the mean SAP
has dropped slightly.
National Statistics status
The United Kingdom Statistics Authority has designated these statistics as National Statistics, in
accordance with the Statistics and Registration Service Act 2007 and signifying compliance with
the Code of Practice for Statistics. The assessment report can be viewed on the Office for
Statistical Regulation webpages.

41
National Statistics status means that official statistics meet the highest standards of
trustworthiness, quality and public value.
All official statistics should comply with all aspects of the Code of Practice for Statistics. They are
awarded National Statistics status following an assessment by the UK Statistics Authority’s
regulatory arm. The Authority considers whether the statistics meet the highest standards of Code
compliance, including the value they add to public decisions and debate.
It is Welsh Government’s responsibility to maintain compliance with the standards expected of
National Statistics. If we become concerned about whether these statistics are still meeting the
appropriate standards, we will discuss any concerns with the Authority promptly. National Statistics
status can be removed at any point when the highest standards are not maintained, and reinstated
when standards are restored.
5. Well-being of Future Generations Act (WFG)
The Well-being of Future Generations Act 2015 is about improving the social, economic,
environmental and cultural well-being of Wales. The Act puts in place seven well-being goals for
Wales. These are for a more equal, prosperous, resilient, healthier and globally responsible Wales,
with cohesive communities and a vibrant culture and thriving Welsh language. Under section
(10)(1) of the Act, the Welsh Ministers must (a) publish indicators (“national indicators”) that must
be applied for the purpose of measuring progress towards the achievement of the Well-being
goals, and (b) lay a copy of the national indicators before the National Assembly. The 46 national
indicators were laid in March 2016 and this release includes two of the national indicators, namely
Indicator 31 (percentage of dwellings which are free from hazards) and Indicator 33 (percentage of
dwellings with adequate energy performance).
Information on the indicators, along with narratives for each of the well-being goals and associated
technical information is available in the Well-being of Wales report.
As a national indicator under the Act they must be referred to in the analyses of local well-being
produced by public services boards when they are analysing the state of economic, social,
environmental and cultural well-being in their areas.
Further information on the Well-being of Future Generations (Wales) Act 2015.
The statistics included in this release could also provide supporting narrative to the national
indicators and be used by public services boards in relation to their local well-being assessments
and local well-being plans.

42
Further details
This document is available on the WHCS website: http://www.gov.wales/whcs
The WHCS Quality Report, Technical Report and Glossary can be found on the WHCS website.
There is also an easy-to-use Results Viewer which presents results on a range of topics.
Next update
Detailed topic specific analysis (at the national level) will be published from early 2019 onwards.
You can find out more about the planned publications on the WHCS website.
Additional tables relating to energy efficiency assessed by the Survey will be added to the Results
Viewer on the Survey webpage.
We want your feedback
We welcome any feedback on any aspect of these statistics which can be provided by email to
Open Government Licence
All content is available under the Open Government Licence v3.0, except where otherwise stated.