Wells Fargo Advantage Funds Annual Report - CME Group
48
Wells Fargo Advantage Heritage Money Market Fund SM Annual Report January 31, 2013
Transcript of Wells Fargo Advantage Funds Annual Report - CME Group

Wells Fargo AdvantageHeritage Money Market FundSM
Annual ReportJanuary 31, 2013


Reduce clutter. Save trees.
Sign up for electronic delivery ofprospectuses and shareholder reports at
wellsfargo.com/advantagedelivery
Contents
Letter to shareholders . . . . . . . . . . . . . . . . . . . . . . . . . . . . . . . . . . . . . . . . . . . . . . . . . . . 2
Money market overview . . . . . . . . . . . . . . . . . . . . . . . . . . . . . . . . . . . . . . . . . . . . . . . . . 4
Performance highlights . . . . . . . . . . . . . . . . . . . . . . . . . . . . . . . . . . . . . . . . . . . . . . . . . 6
Fund expenses . . . . . . . . . . . . . . . . . . . . . . . . . . . . . . . . . . . . . . . . . . . . . . . . . . . . . . . . . 8
Portfolio of investments . . . . . . . . . . . . . . . . . . . . . . . . . . . . . . . . . . . . . . . . . . . . . . . . . 9
Financial statementsStatement of assets and liabilities . . . . . . . . . . . . . . . . . . . . . . . . . . . . . . . . . . . . . . . . . 26Statement of operations . . . . . . . . . . . . . . . . . . . . . . . . . . . . . . . . . . . . . . . . . . . . . . . . . 27Statement of changes in net assets . . . . . . . . . . . . . . . . . . . . . . . . . . . . . . . . . . . . . . . . 28Financial highlights . . . . . . . . . . . . . . . . . . . . . . . . . . . . . . . . . . . . . . . . . . . . . . . . . . . . . . 29
Notes to financial statements . . . . . . . . . . . . . . . . . . . . . . . . . . . . . . . . . . . . . . . . . . . . 33
Report of independent registered public accounting firm . . . . . . . . . . . . . . . . . 37
Other information . . . . . . . . . . . . . . . . . . . . . . . . . . . . . . . . . . . . . . . . . . . . . . . . . . . . . . 38
List of abbreviations . . . . . . . . . . . . . . . . . . . . . . . . . . . . . . . . . . . . . . . . . . . . . . . . . . . . 41
The views expressed and any forward-looking statements are as of January 31, 2013, unless otherwise noted, and are those of the Fund managers and/or Wells Fargo FundsManagement, LLC. Discussions of individual securities, or the markets generally, or any Wells Fargo Advantage Fund are not intended as individual recommendations. Futureevents or results may vary significantly from those expressed in any forward-looking statements; the views expressed are subject to change at any time in response to changingcircumstances in the market. Wells Fargo Funds Management, LLC, disclaims any obligation to publicly update or revise any views expressed or forward-looking statements.
NOT FDIC INSURED ▪ NO BANK GUARANTEE ▪ MAY LOSE VALUE

Wells Fargo investment history
1932 Keystone creates one of the firstmutual fund families.
1971 Wells Fargo & Company introduces oneof the first institutional index funds.
1978 Wells Fargo applies Markowitz andSharpe’s research on ModernPortfolio Theory to introduce one ofthe industry’s first tactical assetallocation models in institutionalseparately managed accounts.
1984 Wells Fargo Stagecoach Fundslaunches its first asset allocation fund.
1989 The Tactical Asset Allocation (TAA)Model is first applied to Wells Fargo’sasset allocation mutual funds.
1994 Wells Fargo introduces the LifePathFunds, one of the first suites oftarget date funds (now the WellsFargo Advantage Dow Jones TargetDate FundsSM).
1996 Evergreen Investments and KeystoneFunds merge.
1997 Wells Fargo launches the Wells FargoAdvantage WealthBuilder PortfoliosSM,a fund-of-funds suite of products thatincludes the use of quantitativemodels to shift assets amonginvestment styles.
1999 Norwest Advantage Funds andStagecoach Funds are reorganizedinto Wells Fargo Funds after themerger of Norwest and Wells Fargo.
2002 Evergreen Retail and EvergreenInstitutional companies form theumbrella asset managementcompany, Evergreen Investments.
2005 The integration of Strong Funds withWells Fargo Funds creates Wells FargoAdvantage Funds, resulting in one ofthe top 20 mutual fund companies inthe United States.
2006 Wells Fargo Advantage Fundsrelaunches the target date productline as Wells Fargo Advantage DowJones Target Date Funds.
2010 The mergers and reorganizations ofEvergreen and Wells FargoAdvantage mutual funds arecompleted, unifying the familiesunder the brand of Wells FargoAdvantage Funds.
Wells Fargo Advantage Funds®
Wells Fargo Advantage Funds skillfully guides institutions, financial advisors, andindividuals through the investment terrain to help them reach their financialobjectives. Everything we do on behalf of investors is backed by our uniquecombination of qualifications.
StrengthOur organization is built on the standards of integrity and service established byour parent company—Wells Fargo & Company—more than 150 years ago. And,because we’re part of a highly diversified financial enterprise, we offer the depthof resources to help investors succeed.
ExpertiseOur multi-boutique model offers investors access to the independent thinking ofpremier investment managers that have been chosen for their time-testedstrategies. While each team specializes in a specific investment strategy,collectively they provide investors a wide choice of distinct investment styles. Ourdedication to investment excellence doesn’t end with our expertise in managerselection—risk management, analysis, and rigorous ongoing review seek toensure each manager’s investment process remains consistent.
PartnershipOur collaborative approach is built around understanding the needs and goals ofour clients. By adhering to core principles of sound judgment and steady guidance,we support you through every stage of the investment decision process.
Carefully consider the investment objectives, risks, charges, and expenses before investing.For a current prospectus and, if available, a summary prospectus, for Wells FargoAdvantage Funds, containing this and other information, visitwellsfargoadvantagefunds.com. Read it carefully before investing.
Wells Fargo Funds Management, LLC, a wholly owned subsidiary of Wells Fargo & Company, providesinvestment advisory and administrative services for Wells Fargo Advantage Funds. Other affiliates ofWells Fargo & Company provide subadvisory and other services for the Funds. The Funds are distributedby Wells Fargo Funds Distributor, LLC, Member FINRA/SIPC, an affiliate of Wells Fargo & Company.
“Dow Jones®” and “Dow Jones Target Date IndexesSM” are service marks of Dow Jones TrademarkHoldings LLC (“Dow Jones”); have been licensed to CME Group Index Services LLC (“CME Indexes”); andhave been sublicensed for use for certain purposes by Global Index Advisors, Inc., and Wells FargoFunds Management, LLC. The Wells Fargo Advantage Dow Jones Target Date FundsSM, based on theDow Jones Target Date Indexes, are not sponsored, endorsed, sold, or promoted by Dow Jones, CMEIndexes, or their respective affiliates, and none of them makes any representation regarding theadvisability of investing in such product(s).
NOT FDIC INSURED ▪ NO BANK GUARANTEE ▪ MAY LOSE VALUE
Not part of the annual report.

Wells Fargo Advantage Funds offers more than 110 mutual funds across a wide range of asset classes,representing over $226 billion in assets under management, as of January 31, 2013.
Equity fundsAsia Pacific Fund Enterprise Fund† Opportunity Fund†
C&B Large Cap Value Fund Global Opportunities Fund Precious Metals FundC&B Mid Cap Value Fund Growth Fund Premier Large Company Growth FundCapital Growth Fund Index Fund Small Cap Opportunities FundCommon Stock Fund International Equity Fund Small Cap Value FundDisciplined U.S. Core Fund International Value Fund Small Company Growth FundDiscovery Fund† Intrinsic Small Cap Value Fund Small Company Value FundDiversified Equity Fund Intrinsic Value Fund Small/Mid Cap Value FundDiversified International Fund Intrinsic World Equity Fund Special Mid Cap Value FundEmerging Growth Fund Large Cap Core Fund Special Small Cap Value FundEmerging Markets Equity Fund Large Cap Growth Fund Specialized Technology FundEmerging Markets Equity Income Fund Large Company Value Fund Traditional Small Cap Growth FundEndeavor Select Fund† Omega Growth Fund Utility and Telecommunications Fund
Bond fundsAdjustable Rate Government Fund High Yield Municipal Bond Fund Short Duration Government Bond FundCalifornia Limited-Term Tax-Free Fund Income Plus Fund Short-Term Bond FundCalifornia Tax-Free Fund Inflation-Protected Bond Fund Short-Term High Yield Bond FundColorado Tax-Free Fund Intermediate Tax/AMT-Free Fund Short-Term Municipal Bond FundCore Bond Fund International Bond Fund Strategic Income FundEmerging Markets Local Bond Fund Minnesota Tax-Free Fund Strategic Municipal Bond FundGovernment Securities Fund Municipal Bond Fund Ultra Short-Term Income FundHigh Income Fund North Carolina Tax-Free Fund Ultra Short-Term Municipal Income FundHigh Yield Bond Fund Pennsylvania Tax-Free Fund Wisconsin Tax-Free Fund
Asset allocation fundsAbsolute Return Fund WealthBuilder Equity Portfolio† Target 2020 Fund†
Asset Allocation Fund WealthBuilder Growth Allocation Portfolio† Target 2025 Fund†
Conservative Allocation Fund WealthBuilder Growth Balanced Portfolio† Target 2030 Fund†
Diversified Capital Builder Fund WealthBuilder Moderate Balanced Portfolio† Target 2035 Fund†
Diversified Income Builder Fund WealthBuilder Tactical Equity Portfolio† Target 2040 Fund†
Growth Balanced Fund Target Today Fund† Target 2045 Fund†
Index Asset Allocation Fund Target 2010 Fund† Target 2050 Fund†
Moderate Balanced Fund Target 2015 Fund† Target 2055 Fund†
WealthBuilder Conservative Allocation Portfolio†
Money market funds100% Treasury Money Market Fund Heritage Money Market Fund† National Tax-Free Money Market FundCalifornia Municipal Money Market Fund Money Market Fund Treasury Plus Money Market FundCash Investment Money Market Fund Municipal Cash Management Money Market FundGovernment Money Market Fund Municipal Money Market Fund
Variable trust funds1
VT Discovery Fund† VT Intrinsic Value Fund VT Small Cap Growth FundVT Index Asset Allocation Fund VT Omega Growth Fund VT Small Cap Value FundVT International Equity Fund VT Opportunity Fund† VT Total Return Bond Fund
An investment in a money market fund is not insured or guaranteed by the Federal Deposit Insurance Corporation or any other government agency. Although the WellsFargo Advantage Money Market Funds seek to preserve the value of your investment at $1.00 per share, it is possible to lose money by investing in a money market fund.
1. The variable trust funds are generally available only through insurance company variable contracts.
† In this report, the Wells Fargo Advantage Discovery FundSM, Wells Fargo Advantage Endeavor Select FundSM, Wells Fargo Advantage Enterprise FundSM,Wells Fargo Advantage Opportunity FundSM, Wells Fargo Advantage WealthBuilder Conservative Allocation PortfolioSM, Wells Fargo AdvantageWealthBuilder Equity PortfolioSM, Wells Fargo Advantage WealthBuilder Growth Allocation PortfolioSM, Wells Fargo Advantage WealthBuilder GrowthBalanced PortfolioSM, Wells Fargo Advantage WealthBuilder Moderate Balanced PortfolioSM, Wells Fargo Advantage WealthBuilder Tactical EquityPortfolioSM, Wells Fargo Advantage Dow Jones Target Today FundSM, Wells Fargo Advantage Dow Jones Target 2010 FundSM, Wells Fargo Advantage DowJones Target 2015 FundSM, Wells Fargo Advantage Dow Jones Target 2020 FundSM, Wells Fargo Advantage Dow Jones Target 2025 FundSM, Wells FargoAdvantage Dow Jones Target 2030 FundSM, Wells Fargo Advantage Dow Jones Target 2035 FundSM, Wells Fargo Advantage Dow Jones Target 2040 FundSM,Wells Fargo Advantage Dow Jones Target 2045 FundSM, Wells Fargo Advantage Dow Jones Target 2050 FundSM, Wells Fargo Advantage Dow Jones Target2055 FundSM, Wells Fargo Advantage Heritage Money Market FundSM, Wells Fargo Advantage VT Discovery FundSM, and Wells Fargo Advantage VTOpportunity FundSM are referred to as the Discovery Fund, Endeavor Select Fund, Enterprise Fund, Opportunity Fund, WealthBuilder ConservativeAllocation Portfolio, WealthBuilder Equity Portfolio, WealthBuilder Growth Allocation Portfolio, WealthBuilder Growth Balanced Portfolio,WealthBuilder Moderate Balanced Portfolio, WealthBuilder Tactical Equity Portfolio, Target Today Fund, Target 2010 Fund, Target 2015 Fund, Target2020 Fund, Target 2025 Fund, Target 2030 Fund, Target 2035 Fund, Target 2040 Fund, Target 2045 Fund, Target 2050 Fund, Target 2055 Fund,Heritage Money Market Fund, VT Discovery Fund, and VT Opportunity Fund, respectively.
Not part of the annual report.

2 Wells Fargo Advantage Heritage Money Market Fund Letter to shareholders (unaudited)
Karla M. RabuschPresidentWells Fargo Advantage Funds
We continue to believe thatmost investors can benefit
from adhering to a well-diversified, high-quality
investment strategy that isfocused on liquidity and
capital preservation.
Dear Valued Shareholder:We are pleased to offer you this annual report for the Wells Fargo AdvantageHeritage Money Market Fund for the 12-month period that ended January 31, 2013.The past 12 months were marked by accommodative central bank policies, lowinterest rates, and regulatory uncertainty. Despite the challenges of a changingmarket landscape, we continue to believe that most investors can benefit fromadhering to a well-diversified, high-quality investment strategy that is focused onliquidity and capital preservation.
The Federal Reserve remained focused on spurring economic growth.Citing its dual mandate of fostering maximum employment and price stability, theFederal Reserve (Fed) reaffirmed its commitment to highly accommodativemonetary policy. In addition, the Fed formally announced that exceptionally lowinterest rates would be appropriate at least as long as the unemployment rateremains above 6.5% and inflation remains no more than half a percentage pointabove its 2.0% inflation target. It also continued its quantitative easing program.
Despite aggressive monetary policy accommodation, the U.S. economic recoveryremained weak compared with previous business cycles. Three forces—discretionaryfiscal policy, housing market activity, and household income expectations—have notbeen firing on all cylinders and therefore the recovery has been tepid up to this point.Further, many households still face barriers to credit access, and businesses have beenreluctant to spend in the face of economic and policy uncertainty.
Yields remained low.Yields remained near record lows due to a combination of strong demand andlimited supply of money market securities. Not only did the Fed keep its federalfunds target rate near zero, but strong demand for U.S. Treasuries also contributedto low yields as investments in other areas—notably the eurozone—were seen asrisky due to the weak finances of the peripheral countries and many banks. Theinfusions of liquidity into the European banking system did alleviate credit stressesover the course of the year as indicated by the three-month London InterbankOffered Rate (LIBOR), which fell nearly 30 basis points (bps; 100 bps equals 1.00%) bythe end of December 2012, which was approximately half of what it was at the samepoint in 2011.
Overall supply in the money markets continued to decrease as some issuersdeleveraged and others issued long-term debt to take advantage of low interestrates. As of December 31, 2012, U.S. government debt makes up the vast majority ofthe money market supply. Treasuries, agencies, and repurchase agreementscomprise more than 75% of the money market supply. Prime instruments make uponly 22% of the total, and nearly three-quarters of those securities were issued byforeign entities.
Despite interest rates remaining low, these rates have not been a death knell forthe money market industry. Investors are involved in this sector for complexreasons, and yield has been but one component driving their investment choices.More often, relative safety, diversification, and liquidity have been higher-valuepropositions to these investors, factors that were not diminished by Fed policy ortechnical developments.
Money market regulations remained under review.Regulators remained concerned about potential systemic risk from money marketfunds in the event of another financial crisis and sought further revisions to moneymarket fund regulations in order to mitigate that risk. In August 2012, however,former-SEC

Letter to shareholders (unaudited) Wells Fargo Advantage Heritage Money Market Fund 3
Chairman Mary Schapiro issued a statement indicating that, in light of the statedpositions of a majority of the SEC commissioners, the SEC would not call a vote ona proposal to modify money market fund regulations. In November 2012, theFinancial Stability Oversight Council (FSOC) proposed additional regulations tothe SEC in an attempt to address any perceived risk that investors may redeem enmasse, or run, from money market funds in response to market distress. Theseproposed measures included requiring money market funds to maintain afloating-rate net asset value, withhold a minimum balance at risk from redeemingshareholders, and/or maintain capital buffers. As of January 31, 2013, the FSOCwas reviewing comment letters from the public, including ourselves (Wells FargoFunds Management, LLC), regarding its proposals. As we gain clarity in the comingmonths regarding potential changes to the regulation of money market funds, wewill provide further communications to you about them.
Amid the current challenges of investing—low yields, limited supply, andregulatory uncertainty—has been the opportunity to help our shareholders meettheir short-term cash needs. Our focus on preservation of capital and liquidity isthe basis of our investment philosophy. We are proud of our comprehensivelineup of prime, government, and tax-exempt money market funds.
Thank you for choosing to invest with Wells Fargo Advantage Funds. We appreciateyour confidence in us and remain committed to helping you meet your financialneeds. For current information about your fund investments, contact yourinvestment professional, visit our website at wellsfargoadvantagefunds.com, orcall us directly at 1-800-222-8222. We are available 24 hours a day, 7 days a week.
Sincerely,
Karla M. RabuschPresidentWells Fargo Advantage Funds
Amid the current challenges ofinvesting—low yields, limitedsupply, and regulatoryuncertainty—has been theopportunity to help ourshareholders meet their short-term cash needs.
4 Wells Fargo Advantage Heritage Money Market Fund Money market overview (unaudited)
OverviewThree themes dominated the prime sector during the 12-month period that ended January 31, 2013: central bankactions, rating agency actions, and the overall supply of investments. The year began with the focus on Europe and theEuropean Central Bank’s (ECB’s) Long-Term Refinancing Operation (LTRO). Conducted by the ECB to provide unlimitedamounts of three-year financing to banks at a below-market clearing rate at the time, the objective was to provideenough liquidity to allow banks to repay their 2012 maturities as well as boost investor confidence. In total, Europeanbanks took €1 trillion through the LTRO. This additional liquidity was viewed positively, resulting in greater Europeanbank exposure on both a secured and unsecured basis. Even Greece’s debt restructuring and slowing economic growthin the United Kingdom and Spain did little to dampen investors’ enthusiasm as they instead focused on positive earningsnews from European banks. The first opportunity for banks to repay their LTRO borrowings occurred in January 2013when 278 banks repaid €137 billion, reinforcing the perception that the European financial situation has stabilized.
At mid-year, with world economies sluggish and risk aversion still pervasive, the Federal Reserve (Fed) and the ECB stepped uptheir rhetoric and actions in an attempt to improve financial conditions. The Fed announced a continuation of quantitativeeasing programs and changed how it communicated monetary accommodation from a strategy that was largely date-focusedto one that was tied to explicit inflation and unemployment thresholds as a guide to interest-rate policy.
Even as the Fed was actively trying to stimulate the economy, the ECB was fighting off rumors of the eurozone breakingup. As the yields on the securities of certain eurozone nations were significantly widening, the ECB president declared theECB would “do whatever it takes” to preserve the euro. The functional part of this statement took the form of outrightmonetary transactions, which provide conditional liquidity backstop to eurozone members. The ECB essentiallypurchased unlimited amounts of one- to three-year sovereign debt in the secondary market to lower borrowing costsand improve market liquidity. Market response was largely positive and solvency concerns in the eurozone havesubsided.
In mid-June 2012, Moody’s downgraded a number of the 17 global capital markets intermediaries and other banks it hadplaced on credit watch earlier in the year. Market participants were initially concerned that other rating agencies wouldfollow suit, further reducing the supply of money market-eligible investments. However, no other agencies acted in a likemanner, and the downgrade by Moody’s did not change the eligibility of these credits for purchase by money marketfunds; thus, the downgrade ultimately had a minimal impact on credit or market liquidity.
Finally, the supply of money market fund-eligible securities was an ongoing concern. As individuals and institutionspared their overall level of debt and issuers took advantage of extremely low rates to extend the maturity of theirremaining debt, the amount of short-term debt outstanding declined, leading to falling short-term interest.
Foreign financial issuers were one of the few bright spots in terms of supply. While the total amount of commercial paper(CP) outstanding has fallen to half of its August 2007 peak and total asset-backed CP declined 75%, issuance by foreignfinancials rose by over one-third. Total financial CP outstanding has increased roughly $65 billion since July 2012; of thatamount, over 70%, or $46 billion, is from foreign issuers.
For much of the year, municipal variable-rate demand notes (VRDNs) had been an attractive alternative for our primefunds compared with repurchase agreement or short-term deposit rates. However, inflows into municipal money marketfunds in the last several months of this period resulted in an increased demand for them. When combined with a morethan 5% reduction in supply over the year, yields on VRDNs fell to levels where most were no longer attractive comparedwith alternative investments.
In our view, the risks inherent in pushing the boundaries in credit or increasing the weighted average maturities of ourportfolios to extremes are offset by the small incremental yield increase available. After the Fed and the ECB actively gavesupport to risk assets, we selectively extended the term of our maturities to capture a positive-sloping yield curve. However,we did not do so at the expense of maintaining a high degree of liquidity and diversification, as we believe pursuing thisstrategy will allow us to quickly adjust the portfolios to benefit our shareholders in changing market conditions.

Money market overview (unaudited) Wells Fargo Advantage Heritage Money Market Fund 5
Strategic outlookAs we look to the next fiscal year, many uncertainties remain for money markets funds and the money market industry.Regulators continue to discuss the potential for further changing the standards and practices for money market fundsbeyond those already implemented. From a market perspective, the Fed has been quite clear about its intent to keepinterest rates low for an extended period. But we believe eventually interest rates will begin to normalize, and after anumber of years of near-zero rates, the adjustment process may not be smooth. It’s also possible that another debate onraising the debt ceiling could take place later this spring or summer, and as we saw in August 2011, those debates couldlead to meaningful dislocations in the markets. In the face of these challenges, we believe that our portfolio strategy, withits focus on capital preservation and portfolio liquidity, will enable the Fund to continue to meet its objectives.
6 Wells Fargo Advantage Heritage Money Market Fund Performance highlights (unaudited)
Investment objectiveThe Fund seeks current income, while preserving capital and liquidity.
AdviserWells Fargo Funds Management, LLC
SubadviserWells Capital Management Incorporated
Portfolio managersDavid D. SylvesterLaurie White
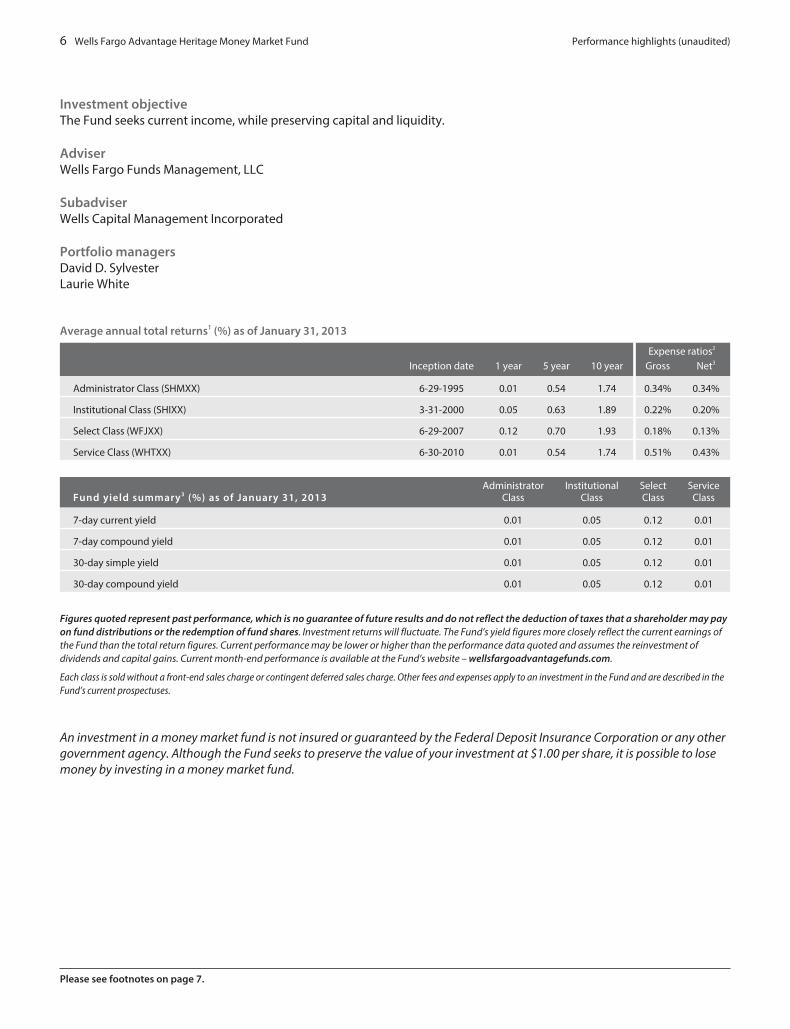
Average annual total returns1 (%) as of January 31, 2013
Expense ratios2
Inception date 1 year 5 year 10 year Gross Net3
Administrator Class (SHMXX) 6-29-1995 0.01 0.54 1.74 0.34% 0.34%
Institutional Class (SHIXX) 3-31-2000 0.05 0.63 1.89 0.22% 0.20%
Select Class (WFJXX) 6-29-2007 0.12 0.70 1.93 0.18% 0.13%
Service Class (WHTXX) 6-30-2010 0.01 0.54 1.74 0.51% 0.43%
Fund yield summary3 (%) as of January 31, 2013Administrator
ClassInstitutional
ClassSelectClass
ServiceClass
7-day current yield 0.01 0.05 0.12 0.01
7-day compound yield 0.01 0.05 0.12 0.01
30-day simple yield 0.01 0.05 0.12 0.01
30-day compound yield 0.01 0.05 0.12 0.01
Figures quoted represent past performance, which is no guarantee of future results and do not reflect the deduction of taxes that a shareholder may payon fund distributions or the redemption of fund shares. Investment returns will fluctuate. The Fund’s yield figures more closely reflect the current earnings ofthe Fund than the total return figures. Current performance may be lower or higher than the performance data quoted and assumes the reinvestment ofdividends and capital gains. Current month-end performance is available at the Fund’s website – wellsfargoadvantagefunds.com.
Each class is sold without a front-end sales charge or contingent deferred sales charge. Other fees and expenses apply to an investment in the Fund and are described in theFund’s current prospectuses.
An investment in a money market fund is not insured or guaranteed by the Federal Deposit Insurance Corporation or any othergovernment agency. Although the Fund seeks to preserve the value of your investment at $1.00 per share, it is possible to losemoney by investing in a money market fund.
Please see footnotes on page 7.
Performance highlights (unaudited) Wells Fargo Advantage Heritage Money Market Fund 7
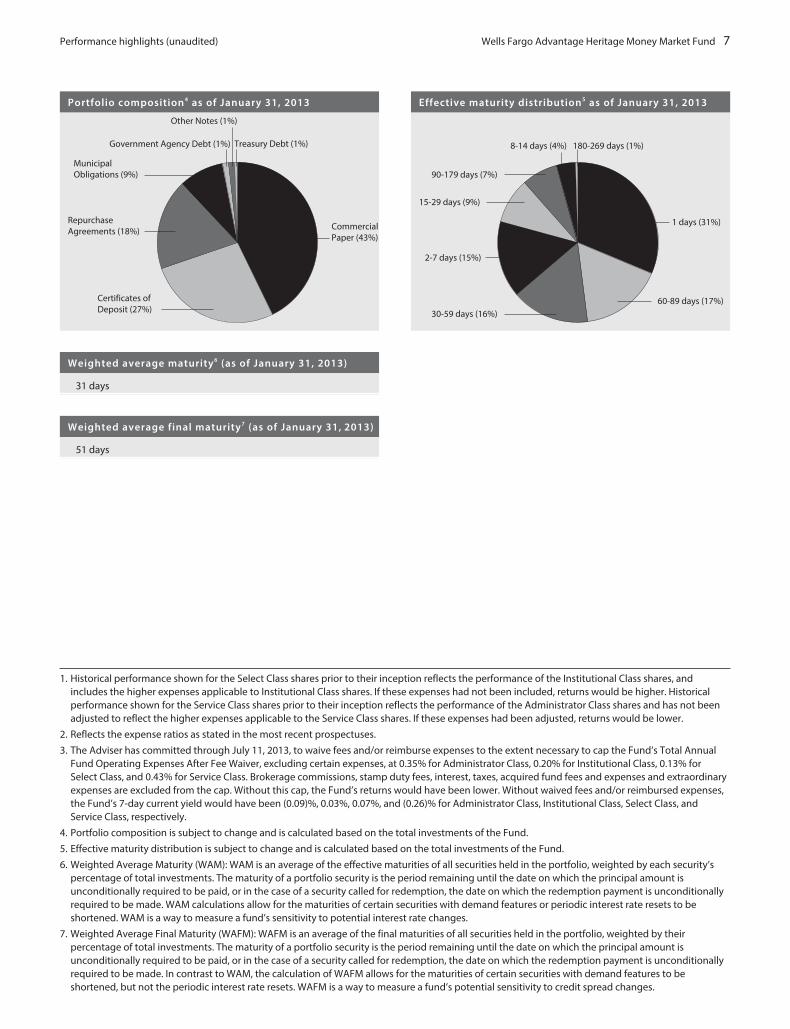
Portfolio composition4 as of January 31, 2013
CommercialPaper (43%)
Certificates ofDeposit (27%)
RepurchaseAgreements (18%)
MunicipalObligations (9%)
Government Agency Debt (1%)
Other Notes (1%)
Treasury Debt (1%)
Weighted average maturity6 (as of January 31, 2013)
31 days
Weighted average final maturity7 (as of January 31, 2013)
51 days
Effective maturity distribution5 as of January 31, 2013
1 days (31%)
60-89 days (17%)30-59 days (16%)
2-7 days (15%)
15-29 days (9%)
90-179 days (7%)
8-14 days (4%) 180-269 days (1%)
1. Historical performance shown for the Select Class shares prior to their inception reflects the performance of the Institutional Class shares, andincludes the higher expenses applicable to Institutional Class shares. If these expenses had not been included, returns would be higher. Historicalperformance shown for the Service Class shares prior to their inception reflects the performance of the Administrator Class shares and has not beenadjusted to reflect the higher expenses applicable to the Service Class shares. If these expenses had been adjusted, returns would be lower.
2. Reflects the expense ratios as stated in the most recent prospectuses.
3. The Adviser has committed through July 11, 2013, to waive fees and/or reimburse expenses to the extent necessary to cap the Fund’s Total AnnualFund Operating Expenses After Fee Waiver, excluding certain expenses, at 0.35% for Administrator Class, 0.20% for Institutional Class, 0.13% forSelect Class, and 0.43% for Service Class. Brokerage commissions, stamp duty fees, interest, taxes, acquired fund fees and expenses and extraordinaryexpenses are excluded from the cap. Without this cap, the Fund’s returns would have been lower. Without waived fees and/or reimbursed expenses,the Fund’s 7-day current yield would have been (0.09)%, 0.03%, 0.07%, and (0.26)% for Administrator Class, Institutional Class, Select Class, andService Class, respectively.
4. Portfolio composition is subject to change and is calculated based on the total investments of the Fund.
5. Effective maturity distribution is subject to change and is calculated based on the total investments of the Fund.
6. Weighted Average Maturity (WAM): WAM is an average of the effective maturities of all securities held in the portfolio, weighted by each security’spercentage of total investments. The maturity of a portfolio security is the period remaining until the date on which the principal amount isunconditionally required to be paid, or in the case of a security called for redemption, the date on which the redemption payment is unconditionallyrequired to be made. WAM calculations allow for the maturities of certain securities with demand features or periodic interest rate resets to beshortened. WAM is a way to measure a fund’s sensitivity to potential interest rate changes.
7. Weighted Average Final Maturity (WAFM): WAFM is an average of the final maturities of all securities held in the portfolio, weighted by theirpercentage of total investments. The maturity of a portfolio security is the period remaining until the date on which the principal amount isunconditionally required to be paid, or in the case of a security called for redemption, the date on which the redemption payment is unconditionallyrequired to be made. In contrast to WAM, the calculation of WAFM allows for the maturities of certain securities with demand features to beshortened, but not the periodic interest rate resets. WAFM is a way to measure a fund’s potential sensitivity to credit spread changes.

8 Wells Fargo Advantage Heritage Money Market Fund Fund expenses (unaudited)
As a shareholder of the Fund, you incur ongoing costs, including management fees, shareholder service fees, and otherFund expenses. This example is intended to help you understand your ongoing costs (in dollars) of investing in the Fundand to compare these costs with the ongoing costs of investing in other mutual funds.
The example is based on an investment of $1,000 invested at the beginning of the six-month period and held for theentire period from August 1, 2012 to January 31, 2013.
Actual expensesThe “Actual” line of the table below provides information about actual account values and actual expenses. You may usethe information in this line, together with the amount you invested, to estimate the expenses that you paid over theperiod. Simply divide your account value by $1,000 (for example, an $8,600 account value divided by $1,000 = 8.6), thenmultiply the result by the number in the “Actual” line under the heading entitled “Expenses paid during period” for yourapplicable class of shares to estimate the expenses you paid on your account during this period.
Hypothetical example for comparison PurposesThe “Hypothetical” line of the table below provides information about hypothetical account values and hypotheticalexpenses based on the Fund’s actual expense ratio and an assumed rate of return of 5% per year before expenses, whichis not the Fund’s actual return. The hypothetical account values and expenses may not be used to estimate the actualending account balance or expenses you paid for the period. You may use this information to compare the ongoing costsof investing in the Fund and other funds. To do so, compare this 5% hypothetical example with the 5% hypotheticalexamples that appear in the shareholder reports of the other funds.
Please note that the expenses shown in the table are meant to highlight your ongoing costs only. Therefore, the“Hypothetical” line of the table is useful in comparing ongoing costs only and will not help you determine the relativetotal costs of owning different funds.
Beginningaccount value
8-1-2012
Endingaccount value
1-31-2013
Expensespaid duringthe period1
Net annualexpense ratio
Administrator Class
Actual $1,000.00 $1,000.05 $1.31 0.26%
Hypothetical (5% return before expenses) $1,000.00 $1,023.83 $1.32 0.26%
Institutional Class
Actual $1,000.00 $1,000.37 $1.01 0.20%
Hypothetical (5% return before expenses) $1,000.00 $1,024.13 $1.02 0.20%
Select Class
Actual $1,000.00 $1,000.72 $0.65 0.13%
Hypothetical (5% return before expenses) $1,000.00 $1,024.48 $0.66 0.13%
Service Class
Actual $1,000.00 $1,000.05 $1.31 0.26%
Hypothetical (5% return before expenses) $1,000.00 $1,023.83 $1.32 0.26%
1. Expenses paid is equal to the annualized expense ratio of each class multiplied by the average account value over the period, multiplied by thenumber of days in the most recent fiscal half-year divided by the number of days in the fiscal year (to reflect the one-half-year period).
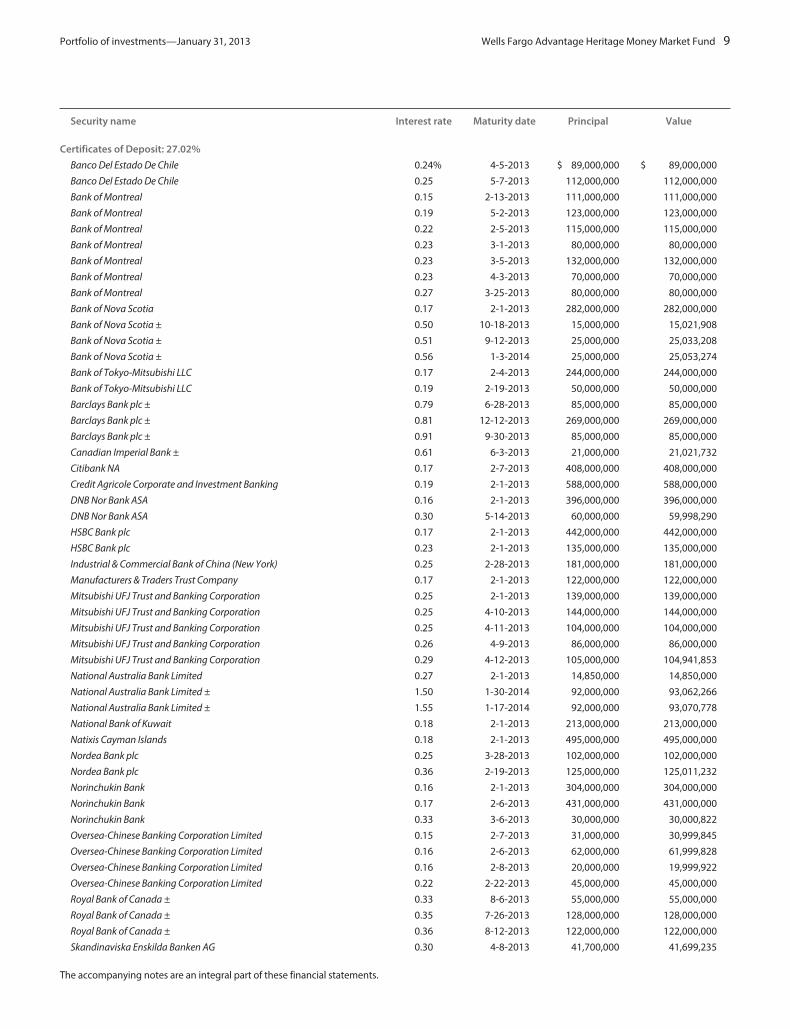
Portfolio of investments—January 31, 2013 Wells Fargo Advantage Heritage Money Market Fund 9
Security name Interest rate Maturity date Principal Value
Certificates of Deposit: 27.02%
Banco Del Estado De Chile 0.24% 4-5-2013 $ 89,000,000 $ 89,000,000
Banco Del Estado De Chile 0.25 5-7-2013 112,000,000 112,000,000
Bank of Montreal 0.15 2-13-2013 111,000,000 111,000,000
Bank of Montreal 0.19 5-2-2013 123,000,000 123,000,000
Bank of Montreal 0.22 2-5-2013 115,000,000 115,000,000
Bank of Montreal 0.23 3-1-2013 80,000,000 80,000,000
Bank of Montreal 0.23 3-5-2013 132,000,000 132,000,000
Bank of Montreal 0.23 4-3-2013 70,000,000 70,000,000
Bank of Montreal 0.27 3-25-2013 80,000,000 80,000,000
Bank of Nova Scotia 0.17 2-1-2013 282,000,000 282,000,000
Bank of Nova Scotia ± 0.50 10-18-2013 15,000,000 15,021,908
Bank of Nova Scotia ± 0.51 9-12-2013 25,000,000 25,033,208
Bank of Nova Scotia ± 0.56 1-3-2014 25,000,000 25,053,274
Bank of Tokyo-Mitsubishi LLC 0.17 2-4-2013 244,000,000 244,000,000
Bank of Tokyo-Mitsubishi LLC 0.19 2-19-2013 50,000,000 50,000,000
Barclays Bank plc ± 0.79 6-28-2013 85,000,000 85,000,000
Barclays Bank plc ± 0.81 12-12-2013 269,000,000 269,000,000
Barclays Bank plc ± 0.91 9-30-2013 85,000,000 85,000,000
Canadian Imperial Bank ± 0.61 6-3-2013 21,000,000 21,021,732
Citibank NA 0.17 2-7-2013 408,000,000 408,000,000
Credit Agricole Corporate and Investment Banking 0.19 2-1-2013 588,000,000 588,000,000
DNB Nor Bank ASA 0.16 2-1-2013 396,000,000 396,000,000
DNB Nor Bank ASA 0.30 5-14-2013 60,000,000 59,998,290
HSBC Bank plc 0.17 2-1-2013 442,000,000 442,000,000
HSBC Bank plc 0.23 2-1-2013 135,000,000 135,000,000
Industrial & Commercial Bank of China (New York) 0.25 2-28-2013 181,000,000 181,000,000
Manufacturers & Traders Trust Company 0.17 2-1-2013 122,000,000 122,000,000
Mitsubishi UFJ Trust and Banking Corporation 0.25 2-1-2013 139,000,000 139,000,000
Mitsubishi UFJ Trust and Banking Corporation 0.25 4-10-2013 144,000,000 144,000,000
Mitsubishi UFJ Trust and Banking Corporation 0.25 4-11-2013 104,000,000 104,000,000
Mitsubishi UFJ Trust and Banking Corporation 0.26 4-9-2013 86,000,000 86,000,000
Mitsubishi UFJ Trust and Banking Corporation 0.29 4-12-2013 105,000,000 104,941,853
National Australia Bank Limited 0.27 2-1-2013 14,850,000 14,850,000
National Australia Bank Limited ± 1.50 1-30-2014 92,000,000 93,062,266
National Australia Bank Limited ± 1.55 1-17-2014 92,000,000 93,070,778
National Bank of Kuwait 0.18 2-1-2013 213,000,000 213,000,000
Natixis Cayman Islands 0.18 2-1-2013 495,000,000 495,000,000
Nordea Bank plc 0.25 3-28-2013 102,000,000 102,000,000
Nordea Bank plc 0.36 2-19-2013 125,000,000 125,011,232
Norinchukin Bank 0.16 2-1-2013 304,000,000 304,000,000
Norinchukin Bank 0.17 2-6-2013 431,000,000 431,000,000
Norinchukin Bank 0.33 3-6-2013 30,000,000 30,000,822
Oversea-Chinese Banking Corporation Limited 0.15 2-7-2013 31,000,000 30,999,845
Oversea-Chinese Banking Corporation Limited 0.16 2-6-2013 62,000,000 61,999,828
Oversea-Chinese Banking Corporation Limited 0.16 2-8-2013 20,000,000 19,999,922
Oversea-Chinese Banking Corporation Limited 0.22 2-22-2013 45,000,000 45,000,000
Royal Bank of Canada ± 0.33 8-6-2013 55,000,000 55,000,000
Royal Bank of Canada ± 0.35 7-26-2013 128,000,000 128,000,000
Royal Bank of Canada ± 0.36 8-12-2013 122,000,000 122,000,000
Skandinaviska Enskilda Banken AG 0.30 4-8-2013 41,700,000 41,699,235
The accompanying notes are an integral part of these financial statements.

10 Wells Fargo Advantage Heritage Money Market Fund Portfolio of investments—January 31, 2013
Security name Interest rate Maturity date Principal Value
Certificates of Deposit (continued)
Skandinaviska Enskilda Banken AG ± 0.58% 12-3-2013 $ 282,000,000 $ 282,000,000
Societe Generale (New York) 0.38 4-10-2013 133,000,000 133,000,000
Societe Generale (New York) 0.38 4-11-2013 133,000,000 133,000,000
State Street Bank & Trust 0.22 3-7-2013 150,000,000 150,000,000
Sumitomo Mitsui Banking Corporation 0.25 2-11-2013 216,000,000 216,000,000
Sumitomo Mitsui Banking Corporation 0.25 4-8-2013 104,000,000 104,000,000
Sumitomo Mitsui Banking Corporation 0.25 4-10-2013 56,000,000 56,000,000
Sumitomo Mitsui Banking Corporation 0.25 4-11-2013 92,000,000 92,000,000
Sumitomo Mitsui Banking Corporation 0.25 4-12-2013 68,000,000 68,000,000
Sumitomo Trust & Banking Corporation 0.16 2-5-2013 300,000,000 300,000,000
Swedbank 0.16 2-1-2013 250,000,000 250,000,000
Toronto-Dominion Bank 0.19 5-8-2013 131,000,000 131,000,000
Toronto-Dominion Bank 0.22 2-13-2013 24,000,000 24,000,000
Toronto-Dominion Bank 0.29 2-4-2013 155,000,000 155,000,000
Toronto-Dominion Bank ± 0.30 7-26-2013 65,000,000 65,000,000
Toronto-Dominion Bank ± 0.30 10-21-2013 121,000,000 121,000,000
Toronto-Dominion Bank 0.31 9-13-2013 147,000,000 147,000,000
Total Certificates of Deposit (Cost $9,755,764,193) 9,755,764,193
Commercial Paper: 42.97%
Asset-Backed Commercial Paper: 14.95%
Alpine Securitization Corporation 144A(z) 0.18 2-27-2013 137,225,000 137,207,161
Alpine Securitization Corporation 144A(z) 0.19 2-4-2013 75,600,000 75,598,803
Alpine Securitization Corporation 144A(z) 0.19 2-19-2013 94,400,000 94,391,032
Alpine Securitization Corporation 144A(z) 0.19 2-20-2013 66,000,000 65,993,382
Alpine Securitization Corporation 144A(z) 0.20 2-12-2013 77,000,000 76,995,294
Anglesea Funding LLC 144A(z) 0.42 2-1-2013 98,000,000 98,000,000
Anglesea Funding LLC 144A(z) 0.42 2-4-2013 41,000,000 40,998,565
Anglesea Funding LLC 144A(z) 0.42 2-27-2013 69,000,000 68,979,070
Antalis US Funding Corporation 144A(z) 0.40 3-21-2013 19,761,000 19,750,461
Atlantic Asset Securitization LLC 144A(z) 0.25 2-12-2013 50,000,000 49,996,181
Atlantic Asset Securitization LLC 144A(z) 0.25 2-15-2013 23,000,000 22,997,764
Atlantic Asset Securitization LLC 144A(z) 0.25 2-19-2013 30,000,000 29,996,250
Bedford Row Funding Corporation 144A(z) 0.35 8-1-2013 65,300,000 65,185,090
CAFCO LLC 144A(z) 0.21 2-28-2013 20,000,000 19,996,850
CAFCO LLC 144A(z) 0.22 2-25-2013 35,000,000 34,994,867
Charta LLC 144A(z) 0.22 2-25-2013 60,000,000 59,991,200
Charta LLC 144A(z) 0.22 3-1-2013 40,000,000 39,993,155
Collateralized Commercial Paper Company LLC (z) 0.30 5-22-2013 141,000,000 140,870,750
Collateralized Commercial Paper Company LLC (z) 0.32 4-10-2013 74,000,000 73,955,271
Collateralized Commercial Paper Company LLC (z) 0.32 4-12-2013 60,000,000 59,962,667
Collateralized Commercial Paper Company LLC 144A(z) 0.33 5-6-2013 96,000,000 95,917,280
Collateralized Commercial Paper Company LLC (z) 0.35 5-13-2013 60,000,000 59,941,083
Concord Minutemen Capital Company 144A(z) 0.30 3-11-2013 28,000,000 27,991,133
Concord Minutemen Capital Company 144A(z) 0.31 3-5-2013 38,000,000 37,989,529
CRC Funding LLC 144A(z) 0.21 2-28-2013 48,000,000 47,992,440
CRC Funding LLC 144A(z) 0.22 3-1-2013 39,000,000 38,993,327
Fairway Finance Corporation 144A(z) 0.20 4-25-2013 46,644,000 46,622,492
Fairway Finance Corporation 144A(z) 0.23 2-20-2013 30,000,000 29,996,358
The accompanying notes are an integral part of these financial statements.
Portfolio of investments—January 31, 2013 Wells Fargo Advantage Heritage Money Market Fund 11
Security name Interest rate Maturity date Principal Value
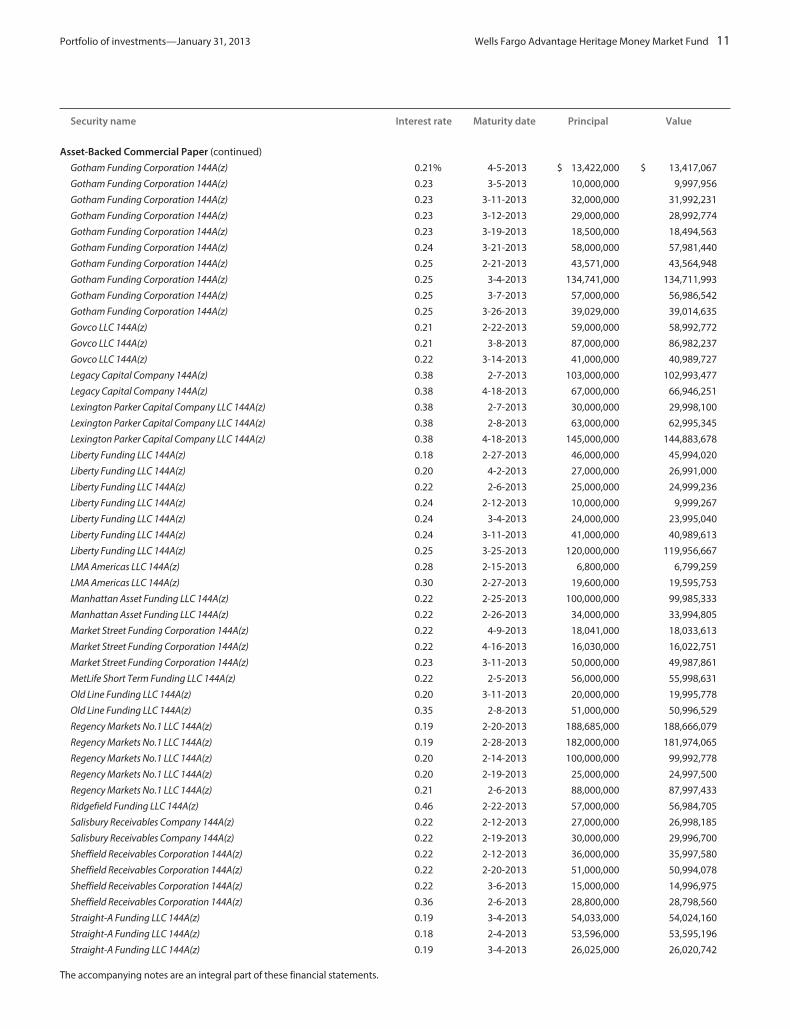
Asset-Backed Commercial Paper (continued)
Gotham Funding Corporation 144A(z) 0.21% 4-5-2013 $ 13,422,000 $ 13,417,067
Gotham Funding Corporation 144A(z) 0.23 3-5-2013 10,000,000 9,997,956
Gotham Funding Corporation 144A(z) 0.23 3-11-2013 32,000,000 31,992,231
Gotham Funding Corporation 144A(z) 0.23 3-12-2013 29,000,000 28,992,774
Gotham Funding Corporation 144A(z) 0.23 3-19-2013 18,500,000 18,494,563
Gotham Funding Corporation 144A(z) 0.24 3-21-2013 58,000,000 57,981,440
Gotham Funding Corporation 144A(z) 0.25 2-21-2013 43,571,000 43,564,948
Gotham Funding Corporation 144A(z) 0.25 3-4-2013 134,741,000 134,711,993
Gotham Funding Corporation 144A(z) 0.25 3-7-2013 57,000,000 56,986,542
Gotham Funding Corporation 144A(z) 0.25 3-26-2013 39,029,000 39,014,635
Govco LLC 144A(z) 0.21 2-22-2013 59,000,000 58,992,772
Govco LLC 144A(z) 0.21 3-8-2013 87,000,000 86,982,237
Govco LLC 144A(z) 0.22 3-14-2013 41,000,000 40,989,727
Legacy Capital Company 144A(z) 0.38 2-7-2013 103,000,000 102,993,477
Legacy Capital Company 144A(z) 0.38 4-18-2013 67,000,000 66,946,251
Lexington Parker Capital Company LLC 144A(z) 0.38 2-7-2013 30,000,000 29,998,100
Lexington Parker Capital Company LLC 144A(z) 0.38 2-8-2013 63,000,000 62,995,345
Lexington Parker Capital Company LLC 144A(z) 0.38 4-18-2013 145,000,000 144,883,678
Liberty Funding LLC 144A(z) 0.18 2-27-2013 46,000,000 45,994,020
Liberty Funding LLC 144A(z) 0.20 4-2-2013 27,000,000 26,991,000
Liberty Funding LLC 144A(z) 0.22 2-6-2013 25,000,000 24,999,236
Liberty Funding LLC 144A(z) 0.24 2-12-2013 10,000,000 9,999,267
Liberty Funding LLC 144A(z) 0.24 3-4-2013 24,000,000 23,995,040
Liberty Funding LLC 144A(z) 0.24 3-11-2013 41,000,000 40,989,613
Liberty Funding LLC 144A(z) 0.25 3-25-2013 120,000,000 119,956,667
LMA Americas LLC 144A(z) 0.28 2-15-2013 6,800,000 6,799,259
LMA Americas LLC 144A(z) 0.30 2-27-2013 19,600,000 19,595,753
Manhattan Asset Funding LLC 144A(z) 0.22 2-25-2013 100,000,000 99,985,333
Manhattan Asset Funding LLC 144A(z) 0.22 2-26-2013 34,000,000 33,994,805
Market Street Funding Corporation 144A(z) 0.22 4-9-2013 18,041,000 18,033,613
Market Street Funding Corporation 144A(z) 0.22 4-16-2013 16,030,000 16,022,751
Market Street Funding Corporation 144A(z) 0.23 3-11-2013 50,000,000 49,987,861
MetLife Short Term Funding LLC 144A(z) 0.22 2-5-2013 56,000,000 55,998,631
Old Line Funding LLC 144A(z) 0.20 3-11-2013 20,000,000 19,995,778
Old Line Funding LLC 144A(z) 0.35 2-8-2013 51,000,000 50,996,529
Regency Markets No.1 LLC 144A(z) 0.19 2-20-2013 188,685,000 188,666,079
Regency Markets No.1 LLC 144A(z) 0.19 2-28-2013 182,000,000 181,974,065
Regency Markets No.1 LLC 144A(z) 0.20 2-14-2013 100,000,000 99,992,778
Regency Markets No.1 LLC 144A(z) 0.20 2-19-2013 25,000,000 24,997,500
Regency Markets No.1 LLC 144A(z) 0.21 2-6-2013 88,000,000 87,997,433
Ridgefield Funding LLC 144A(z) 0.46 2-22-2013 57,000,000 56,984,705
Salisbury Receivables Company 144A(z) 0.22 2-12-2013 27,000,000 26,998,185
Salisbury Receivables Company 144A(z) 0.22 2-19-2013 30,000,000 29,996,700
Sheffield Receivables Corporation 144A(z) 0.22 2-12-2013 36,000,000 35,997,580
Sheffield Receivables Corporation 144A(z) 0.22 2-20-2013 51,000,000 50,994,078
Sheffield Receivables Corporation 144A(z) 0.22 3-6-2013 15,000,000 14,996,975
Sheffield Receivables Corporation 144A(z) 0.36 2-6-2013 28,800,000 28,798,560
Straight-A Funding LLC 144A(z) 0.19 3-4-2013 54,033,000 54,024,160
Straight-A Funding LLC 144A(z) 0.18 2-4-2013 53,596,000 53,595,196
Straight-A Funding LLC 144A(z) 0.19 3-4-2013 26,025,000 26,020,742
The accompanying notes are an integral part of these financial statements.

12 Wells Fargo Advantage Heritage Money Market Fund Portfolio of investments—January 31, 2013
Security name Interest rate Maturity date Principal Value
Asset-Backed Commercial Paper (continued)
Straight-A Funding LLC 144A(z) 0.19% 3-8-2013 $ 30,089,000 $ 30,083,442
Straight-A Funding LLC 144A(z) 0.19 4-3-2013 105,220,000 105,186,125
Straight-A Funding LLC 144A(z) 0.19 4-5-2013 121,399,000 121,358,635
Surrey Funding Corporation 144A(z) 0.31 3-8-2013 38,000,000 37,988,547
Surrey Funding Corporation 144A(z) 0.36 2-7-2013 19,000,000 18,998,860
Sydney Capital Corporation 144A(z) 0.25 3-12-2013 49,300,000 49,286,648
Sydney Capital Corporation 144A(z) 0.25 3-14-2013 74,700,000 74,677,638
Sydney Capital Corporation 144A(z) 0.25 4-9-2013 42,000,000 41,979,956
Sydney Capital Corporation 144A(z) 0.28 2-14-2013 5,000,000 4,999,494
Sydney Capital Corporation 144A(z) 0.28 3-19-2013 26,300,000 26,290,590
Thunder Bay Funding LLC 144A(z) 0.35 2-1-2013 23,000,000 23,000,000
Thunder Bay Funding LLC 144A(z) 0.35 2-7-2013 54,635,000 54,631,813
Victory Receivables 144A(z) 0.21 2-13-2013 13,000,000 12,999,090
Victory Receivables 144A(z) 0.21 2-14-2013 71,000,000 70,994,616
Victory Receivables 144A(z) 0.21 2-21-2013 35,639,000 35,634,842
Victory Receivables 144A(z) 0.22 3-22-2013 28,000,000 27,991,616
Victory Receivables 144A(z) 0.23 3-4-2013 56,416,000 56,404,827
Victory Receivables 144A(z) 0.23 3-5-2013 27,000,000 26,994,480
Victory Receivables 144A(z) 0.23 3-8-2013 90,000,000 89,979,875
Victory Receivables 144A(z) 0.23 3-14-2013 13,000,000 12,996,595
Victory Receivables 144A(z) 0.23 3-18-2013 41,332,000 41,320,118
White Point Funding Incorporated 144A(z) 0.42 3-11-2013 5,744,000 5,741,453
Working Capital Management Company 144A(z) 0.23 2-25-2013 20,000,000 19,996,933
Working Capital Management Company 144A(z) 0.21 2-1-2013 45,440,000 45,440,000
Working Capital Management Company 144A(z) 0.23 2-22-2013 45,000,000 44,993,963
5,397,573,239
Financial Company Commercial Paper: 25.09%
ANZ National Limited 144A(z) 0.20 4-24-2013 34,750,000 34,734,169
ASB Finance Limited 144A(z) 0.24 2-5-2013 24,000,000 23,999,360
ASB Finance Limited 144A± 0.38 4-8-2013 61,000,000 61,000,000
ASB Finance Limited 144A± 0.38 2-25-2013 98,000,000 98,000,000
ASB Finance Limited 144A± 0.40 7-23-2013 86,000,000 86,000,000
ASB Finance Limited 144A± 0.44 9-5-2013 66,000,000 66,000,000
ASB Finance Limited 144A± 0.45 9-3-2013 70,000,000 70,000,000
ASB Finance Limited 144A± 0.45 8-29-2013 70,000,000 70,000,000
Australia & New Zealand Banking Group 144A± 0.36 11-18-2013 62,000,000 62,000,000
Banco De Chile 144A(z) 0.42 3-15-2013 30,000,000 29,985,300
Banco De Credito E Inversiones 144A(z) 0.45 2-1-2013 125,000,000 125,000,000
Barclays Bank plc 144A(z) 0.29 4-26-2013 113,000,000 112,923,537
Barclays Bank plc 144A(z) 0.35 5-29-2013 150,000,000 149,829,375
BNZ International Funding Limited 144A(z) 0.23 2-13-2013 2,000,000 1,999,847
BNZ International Funding Limited 144A(z) 0.23 2-14-2013 12,000,000 11,999,003
BNZ International Funding Limited 144A(z) 0.23 2-21-2013 24,000,000 23,996,933
BNZ International Funding Limited 144A(z) 0.24 3-5-2013 83,000,000 82,982,662
BNZ International Funding Limited 144A(z) 0.24 2-5-2013 41,000,000 40,998,907
BNZ International Funding Limited 144A± 0.41 10-2-2013 83,000,000 83,000,000
BNZ International Funding Limited 144A± 0.41 11-1-2013 80,000,000 80,000,000
BNZ International Funding Limited 144A± 0.48 2-28-2013 13,000,000 13,000,011
BPCE 144A(z) 0.37 4-1-2013 88,000,000 87,946,638
The accompanying notes are an integral part of these financial statements.
Portfolio of investments—January 31, 2013 Wells Fargo Advantage Heritage Money Market Fund 13
Security name Interest rate Maturity date Principal Value
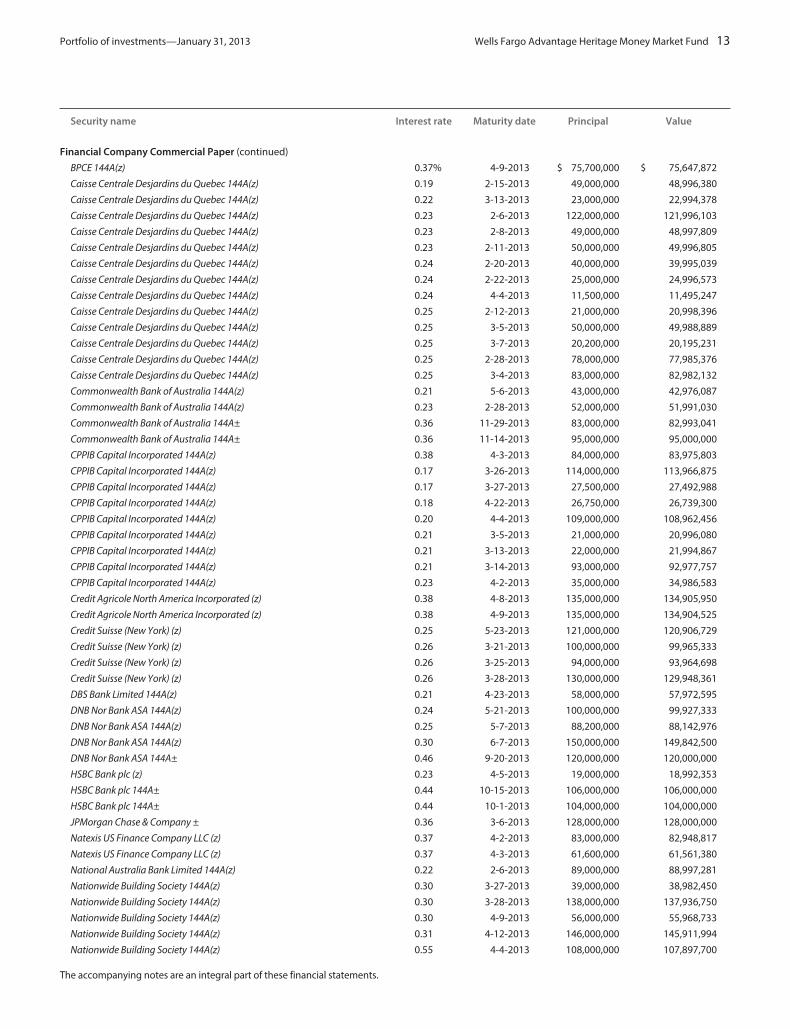
Financial Company Commercial Paper (continued)
BPCE 144A(z) 0.37% 4-9-2013 $ 75,700,000 $ 75,647,872
Caisse Centrale Desjardins du Quebec 144A(z) 0.19 2-15-2013 49,000,000 48,996,380
Caisse Centrale Desjardins du Quebec 144A(z) 0.22 3-13-2013 23,000,000 22,994,378
Caisse Centrale Desjardins du Quebec 144A(z) 0.23 2-6-2013 122,000,000 121,996,103
Caisse Centrale Desjardins du Quebec 144A(z) 0.23 2-8-2013 49,000,000 48,997,809
Caisse Centrale Desjardins du Quebec 144A(z) 0.23 2-11-2013 50,000,000 49,996,805
Caisse Centrale Desjardins du Quebec 144A(z) 0.24 2-20-2013 40,000,000 39,995,039
Caisse Centrale Desjardins du Quebec 144A(z) 0.24 2-22-2013 25,000,000 24,996,573
Caisse Centrale Desjardins du Quebec 144A(z) 0.24 4-4-2013 11,500,000 11,495,247
Caisse Centrale Desjardins du Quebec 144A(z) 0.25 2-12-2013 21,000,000 20,998,396
Caisse Centrale Desjardins du Quebec 144A(z) 0.25 3-5-2013 50,000,000 49,988,889
Caisse Centrale Desjardins du Quebec 144A(z) 0.25 3-7-2013 20,200,000 20,195,231
Caisse Centrale Desjardins du Quebec 144A(z) 0.25 2-28-2013 78,000,000 77,985,376
Caisse Centrale Desjardins du Quebec 144A(z) 0.25 3-4-2013 83,000,000 82,982,132
Commonwealth Bank of Australia 144A(z) 0.21 5-6-2013 43,000,000 42,976,087
Commonwealth Bank of Australia 144A(z) 0.23 2-28-2013 52,000,000 51,991,030
Commonwealth Bank of Australia 144A± 0.36 11-29-2013 83,000,000 82,993,041
Commonwealth Bank of Australia 144A± 0.36 11-14-2013 95,000,000 95,000,000
CPPIB Capital Incorporated 144A(z) 0.38 4-3-2013 84,000,000 83,975,803
CPPIB Capital Incorporated 144A(z) 0.17 3-26-2013 114,000,000 113,966,875
CPPIB Capital Incorporated 144A(z) 0.17 3-27-2013 27,500,000 27,492,988
CPPIB Capital Incorporated 144A(z) 0.18 4-22-2013 26,750,000 26,739,300
CPPIB Capital Incorporated 144A(z) 0.20 4-4-2013 109,000,000 108,962,456
CPPIB Capital Incorporated 144A(z) 0.21 3-5-2013 21,000,000 20,996,080
CPPIB Capital Incorporated 144A(z) 0.21 3-13-2013 22,000,000 21,994,867
CPPIB Capital Incorporated 144A(z) 0.21 3-14-2013 93,000,000 92,977,757
CPPIB Capital Incorporated 144A(z) 0.23 4-2-2013 35,000,000 34,986,583
Credit Agricole North America Incorporated (z) 0.38 4-8-2013 135,000,000 134,905,950
Credit Agricole North America Incorporated (z) 0.38 4-9-2013 135,000,000 134,904,525
Credit Suisse (New York) (z) 0.25 5-23-2013 121,000,000 120,906,729
Credit Suisse (New York) (z) 0.26 3-21-2013 100,000,000 99,965,333
Credit Suisse (New York) (z) 0.26 3-25-2013 94,000,000 93,964,698
Credit Suisse (New York) (z) 0.26 3-28-2013 130,000,000 129,948,361
DBS Bank Limited 144A(z) 0.21 4-23-2013 58,000,000 57,972,595
DNB Nor Bank ASA 144A(z) 0.24 5-21-2013 100,000,000 99,927,333
DNB Nor Bank ASA 144A(z) 0.25 5-7-2013 88,200,000 88,142,976
DNB Nor Bank ASA 144A(z) 0.30 6-7-2013 150,000,000 149,842,500
DNB Nor Bank ASA 144A± 0.46 9-20-2013 120,000,000 120,000,000
HSBC Bank plc (z) 0.23 4-5-2013 19,000,000 18,992,353
HSBC Bank plc 144A± 0.44 10-15-2013 106,000,000 106,000,000
HSBC Bank plc 144A± 0.44 10-1-2013 104,000,000 104,000,000
JPMorgan Chase & Company ± 0.36 3-6-2013 128,000,000 128,000,000
Natexis US Finance Company LLC (z) 0.37 4-2-2013 83,000,000 82,948,817
Natexis US Finance Company LLC (z) 0.37 4-3-2013 61,600,000 61,561,380
National Australia Bank Limited 144A(z) 0.22 2-6-2013 89,000,000 88,997,281
Nationwide Building Society 144A(z) 0.30 3-27-2013 39,000,000 38,982,450
Nationwide Building Society 144A(z) 0.30 3-28-2013 138,000,000 137,936,750
Nationwide Building Society 144A(z) 0.30 4-9-2013 56,000,000 55,968,733
Nationwide Building Society 144A(z) 0.31 4-12-2013 146,000,000 145,911,994
Nationwide Building Society 144A(z) 0.55 4-4-2013 108,000,000 107,897,700
The accompanying notes are an integral part of these financial statements.

14 Wells Fargo Advantage Heritage Money Market Fund Portfolio of investments—January 31, 2013
Security name Interest rate Maturity date Principal Value
Financial Company Commercial Paper (continued)
Oversea-Chinese Banking Corporation Limited (z) 0.18% 2-4-2013 $ 43,500,000 $ 43,499,347
Oversea-Chinese Banking Corporation Limited (z) 0.19 3-28-2013 134,000,000 133,961,102
Oversea-Chinese Banking Corporation Limited (z) 0.20 4-30-2013 78,000,000 77,961,867
Prudential plc 144A(z) 0.27 4-29-2013 121,000,000 120,921,047
SBAB Bank AB 144A(z) 0.30 4-2-2013 10,000,000 9,995,000
SBAB Bank AB 144A(z) 0.31 2-5-2013 88,000,000 87,996,969
SBAB Bank AB 144A(z) 0.31 2-8-2013 8,000,000 7,999,518
SBAB Bank AB 144A(z) 0.31 2-11-2013 39,000,000 38,996,642
SBAB Bank AB 144A(z) 0.31 2-19-2013 49,000,000 48,992,405
Skandinaviska Enskilda Banken AG 144A(z) 0.42 5-15-2013 95,000,000 94,886,521
Skandinaviska Enskilda Banken AG 144A(z) 0.60 7-8-2013 202,000,000 201,471,433
Societe Generale (North America) (z) 0.37 4-2-2013 109,000,000 108,932,783
Societe Generale (North America) (z) 0.38 4-3-2013 62,000,000 61,960,079
State Street Corporation (z) 0.18 4-22-2013 75,000,000 74,970,000
State Street Corporation (z) 0.18 5-1-2013 33,000,000 32,985,315
State Street Corporation (z) 0.22 3-12-2013 75,000,000 74,982,125
Sumitomo Mitsui Banking Corporation 144A(z) 0.16 2-1-2013 300,000,000 300,000,000
Sumitomo Mitsui Banking Corporation 144A(z) 0.16 2-5-2013 21,000,000 20,999,627
Sumitomo Mitsui Banking Corporation 144A(z) 0.25 2-8-2013 63,000,000 62,996,938
Sumitomo Mitsui Banking Corporation 144A(z) 0.25 4-8-2013 36,000,000 35,983,500
Suncorp Group Limited 144A(z) 0.44 3-12-2013 74,000,000 73,964,727
Suncorp Group Limited 144A(z) 0.44 4-30-2013 72,000,000 71,922,560
Suncorp Group Limited 144A(z) 0.45 2-5-2013 14,000,000 13,999,300
Suncorp Group Limited 144A(z) 0.45 3-11-2013 21,000,000 20,990,025
Suncorp Group Limited 144A(z) 0.45 3-18-2013 107,000,000 106,940,663
Suncorp Group Limited 144A(z) 0.45 3-20-2013 26,000,000 25,984,725
Swedbank (z) 0.25 4-15-2013 66,000,000 65,966,542
Swedbank (z) 0.25 5-9-2013 150,000,000 149,898,958
Swedbank (z) 0.26 3-25-2013 76,000,000 75,972,007
Swedbank (z) 0.26 3-27-2013 50,000,000 49,980,875
Swedbank (z) 0.28 3-20-2013 35,300,000 35,287,096
Swedbank (z) 0.34 8-1-2013 117,090,000 116,889,841
Swedbank (z) 0.49 7-3-2013 78,000,000 77,838,627
Swedbank (z) 0.50 7-1-2013 105,000,000 104,781,250
Swedbank (z) 0.50 7-2-2013 52,000,000 51,890,944
Toyota Credit Canada Incorporated (z) 0.25 3-15-2013 23,000,000 22,993,292
Toyota Credit Canada Incorporated (z) 0.25 3-19-2013 30,000,000 29,990,417
Toyota Credit Canada Incorporated (z) 0.31 2-6-2013 15,000,000 14,999,354
UBS Finance Delaware LLC (z) 0.22 5-14-2013 327,000,000 326,796,170
UOB Funding LLC (z) 0.22 2-21-2013 30,000,000 29,996,333
UOB Funding LLC (z) 0.24 4-4-2013 17,000,000 16,992,973
Westpac Banking Corporation 144A± 0.35 1-16-2014 112,000,000 111,989,051
Westpac Banking Corporation 144A± 0.36 11-8-2013 78,000,000 77,993,831
Westpac Securities NZ Limited 144A± 0.38 4-8-2013 118,000,000 118,004,946
Westpac Securities NZ Limited 144A± 0.38 2-22-2013 100,000,000 100,000,000
Westpac Securities NZ Limited 144A± 0.38 2-25-2013 60,000,000 60,000,000
Westpac Securities NZ Limited 144A± 0.40 10-25-2013 105,000,000 105,000,000
Westpac Securities NZ Limited 144A± 0.46 7-22-2013 97,000,000 97,000,000
Westpac Securities NZ Limited 144A± 0.50 4-15-2013 40,000,000 40,004,037
9,059,954,059
The accompanying notes are an integral part of these financial statements.
Portfolio of investments—January 31, 2013 Wells Fargo Advantage Heritage Money Market Fund 15
Security name Interest rate Maturity date Principal Value
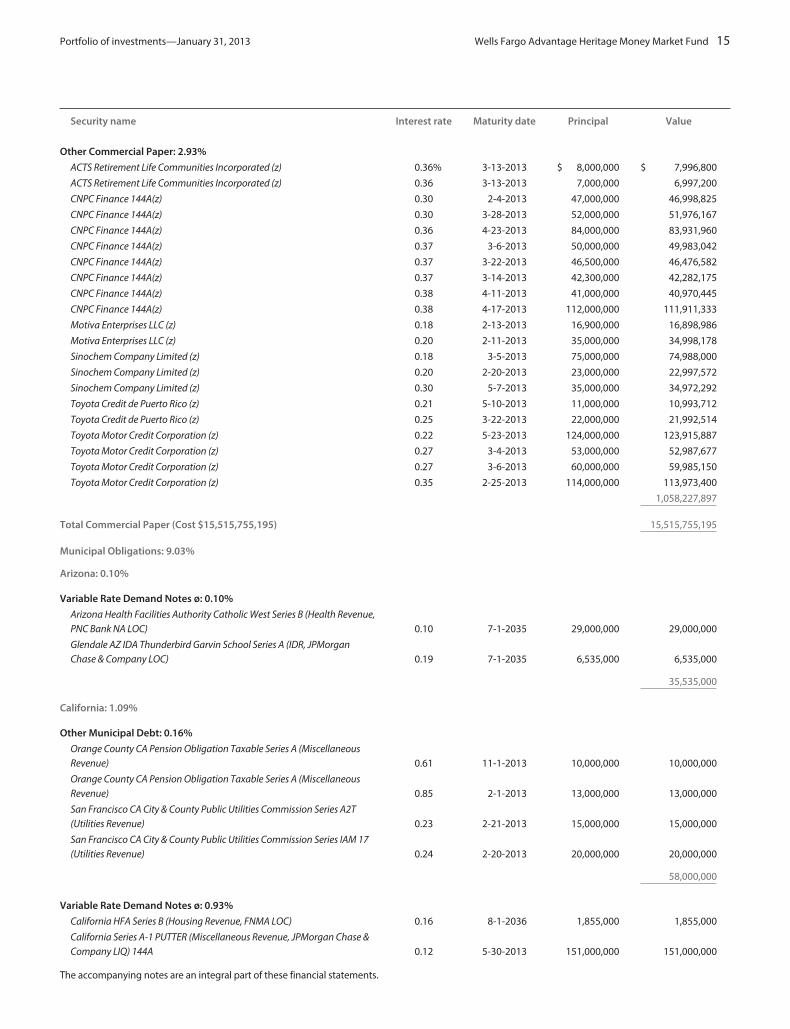
Other Commercial Paper: 2.93%
ACTS Retirement Life Communities Incorporated (z) 0.36% 3-13-2013 $ 8,000,000 $ 7,996,800
ACTS Retirement Life Communities Incorporated (z) 0.36 3-13-2013 7,000,000 6,997,200
CNPC Finance 144A(z) 0.30 2-4-2013 47,000,000 46,998,825
CNPC Finance 144A(z) 0.30 3-28-2013 52,000,000 51,976,167
CNPC Finance 144A(z) 0.36 4-23-2013 84,000,000 83,931,960
CNPC Finance 144A(z) 0.37 3-6-2013 50,000,000 49,983,042
CNPC Finance 144A(z) 0.37 3-22-2013 46,500,000 46,476,582
CNPC Finance 144A(z) 0.37 3-14-2013 42,300,000 42,282,175
CNPC Finance 144A(z) 0.38 4-11-2013 41,000,000 40,970,445
CNPC Finance 144A(z) 0.38 4-17-2013 112,000,000 111,911,333
Motiva Enterprises LLC (z) 0.18 2-13-2013 16,900,000 16,898,986
Motiva Enterprises LLC (z) 0.20 2-11-2013 35,000,000 34,998,178
Sinochem Company Limited (z) 0.18 3-5-2013 75,000,000 74,988,000
Sinochem Company Limited (z) 0.20 2-20-2013 23,000,000 22,997,572
Sinochem Company Limited (z) 0.30 5-7-2013 35,000,000 34,972,292
Toyota Credit de Puerto Rico (z) 0.21 5-10-2013 11,000,000 10,993,712
Toyota Credit de Puerto Rico (z) 0.25 3-22-2013 22,000,000 21,992,514
Toyota Motor Credit Corporation (z) 0.22 5-23-2013 124,000,000 123,915,887
Toyota Motor Credit Corporation (z) 0.27 3-4-2013 53,000,000 52,987,677
Toyota Motor Credit Corporation (z) 0.27 3-6-2013 60,000,000 59,985,150
Toyota Motor Credit Corporation (z) 0.35 2-25-2013 114,000,000 113,973,400
1,058,227,897
Total Commercial Paper (Cost $15,515,755,195) 15,515,755,195
Municipal Obligations: 9.03%
Arizona: 0.10%
Variable Rate Demand Notes ø: 0.10%
Arizona Health Facilities Authority Catholic West Series B (Health Revenue,PNC Bank NA LOC) 0.10 7-1-2035 29,000,000 29,000,000
Glendale AZ IDA Thunderbird Garvin School Series A (IDR, JPMorganChase & Company LOC) 0.19 7-1-2035 6,535,000 6,535,000
35,535,000
California: 1.09%
Other Municipal Debt: 0.16%
Orange County CA Pension Obligation Taxable Series A (MiscellaneousRevenue) 0.61 11-1-2013 10,000,000 10,000,000
Orange County CA Pension Obligation Taxable Series A (MiscellaneousRevenue) 0.85 2-1-2013 13,000,000 13,000,000
San Francisco CA City & County Public Utilities Commission Series A2T(Utilities Revenue) 0.23 2-21-2013 15,000,000 15,000,000
San Francisco CA City & County Public Utilities Commission Series IAM 17(Utilities Revenue) 0.24 2-20-2013 20,000,000 20,000,000
58,000,000
Variable Rate Demand Notes ø: 0.93%
California HFA Series B (Housing Revenue, FNMA LOC) 0.16 8-1-2036 1,855,000 1,855,000
California Series A-1 PUTTER (Miscellaneous Revenue, JPMorgan Chase &Company LIQ) 144A 0.12 5-30-2013 151,000,000 151,000,000
The accompanying notes are an integral part of these financial statements.

16 Wells Fargo Advantage Heritage Money Market Fund Portfolio of investments—January 31, 2013
Security name Interest rate Maturity date Principal Value
Variable Rate Demand Notes ø (continued)
Golden State Tobacco Securitization Corporation California Series 3107(Tobacco Revenue, BHAC/Ambac Insured, Morgan Stanley Bank LIQ) 144A 0.13% 12-1-2045 $ 25,710,000 $ 25,710,000
Newport Beach CA Hoag Memorial Hospital Series F (Health Revenue, Bankof America NA LOC) 0.12 12-1-2040 50,875,000 50,875,000
Sacramento CA MUD Series K (Utilities Revenue, Bank of America NA LOC) 0.11 8-15-2028 48,900,000 48,900,000
San Bernardino County CA Flood Control District (Miscellaneous Revenue,Bank of America NA LOC) 0.12 8-1-2037 31,295,000 31,295,000
San Francisco CA City & County COP Series B001 (Miscellaneous Revenue,Morgan Stanley Bank LIQ) 144A 0.25 11-1-2041 4,000,000 4,000,000
San Luis Obispo County CA Financing Authority Series 3030 NacimientoWater Project Series A (Water & Sewer Revenue, BHAC/MBIA Insured, MorganStanley Bank LIQ) 144A 0.13 9-1-2038 23,570,000 23,570,000
337,205,000
Colorado: 0.73%
Variable Rate Demand Notes ø: 0.73%Colorado HFA Class I Series A-1 (Housing Revenue, FHLB SPA) 0.19 10-1-2033 13,420,000 13,420,000
Colorado HFA Class I Series A-1 (Housing Revenue, FHLB SPA) 0.19 11-1-2036 795,000 795,000
Colorado HFA Class I Series A-2 (Housing Revenue, Royal Bank of Canada SPA) 0.12 11-1-2026 12,240,000 12,240,000
Colorado HFA Class I Series B-1 (Housing Revenue, JPMorgan Chase &Company SPA) 0.18 10-1-2038 49,420,000 49,420,000
Colorado HFA Class I Series B-2 (Housing Revenue, JPMorgan Chase &Company SPA) 0.15 4-1-2038 12,540,000 12,540,000
Colorado HFA Class I Series B-3 (Housing Revenue, FHLB SPA) 0.12 11-1-2036 25,445,000 25,445,000
Colorado HFA Taxable MFHR Project B-2 (Housing Revenue, FHLB SPA) 0.17 5-1-2050 80,815,000 80,815,000
Colorado TRAN JPMorgan Chase PUTTER/DRIVER Trust Series 4251(Miscellaneous Revenue, JPMorgan Chase & Company LIQ) 144A 0.12 6-27-2013 7,040,000 7,040,000
Southern Ute Indian Tribe Reservation Colorado (Miscellaneous Revenue) 144A 0.10 4-1-2040 62,735,000 62,735,000
264,450,000
Florida: 0.09%
Variable Rate Demand Notes ø: 0.09%Hillsborough FL JPMorgan Chase PUTTER/DRIVER Trust Series 4172 (LeaseRevenue, JPMorgan Chase & Company LIQ) 144A 0.14 1-1-2020 7,950,000 7,950,000
Volusia County FL Eclipse Funding Trust Series 0008 (Miscellaneous Revenue,U.S. Bank NA LOC, AGM Insured, U.S. Bank NA LIQ) 0.10 8-1-2013 11,910,000 11,910,000
Volusia County FL Eclipse Funding Trust Series 0036 (Miscellaneous Revenue,U.S. Bank NA LOC, AGM Insured, U.S. Bank NA LIQ) 0.10 8-1-2032 10,910,000 10,910,000
30,770,000
Georgia: 0.23%
Variable Rate Demand Notes ø: 0.23%Main Street Natural Gas Incorporated Georgia Gas Project Series A (UtilitiesRevenue, Royal Bank of Canada SPA) 0.10 8-1-2040 25,215,000 25,215,000
Richmond County GA Development Authority Health Project Series A (HealthRevenue, JPMorgan Chase & Company LOC) 0.10 7-1-2037 9,750,000 9,750,000
Savannah GA College of Art & Design Series 2004 BD (Education Revenue,Bank of America NA LOC) 0.21 4-1-2024 38,900,000 38,900,000
Wayne County GA IDA Solid Waste Disposal Rayonier Project Series 2000(IDR, Bank of America NA LOC) 0.14 5-1-2020 8,000,000 8,000,000
81,865,000
The accompanying notes are an integral part of these financial statements.
Portfolio of investments—January 31, 2013 Wells Fargo Advantage Heritage Money Market Fund 17
Security name Interest rate Maturity date Principal Value
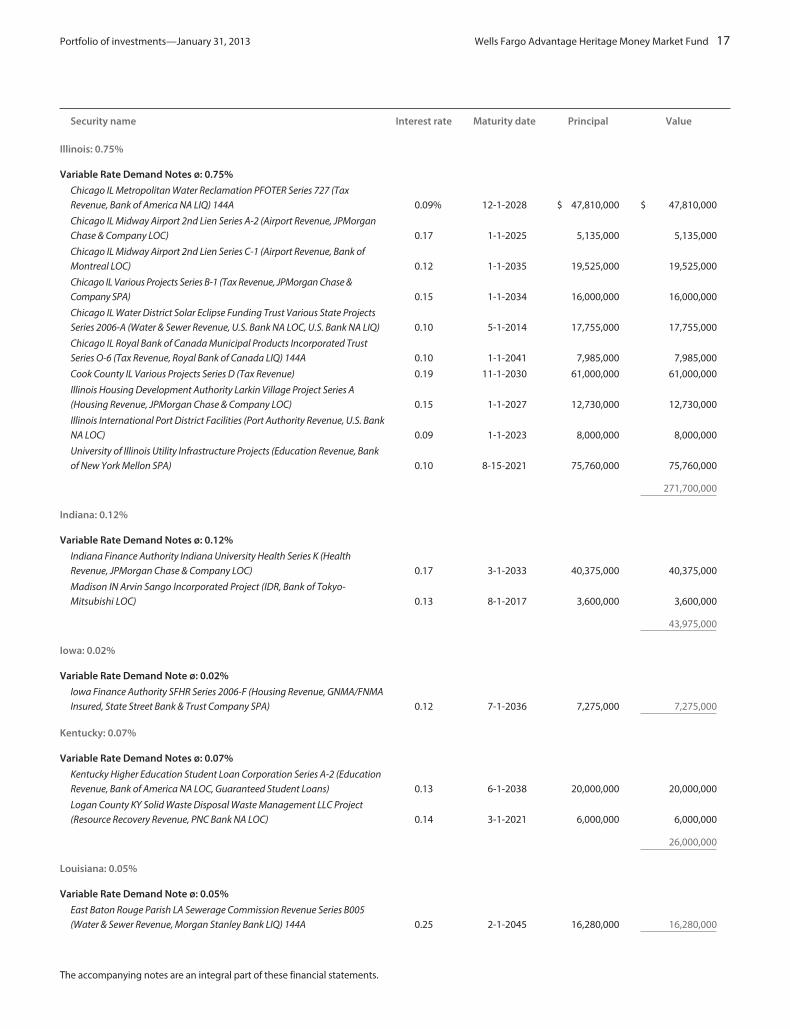
Illinois: 0.75%
Variable Rate Demand Notes ø: 0.75%
Chicago IL Metropolitan Water Reclamation PFOTER Series 727 (TaxRevenue, Bank of America NA LIQ) 144A 0.09% 12-1-2028 $ 47,810,000 $ 47,810,000
Chicago IL Midway Airport 2nd Lien Series A-2 (Airport Revenue, JPMorganChase & Company LOC) 0.17 1-1-2025 5,135,000 5,135,000
Chicago IL Midway Airport 2nd Lien Series C-1 (Airport Revenue, Bank ofMontreal LOC) 0.12 1-1-2035 19,525,000 19,525,000
Chicago IL Various Projects Series B-1 (Tax Revenue, JPMorgan Chase &Company SPA) 0.15 1-1-2034 16,000,000 16,000,000
Chicago IL Water District Solar Eclipse Funding Trust Various State ProjectsSeries 2006-A (Water & Sewer Revenue, U.S. Bank NA LOC, U.S. Bank NA LIQ) 0.10 5-1-2014 17,755,000 17,755,000
Chicago IL Royal Bank of Canada Municipal Products Incorporated TrustSeries O-6 (Tax Revenue, Royal Bank of Canada LIQ) 144A 0.10 1-1-2041 7,985,000 7,985,000
Cook County IL Various Projects Series D (Tax Revenue) 0.19 11-1-2030 61,000,000 61,000,000
Illinois Housing Development Authority Larkin Village Project Series A(Housing Revenue, JPMorgan Chase & Company LOC) 0.15 1-1-2027 12,730,000 12,730,000
Illinois International Port District Facilities (Port Authority Revenue, U.S. BankNA LOC) 0.09 1-1-2023 8,000,000 8,000,000
University of Illinois Utility Infrastructure Projects (Education Revenue, Bankof New York Mellon SPA) 0.10 8-15-2021 75,760,000 75,760,000
271,700,000
Indiana: 0.12%
Variable Rate Demand Notes ø: 0.12%
Indiana Finance Authority Indiana University Health Series K (HealthRevenue, JPMorgan Chase & Company LOC) 0.17 3-1-2033 40,375,000 40,375,000
Madison IN Arvin Sango Incorporated Project (IDR, Bank of Tokyo-Mitsubishi LOC) 0.13 8-1-2017 3,600,000 3,600,000
43,975,000
Iowa: 0.02%
Variable Rate Demand Note ø: 0.02%
Iowa Finance Authority SFHR Series 2006-F (Housing Revenue, GNMA/FNMAInsured, State Street Bank & Trust Company SPA) 0.12 7-1-2036 7,275,000 7,275,000
Kentucky: 0.07%
Variable Rate Demand Notes ø: 0.07%
Kentucky Higher Education Student Loan Corporation Series A-2 (EducationRevenue, Bank of America NA LOC, Guaranteed Student Loans) 0.13 6-1-2038 20,000,000 20,000,000
Logan County KY Solid Waste Disposal Waste Management LLC Project(Resource Recovery Revenue, PNC Bank NA LOC) 0.14 3-1-2021 6,000,000 6,000,000
26,000,000
Louisiana: 0.05%
Variable Rate Demand Note ø: 0.05%
East Baton Rouge Parish LA Sewerage Commission Revenue Series B005(Water & Sewer Revenue, Morgan Stanley Bank LIQ) 144A 0.25 2-1-2045 16,280,000 16,280,000
The accompanying notes are an integral part of these financial statements.

18 Wells Fargo Advantage Heritage Money Market Fund Portfolio of investments—January 31, 2013
Security name Interest rate Maturity date Principal Value
Maryland: 0.28%
Variable Rate Demand Notes ø: 0.28%
Baltimore MD Package Systems Facilities (Transportation Revenue, Bank ofAmerica NA LOC) 0.23% 7-1-2032 $ 45,210,000 $ 45,210,000
Maryland CDA Housing & Community Residential Series B (Housing Revenue) 0.20 9-1-2033 12,000,000 12,000,000
Maryland Health & HEFA Anne Arundel Health System B (Health Revenue,Bank of America NA LOC) 0.13 7-1-2043 44,500,000 44,500,000
101,710,000
Massachusetts: 0.03%
Variable Rate Demand Note ø: 0.03%
Massachusetts HEFA Boston University Project Series N (Education Revenue,Bank of America NA LOC) 0.18 10-1-2034 10,235,000 10,235,000
Michigan: 0.89%
Variable Rate Demand Notes ø: 0.89%
Michigan Finance Authority Series A (Miscellaneous Revenue, Bank ofAmerica NA LOC) 0.19 9-1-2050 100,000,000 100,000,000
Michigan Finance Authority Series B (Miscellaneous Revenue, PNC BankNA LOC) 0.18 9-1-2050 25,000,000 25,000,000
Michigan Finance Authority Series C (Miscellaneous Revenue, Bank ofMontreal LOC) 0.17 9-1-2050 22,000,000 22,000,000
Michigan Higher Education Student Loan Series XVII-K-6 Royal Bank ofCanada Municipal Products Incorporated Series L-31 (Education Revenue,Royal Bank of Canada LOC, Royal Bank of Canada LIQ) 0.16 9-1-2032 34,945,000 34,945,000
Michigan Higher Education Student Loan Series XVII-N-3 Royal Bank ofCanada Municipal Products Incorporated Series L-28 (Education Revenue,Royal Bank of Canada LOC, Royal Bank of Canada LIQ) 0.16 9-1-2033 26,995,000 26,995,000
Michigan Housing Development Authority Series A (Housing Revenue, Bankof Tokyo-Mitsubishi SPA) 0.10 4-1-2040 16,190,000 16,190,000
Michigan Housing Development Authority Series A (Housing Revenue,JPMorgan Chase & Company SPA) 0.15 10-1-2037 34,010,000 34,010,000
Wayne County MI Airport Authority Series E-1 (Airport Revenue, JPMorganChase & Company LOC) 0.11 12-1-2028 25,000,000 25,000,000
Wayne County MI Airport Authority Series F (Airport Revenue, JPMorganChase & Company LOC) 0.11 12-1-2033 37,320,000 37,320,000
321,460,000
Minnesota: 0.12%
Variable Rate Demand Notes ø: 0.12%
Minnesota HFA Residential Housing Series E (Housing Revenue, State StreetBank & Trust Company SPA) 0.20 7-1-2038 2,660,000 2,660,000
Minnesota HFA Residential Housing Series T (Housing Revenue, State StreetBank & Trust Company SPA) 0.20 7-1-2048 4,060,000 4,060,000
Minnesota Office of Higher Education Supplemental Student Loan ProjectSeries A (Education Revenue, U.S. Bank NA LOC) 0.10 9-1-2046 10,500,000 10,500,000
Minnesota Office of Higher Education Supplemental Student Loan ProjectSeries B (Education Revenue, State Street Bank & Trust Company LOC) 0.10 9-1-2046 9,200,000 9,200,000
Minnesota Office of Higher Education Supplemental Student Loan ProjectSeries B (Education Revenue, Royal Bank of Canada LOC) 0.10 8-1-2047 18,000,000 18,000,000
44,420,000
The accompanying notes are an integral part of these financial statements.
Portfolio of investments—January 31, 2013 Wells Fargo Advantage Heritage Money Market Fund 19
Security name Interest rate Maturity date Principal Value
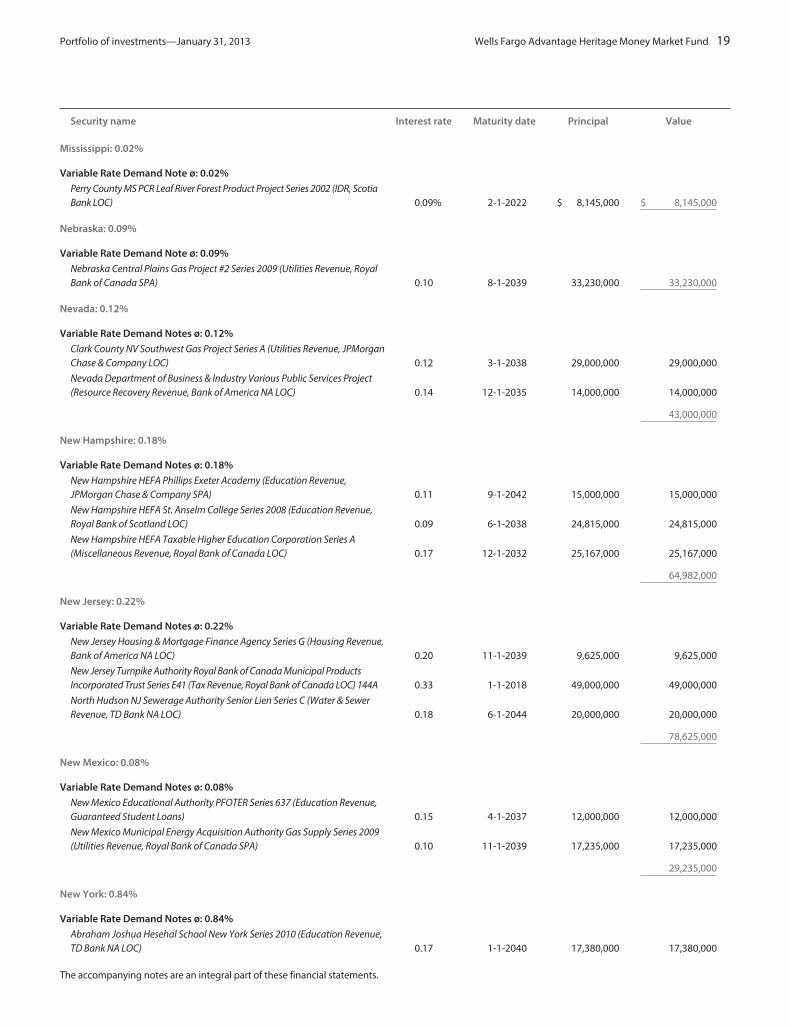
Mississippi: 0.02%
Variable Rate Demand Note ø: 0.02%
Perry County MS PCR Leaf River Forest Product Project Series 2002 (IDR, ScotiaBank LOC) 0.09% 2-1-2022 $ 8,145,000 $ 8,145,000
Nebraska: 0.09%
Variable Rate Demand Note ø: 0.09%
Nebraska Central Plains Gas Project #2 Series 2009 (Utilities Revenue, RoyalBank of Canada SPA) 0.10 8-1-2039 33,230,000 33,230,000
Nevada: 0.12%
Variable Rate Demand Notes ø: 0.12%
Clark County NV Southwest Gas Project Series A (Utilities Revenue, JPMorganChase & Company LOC) 0.12 3-1-2038 29,000,000 29,000,000
Nevada Department of Business & Industry Various Public Services Project(Resource Recovery Revenue, Bank of America NA LOC) 0.14 12-1-2035 14,000,000 14,000,000
43,000,000
New Hampshire: 0.18%
Variable Rate Demand Notes ø: 0.18%
New Hampshire HEFA Phillips Exeter Academy (Education Revenue,JPMorgan Chase & Company SPA) 0.11 9-1-2042 15,000,000 15,000,000
New Hampshire HEFA St. Anselm College Series 2008 (Education Revenue,Royal Bank of Scotland LOC) 0.09 6-1-2038 24,815,000 24,815,000
New Hampshire HEFA Taxable Higher Education Corporation Series A(Miscellaneous Revenue, Royal Bank of Canada LOC) 0.17 12-1-2032 25,167,000 25,167,000
64,982,000
New Jersey: 0.22%
Variable Rate Demand Notes ø: 0.22%
New Jersey Housing & Mortgage Finance Agency Series G (Housing Revenue,Bank of America NA LOC) 0.20 11-1-2039 9,625,000 9,625,000
New Jersey Turnpike Authority Royal Bank of Canada Municipal ProductsIncorporated Trust Series E41 (Tax Revenue, Royal Bank of Canada LOC) 144A 0.33 1-1-2018 49,000,000 49,000,000
North Hudson NJ Sewerage Authority Senior Lien Series C (Water & SewerRevenue, TD Bank NA LOC) 0.18 6-1-2044 20,000,000 20,000,000
78,625,000
New Mexico: 0.08%
Variable Rate Demand Notes ø: 0.08%
New Mexico Educational Authority PFOTER Series 637 (Education Revenue,Guaranteed Student Loans) 0.15 4-1-2037 12,000,000 12,000,000
New Mexico Municipal Energy Acquisition Authority Gas Supply Series 2009(Utilities Revenue, Royal Bank of Canada SPA) 0.10 11-1-2039 17,235,000 17,235,000
29,235,000
New York: 0.84%
Variable Rate Demand Notes ø: 0.84%
Abraham Joshua Hesehal School New York Series 2010 (Education Revenue,TD Bank NA LOC) 0.17 1-1-2040 17,380,000 17,380,000
The accompanying notes are an integral part of these financial statements.

20 Wells Fargo Advantage Heritage Money Market Fund Portfolio of investments—January 31, 2013
Security name Interest rate Maturity date Principal Value
Variable Rate Demand Notes ø (continued)
New York Liberty Development Corporation JPMorgan Chase PUTTER/DRIVER Trust Series 4011Z (Port Authority Revenue, JPMorgan Chase &Company LIQ) 144A 0.11% 6-15-2019 $ 20,675,000 $ 20,675,000
New York Dormitory Authority St. John University Series B-1 (EducationRevenue, Bank of America NA LOC) 0.11 7-1-2034 19,380,000 19,380,000
New York HFA MFHR Second Mortgage Series A (Housing Revenue, FNMAInsured, FNMA LIQ) 0.09 5-1-2029 74,505,000 74,505,000
New York HFA Series A (Housing Revenue, FNMA Insured, FNMA LIQ) 0.12 5-15-2041 50,000,000 50,000,000
New York HFA Victory Housing Project Series 2000-A (Housing Revenue,FHLMC Insured, FHLMC LIQ) 0.10 11-1-2033 8,000,000 8,000,000
New York HFA Victory Housing Project Series 2004-A (Housing Revenue,FHLMC Insured, FHLMC LIQ) 0.10 11-1-2033 2,000,000 2,000,000
New York NY Housing Development Corporation Mortgage ThessalonicaCourt Series A (Housing Revenue, Citibank NA LOC) 0.11 1-1-2036 9,010,000 9,010,000
New York NY Housing Development Corporation Via Verde ApartmentsSeries A (Housing Revenue, JPMorgan Chase & Company LOC) 0.23 1-1-2016 2,335,000 2,335,000
New York NY Transitional Finance Authority JPMorgan Chase PUTTER/DRIVERTrust Series 4043 (Tax Revenue, JPMorgan Chase & Company LIQ) 144A 0.12 4-1-2014 23,470,000 23,470,000
New York Urban Development Corporate Revenue Series A3B (Tax Revenue,JPMorgan Chase & Company SPA) 0.13 3-15-2033 74,615,000 74,615,000
301,370,000
Ohio: 0.39%
Variable Rate Demand Notes ø: 0.39%
Lancaster OH Port Authority Gas Series 2008 (Energy Revenue, Royal Bank ofCanada SPA) 0.10 5-1-2038 18,730,000 18,730,000
Ohio HFA Residential Mortgage Backed Series B (Housing Revenue, GNMA/FNMA Insured, JPMorgan Chase & Company SPA) 0.13 9-1-2038 24,725,000 24,725,000
Ohio HFA Residential Mortgage Backed Series E (Housing Revenue, GNMA/FNMA Insured, JPMorgan Chase & Company SPA) 0.13 9-1-2038 51,000,000 51,000,000
Ohio Higher Education Facilities Ohio Dominican University Project(Education Revenue, JPMorgan Chase & Company LOC) 0.10 12-1-2037 12,200,000 12,200,000
Ohio Housing Finance Agency Residential Mortgage Backed Series D(Housing Revenue, FHLB SPA) 0.12 9-1-2036 19,850,000 19,850,000
Ohio Housing Finance Agency Residential Mortgage Backed Series F(Housing Revenue, GNMA/FNMA Insured, JPMorgan Chase & Company SPA) 0.10 3-1-2037 10,000,000 10,000,000
Warren County OH Health Care Facilities Otterbein Homes Series 1998-B(Health Revenue, U.S. Bank NA LOC) 0.09 7-1-2023 2,775,000 2,775,000
139,280,000
Oklahoma: 0.02%
Variable Rate Demand Note ø: 0.02%
Oklahoma Development Finance Authority Seaboard Farms IncorporationProject (IDR, Bank of New York Mellon LOC) 0.12 3-1-2027 8,800,000 8,800,000
Oregon: 0.14%
Variable Rate Demand Note ø: 0.14%
Port of Portland Oregon Special Obligation Bulk Terminal (Port AuthorityRevenue, Canadian Imperial Bank LOC) 0.09 3-1-2036 49,700,000 49,700,000
The accompanying notes are an integral part of these financial statements.

Portfolio of investments—January 31, 2013 Wells Fargo Advantage Heritage Money Market Fund 21
Security name Interest rate Maturity date Principal Value
Pennsylvania: 0.43%
Other Municipal Debt: 0.11%
Philadelphia PA IDA City Service Agreement Series 2012 (MiscellaneousRevenue) 0.50% 4-1-2013 $ 38,215,000 $ 38,215,000
Variable Rate Demand Notes ø: 0.32%
Montgomery County PA IDA New Regional Medical Center PFOTER PT4674(Health Revenue, FHA Insured, Bank of America NA LIQ) 144A 0.10 8-1-2038 14,000,000 14,000,000
Montgomery County PA IDA Series 3238 (Health Revenue, FHA Insured) 144A 0.10 8-1-2030 8,500,000 8,500,000
Pennsylvania Housing Finance Agency PFOTER Series PT-4653 (HousingRevenue, Bank of America NA LIQ) 144A 0.12 10-1-2039 7,730,000 7,730,000
Pennsylvania Housing Finance Agency Series 86B (Housing Revenue, Bank ofTokyo-Mitsubishi SPA) 0.11 4-1-2035 19,400,000 19,400,000
Pennsylvania Housing Finance Agency Series 89 (Housing Revenue, Bank ofTokyo-Mitsubishi SPA) 0.11 10-1-2035 32,485,000 32,485,000
Pennsylvania Housing Finance Agency Series 93-B (Housing Revenue,JPMorgan Chase & Company SPA) 0.14 4-1-2037 35,085,000 35,085,000
117,200,000
Puerto Rico: 0.09%
Variable Rate Demand Note ø: 0.09%
Puerto Rico Sales Tax Financing Corporation Series 3036 (Tax Revenue) 0.10 8-1-2057 31,716,933 31,716,933
South Carolina: 0.13%
Other Municipal Debt: 0.06%
South Carolina Public Service Authority Series AA IAM 95 (Utilities Revenue) 0.23 2-4-2013 3,000,000 3,000,000
South Carolina Public Service Authority Series AA IAM 96 (Utilities Revenue) 0.23 2-21-2013 8,986,000 8,986,000
York County SC PCR Natural Rural Utilities Cooperative Finance CorporationNorth Carolina Electric Membership Corporation Project Series 2000 B-1(Utilities Revenue) 0.30 3-1-2013 4,500,000 4,500,000
York County SC PCR Natural Rural Utilities Cooperative Finance CorporationNorth Carolina Electric Membership Corporation Project Series 2000 B-3(Utilities Revenue) 0.30 3-1-2013 5,550,000 5,550,000
22,036,000
Variable Rate Demand Note ø: 0.07%
Greenville County SC School District Installment PFOTER Series 730 (LeaseRevenue, Bank of America NA LIQ) 144A 0.09 12-1-2028 25,555,000 25,555,000
South Dakota: 0.07%
Variable Rate Demand Notes ø: 0.07%
South Dakota HEFA Sioux Valley Hospital & Health Systems Project Series2001-C (Health Revenue, U.S. Bank NA LOC) 0.10 11-1-2019 15,000,000 15,000,000
South Dakota Housing Development Authority Series C (Housing Revenue,FHLB SPA) 0.10 5-1-2037 10,800,000 10,800,000
25,800,000
Tennessee: 0.25%
Variable Rate Demand Notes ø: 0.25%
Chattanooga TN Branch Banking and Trust Series 29 (Utilities Revenue,Branch Banking & Trust LIQ) 0.10 3-1-2016 12,500,000 12,500,000
The accompanying notes are an integral part of these financial statements.
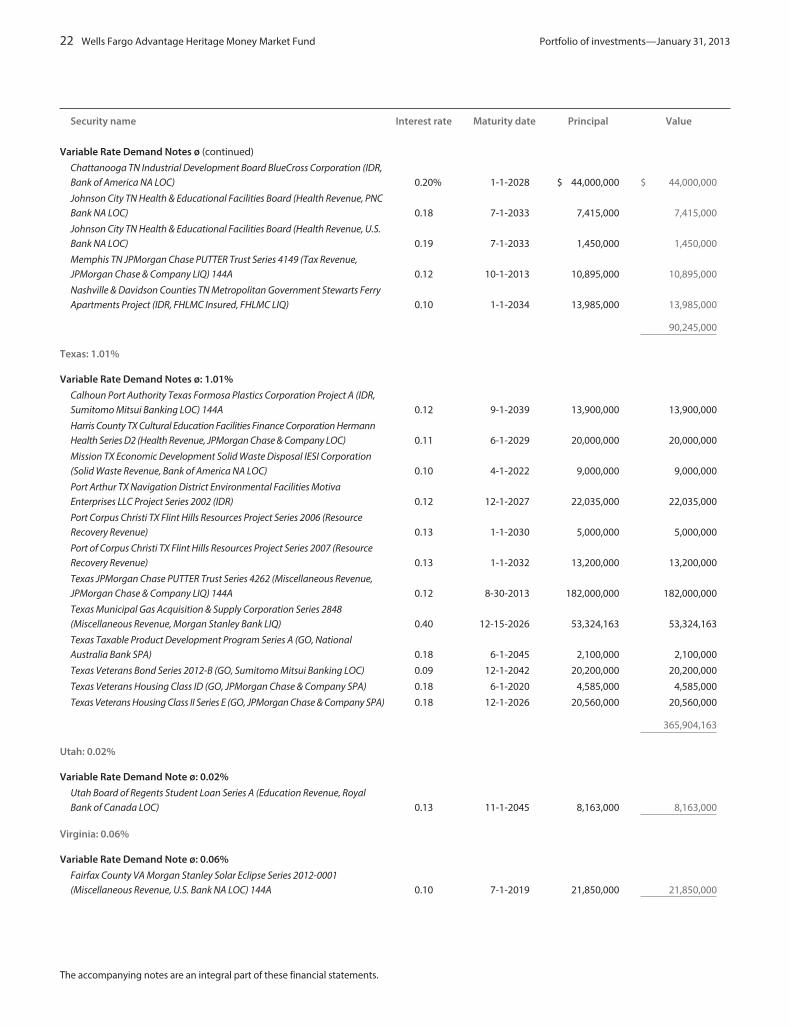
22 Wells Fargo Advantage Heritage Money Market Fund Portfolio of investments—January 31, 2013
Security name Interest rate Maturity date Principal Value
Variable Rate Demand Notes ø (continued)
Chattanooga TN Industrial Development Board BlueCross Corporation (IDR,Bank of America NA LOC) 0.20% 1-1-2028 $ 44,000,000 $ 44,000,000
Johnson City TN Health & Educational Facilities Board (Health Revenue, PNCBank NA LOC) 0.18 7-1-2033 7,415,000 7,415,000
Johnson City TN Health & Educational Facilities Board (Health Revenue, U.S.Bank NA LOC) 0.19 7-1-2033 1,450,000 1,450,000
Memphis TN JPMorgan Chase PUTTER Trust Series 4149 (Tax Revenue,JPMorgan Chase & Company LIQ) 144A 0.12 10-1-2013 10,895,000 10,895,000
Nashville & Davidson Counties TN Metropolitan Government Stewarts FerryApartments Project (IDR, FHLMC Insured, FHLMC LIQ) 0.10 1-1-2034 13,985,000 13,985,000
90,245,000
Texas: 1.01%
Variable Rate Demand Notes ø: 1.01%
Calhoun Port Authority Texas Formosa Plastics Corporation Project A (IDR,Sumitomo Mitsui Banking LOC) 144A 0.12 9-1-2039 13,900,000 13,900,000
Harris County TX Cultural Education Facilities Finance Corporation HermannHealth Series D2 (Health Revenue, JPMorgan Chase & Company LOC) 0.11 6-1-2029 20,000,000 20,000,000
Mission TX Economic Development Solid Waste Disposal IESI Corporation(Solid Waste Revenue, Bank of America NA LOC) 0.10 4-1-2022 9,000,000 9,000,000
Port Arthur TX Navigation District Environmental Facilities MotivaEnterprises LLC Project Series 2002 (IDR) 0.12 12-1-2027 22,035,000 22,035,000
Port Corpus Christi TX Flint Hills Resources Project Series 2006 (ResourceRecovery Revenue) 0.13 1-1-2030 5,000,000 5,000,000
Port of Corpus Christi TX Flint Hills Resources Project Series 2007 (ResourceRecovery Revenue) 0.13 1-1-2032 13,200,000 13,200,000
Texas JPMorgan Chase PUTTER Trust Series 4262 (Miscellaneous Revenue,JPMorgan Chase & Company LIQ) 144A 0.12 8-30-2013 182,000,000 182,000,000
Texas Municipal Gas Acquisition & Supply Corporation Series 2848(Miscellaneous Revenue, Morgan Stanley Bank LIQ) 0.40 12-15-2026 53,324,163 53,324,163
Texas Taxable Product Development Program Series A (GO, NationalAustralia Bank SPA) 0.18 6-1-2045 2,100,000 2,100,000
Texas Veterans Bond Series 2012-B (GO, Sumitomo Mitsui Banking LOC) 0.09 12-1-2042 20,200,000 20,200,000
Texas Veterans Housing Class ID (GO, JPMorgan Chase & Company SPA) 0.18 6-1-2020 4,585,000 4,585,000
Texas Veterans Housing Class II Series E (GO, JPMorgan Chase & Company SPA) 0.18 12-1-2026 20,560,000 20,560,000
365,904,163
Utah: 0.02%
Variable Rate Demand Note ø: 0.02%
Utah Board of Regents Student Loan Series A (Education Revenue, RoyalBank of Canada LOC) 0.13 11-1-2045 8,163,000 8,163,000
Virginia: 0.06%
Variable Rate Demand Note ø: 0.06%
Fairfax County VA Morgan Stanley Solar Eclipse Series 2012-0001(Miscellaneous Revenue, U.S. Bank NA LOC) 144A 0.10 7-1-2019 21,850,000 21,850,000
The accompanying notes are an integral part of these financial statements.
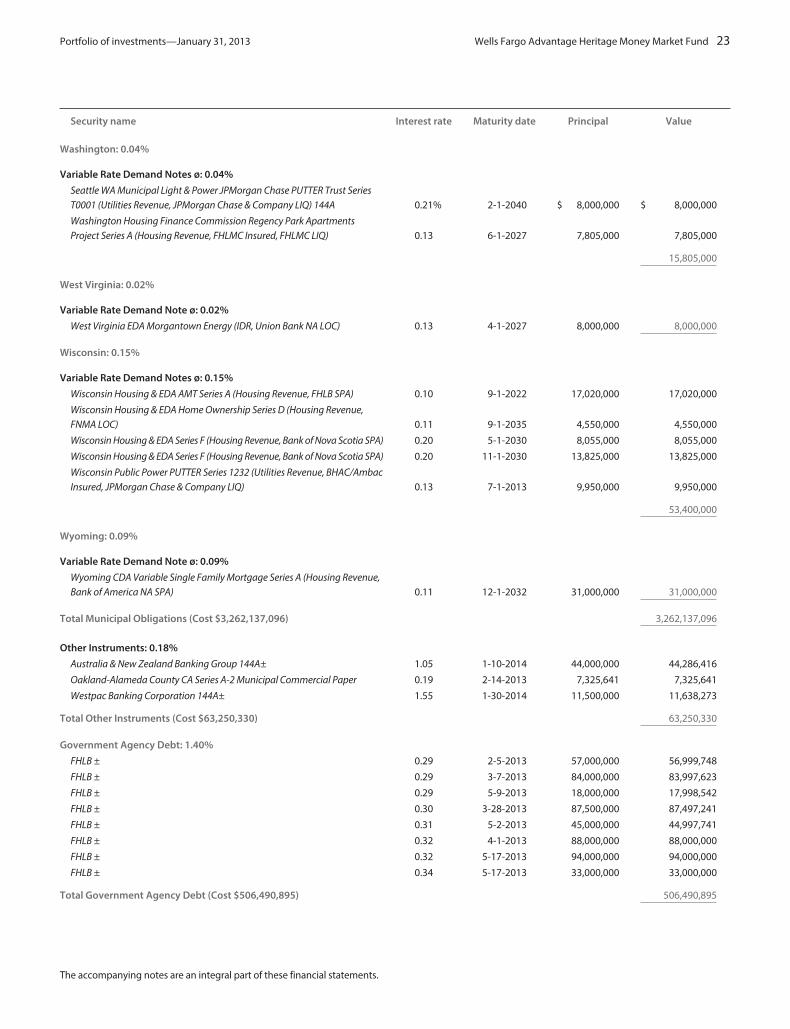
Portfolio of investments—January 31, 2013 Wells Fargo Advantage Heritage Money Market Fund 23
Security name Interest rate Maturity date Principal Value
Washington: 0.04%
Variable Rate Demand Notes ø: 0.04%
Seattle WA Municipal Light & Power JPMorgan Chase PUTTER Trust SeriesT0001 (Utilities Revenue, JPMorgan Chase & Company LIQ) 144A 0.21% 2-1-2040 $ 8,000,000 $ 8,000,000
Washington Housing Finance Commission Regency Park ApartmentsProject Series A (Housing Revenue, FHLMC Insured, FHLMC LIQ) 0.13 6-1-2027 7,805,000 7,805,000
15,805,000
West Virginia: 0.02%
Variable Rate Demand Note ø: 0.02%
West Virginia EDA Morgantown Energy (IDR, Union Bank NA LOC) 0.13 4-1-2027 8,000,000 8,000,000
Wisconsin: 0.15%
Variable Rate Demand Notes ø: 0.15%
Wisconsin Housing & EDA AMT Series A (Housing Revenue, FHLB SPA) 0.10 9-1-2022 17,020,000 17,020,000
Wisconsin Housing & EDA Home Ownership Series D (Housing Revenue,FNMA LOC) 0.11 9-1-2035 4,550,000 4,550,000
Wisconsin Housing & EDA Series F (Housing Revenue, Bank of Nova Scotia SPA) 0.20 5-1-2030 8,055,000 8,055,000
Wisconsin Housing & EDA Series F (Housing Revenue, Bank of Nova Scotia SPA) 0.20 11-1-2030 13,825,000 13,825,000
Wisconsin Public Power PUTTER Series 1232 (Utilities Revenue, BHAC/AmbacInsured, JPMorgan Chase & Company LIQ) 0.13 7-1-2013 9,950,000 9,950,000
53,400,000
Wyoming: 0.09%
Variable Rate Demand Note ø: 0.09%
Wyoming CDA Variable Single Family Mortgage Series A (Housing Revenue,Bank of America NA SPA) 0.11 12-1-2032 31,000,000 31,000,000
Total Municipal Obligations (Cost $3,262,137,096) 3,262,137,096
Other Instruments: 0.18%
Australia & New Zealand Banking Group 144A± 1.05 1-10-2014 44,000,000 44,286,416
Oakland-Alameda County CA Series A-2 Municipal Commercial Paper 0.19 2-14-2013 7,325,641 7,325,641
Westpac Banking Corporation 144A± 1.55 1-30-2014 11,500,000 11,638,273
Total Other Instruments (Cost $63,250,330) 63,250,330
Government Agency Debt: 1.40%
FHLB ± 0.29 2-5-2013 57,000,000 56,999,748
FHLB ± 0.29 3-7-2013 84,000,000 83,997,623
FHLB ± 0.29 5-9-2013 18,000,000 17,998,542
FHLB ± 0.30 3-28-2013 87,500,000 87,497,241
FHLB ± 0.31 5-2-2013 45,000,000 44,997,741
FHLB ± 0.32 4-1-2013 88,000,000 88,000,000
FHLB ± 0.32 5-17-2013 94,000,000 94,000,000
FHLB ± 0.34 5-17-2013 33,000,000 33,000,000
Total Government Agency Debt (Cost $506,490,895) 506,490,895
The accompanying notes are an integral part of these financial statements.

24 Wells Fargo Advantage Heritage Money Market Fund Portfolio of investments—January 31, 2013
Security name Interest rate Maturity date Principal Value
Other Notes: 1.06%
Corporate Bonds and Notes: 1.06%
JPMorgan Chase & Company ± 0.96% 2-26-2013 $ 72,297,000 $ 72,322,369
MetLife Institutional Funding 144A± 0.56 4-3-2013 100,000,000 100,055,120
Toyota Motor Credit Corporation ± 0.31 12-9-2013 110,000,000 110,000,000
Toyota Motor Credit Corporation ± 0.38 7-19-2013 102,000,000 102,000,000
Total Other Notes (Cost $384,377,489) 384,377,489
Repurchase Agreements ^^: 18.31%
Bank of Nova Scotia, dated 1-31-2013, maturity value $1,042,004,921 (1) 0.17 2-1-2013 1,042,000,000 1,042,000,000
Bank of Nova Scotia, dated 1-31-2013, maturity value $73,250,265 (2) 0.13 2-1-2013 73,250,000 73,250,000
Barclays Capital Incorporated, dated 1-31-2013, maturity value$1,390,006,564 (3) 0.17 2-1-2013 1,390,000,000 1,390,000,000
Barclays Capital Incorporated, dated 1-31-2013, maturity value$585,002,600 (4) 0.16 2-1-2013 585,000,000 585,000,000
Goldman Sachs & Company, dated 1-31-2013, maturity value $100,000,444 (5) 0.16 2-1-2013 100,000,000 100,000,000
Goldman Sachs & Company, dated 1-2-2013, maturity value$214,105,157 ( 6)±(i)§¢ 0.29 3-4-2013 214,000,000 214,000,000
Goldman Sachs & Company, dated 1-15-2013, maturity value$113,043,693 (7) ±(i)§¢ 0.29 3-4-2013 113,000,000 113,000,000
JPMorgan Securities, dated 1-10-2013, maturity value $235,034,401(8)± 0.24 2-1-2013 235,000,000 235,000,000
Merrill Pierce Fenner Smith Incorporated, dated 1-31-2013, maturity value$100,000,444 (9) 0.16 2-1-2013 100,000,000 100,000,000
Royal Bank of Canada Capital Markets, dated 1-31-2013, maturity value$950,004,222 (10) 0.16 2-1-2013 950,000,000 950,000,000
Societe Generale New York, dated 1-31-2013, maturity value$1,808,265,045 (11) 0.17 2-1-2013 1,808,256,506 1,808,256,506
Total Repurchase Agreements (Cost $6,610,506,506) 6,610,506,506
Treasury Debt: 0.61%
U.S. Treasury Bill (z) 0.15 4-11-2013 85,000,000 84,976,377
U.S. Treasury Bill (z) 0.14 2-21-2013 137,000,000 136,989,109
Total Treasury Debt (Cost $221,965,486) 221,965,486
Total investments in securities(Cost $36,320,247,190)* 100.58% 36,320,247,190
Other assets and liabilities, net (0.58) (209,904,259)
Total net assets 100.00% $36,110,342,931
The accompanying notes are an integral part of these financial statements.
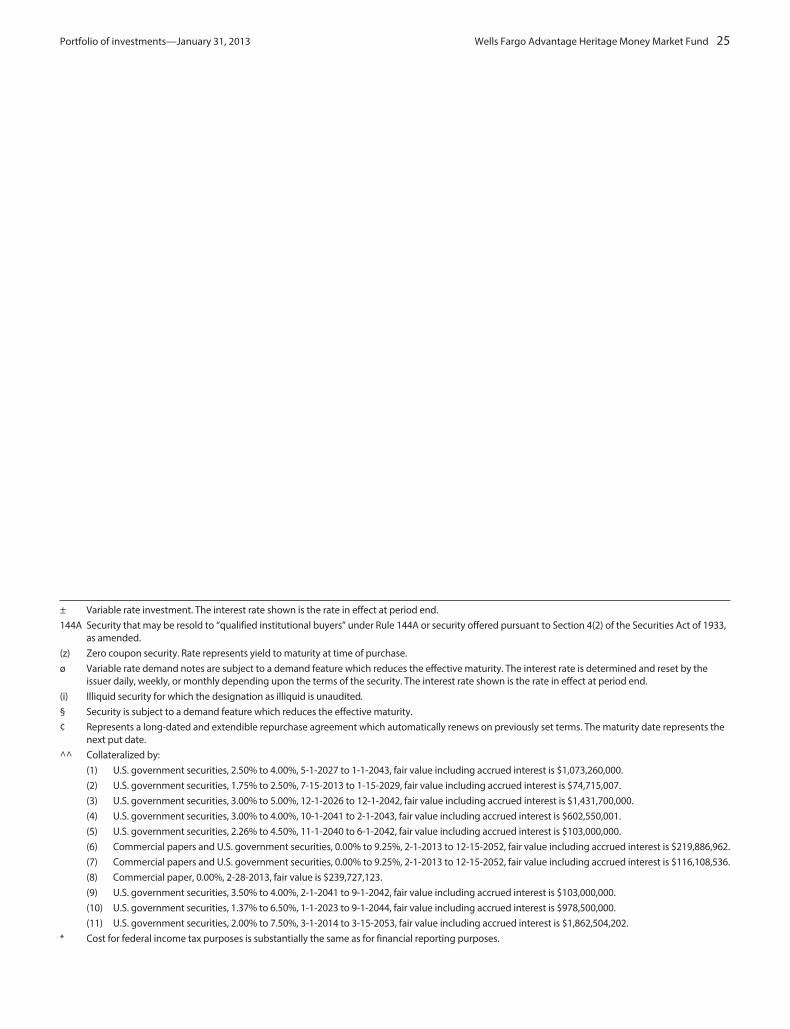
Portfolio of investments—January 31, 2013 Wells Fargo Advantage Heritage Money Market Fund 25
± Variable rate investment. The interest rate shown is the rate in effect at period end.
144A Security that may be resold to “qualified institutional buyers” under Rule 144A or security offered pursuant to Section 4(2) of the Securities Act of 1933,as amended.
(z) Zero coupon security. Rate represents yield to maturity at time of purchase.
ø Variable rate demand notes are subject to a demand feature which reduces the effective maturity. The interest rate is determined and reset by theissuer daily, weekly, or monthly depending upon the terms of the security. The interest rate shown is the rate in effect at period end.
(i) Illiquid security for which the designation as illiquid is unaudited.
§ Security is subject to a demand feature which reduces the effective maturity.
¢ Represents a long-dated and extendible repurchase agreement which automatically renews on previously set terms. The maturity date represents thenext put date.
^^ Collateralized by:
(1) U.S. government securities, 2.50% to 4.00%, 5-1-2027 to 1-1-2043, fair value including accrued interest is $1,073,260,000.
(2) U.S. government securities, 1.75% to 2.50%, 7-15-2013 to 1-15-2029, fair value including accrued interest is $74,715,007.
(3) U.S. government securities, 3.00% to 5.00%, 12-1-2026 to 12-1-2042, fair value including accrued interest is $1,431,700,000.
(4) U.S. government securities, 3.00% to 4.00%, 10-1-2041 to 2-1-2043, fair value including accrued interest is $602,550,001.
(5) U.S. government securities, 2.26% to 4.50%, 11-1-2040 to 6-1-2042, fair value including accrued interest is $103,000,000.
(6) Commercial papers and U.S. government securities, 0.00% to 9.25%, 2-1-2013 to 12-15-2052, fair value including accrued interest is $219,886,962.
(7) Commercial papers and U.S. government securities, 0.00% to 9.25%, 2-1-2013 to 12-15-2052, fair value including accrued interest is $116,108,536.
(8) Commercial paper, 0.00%, 2-28-2013, fair value is $239,727,123.
(9) U.S. government securities, 3.50% to 4.00%, 2-1-2041 to 9-1-2042, fair value including accrued interest is $103,000,000.
(10) U.S. government securities, 1.37% to 6.50%, 1-1-2023 to 9-1-2044, fair value including accrued interest is $978,500,000.
(11) U.S. government securities, 2.00% to 7.50%, 3-1-2014 to 3-15-2053, fair value including accrued interest is $1,862,504,202.
* Cost for federal income tax purposes is substantially the same as for financial reporting purposes.
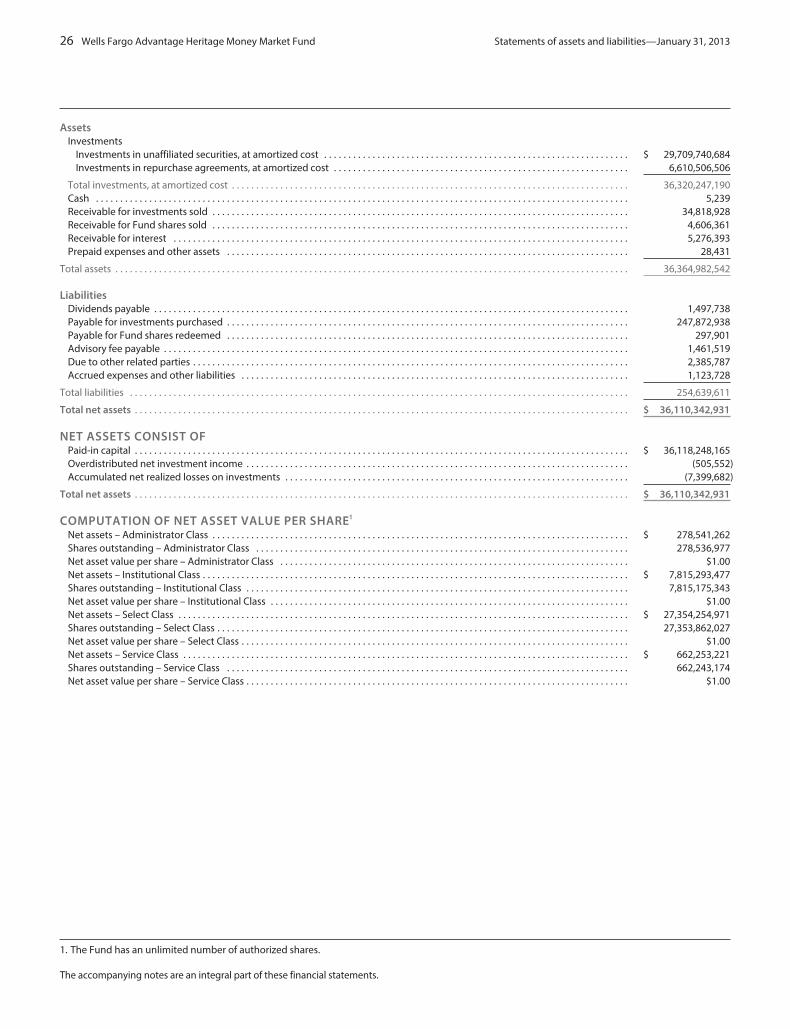
26 Wells Fargo Advantage Heritage Money Market Fund Statements of assets and liabilities—January 31, 2013
AssetsInvestments
Investments in unaffiliated securities, at amortized cost . . . . . . . . . . . . . . . . . . . . . . . . . . . . . . . . . . . . . . . . . . . . . . . . . . . . . . . . . . . . . . . $ 29,709,740,684Investments in repurchase agreements, at amortized cost . . . . . . . . . . . . . . . . . . . . . . . . . . . . . . . . . . . . . . . . . . . . . . . . . . . . . . . . . . . . . 6,610,506,506
Total investments, at amortized cost . . . . . . . . . . . . . . . . . . . . . . . . . . . . . . . . . . . . . . . . . . . . . . . . . . . . . . . . . . . . . . . . . . . . . . . . . . . . . . . . . . 36,320,247,190Cash . . . . . . . . . . . . . . . . . . . . . . . . . . . . . . . . . . . . . . . . . . . . . . . . . . . . . . . . . . . . . . . . . . . . . . . . . . . . . . . . . . . . . . . . . . . . . . . . . . . . . . . . . . . . . . 5,239Receivable for investments sold . . . . . . . . . . . . . . . . . . . . . . . . . . . . . . . . . . . . . . . . . . . . . . . . . . . . . . . . . . . . . . . . . . . . . . . . . . . . . . . . . . . . . . 34,818,928Receivable for Fund shares sold . . . . . . . . . . . . . . . . . . . . . . . . . . . . . . . . . . . . . . . . . . . . . . . . . . . . . . . . . . . . . . . . . . . . . . . . . . . . . . . . . . . . . . 4,606,361Receivable for interest . . . . . . . . . . . . . . . . . . . . . . . . . . . . . . . . . . . . . . . . . . . . . . . . . . . . . . . . . . . . . . . . . . . . . . . . . . . . . . . . . . . . . . . . . . . . . . 5,276,393Prepaid expenses and other assets . . . . . . . . . . . . . . . . . . . . . . . . . . . . . . . . . . . . . . . . . . . . . . . . . . . . . . . . . . . . . . . . . . . . . . . . . . . . . . . . . . . 28,431
Total assets . . . . . . . . . . . . . . . . . . . . . . . . . . . . . . . . . . . . . . . . . . . . . . . . . . . . . . . . . . . . . . . . . . . . . . . . . . . . . . . . . . . . . . . . . . . . . . . . . . . . . . . . . . 36,364,982,542
LiabilitiesDividends payable . . . . . . . . . . . . . . . . . . . . . . . . . . . . . . . . . . . . . . . . . . . . . . . . . . . . . . . . . . . . . . . . . . . . . . . . . . . . . . . . . . . . . . . . . . . . . . . . . . 1,497,738Payable for investments purchased . . . . . . . . . . . . . . . . . . . . . . . . . . . . . . . . . . . . . . . . . . . . . . . . . . . . . . . . . . . . . . . . . . . . . . . . . . . . . . . . . . . 247,872,938Payable for Fund shares redeemed . . . . . . . . . . . . . . . . . . . . . . . . . . . . . . . . . . . . . . . . . . . . . . . . . . . . . . . . . . . . . . . . . . . . . . . . . . . . . . . . . . . 297,901Advisory fee payable . . . . . . . . . . . . . . . . . . . . . . . . . . . . . . . . . . . . . . . . . . . . . . . . . . . . . . . . . . . . . . . . . . . . . . . . . . . . . . . . . . . . . . . . . . . . . . . . 1,461,519Due to other related parties . . . . . . . . . . . . . . . . . . . . . . . . . . . . . . . . . . . . . . . . . . . . . . . . . . . . . . . . . . . . . . . . . . . . . . . . . . . . . . . . . . . . . . . . . . 2,385,787Accrued expenses and other liabilities . . . . . . . . . . . . . . . . . . . . . . . . . . . . . . . . . . . . . . . . . . . . . . . . . . . . . . . . . . . . . . . . . . . . . . . . . . . . . . . . 1,123,728
Total liabilities . . . . . . . . . . . . . . . . . . . . . . . . . . . . . . . . . . . . . . . . . . . . . . . . . . . . . . . . . . . . . . . . . . . . . . . . . . . . . . . . . . . . . . . . . . . . . . . . . . . . . . . 254,639,611
Total net assets . . . . . . . . . . . . . . . . . . . . . . . . . . . . . . . . . . . . . . . . . . . . . . . . . . . . . . . . . . . . . . . . . . . . . . . . . . . . . . . . . . . . . . . . . . . . . . . . . . . . . . $ 36,110,342,931
NET ASSETS CONSIST OFPaid-in capital . . . . . . . . . . . . . . . . . . . . . . . . . . . . . . . . . . . . . . . . . . . . . . . . . . . . . . . . . . . . . . . . . . . . . . . . . . . . . . . . . . . . . . . . . . . . . . . . . . . . . . $ 36,118,248,165Overdistributed net investment income . . . . . . . . . . . . . . . . . . . . . . . . . . . . . . . . . . . . . . . . . . . . . . . . . . . . . . . . . . . . . . . . . . . . . . . . . . . . . . . (505,552)Accumulated net realized losses on investments . . . . . . . . . . . . . . . . . . . . . . . . . . . . . . . . . . . . . . . . . . . . . . . . . . . . . . . . . . . . . . . . . . . . . . . (7,399,682)
Total net assets . . . . . . . . . . . . . . . . . . . . . . . . . . . . . . . . . . . . . . . . . . . . . . . . . . . . . . . . . . . . . . . . . . . . . . . . . . . . . . . . . . . . . . . . . . . . . . . . . . . . . . $ 36,110,342,931
COMPUTATION OF NET ASSET VALUE PER SHARE1
Net assets – Administrator Class . . . . . . . . . . . . . . . . . . . . . . . . . . . . . . . . . . . . . . . . . . . . . . . . . . . . . . . . . . . . . . . . . . . . . . . . . . . . . . . . . . . . . . $ 278,541,262Shares outstanding – Administrator Class . . . . . . . . . . . . . . . . . . . . . . . . . . . . . . . . . . . . . . . . . . . . . . . . . . . . . . . . . . . . . . . . . . . . . . . . . . . . . 278,536,977Net asset value per share – Administrator Class . . . . . . . . . . . . . . . . . . . . . . . . . . . . . . . . . . . . . . . . . . . . . . . . . . . . . . . . . . . . . . . . . . . . . . . . $1.00Net assets – Institutional Class . . . . . . . . . . . . . . . . . . . . . . . . . . . . . . . . . . . . . . . . . . . . . . . . . . . . . . . . . . . . . . . . . . . . . . . . . . . . . . . . . . . . . . . . $ 7,815,293,477Shares outstanding – Institutional Class . . . . . . . . . . . . . . . . . . . . . . . . . . . . . . . . . . . . . . . . . . . . . . . . . . . . . . . . . . . . . . . . . . . . . . . . . . . . . . . 7,815,175,343Net asset value per share – Institutional Class . . . . . . . . . . . . . . . . . . . . . . . . . . . . . . . . . . . . . . . . . . . . . . . . . . . . . . . . . . . . . . . . . . . . . . . . . . $1.00Net assets – Select Class . . . . . . . . . . . . . . . . . . . . . . . . . . . . . . . . . . . . . . . . . . . . . . . . . . . . . . . . . . . . . . . . . . . . . . . . . . . . . . . . . . . . . . . . . . . . . $ 27,354,254,971Shares outstanding – Select Class . . . . . . . . . . . . . . . . . . . . . . . . . . . . . . . . . . . . . . . . . . . . . . . . . . . . . . . . . . . . . . . . . . . . . . . . . . . . . . . . . . . . . 27,353,862,027Net asset value per share – Select Class . . . . . . . . . . . . . . . . . . . . . . . . . . . . . . . . . . . . . . . . . . . . . . . . . . . . . . . . . . . . . . . . . . . . . . . . . . . . . . . . $1.00Net assets – Service Class . . . . . . . . . . . . . . . . . . . . . . . . . . . . . . . . . . . . . . . . . . . . . . . . . . . . . . . . . . . . . . . . . . . . . . . . . . . . . . . . . . . . . . . . . . . . $ 662,253,221Shares outstanding – Service Class . . . . . . . . . . . . . . . . . . . . . . . . . . . . . . . . . . . . . . . . . . . . . . . . . . . . . . . . . . . . . . . . . . . . . . . . . . . . . . . . . . . 662,243,174Net asset value per share – Service Class . . . . . . . . . . . . . . . . . . . . . . . . . . . . . . . . . . . . . . . . . . . . . . . . . . . . . . . . . . . . . . . . . . . . . . . . . . . . . . . $1.00
1. The Fund has an unlimited number of authorized shares.
The accompanying notes are an integral part of these financial statements.

Statements of operations—year ended January 31, 2013 Wells Fargo Advantage Heritage Money Market Fund 27
Investment incomeInterest . . . . . . . . . . . . . . . . . . . . . . . . . . . . . . . . . . . . . . . . . . . . . . . . . . . . . . . . . . . . . . . . . . . . . . . . . . . . . . . . . . . . . . . . . . . . . . . . . . . . . . . . . . . . . . . . $ 67,099,242
ExpensesAdvisory fee . . . . . . . . . . . . . . . . . . . . . . . . . . . . . . . . . . . . . . . . . . . . . . . . . . . . . . . . . . . . . . . . . . . . . . . . . . . . . . . . . . . . . . . . . . . . . . . . . . . . . . . . . . . . 26,653,473Administration fees
Fund level . . . . . . . . . . . . . . . . . . . . . . . . . . . . . . . . . . . . . . . . . . . . . . . . . . . . . . . . . . . . . . . . . . . . . . . . . . . . . . . . . . . . . . . . . . . . . . . . . . . . . . . . . . . . 9,496,042Administrator Class . . . . . . . . . . . . . . . . . . . . . . . . . . . . . . . . . . . . . . . . . . . . . . . . . . . . . . . . . . . . . . . . . . . . . . . . . . . . . . . . . . . . . . . . . . . . . . . . . . . . 324,910Institutional Class . . . . . . . . . . . . . . . . . . . . . . . . . . . . . . . . . . . . . . . . . . . . . . . . . . . . . . . . . . . . . . . . . . . . . . . . . . . . . . . . . . . . . . . . . . . . . . . . . . . . . . 6,957,082Select Class . . . . . . . . . . . . . . . . . . . . . . . . . . . . . . . . . . . . . . . . . . . . . . . . . . . . . . . . . . . . . . . . . . . . . . . . . . . . . . . . . . . . . . . . . . . . . . . . . . . . . . . . . . . 6,727,526Service Class . . . . . . . . . . . . . . . . . . . . . . . . . . . . . . . . . . . . . . . . . . . . . . . . . . . . . . . . . . . . . . . . . . . . . . . . . . . . . . . . . . . . . . . . . . . . . . . . . . . . . . . . . . 976,310
Shareholder servicing feesAdministrator Class . . . . . . . . . . . . . . . . . . . . . . . . . . . . . . . . . . . . . . . . . . . . . . . . . . . . . . . . . . . . . . . . . . . . . . . . . . . . . . . . . . . . . . . . . . . . . . . . . . . . 324,910Service Class . . . . . . . . . . . . . . . . . . . . . . . . . . . . . . . . . . . . . . . . . . . . . . . . . . . . . . . . . . . . . . . . . . . . . . . . . . . . . . . . . . . . . . . . . . . . . . . . . . . . . . . . . . 1,976,075
Custody and accounting fees . . . . . . . . . . . . . . . . . . . . . . . . . . . . . . . . . . . . . . . . . . . . . . . . . . . . . . . . . . . . . . . . . . . . . . . . . . . . . . . . . . . . . . . . . . . . . 1,141,251Professional fees . . . . . . . . . . . . . . . . . . . . . . . . . . . . . . . . . . . . . . . . . . . . . . . . . . . . . . . . . . . . . . . . . . . . . . . . . . . . . . . . . . . . . . . . . . . . . . . . . . . . . . . . 50,316Registration fees . . . . . . . . . . . . . . . . . . . . . . . . . . . . . . . . . . . . . . . . . . . . . . . . . . . . . . . . . . . . . . . . . . . . . . . . . . . . . . . . . . . . . . . . . . . . . . . . . . . . . . . . 92,847Shareholder report expenses . . . . . . . . . . . . . . . . . . . . . . . . . . . . . . . . . . . . . . . . . . . . . . . . . . . . . . . . . . . . . . . . . . . . . . . . . . . . . . . . . . . . . . . . . . . . . 60,170Trustees’ fees and expenses . . . . . . . . . . . . . . . . . . . . . . . . . . . . . . . . . . . . . . . . . . . . . . . . . . . . . . . . . . . . . . . . . . . . . . . . . . . . . . . . . . . . . . . . . . . . . . 12,059Other fees and expenses . . . . . . . . . . . . . . . . . . . . . . . . . . . . . . . . . . . . . . . . . . . . . . . . . . . . . . . . . . . . . . . . . . . . . . . . . . . . . . . . . . . . . . . . . . . . . . . . . 251,420
Total expenses . . . . . . . . . . . . . . . . . . . . . . . . . . . . . . . . . . . . . . . . . . . . . . . . . . . . . . . . . . . . . . . . . . . . . . . . . . . . . . . . . . . . . . . . . . . . . . . . . . . . . . . . . . . 55,044,391Less: Fee waivers and/or expense reimbursements . . . . . . . . . . . . . . . . . . . . . . . . . . . . . . . . . . . . . . . . . . . . . . . . . . . . . . . . . . . . . . . . . . . . . . . . . . (13,168,955)
Net expenses . . . . . . . . . . . . . . . . . . . . . . . . . . . . . . . . . . . . . . . . . . . . . . . . . . . . . . . . . . . . . . . . . . . . . . . . . . . . . . . . . . . . . . . . . . . . . . . . . . . . . . . . . . . . . 41,875,436
Net investment income . . . . . . . . . . . . . . . . . . . . . . . . . . . . . . . . . . . . . . . . . . . . . . . . . . . . . . . . . . . . . . . . . . . . . . . . . . . . . . . . . . . . . . . . . . . . . . . . . . . . 25,223,806
Net realized gains on investments . . . . . . . . . . . . . . . . . . . . . . . . . . . . . . . . . . . . . . . . . . . . . . . . . . . . . . . . . . . . . . . . . . . . . . . . . . . . . . . . . . . . . . . . . . 1,306,659
Net increase in net assets resulting from operations . . . . . . . . . . . . . . . . . . . . . . . . . . . . . . . . . . . . . . . . . . . . . . . . . . . . . . . . . . . . . . . . . . . . . . . . $ 26,530,465
The accompanying notes are an integral part of these financial statements.

28 Wells Fargo Advantage Heritage Money Market Fund Statements of changes in net assets
Year endedJanuary 31, 2013
Year endedJanuary 31, 2012
OperationsNet investment income . . . . . . . . . . . . . . . . . . . . . . . . . . . . . . . $ 25,223,806 $ 38,122,997Net realized gains on investments . . . . . . . . . . . . . . . . . . . . . 1,306,659 560,750
Net increase in net assets resulting from operations . . . . . . . 26,530,465 38,683,747
Distributions to shareholders fromNet investment income
Administrator Class . . . . . . . . . . . . . . . . . . . . . . . . . . . . . . . . . (32,577) (60,427)Institutional Class . . . . . . . . . . . . . . . . . . . . . . . . . . . . . . . . . . (4,337,852) (7,283,767)Select Class . . . . . . . . . . . . . . . . . . . . . . . . . . . . . . . . . . . . . . . . (20,758,334) (30,671,556)Service Class . . . . . . . . . . . . . . . . . . . . . . . . . . . . . . . . . . . . . . . (81,585) (107,247)
Net realized gainsAdministrator Class . . . . . . . . . . . . . . . . . . . . . . . . . . . . . . . . . 0 (1,107)Institutional Class . . . . . . . . . . . . . . . . . . . . . . . . . . . . . . . . . . 0 (39,864)Select Class . . . . . . . . . . . . . . . . . . . . . . . . . . . . . . . . . . . . . . . . 0 (57,745)Service Class . . . . . . . . . . . . . . . . . . . . . . . . . . . . . . . . . . . . . . . 0 (2,536)
Total distributions to shareholders . . . . . . . . . . . . . . . . . . . . . . (25,210,348) (38,224,249)
Shares Shares
Capital share transactionsProceeds from shares sold
Administrator Class . . . . . . . . . . . . . . . . . . . . . . . . . . . . . . . . . 989,827,889 989,827,889 1,729,301,118 1,729,301,118Institutional Class . . . . . . . . . . . . . . . . . . . . . . . . . . . . . . . . . . 48,965,708,419 48,965,708,419 79,868,865,049 79,868,865,049Select Class . . . . . . . . . . . . . . . . . . . . . . . . . . . . . . . . . . . . . . . . 132,226,851,581 132,226,851,581 181,368,899,601 181,368,899,601Service Class . . . . . . . . . . . . . . . . . . . . . . . . . . . . . . . . . . . . . . . 3,247,868,458 3,247,868,458 4,705,951,971 4,705,951,971
185,430,256,347 267,673,017,739
Reinvestment of distributionsAdministrator Class . . . . . . . . . . . . . . . . . . . . . . . . . . . . . . . . . 15,633 15,633 24,310 24,310Institutional Class . . . . . . . . . . . . . . . . . . . . . . . . . . . . . . . . . . 1,072,541 1,072,541 1,705,105 1,705,105Select Class . . . . . . . . . . . . . . . . . . . . . . . . . . . . . . . . . . . . . . . . 8,753,419 8,753,419 16,489,304 16,489,304Service Class . . . . . . . . . . . . . . . . . . . . . . . . . . . . . . . . . . . . . . . 16,749 16,749 21,546 21,546
9,858,342 18,240,265
Payment for shares redeemedAdministrator Class . . . . . . . . . . . . . . . . . . . . . . . . . . . . . . . . . (1,085,698,056) (1,085,698,056) (2,049,786,165) (2,049,786,165)Institutional Class . . . . . . . . . . . . . . . . . . . . . . . . . . . . . . . . . . (52,241,433,917) (52,241,433,917) (83,725,804,748) (83,725,804,748)Select Class . . . . . . . . . . . . . . . . . . . . . . . . . . . . . . . . . . . . . . . . (120,235,972,167) (120,235,972,167) (192,662,513,528) (192,662,513,528)Service Class . . . . . . . . . . . . . . . . . . . . . . . . . . . . . . . . . . . . . . . (3,579,004,917) (3,579,004,917) (4,944,176,567) (4,944,176,567)
(177,142,109,057) (283,382,281,008)
Net increase (decrease) in net assets resulting from capitalshare transactions . . . . . . . . . . . . . . . . . . . . . . . . . . . . . . . . . . . 8,298,005,632 (15,691,023,004)
Total increase (decrease) in net assets . . . . . . . . . . . . . . . . . . . . 8,299,325,749 (15,690,563,506)
Net assetsBeginning of period . . . . . . . . . . . . . . . . . . . . . . . . . . . . . . . . . . . 27,811,017,182 43,501,580,688
End of period . . . . . . . . . . . . . . . . . . . . . . . . . . . . . . . . . . . . . . . . . $ 36,110,342,931 $ 27,811,017,182
Overdistributed net investment income . . . . . . . . . . . . . . . . $ (505,552) $ (519,010)
The accompanying notes are an integral part of these financial statements.

Financial highlights Wells Fargo Advantage Heritage Money Market Fund 29
Year ended January 31 Year ended February 28
ADMINISTRATOR CLASS 2013 2012 20111 2010 2009 20082
Net asset value, beginning of period $1.00 $1.00 $1.00 $1.00 $1.00 $1.00
Net investment income 0.003 0.003 0.003 0.003 0.02 0.05Net realized gains on investments 0.003 0.003 0.003 0.003 0.00 0.00
Total from investment operations 0.003 0.003 0.003 0.003 0.02 0.05
Distributions to shareholders fromNet investment income (0.00)3 (0.00)3 (0.00)3 (0.00)3 (0.02) (0.05)Net realized gains 0.00 (0.00)3 (0.00)3 (0.00)3 (0.00)3 0.00
Total distributions to shareholders (0.00)3 (0.00)3 (0.00)3 (0.00)3 (0.02) (0.05)
Net asset value, end of period $1.00 $1.00 $1.00 $1.00 $1.00 $1.00
Total return4 0.01% 0.01% 0.03% 0.21% 2.19% 4.90%
Ratios to average net assets (annualized)Gross expenses 0.34% 0.34% 0.34% 0.37% 0.38% 0.38%Net expenses 0.24% 0.24% 0.31% 0.33% 0.34% 0.34%Net investment income 0.01% 0.01% 0.03% 0.17% 2.09% 4.68%
Supplemental dataNet assets, end of period (000s omitted) $278,541 $374,371 $694,823 $1,201,158 $918,595 $608,865
1. For the eleven months ended January 31, 2011. The Fund changed its fiscal year end from February 28 to January 31, effective January 31, 2011.
2. Year ended February 29
3. Amount is less than $0.005.
4. Returns for periods of less than one year are not annualized.
The accompanying notes are an integral part of these financial statements.

30 Wells Fargo Advantage Heritage Money Market Fund Financial highlights
Year ended January 31 Year ended February 28
INSTITUTIONAL CLASS 2013 2012 20111 2010 2009 20082
Net asset value, beginning of period $1.00 $1.00 $1.00 $1.00 $1.00 $1.00
Net investment income 0.003 0.003 0.003 0.003 0.02 0.05Net realized gains on investments 0.003 0.003 0.003 0.003 0.00 0.00
Total from investment operations 0.003 0.003 0.003 0.003 0.02 0.05
Distributions to shareholders fromNet investment income (0.00)3 (0.00)3 (0.00)3 (0.00)3 (0.02) (0.05)Net realized gains 0.00 (0.00)3 (0.00)3 (0.00)3 (0.00)3 0.00
Total distributions to shareholders (0.00)3 (0.00)3 (0.00)3 (0.00)3 (0.02) (0.05)
Net asset value, end of period $1.00 $1.00 $1.00 $1.00 $1.00 $1.00
Total return4 0.05% 0.05% 0.13% 0.33% 2.32% 5.06%
Ratios to average net assets (annualized)Gross expenses 0.22% 0.22% 0.22% 0.25% 0.27% 0.26%Net expenses 0.20% 0.20% 0.20% 0.21% 0.22% 0.20%Net investment income 0.05% 0.05% 0.14% 0.31% 2.09% 4.77%
Supplemental dataNet assets, end of period (000s omitted) $7,815,293 $11,089,557 $14,944,657 $7,795,659 $5,862,075 $1,579,225
1. For the eleven months ended January 31, 2011. The Fund changed its fiscal year end from February 28 to January 31, effective January 31, 2011.
2. Year ended February 29
3. Amount is less than $0.005.
4. Returns for periods of less than one year are not annualized.
The accompanying notes are an integral part of these financial statements.
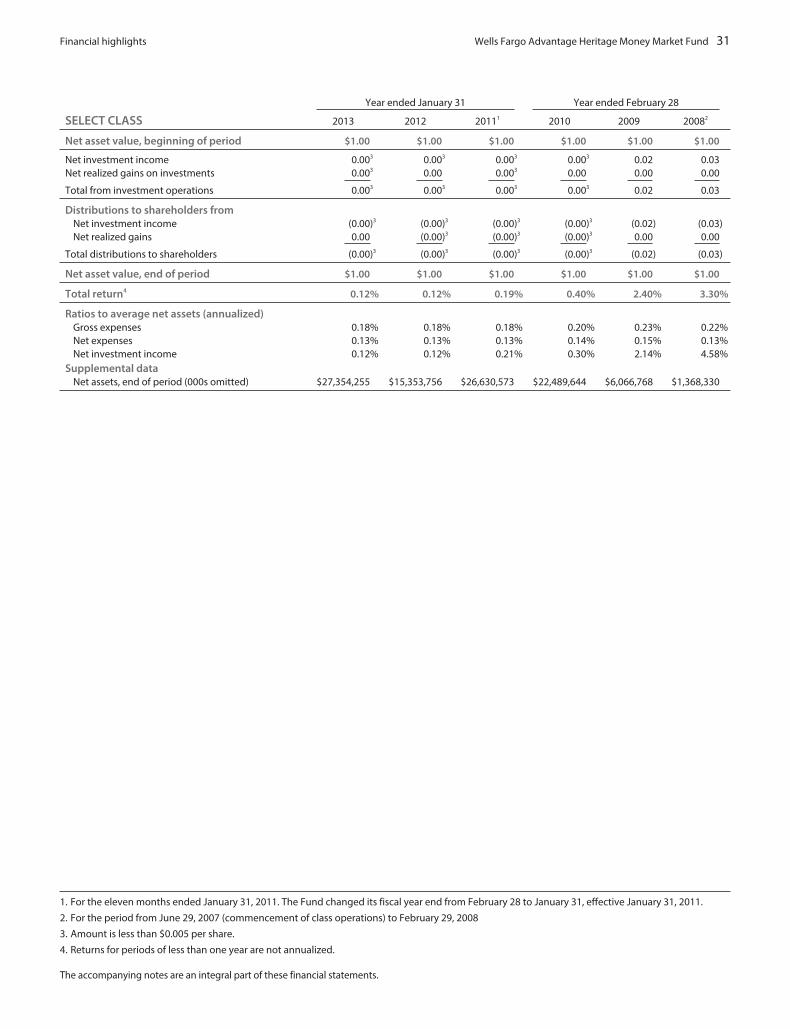
Financial highlights Wells Fargo Advantage Heritage Money Market Fund 31
Year ended January 31 Year ended February 28
SELECT CLASS 2013 2012 20111 2010 2009 20082
Net asset value, beginning of period $1.00 $1.00 $1.00 $1.00 $1.00 $1.00
Net investment income 0.003 0.003 0.003 0.003 0.02 0.03Net realized gains on investments 0.003 0.00 0.003 0.00 0.00 0.00
Total from investment operations 0.003 0.003 0.003 0.003 0.02 0.03
Distributions to shareholders fromNet investment income (0.00)3 (0.00)3 (0.00)3 (0.00)3 (0.02) (0.03)Net realized gains 0.00 (0.00)3 (0.00)3 (0.00)3 0.00 0.00
Total distributions to shareholders (0.00)3 (0.00)3 (0.00)3 (0.00)3 (0.02) (0.03)
Net asset value, end of period $1.00 $1.00 $1.00 $1.00 $1.00 $1.00
Total return4 0.12% 0.12% 0.19% 0.40% 2.40% 3.30%
Ratios to average net assets (annualized)Gross expenses 0.18% 0.18% 0.18% 0.20% 0.23% 0.22%Net expenses 0.13% 0.13% 0.13% 0.14% 0.15% 0.13%Net investment income 0.12% 0.12% 0.21% 0.30% 2.14% 4.58%
Supplemental dataNet assets, end of period (000s omitted) $27,354,255 $15,353,756 $26,630,573 $22,489,644 $6,066,768 $1,368,330
1. For the eleven months ended January 31, 2011. The Fund changed its fiscal year end from February 28 to January 31, effective January 31, 2011.
2. For the period from June 29, 2007 (commencement of class operations) to February 29, 2008
3. Amount is less than $0.005 per share.
4. Returns for periods of less than one year are not annualized.
The accompanying notes are an integral part of these financial statements.

32 Wells Fargo Advantage Heritage Money Market Fund Financial highlights
Year ended January 31
SERVICE CLASS 2013 2012 20111
Net asset value, beginning of period $1.00 $ 1.00 $ 1.00
Net investment income 0.002 0.002 0.002
Net realized gains on investments 0.002 0.002 0.002
Total from investment operations 0.002 0.002 0.002
Distributions to shareholders fromNet investment income (0.00)2 (0.00)2 (0.00)2
Net realized gains 0.00 (0.00)2 (0.00)2
Total distributions to shareholders (0.00)2 (0.00)2 (0.00) 2
Net asset value, end of period $1.00 $ 1.00 $ 1.00
Total return3 0.01% 0.01% 0.01%
Ratios to average net assets (annualized)Gross expenses 0.50% 0.51% 0.51%Net expenses 0.24% 0.24% 0.34%Net investment income 0.01% 0.01% 0.01%
Supplemental dataNet assets, end of period (000s omitted) $662,253 $993,333 $1,231,527
1. For the period from June 30, 2010 (commencement of class operations) to January 31, 2011
2. Amount is less than $0.005.
3. Returns for periods of less than one year are not annualized.
The accompanying notes are an integral part of these financial statements.

Notes to financial statements Wells Fargo Advantage Heritage Money Market Fund 33
1. ORGANIZATIONWells Fargo Funds Trust (the “Trust”), a Delaware statutory trust organized on March 10, 1999, is an open-end managementinvestment company registered under the Investment Company Act of 1940, as amended (the “1940 Act”). These financialstatements report on Wells Fargo Advantage Heritage Money Market Fund (the “Fund”) which is a diversified series of the Trust.
2. SIGNIFICANT ACCOUNTING POLICIESThe following significant accounting policies, which are consistently followed in the preparation of the financialstatements of the Fund, are in conformity with U.S. generally accepted accounting principles which require managementto make estimates and assumptions that affect the reported amounts of assets and liabilities, disclosure of contingentassets and liabilities at the date of the financial statements, and the reported amounts of revenues and expenses duringthe reporting period. Actual results could differ from those estimates.
Securities valuationAs permitted under Rule 2a-7 of the 1940 Act, portfolio securities are valued at amortized cost, which approximates fairvalue. The amortized cost method involves valuing a security at its cost, plus accretion of discount or minus amortizationof premium over the period until maturity.
Investments which are not valued using the method discussed above are valued at their fair value, as determined byprocedures established in good faith and approved by the Board of Trustees. The Board of Trustees has established aValuation Committee comprised of the Trustees and has delegated to it the authority to take any actions regarding thevaluation of portfolio securities that the Valuation Committee deems necessary or appropriate, including determining thefair value of portfolio securities, unless the determination has been delegated to the Management Valuation Team ofWells Fargo Funds Management, LLC (“Funds Management”). The Board of Trustees retains the authority to make or ratifyany valuation decisions or approve any changes to the Valuation Procedures as it deems appropriate. On a quarterlybasis, the Board of Trustees receives reports on any valuation actions taken by the Valuation Committee or theManagement Valuation Team which may include items for ratification.
Valuations of fair valued securities are compared to the next actual sales price when available, or other appropriatemarket information to assess the continued appropriateness of the fair valuation methodology used. These securities arefair valued on a day-to-day basis, taking into consideration changes to appropriate market information and anysignificant changes to the input factors considered in the valuation process until there is a readily available priceprovided on the exchange or by an independent pricing service. Valuations received from an independent pricing serviceor broker quotes are periodically validated by comparisons to most recent trades and valuations provided by otherindependent pricing services in addition to the review of prices by the adviser and/or subadviser. Unobservable inputsused in determining fair valuations are identified based on the type of security, taking into consideration factors utilizedby market participants in valuing the investment, knowledge about the issuer and the current market environment.
Repurchase agreementsThe Fund may invest in repurchase agreements and may participate in pooled repurchase agreement transactions withother funds advised by Funds Management. The repurchase agreements must be fully collateralized based on values thatare marked-to- market daily. The collateral may be held by an agent bank under a tri-party agreement. It is the custodian’sresponsibility to value collateral daily and to take action to obtain additional collateral as necessary to maintain marketvalue equal to or greater than the resale price. The repurchase agreements are collateralized by instruments such as U.S.Treasury, federal agency, or high-grade corporate obligations. There could be potential loss to the Fund in the event thatthe Fund is delayed or prevented from exercising its rights to dispose of the collateral, including the risk of a possibledecline in the value of the underlying obligations during the period in which the Fund seeks to assert its rights.
Security transactions and income recognitionSecurities transactions are recorded on a trade date basis. Realized gains or losses are recorded on the basis of identified cost.
Interest income is accrued daily and bond discounts are accreted and premiums are amortized daily based on theeffective interest method. To the extent debt obligations are placed on non-accrual status, any related interest incomemay be reduced by writing off interest receivables when the collection of all or a portion of interest has become doubtfulbased on consistently applied procedures. If the issuer subsequently resumes interest payments or when thecollectability of interest is reasonably assured, the debt obligation is removed from non-accrual status.
Distributions to shareholdersDistributions to shareholders from net investment income are accrued daily and paid monthly. Distributions from netrealized gains, if any, are recorded on the ex-dividend date. Such distributions are determined in conformity with federalincome tax regulations, which may differ in amount or character from net investment income and realized gainsrecognized for purposes of U.S. generally accepted accounting principles.

34 Wells Fargo Advantage Heritage Money Market Fund Notes to financial statements
Federal and other taxesThe Fund intends to continue to qualify as a regulated investment company by distributing substantially all of its investmentcompany taxable income and any net realized capital gains (after reduction for capital loss carryforwards) sufficient torelieve it from all, or substantially all, federal income taxes. Accordingly, no provision for federal income taxes was required.
The Fund’s income and federal excise tax returns and all financial records supporting those returns for the prior threefiscal years are subject to examination by the federal and Delaware revenue authorities. Management has analyzed theFund’s tax positions taken on federal, state, and foreign tax returns for all open tax years and does not believe that thereare any uncertain tax positions that require recognition of a tax liability.
As of January 31, 2013, the Fund had pre-enactment capital loss carryforwards incurred in taxable years beginning beforeDecember 22, 2010, which are available to offset future net realized capital gains, in the amount of $7,399,682 expiringin 2017.
Class allocationsThe separate classes of shares offered by the Fund differ principally in shareholder servicing and administration fees.Shareholders of each class bear certain expenses that pertain to that particular class. All shareholders bear the commonexpenses of the Fund, earn income from the portfolio, and are allocated any unrealized gains and losses pro rata basedon the average daily net assets of each class, without distinction between share classes. Dividends are determinedseparately for each class based on income and expenses allocable to each class. Realized gains and losses are allocated toeach class pro rata based upon the net assets of each class on the date realized. Differences in per share dividend ratesgenerally result from the relative weightings of pro rata income and realized gain allocations and from differences inseparate class expenses, including shareholder servicing and administration fees.
3. FAIR VALUATION MEASUREMENTSFair value measurements of investments are determined within a framework that has established a fair value hierarchybased upon the various data inputs utilized in determining the value of the Fund’s investments. The three-levelhierarchy gives the highest priority to unadjusted quoted prices in active markets for identical assets or liabilities(Level 1) and the lowest priority to significant unobservable inputs (Level 3). The Fund’s investments are classifiedwithin the fair value hierarchy based on the lowest level of input that is significant to the fair value measurement. Theinputs are summarized into three broad levels as follows:
▪ Level 1 – quoted prices in active markets for identical securities
▪ Level 2 – other significant observable inputs (including quoted prices for similar securities, interest rates, prepaymentspeeds, credit risk, use of amortized cost, etc.)
▪ Level 3 – significant unobservable inputs (including the Fund’s own assumptions in determining the fair value of investments)
The inputs or methodologies used for valuing investments in securities are not necessarily an indication of the riskassociated with investing in those securities.
At January 31, 2013, all of the Fund’s investments in securities were valued using Level 2 inputs since the primary inputsinclude credit quality of the issuer and short-term interest rates which are observable and the use of amortized cost.
Further details on the major security types can be found in the Portfolio of Investments.
Transfers in and transfers out are recognized at the end of the reporting period. For the year ended January 31, 2013,the Fund did not have any transfers into/out of Level 1 and Level 2.
4. TRANSACTIONS WITH AFFILIATES AND OTHER EXPENSES
Advisory feeThe Trust has entered into an advisory contract with Funds Management, an indirect wholly owned subsidiary of WellsFargo & Company (“Wells Fargo”). The adviser is responsible for implementing investment policies and guidelines and forsupervising the subadviser, who is responsible for day-to-day portfolio management of the Fund.
Pursuant to the contract, Funds Management is entitled to receive an annual advisory fee of 0.10% of the Fund’s averagedaily net assets.
Funds Management has retained the services of a subadviser to provide daily portfolio management to the Fund. The feefor subadvisory services is borne by Funds Management. Wells Capital Management Incorporated, an affiliate of FundsManagement, is the subadviser to the Fund and is entitled to receive a fee from Funds Management at an annual ratestarting at 0.05% and declining to 0.01% as the average daily net assets of the Fund increase.
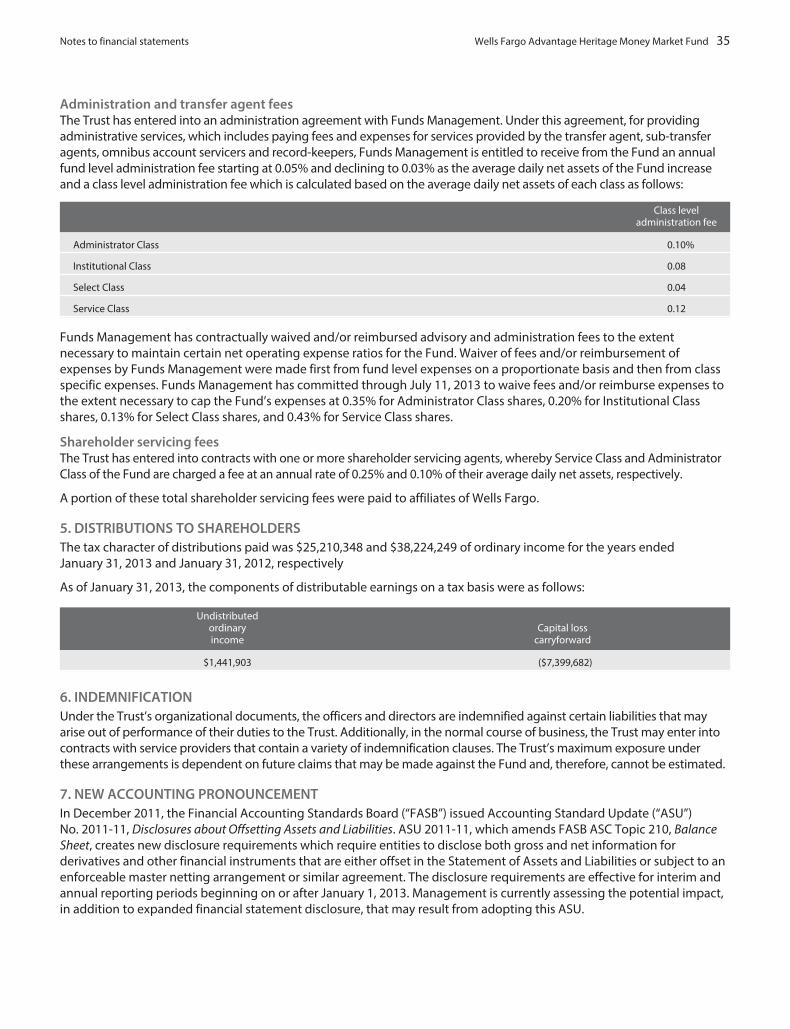
Notes to financial statements Wells Fargo Advantage Heritage Money Market Fund 35
Administration and transfer agent feesThe Trust has entered into an administration agreement with Funds Management. Under this agreement, for providingadministrative services, which includes paying fees and expenses for services provided by the transfer agent, sub-transferagents, omnibus account servicers and record-keepers, Funds Management is entitled to receive from the Fund an annualfund level administration fee starting at 0.05% and declining to 0.03% as the average daily net assets of the Fund increaseand a class level administration fee which is calculated based on the average daily net assets of each class as follows:
Class leveladministration fee
Administrator Class 0.10%
Institutional Class 0.08
Select Class 0.04
Service Class 0.12
Funds Management has contractually waived and/or reimbursed advisory and administration fees to the extentnecessary to maintain certain net operating expense ratios for the Fund. Waiver of fees and/or reimbursement ofexpenses by Funds Management were made first from fund level expenses on a proportionate basis and then from classspecific expenses. Funds Management has committed through July 11, 2013 to waive fees and/or reimburse expenses tothe extent necessary to cap the Fund’s expenses at 0.35% for Administrator Class shares, 0.20% for Institutional Classshares, 0.13% for Select Class shares, and 0.43% for Service Class shares.
Shareholder servicing feesThe Trust has entered into contracts with one or more shareholder servicing agents, whereby Service Class and AdministratorClass of the Fund are charged a fee at an annual rate of 0.25% and 0.10% of their average daily net assets, respectively.
A portion of these total shareholder servicing fees were paid to affiliates of Wells Fargo.
5. DISTRIBUTIONS TO SHAREHOLDERSThe tax character of distributions paid was $25,210,348 and $38,224,249 of ordinary income for the years endedJanuary 31, 2013 and January 31, 2012, respectively
As of January 31, 2013, the components of distributable earnings on a tax basis were as follows:
Undistributedordinaryincome
Capital losscarryforward
$1,441,903 ($7,399,682)
6. INDEMNIFICATIONUnder the Trust’s organizational documents, the officers and directors are indemnified against certain liabilities that mayarise out of performance of their duties to the Trust. Additionally, in the normal course of business, the Trust may enter intocontracts with service providers that contain a variety of indemnification clauses. The Trust’s maximum exposure underthese arrangements is dependent on future claims that may be made against the Fund and, therefore, cannot be estimated.
7. NEW ACCOUNTING PRONOUNCEMENTIn December 2011, the Financial Accounting Standards Board (“FASB”) issued Accounting Standard Update (“ASU”)No. 2011-11, Disclosures about Offsetting Assets and Liabilities. ASU 2011-11, which amends FASB ASC Topic 210, BalanceSheet, creates new disclosure requirements which require entities to disclose both gross and net information forderivatives and other financial instruments that are either offset in the Statement of Assets and Liabilities or subject to anenforceable master netting arrangement or similar agreement. The disclosure requirements are effective for interim andannual reporting periods beginning on or after January 1, 2013. Management is currently assessing the potential impact,in addition to expanded financial statement disclosure, that may result from adopting this ASU.

36 Wells Fargo Advantage Heritage Money Market Fund Notes to financial statements
8. SUBSEQUENT EVENTAfter the close of business on March 1, 2013, the Fund acquired the net assets of Wells Fargo Advantage Prime InvestmentMoney Market Fund in a tax-free exchange for shares of the Fund. Institutional Class and Service Class shareholders of WellsFargo Advantage Prime Investment Money Market Fund received corresponding shares of the Fund.

Report of independent registered public accounting firm Wells Fargo Advantage Heritage Money Market Fund 37
BOARD OF TRUSTEES AND SHAREHOLDERS OF WELLS FARGO FUNDS TRUST:
We have audited the accompanying statement of assets and liabilities, including the portfolio of investments, of the WellsFargo Advantage Heritage Money Market Fund (the “Fund”), one of the funds constituting the Wells Fargo Funds Trust, asof January 31, 2013, and the related statement of operations for the year then ended, the statements of changes in netassets for each of the years in the two-year period then ended, and the financial highlights for each of the years in thetwo-year period then ended, each of the periods within the eleven month period from March 1, 2010 to January 31, 2011,and each of the years or periods in the three-year period ended February 28, 2010. These financial statements andfinancial highlights are the responsibility of the Fund’s management. Our responsibility is to express an opinion on thesefinancial statements and financial highlights based on our audits.
We conducted our audits in accordance with the standards of the Public Company Accounting Oversight Board (UnitedStates). Those standards require that we plan and perform the audit to obtain reasonable assurance about whether thefinancial statements and financial highlights are free of material misstatement. An audit includes examining, on a testbasis, evidence supporting the amounts and disclosures in the financial statements. Our procedures includedconfirmation of securities owned as of January 31, 2013, by correspondence with the custodian and brokers, or by otherappropriate auditing procedures. An audit also includes assessing the accounting principles used and significantestimates made by management, as well as evaluating the overall financial statement presentation. We believe that ouraudits provide a reasonable basis for our opinion.
In our opinion, the financial statements and financial highlights referred to above present fairly, in all material respects,the financial position of the Wells Fargo Advantage Heritage Money Market Fund as of January 31, 2013, the results of itsoperations for the year then ended, changes in its net assets for each of the years in the two-year period then ended, andthe financial highlights for each of the years or periods described above, in conformity with U.S. generally acceptedaccounting principles.
Boston, MassachusettsMarch 26, 2013

38 Wells Fargo Advantage Heritage Money Market Fund Other information (unaudited)
TAX INFORMATIONFor the fiscal year ended January 31, 2013, $16,332,288 has been designated as interest-related dividends for nonresidentalien shareholders pursuant to Section 871 of the Internal Revenue Code.
For the fiscal year ended January 31, 2013, 4.32% of the ordinary income distributed was derived from interest on U.S.government securities.
PROXY VOTING INFORMATIONA description of the policies and procedures that the Fund uses to determine how to vote proxies relating to portfoliosecurities is available without charge, upon request, by calling 1-800-222-8222, visiting our website atwellsfargoadvantagefunds.com, or visiting the SEC website at sec.gov. Information regarding how the Fund votedproxies relating to portfolio securities during the most recent 12-month period ended June 30 is available without chargeon the Fund’s website at wellsfargoadvantagefunds.com or by visiting the SEC website at sec.gov.
PORTFOLIO HOLDINGS INFORMATIONThe complete portfolio holdings for the Fund are publicly available on the Fund’s website(wellsfargoadvantagefunds.com) on a monthly, seven-day delayed basis. The Fund files its complete schedule of portfolioholdings with the SEC for the first and third quarters of each fiscal year on Form N-Q, which is available without charge byvisiting the SEC website at sec.gov. In addition, the Fund’s Form N-Q may be reviewed and copied at the SEC’s PublicReference Room in Washington, DC, and at regional offices in New York City, at 233 Broadway, and in Chicago, at 175 WestJackson Boulevard, Suite 900. Information about the Public Reference Room may be obtained by calling 1-800-SEC-0330.

Other information (unaudited) Wells Fargo Advantage Heritage Money Market Fund 39
BOARD OF TRUSTEES AND OFFICERSEach of the Trustees and Officers listed in the table below acts in identical capacities for the Wells Fargo Advantage familyof funds, which consists of 136 funds1 comprising the Wells Fargo Funds Trust, Wells Fargo Variable Trust, Wells FargoMaster Trust and four closed-end funds (collectively the “Fund Complex”). This table should be read in conjunction withthe Prospectus and the Statement of Additional Information2. All of the Trustees are also Members of the Audit andGovernance Committees of each Trust in the Fund Complex. The mailing address of each Trustee and Officer is 525Market Street, 12th Floor, San Francisco, CA 94105. Each Trustee and Officer serves an indefinite term, however, eachTrustee serves such term until reaching the mandatory retirement age established by the Trustees.
Independent Trustees
Name andyear of birth
Position held andlength of service* Principal occupations during past five years
Otherdirectorships duringpast five years
Peter G. Gordon
(Born 1942)
Trustee, since 1998;
Chairman, since 2005
Co-Founder, Retired Chairman, President and CEO of Crystal Geyser Water
Company. Trustee Emeritus, Colby College.
Asset Allocation Trust
Isaiah Harris, Jr.
(Born 1952)
Trustee, since 2009 Retired. Prior thereto, President and CEO of BellSouth Advertising and
Publishing Corp. from 2005 to 2007, President and CEO of BellSouth
Enterprises from 2004 to 2005 and President of BellSouth Consumer Services
from 2000 to 2003. Emeritus member of the Iowa State University Foundation
Board of Governors. Emeritus Member of the Advisory Board of Iowa State
University School of Business. Advisory Board Member, Palm Coast Academy
(charter school). Mr. Harris is a certified public accountant.
CIGNA Corporation;
Deluxe Corporation;
Asset Allocation Trust
Judith M. Johnson
(Born 1949)
Trustee, since 2008; Audit
Committee Chairman,
since 2008
Retired. Prior thereto, Chief Executive Officer and Chief Investment Officer of
Minneapolis Employees Retirement Fund from 1996 to 2008. Ms. Johnson is an
attorney, certified public accountant and a certified managerial accountant.
Asset Allocation Trust
Leroy Keith, Jr.
(Born 1939)
Trustee, since 2010 Chairman, Bloc Global Services (development and construction). Trustee of
the Evergreen Funds from 1983 to 2010. Former Managing Director, Almanac
Capital Management (commodities firm), former Partner, Stonington
Partners, Inc. (private equity fund), former Director, Obagi Medical Products
Co. and former Director, Lincoln Educational Services.
Trustee, Virtus Fund
Complex (consisting
of 48 portfolios as of
1/31/13); Asset
Allocation Trust
David F. Larcker
(Born 1950)
Trustee, since 2009 James Irvin Miller Professor of Accounting at the Graduate School of Business,
Stanford University, Morgan Stanley Director of the Center for Leadership
Development and Research and Senior Faculty of The Rock Center for
Corporate Governance since 2006. From 2005 to 2008, Professor of
Accounting at the Graduate School of Business, Stanford University. Prior
thereto, Ernst & Young Professor of Accounting at The Wharton School,
University of Pennsylvania from 1985 to 2005.
Asset Allocation Trust
Olivia S. Mitchell
(Born 1953)
Trustee, since 2006 International Foundation of Employee Benefit Plans Professor, Wharton
School of the University of Pennsylvania since 1993. Director of Wharton’s
Pension Research Council and Boettner Center on Pensions & Retirement
Research, and Research Associate at the National Bureau of Economic
Research. Previously, Cornell University Professor from 1978 to 1993.
Asset Allocation Trust
Timothy J. Penny
(Born 1951)
Trustee, since 1996 President and CEO of Southern Minnesota Initiative Foundation, a non-profit
organization, since 2007 and Senior Fellow at the Humphrey Institute Policy Forum
at the University of Minnesota since 1995. Member of the Board of Trustees of
NorthStar Education Finance, Inc., a non-profit organization, since 2007.
Asset Allocation Trust

40 Wells Fargo Advantage Heritage Money Market Fund Other information (unaudited)
Name andyear of birth
Position held andlength of service* Principal occupations during past five years
Otherdirectorships duringpast five years
Michael S. Scofield
(Born 1943)
Trustee, since 2010 Served on the Investment Company Institute’s Board of Governors and
Executive Committee from 2008-2011 as well the Governing Council of the
Independent Directors Council from 2006-2011 and the Independent
Directors Council Executive Committee from 2008-2011. Chairman of the IDC
from 2008-2010. Institutional Investor (Fund Directions) Trustee of Year in
2007. Trustee of the Evergreen Funds (and its predecessors) from 1984 to
2010. Chairman of the Evergreen Funds from 2000-2010. Former Trustee of
the Mentor Funds. Retired Attorney, Law Offices of Michael S. Scofield.
Asset Allocation Trust
Donald C. Willeke
(Born 1940)
Trustee, since 1996 Principal of the law firm of Willeke & Daniels. General Counsel of the
Minneapolis Employees Retirement Fund from 1984 until its consolidation
into the Minnesota Public Employees Retirement Association on June 30,
2010. Director, and Vice Chair of The Tree Trust (non-profit corporation).
Director of the American Chestnut Foundation (non-profit corporation).
Asset Allocation Trust
* Length of service dates reflect the Trustee’s commencement of service with the Trust’s predecessor entities, where applicable.
Officers
Name andyear of birth
Position held andlength of service Principal occupations during past five years
Karla M. Rabusch
(Born 1959)
President, since 2003 Executive Vice President of Wells Fargo Bank, N.A. and President of Wells
Fargo Funds Management, LLC since 2003.
Nancy Wiser1
(Born 1967)
Treasurer, since 2012 Executive Vice President of Wells Fargo Funds Management, LLC since 2011. Chief
Operating Officer and Chief Compliance Officer at LightBox Capital Management
LLC, from 2008 to 2011. Owned and operated a consulting business providing
services to various hedge funds including acting as Chief Operating Officer and
Chief Compliance Officer for a hedge fund from 2007 to 2008. Chief Operating
Officer and Chief Compliance Officer of GMN Capital LLC from 2006 to 2007.
C. David Messman
(Born 1960)
Secretary, since 2000;
Chief Legal Officer,
since 2003
Senior Vice President and Secretary of Wells Fargo Funds Management, LLC
since 2001. Vice President and Managing Counsel of Wells Fargo Bank, N.A.
since 1996.
Debra Ann Early
(Born 1964)
Chief Compliance
Officer, since 2007
Chief Compliance Officer of Wells Fargo Funds Management, LLC since 2007.
Chief Compliance Officer of Parnassus Investments from 2005 to 2007. Chief
Financial Officer of Parnassus Investments from 2004 to 2007.
David Berardi
(Born 1975)
Assistant Treasurer,
since 2009
Vice President of Wells Fargo Funds Management, LLC since 2009. Vice
President of Evergreen Investment Management Company, LLC from 2008 to
2010. Assistant Vice President of Evergreen Investment Services, Inc. from
2004 to 2008. Manager of Fund Reporting and Control for Evergreen
Investment Management Company, LLC from 2004 to 2010.
Jeremy DePalma1
(Born 1974)
Assistant Treasurer,
since 2009
Senior Vice President of Wells Fargo Funds Management, LLC since 2009.
Senior Vice President of Evergreen Investment Management Company, LLC
from 2008 to 2010. Vice President, Evergreen Investment Services, Inc. from
2004 to 2007. Head of the Fund Reporting and Control Team within Fund
Administration from 2005 to 2010.
1. Nancy Wiser acts as Treasurer of 75 funds in the Fund Complex. Jeremy DePalma acts as Treasurer of 61 funds and Assistant Treasurer of 75 funds inthe Fund Complex.
2. The Statement of Additional Information includes additional information about the Trustees and is available,without charge, upon request, by calling1-800-222-8222 or by visiting the website at wellsfargoadvantagefunds.com.

List of abbreviations Wells Fargo Advantage Heritage Money Market Fund 41
The following is a list of common abbreviations for terms and entities that may have appeared in this report.
ACA — ACA Financial Guaranty CorporationADR — American depositary receiptADS — American depositary sharesAGC — Assured Guaranty Corporation -
Insured Custody CertificatesAGM — Assured Guaranty MunicipalAmbac — Ambac Financial Group IncorporatedAMT — Alternative minimum taxAUD — Australian dollarBAN — Bond anticipation notesBHAC — Berkshire Hathaway Assurance CorporationBRL — Brazilian realCAB — Capital appreciation bondCAD — Canadian dollarCCAB — Convertible capital appreciation bondCDA — Community Development AuthorityCDO — Collateralized debt obligationCHF — Swiss francCOP — Certificate of participationDKK — Danish kroneDRIVER — Derivative inverse tax-exempt receiptsDW&P — Department of Water & PowerDWR — Department of Water ResourcesECFA — Educational & Cultural Facilities AuthorityEDA — Economic Development AuthorityEDFA — Economic Development Finance AuthorityETF — Exchange-traded fundEUR — EuroFDIC — Federal Deposit Insurance CorporationFFCB — Federal Farm Credit BanksFGIC — Financial Guaranty Insurance CorporationFHA — Federal Housing AdministrationFHLB — Federal Home Loan BankFHLMC — Federal Home Loan Mortgage CorporationFICO — The Financing CorporationFNMA — Federal National Mortgage AssociationFSA — Farm Service AgencyGBP — Great British poundGDR — Global depositary receiptGNMA — Government National Mortgage AssociationGO — General obligationHCFR — Healthcare facilities revenueHEFA — Health & Educational Facilities AuthorityHEFAR — Higher education facilities authority revenueHFA — Housing Finance AuthorityHFFA — Health Facilities Financing AuthorityHKD — Hong Kong dollarHUD — Department of Housing and Urban DevelopmentHUF — Hungarian forintIDA — Industrial Development AuthorityIDAG — Industrial Development AgencyIDR — Industrial development revenueIEP — Irish pound
JPY — Japanese yenKRW — Republic of Korea wonLIBOR — London Interbank Offered RateLIQ — Liquidity agreementLLC — Limited liability companyLLP — Limited liability partnershipLOC — Letter of creditLP — Limited partnershipMBIA — Municipal Bond Insurance AssociationMFHR — Multifamily housing revenueMSTR — Municipal securities trust receiptsMTN — Medium-term noteMUD — Municipal Utility DistrictMXN — Mexican pesoMYR — Malaysian ringgitNational — National Public Finance Guarantee CorporationNOK — Norwegian kroneNZD — New Zealand dollarPCFA — Pollution Control Financing AuthorityPCL — Public Company LimitedPCR — Pollution control revenuePFA — Public Finance AuthorityPFFA — Public Facilities Financing AuthorityPFOTER — Puttable floating option tax-exempt receiptsplc — Public limited companyPLN — Polish zlotyPUTTER — Puttable tax-exempt receiptsR&D — Research & developmentRadian — Radian Asset AssuranceRAN — Revenue anticipation notesRDA — Redevelopment AuthorityRDFA — Redevelopment Finance AuthorityREIT — Real estate investment trustROC — Reset option certificatesSAVRS — Select auction variable rate securitiesSBA — Small Business AuthoritySEK — Swedish kronaSFHR — Single-family housing revenueSFMR — Single-family mortgage revenueSGD — Singapore dollarSKK — Slovakian korunaSPA — Standby purchase agreementSPDR — Standard & Poor’s Depositary ReceiptsSTRIPS — Separate trading of registered interest and
principal securitiesTAN — Tax anticipation notesTBA — To be announcedTIPS — Treasury inflation-protected securitiesTRAN — Tax revenue anticipation notesTRY — Turkish liraTTFA — Transportation Trust Fund AuthorityTVA — Tennessee Valley AuthorityZAR — South African rand

This page is intentionally left blank.


For more information
More information about Wells Fargo Advantage Fundsis available free upon request. To obtain literature,please write, email, visit the Fund’s website, or call:
Wells Fargo Advantage FundsP.O. Box 8266Boston, MA 02266-8266
Email: [email protected]: wellsfargoadvantagefunds.comIndividual investors: 1-800-222-8222Retail investment professionals: 1-888-877-9275Institutional investment professionals: 1-866-765-0778
This report and the financial statements contained herein are submitted for thegeneral information of the shareholders of Wells Fargo Advantage Funds. If thisreport is used for promotional purposes, distribution of the report must beaccompanied or preceded by a current prospectus. For a current prospectus and, ifavailable, a summary prospectus containing more complete information,including charges and expenses, call 1-800-222-8222 or visit the Fund’s website atwellsfargoadvantagefunds.com. Please consider the investment objectives, risks,charges, and expenses of the investment carefully before investing. This and otherinformation about Wells Fargo Advantage Funds can be found in the currentprospectus. Read the prospectus carefully before you invest or send money.Wells Fargo Funds Management, LLC, a wholly owned subsidiary of Wells Fargo & Company,provides investment advisory and administrative services for Wells Fargo Advantage Funds. Otheraffiliates of Wells Fargo & Company provide subadvisory and other services for the Funds. TheFunds are distributed by Wells Fargo Funds Distributor, LLC, Member FINRA/SIPC, an affiliate ofWells Fargo & Company.
NOT FDIC INSURED ▪ NO BANK GUARANTEE ▪ MAY LOSE VALUE
© 2013 Wells Fargo Funds Management, LLC. All rights reserved.
Printed on Recycled paper215094 03-13
A304/AR304 1-13