Wellfleet Shellfish Part Iwellfleet.seri-us.org/wp-content/uploads/2015/12/Shellfish-Climate... ·...
37
Wellfleet Shellfish – Part I SERI Meeting 11-22-13 Cape Cod Cooperative Extension & Woods Hole Sea Grant Marine Program: • Diane Murphy • Joshua Reitsma • Abigail Franklin
Transcript of Wellfleet Shellfish Part Iwellfleet.seri-us.org/wp-content/uploads/2015/12/Shellfish-Climate... ·...
Wellfleet Shellfish – Part I SERI Meeting 11-22-13
Cape Cod Cooperative Extension & Woods Hole Sea Grant Marine Program: • Diane Murphy • Joshua Reitsma • Abigail Franklin
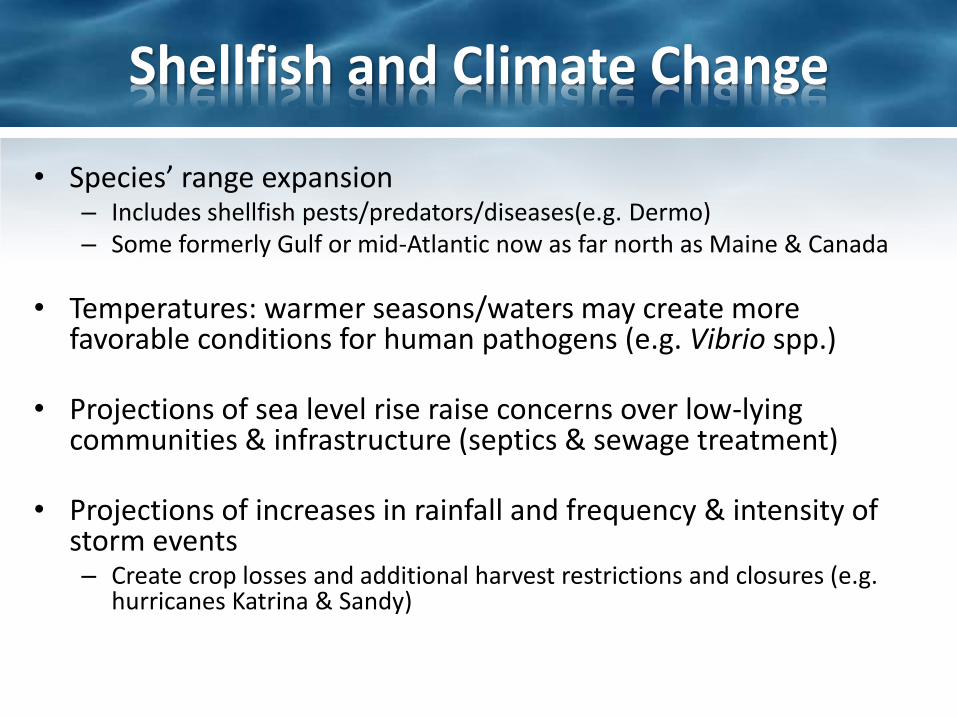
Shellfish and Climate Change
• Species’ range expansion – Includes shellfish pests/predators/diseases(e.g. Dermo) – Some formerly Gulf or mid-Atlantic now as far north as Maine & Canada
• Temperatures: warmer seasons/waters may create more favorable conditions for human pathogens (e.g. Vibrio spp.)
• Projections of sea level rise raise concerns over low-lying communities & infrastructure (septics & sewage treatment)
• Projections of increases in rainfall and frequency & intensity of storm events – Create crop losses and additional harvest restrictions and closures (e.g.
hurricanes Katrina & Sandy)
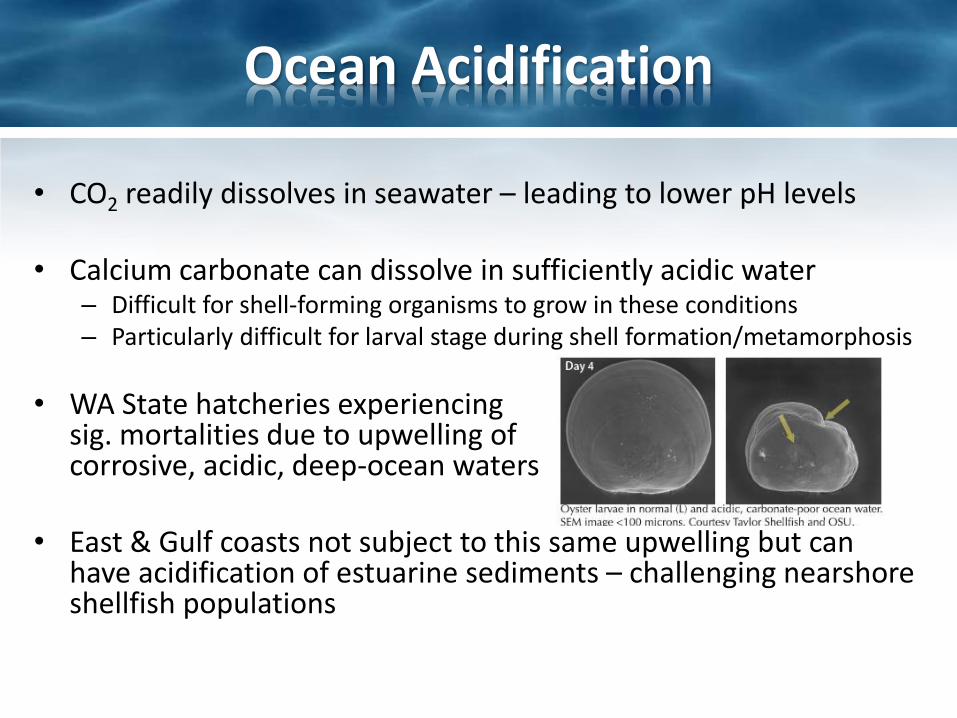
Ocean Acidification
• CO2 readily dissolves in seawater – leading to lower pH levels • Calcium carbonate can dissolve in sufficiently acidic water
– Difficult for shell-forming organisms to grow in these conditions – Particularly difficult for larval stage during shell formation/metamorphosis
• WA State hatcheries experiencing sig. mortalities due to upwelling of corrosive, acidic, deep-ocean waters
• East & Gulf coasts not subject to this same upwelling but can
have acidification of estuarine sediments – challenging nearshore shellfish populations
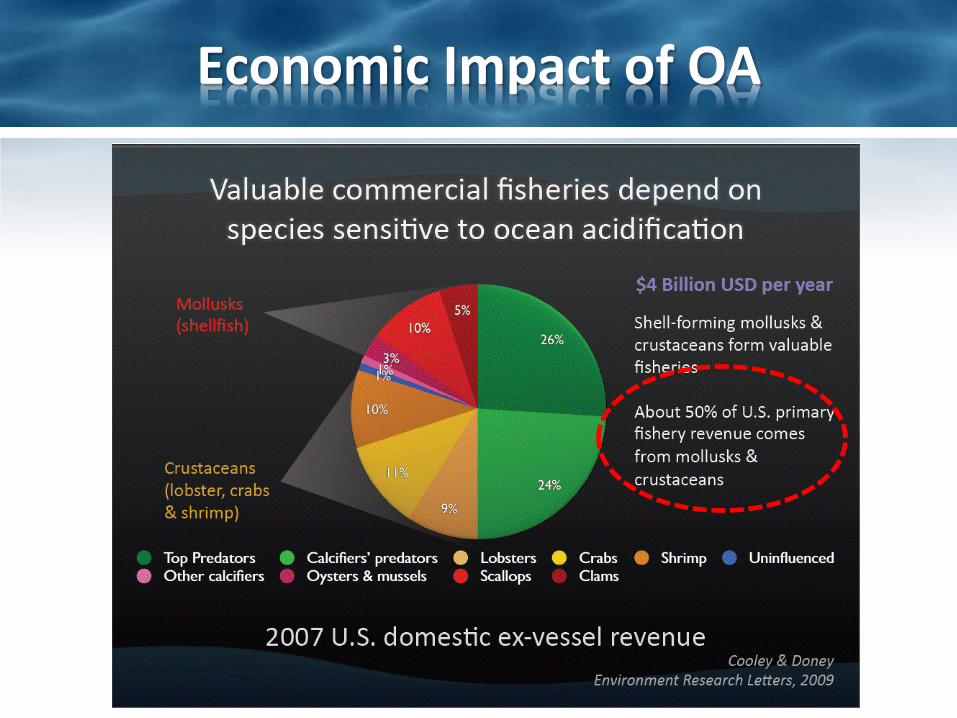
Economic Impact of OA
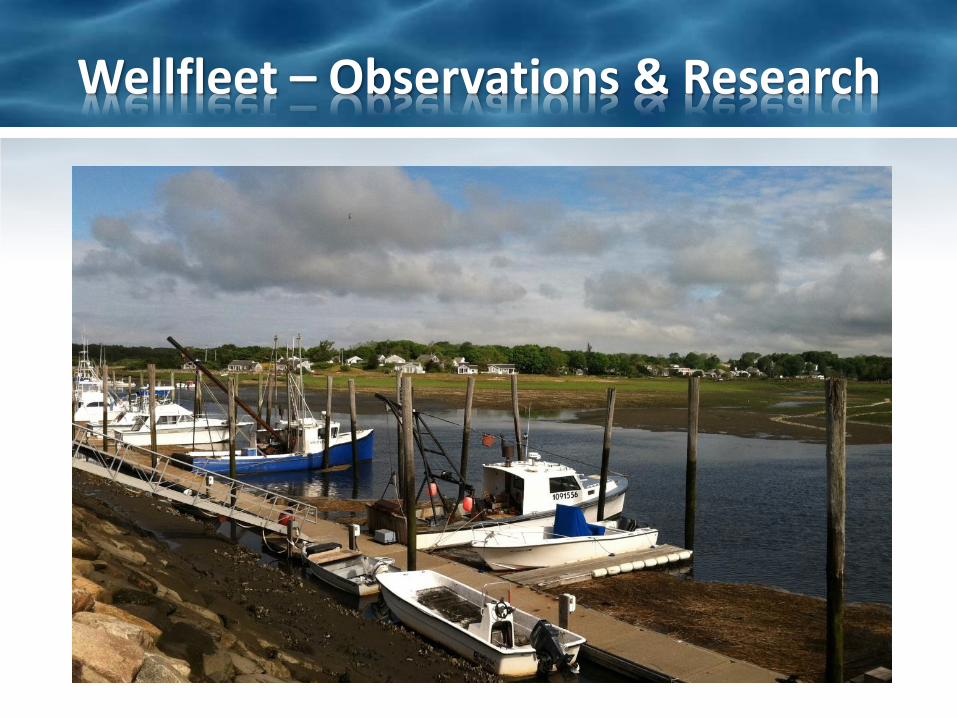
Wellfleet – Observations & Research
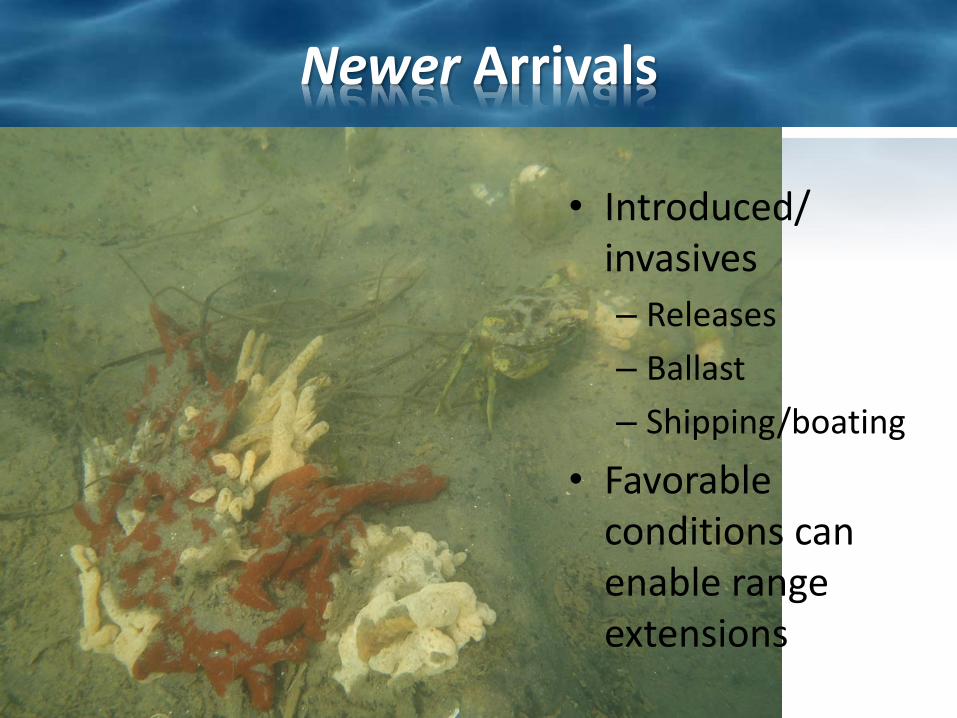
Newer Arrivals
• Introduced/ invasives
– Releases
– Ballast
– Shipping/boating
• Favorable conditions can enable range extensions
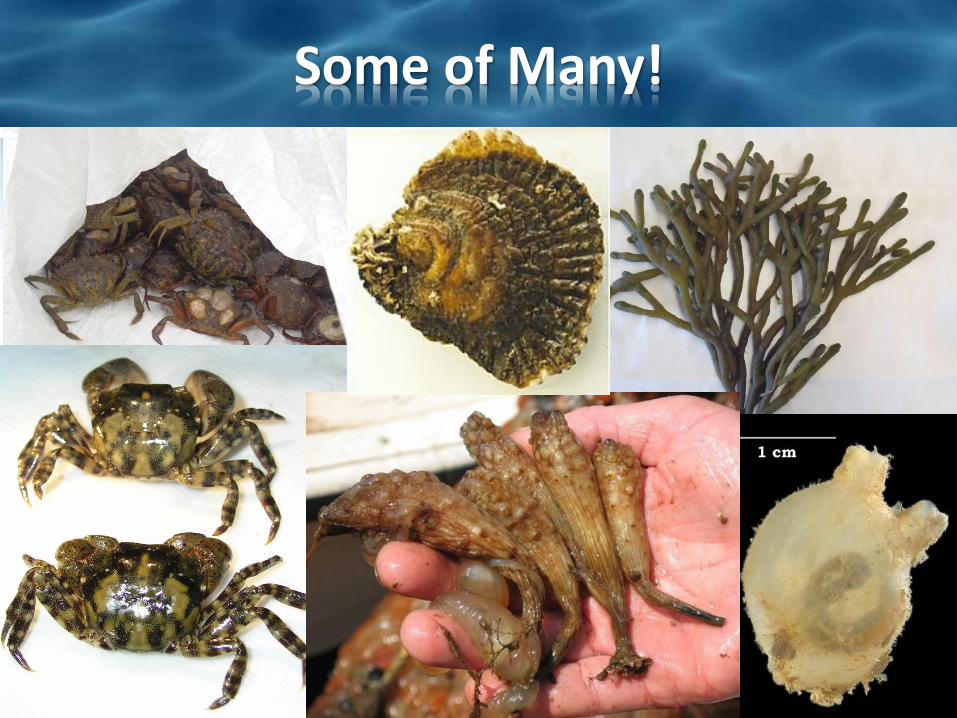
Some of Many!
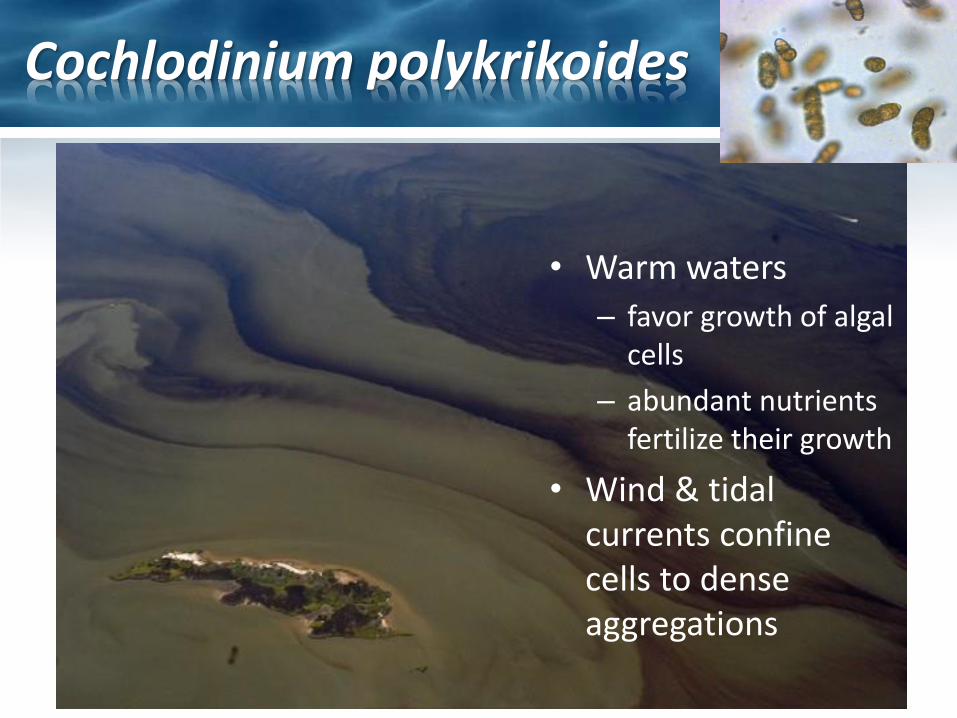
Cochlodinium polykrikoides
• Warm waters
– favor growth of algal cells
– abundant nutrients fertilize their growth
• Wind & tidal currents confine cells to dense aggregations
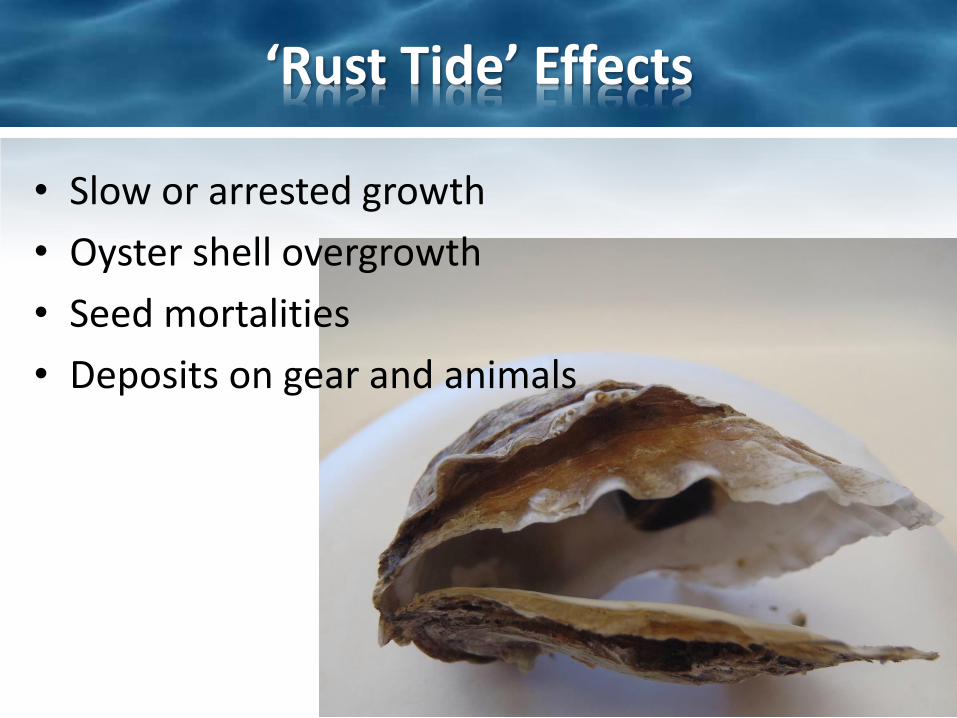
‘Rust Tide’ Effects
• Slow or arrested growth
• Oyster shell overgrowth
• Seed mortalities
• Deposits on gear and animals
Wellfleet Long-Term Data
• Disease Testing – ongoing – Quahogs and oysters
• Shellfish Habitat Assessment – 2003 – present – Yearly July 1 – September 1 period – Oysters – Quahogs (mesh + unmeshed treatments)
• YSI Water Monitoring – L-Pier 2004 – present – Egg Island channel
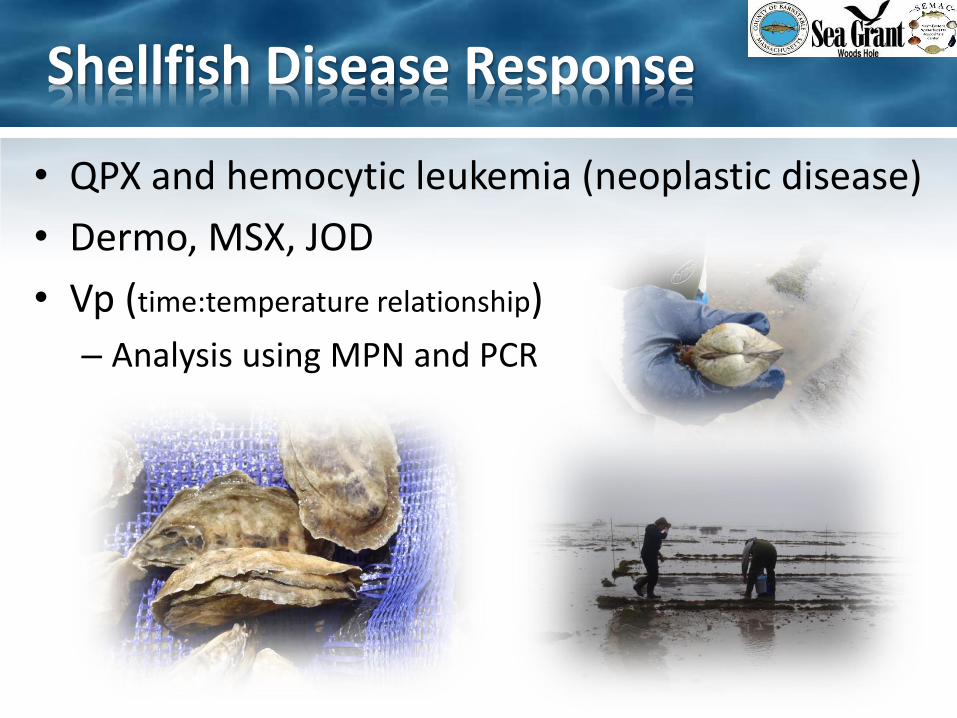
Shellfish Disease Response
• QPX and hemocytic leukemia (neoplastic disease)
• Dermo, MSX, JOD
• Vp (time:temperature relationship)
– Analysis using MPN and PCR
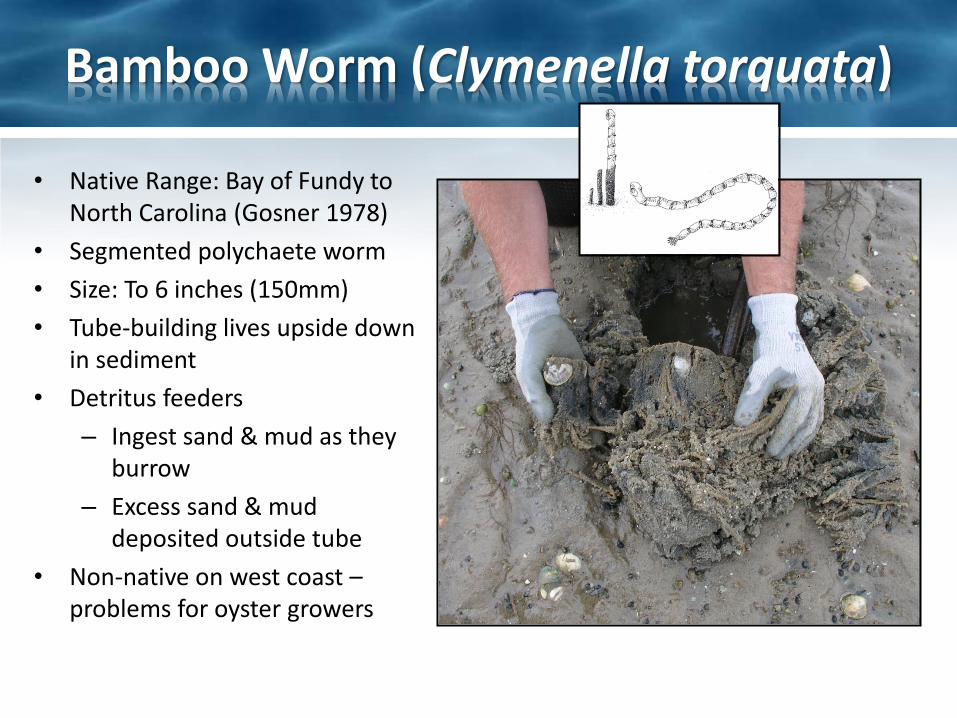
Bamboo Worm (Clymenella torquata)
• Native Range: Bay of Fundy to North Carolina (Gosner 1978)
• Segmented polychaete worm
• Size: To 6 inches (150mm)
• Tube-building lives upside down in sediment
• Detritus feeders
– Ingest sand & mud as they burrow
– Excess sand & mud deposited outside tube
• Non-native on west coast – problems for oyster growers
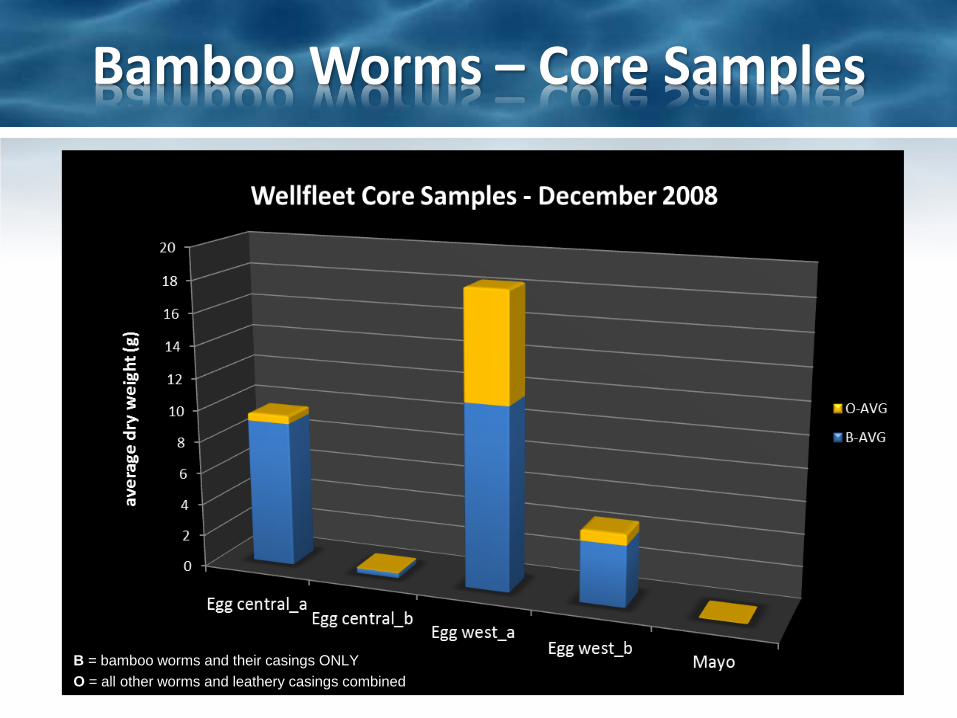
Bamboo Worms – Core Samples
B = bamboo worms and their casings ONLY
O = all other worms and leathery casings combined
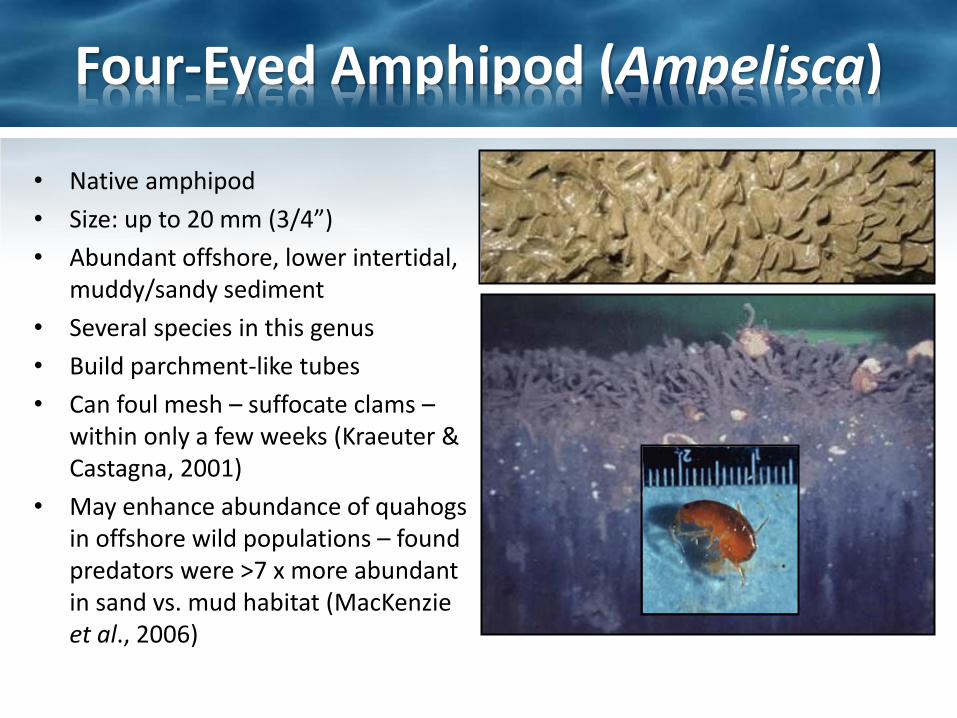
Four-Eyed Amphipod (Ampelisca)
• Native amphipod
• Size: up to 20 mm (3/4”)
• Abundant offshore, lower intertidal, muddy/sandy sediment
• Several species in this genus
• Build parchment-like tubes
• Can foul mesh – suffocate clams – within only a few weeks (Kraeuter & Castagna, 2001)
• May enhance abundance of quahogs in offshore wild populations – found predators were >7 x more abundant in sand vs. mud habitat (MacKenzie et al., 2006)
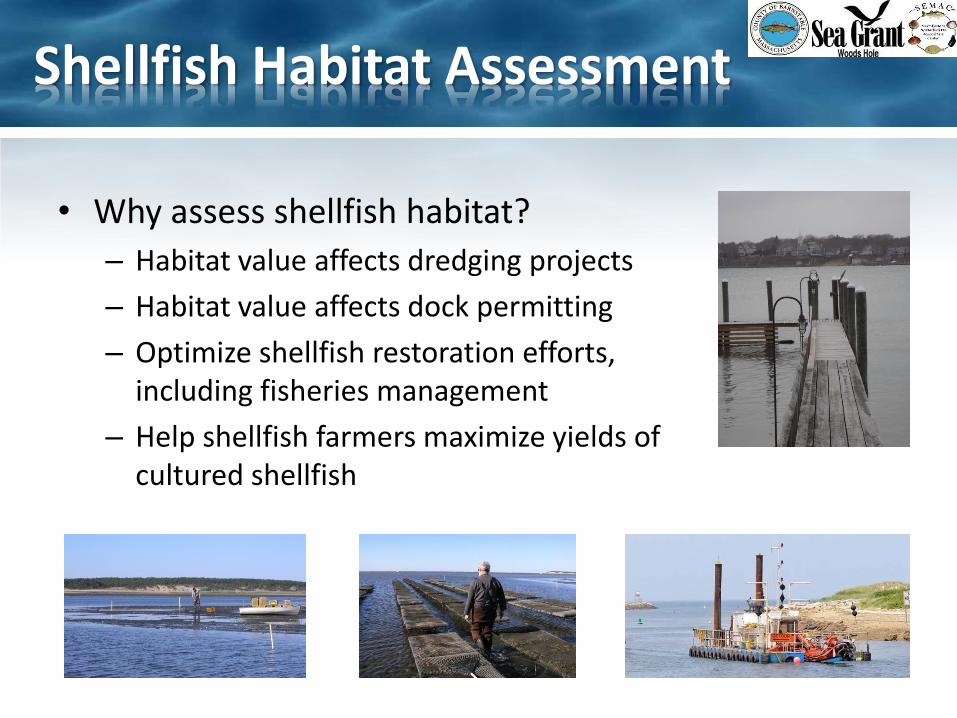
Shellfish Habitat Assessment
• Why assess shellfish habitat?
– Habitat value affects dredging projects
– Habitat value affects dock permitting
– Optimize shellfish restoration efforts, including fisheries management
– Help shellfish farmers maximize yields of cultured shellfish
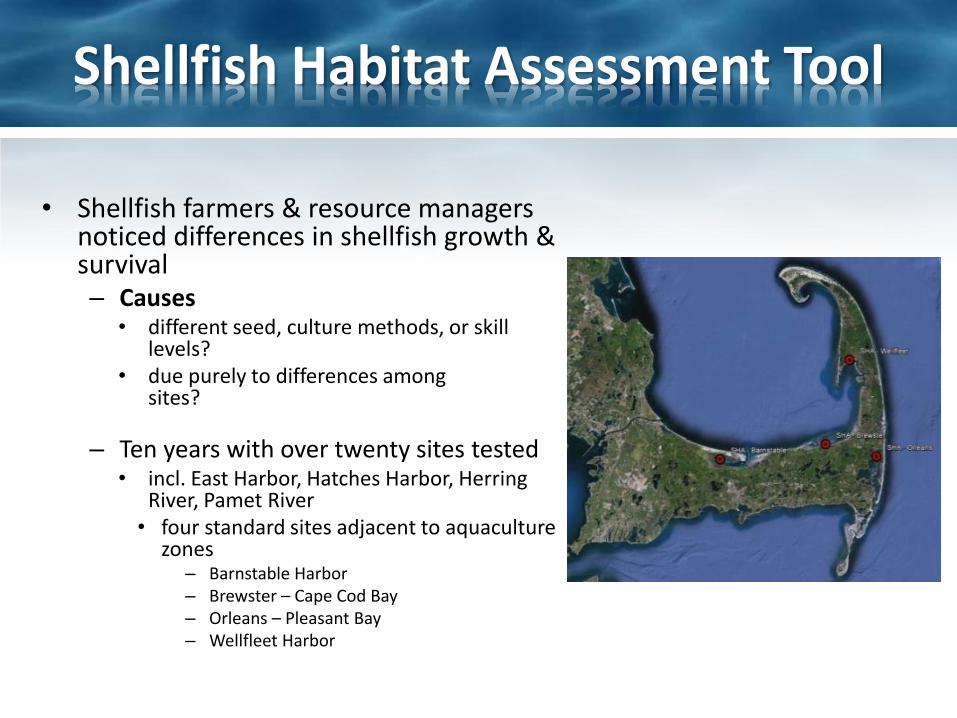
Shellfish Habitat Assessment Tool
• Shellfish farmers & resource managers noticed differences in shellfish growth & survival – Causes
• different seed, culture methods, or skill levels?
• due purely to differences among sites?sponsedeveloped low-cost tool to quantitativly assess habitat
– Ten years with over twenty sites tested • incl. East Harbor, Hatches Harbor, Herring
River, Pamet River • four standard sites adjacent to aquaculture
zones – Barnstable Harbor – Brewster – Cape Cod Bay – Orleans – Pleasant Bay – Wellfleet Harbor
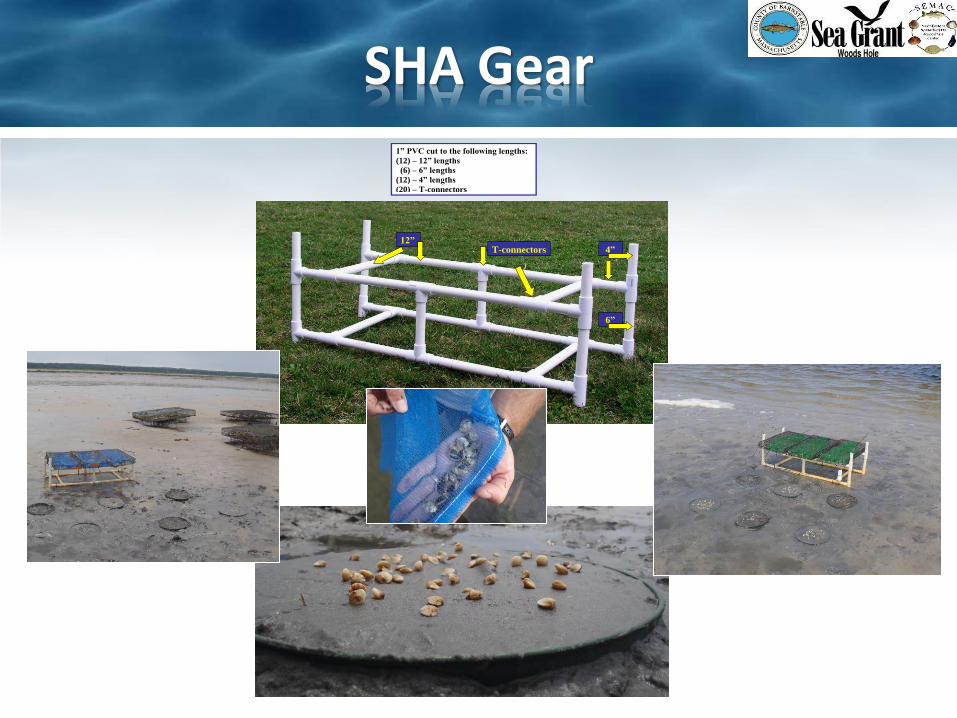
SHA Gear
12” 4” T-connectors
6”
1” PVC cut to the following lengths:
(12) – 12” lengths
(6) – 6” lengths
(12) – 4” lengths
(20) – T-connectors
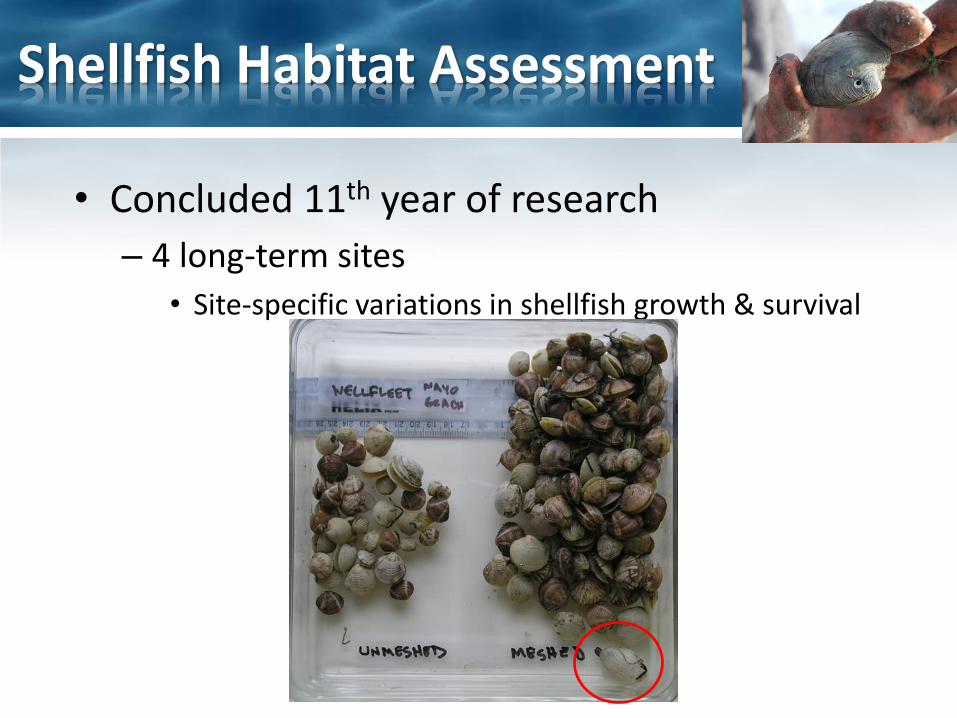
Shellfish Habitat Assessment
• Concluded 11th year of research
– 4 long-term sites
• Site-specific variations in shellfish growth & survival
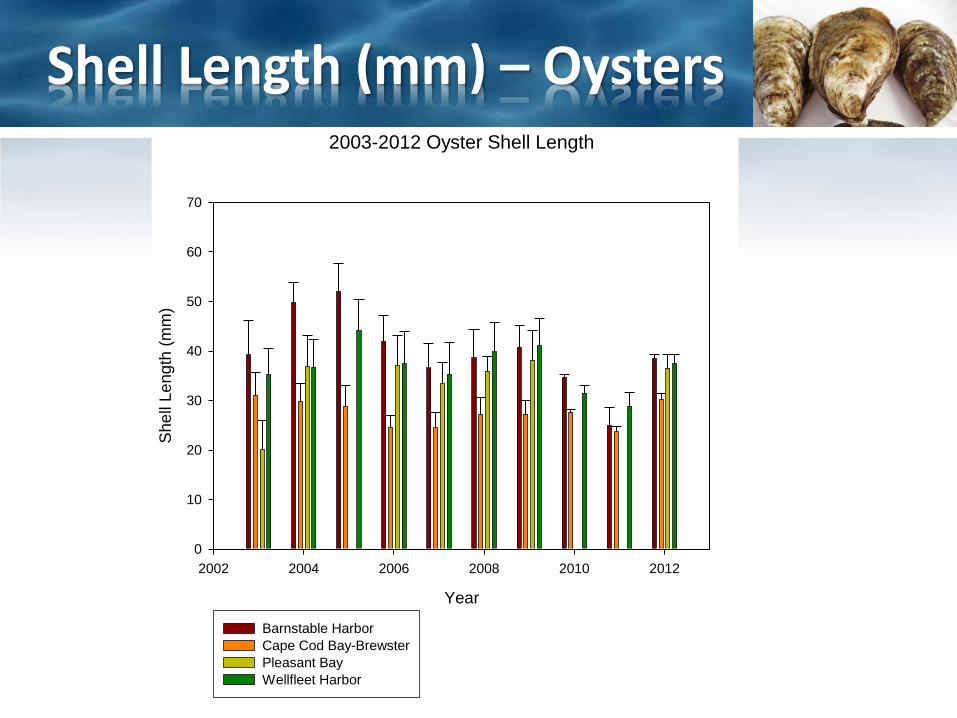
Shell Length (mm) – Oysters 2003-2012 Oyster Shell Length
Year
2002 2004 2006 2008 2010 2012
She
ll Le
ngth
(m
m)
0
10
20
30
40
50
60
70
Barnstable Harbor
Cape Cod Bay-Brewster
Pleasant Bay
Wellfleet Harbor
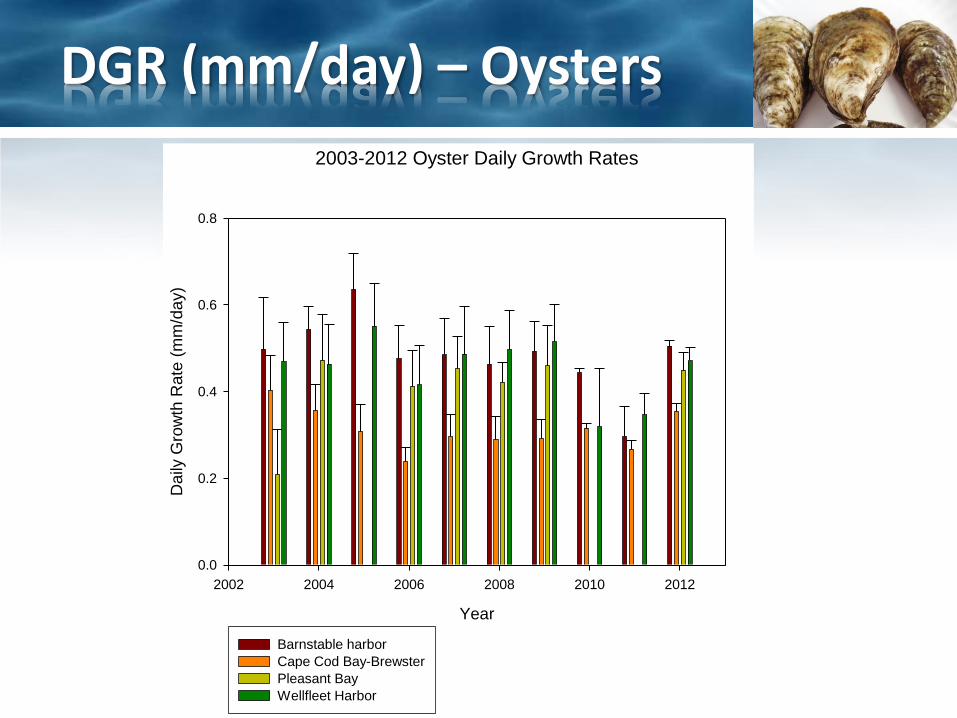
DGR (mm/day) – Oysters
2003-2012 Oyster Daily Growth Rates
Year
2002 2004 2006 2008 2010 2012
Daily
Gro
wth
Rate
(m
m/d
ay)
0.0
0.2
0.4
0.6
0.8
Barnstable harbor
Cape Cod Bay-Brewster
Pleasant Bay
Wellfleet Harbor
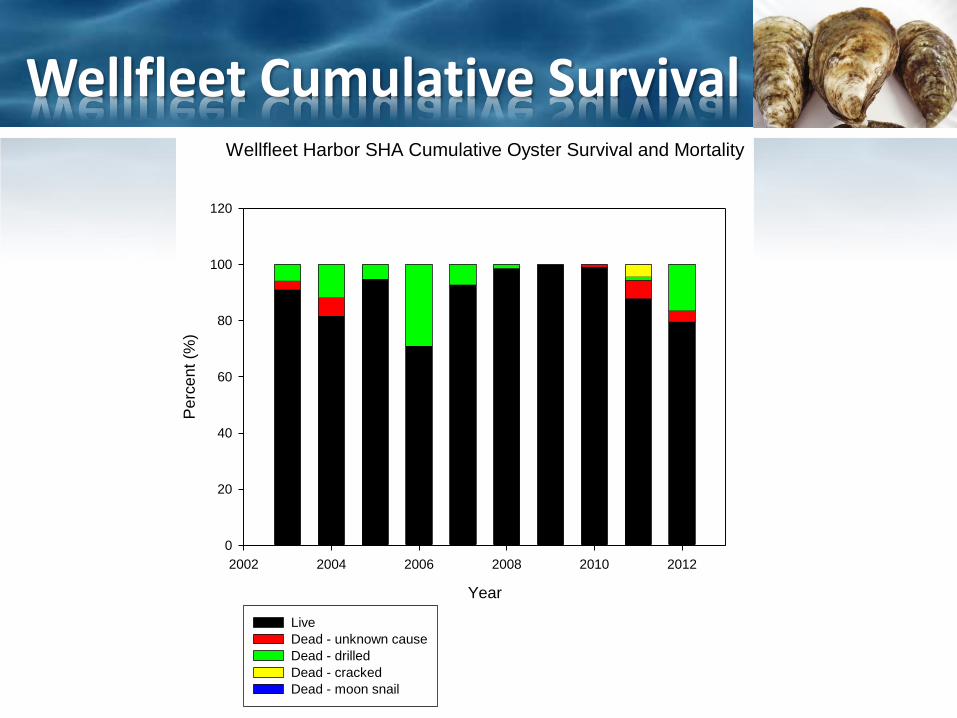
Wellfleet Cumulative Survival Wellfleet Harbor SHA Cumulative Oyster Survival and Mortality
Year
2002 2004 2006 2008 2010 2012
Pe
rce
nt
(%)
0
20
40
60
80
100
120
Live
Dead - unknown cause
Dead - drilled
Dead - cracked
Dead - moon snail
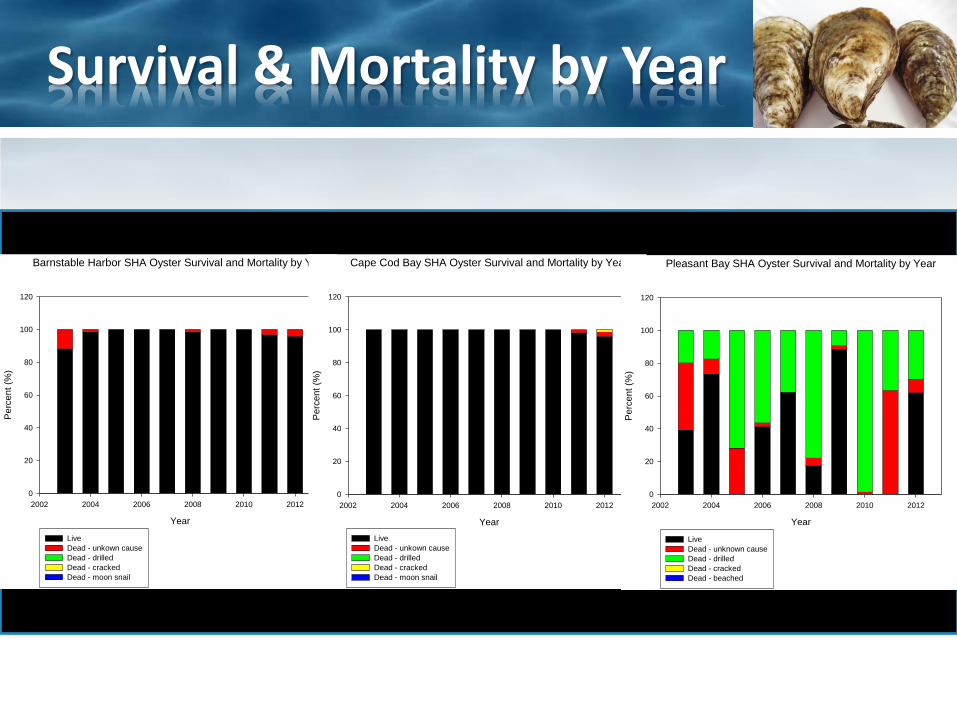
Survival & Mortality by Year
Barnstable Harbor SHA Oyster Survival and Mortality by Year
Year
2002 2004 2006 2008 2010 2012
Perc
en
t (%
)
0
20
40
60
80
100
120
Live
Dead - unkown cause
Dead - drilled
Dead - cracked
Dead - moon snail
Cape Cod Bay SHA Oyster Survival and Mortality by Year
Year
2002 2004 2006 2008 2010 2012
Perc
en
t (%
)
0
20
40
60
80
100
120
Live
Dead - unkown cause
Dead - drilled
Dead - cracked
Dead - moon snail
Pleasant Bay SHA Oyster Survival and Mortality by Year
Year
2002 2004 2006 2008 2010 2012
Perc
en
t (%
)
0
20
40
60
80
100
120
Live
Dead - unknown cause
Dead - drilled
Dead - cracked
Dead - beached
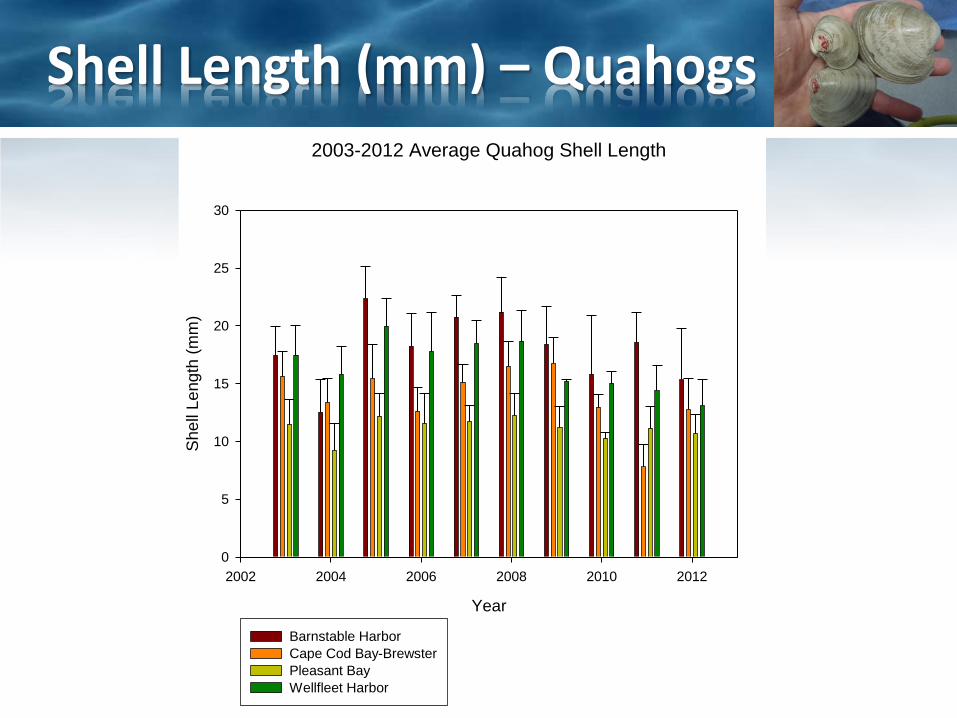
Shell Length (mm) – Quahogs 2003-2012 Average Quahog Shell Length
Year
2002 2004 2006 2008 2010 2012
She
ll Le
ngth
(m
m)
0
5
10
15
20
25
30
Barnstable Harbor
Cape Cod Bay-Brewster
Pleasant Bay
Wellfleet Harbor
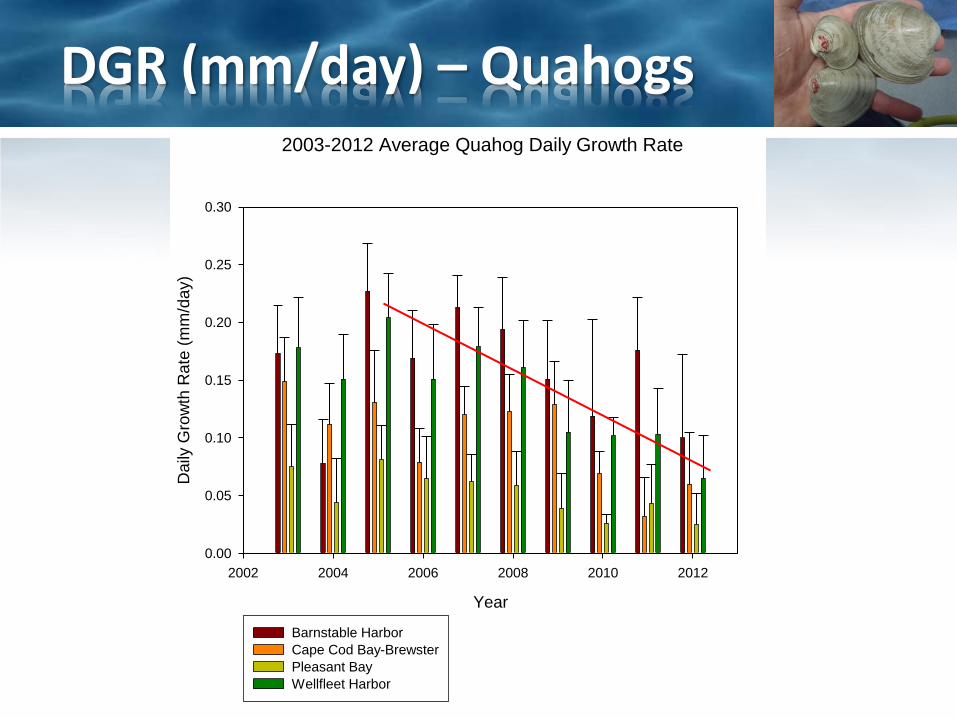
DGR (mm/day) – Quahogs 2003-2012 Average Quahog Daily Growth Rate
Year
2002 2004 2006 2008 2010 2012
Da
ily G
row
th R
ate
(m
m/d
ay)
0.00
0.05
0.10
0.15
0.20
0.25
0.30
Barnstable Harbor
Cape Cod Bay-Brewster
Pleasant Bay
Wellfleet Harbor
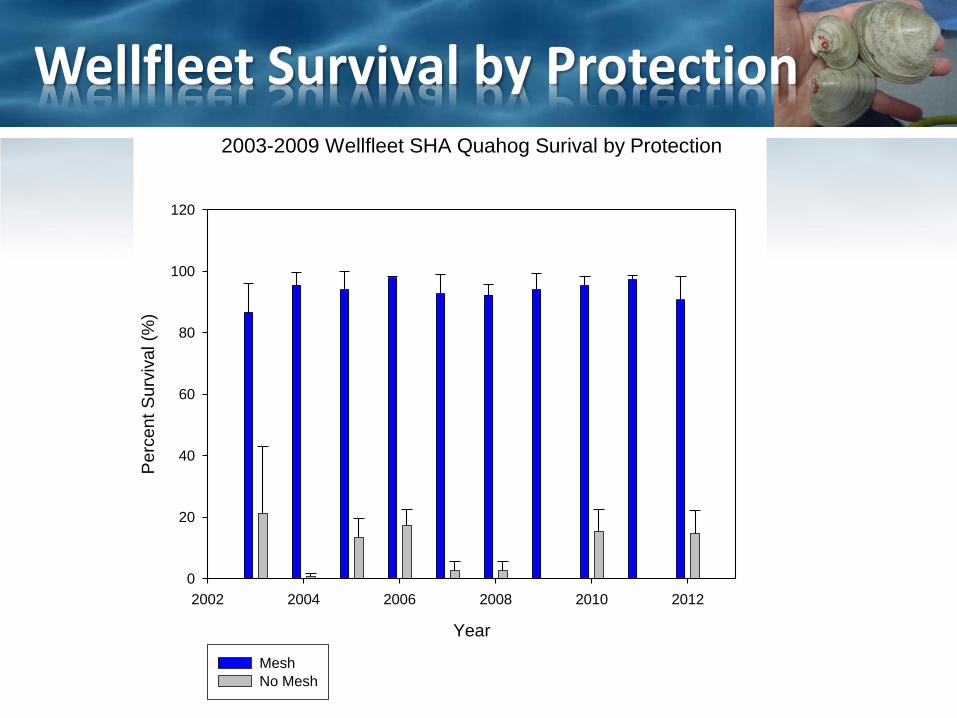
2003-2009 Wellfleet SHA Quahog Surival by Protection
Year
2002 2004 2006 2008 2010 2012
Perc
en
t S
urv
ival (%
)
0
20
40
60
80
100
120
Mesh
No Mesh
Wellfleet Survival by Protection
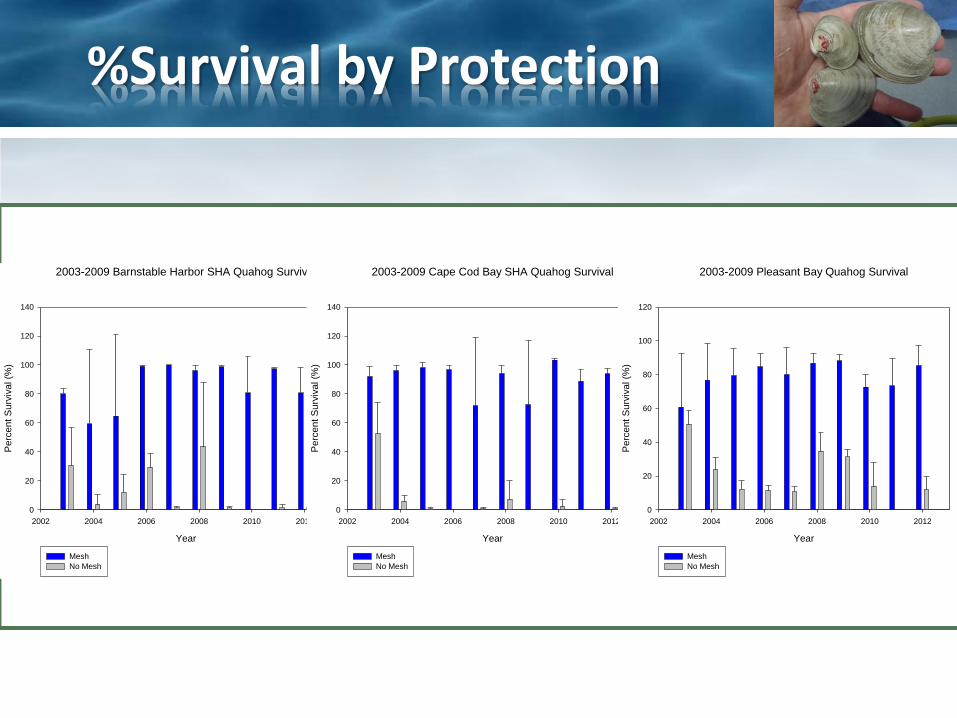
2003-2009 Barnstable Harbor SHA Quahog Survival
Year
2002 2004 2006 2008 2010 2012
Perc
en
t S
urv
ival (%
)
0
20
40
60
80
100
120
140
Mesh
No Mesh
%Survival by Protection
2003-2009 Cape Cod Bay SHA Quahog Survival
Year
2002 2004 2006 2008 2010 2012
Perc
en
t S
urv
ival (%
)
0
20
40
60
80
100
120
140
Mesh
No Mesh
2003-2009 Pleasant Bay Quahog Survival
Year
2002 2004 2006 2008 2010 2012
Perc
en
t S
urv
ival (%
)
0
20
40
60
80
100
120
Mesh
No Mesh
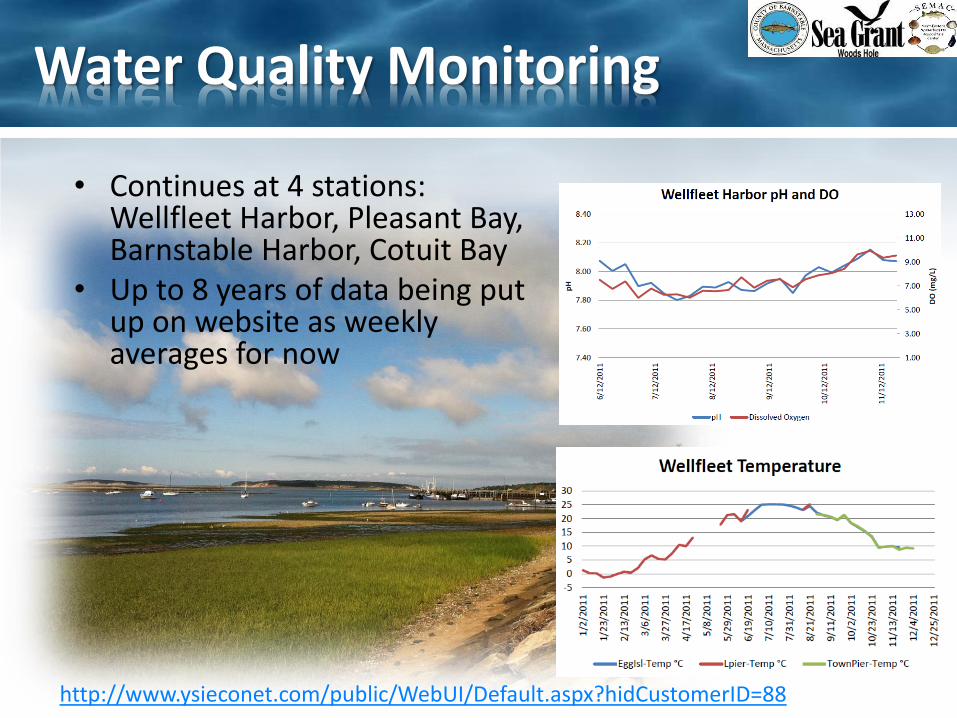
Water Quality Monitoring
• Continues at 4 stations: Wellfleet Harbor, Pleasant Bay, Barnstable Harbor, Cotuit Bay
• Up to 8 years of data being put up on website as weekly averages for now
http://www.ysieconet.com/public/WebUI/Default.aspx?hidCustomerID=88
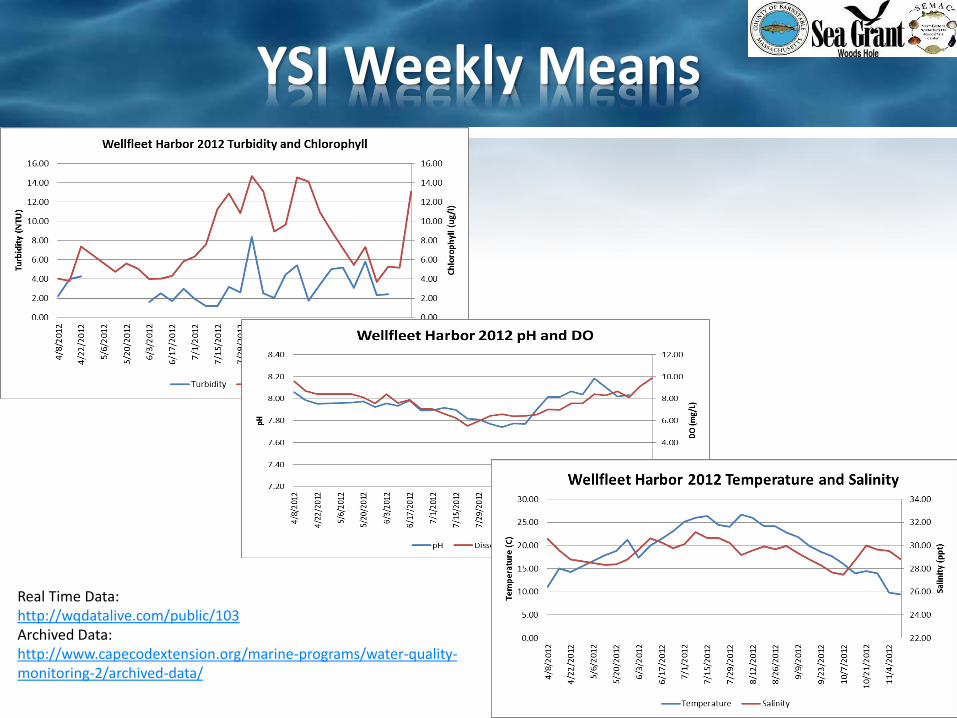
YSI Weekly Means
Real Time Data: http://wqdatalive.com/public/103 Archived Data: http://www.capecodextension.org/marine-programs/water-quality-monitoring-2/archived-data/
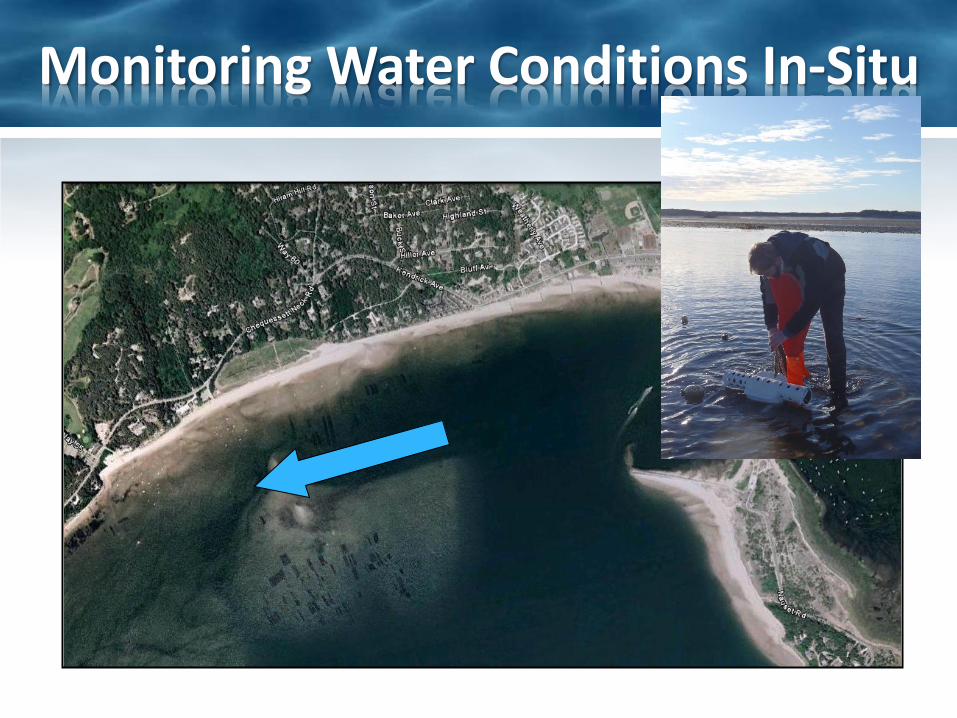
Monitoring Water Conditions In-Situ
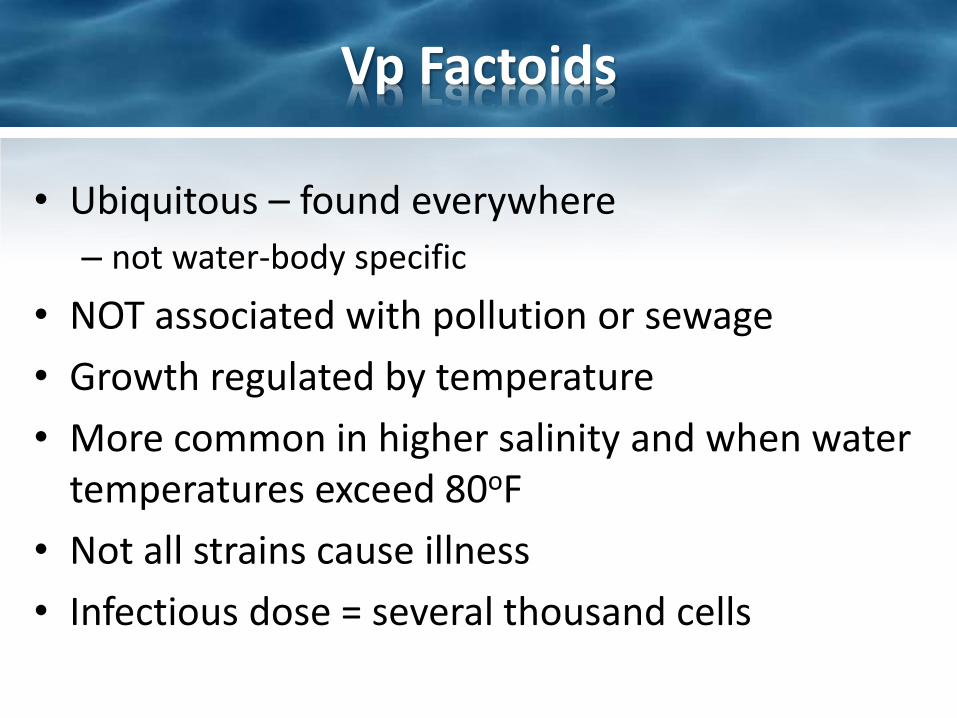
Vp Factoids
• Ubiquitous – found everywhere
– not water-body specific
• NOT associated with pollution or sewage
• Growth regulated by temperature
• More common in higher salinity and when water temperatures exceed 80oF
• Not all strains cause illness
• Infectious dose = several thousand cells
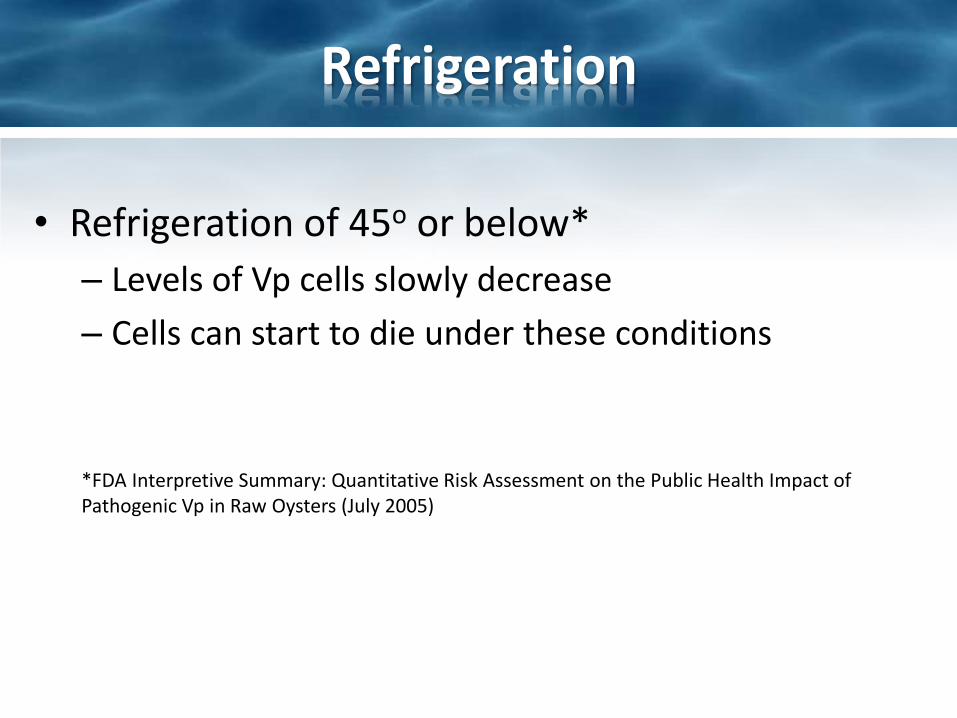
Refrigeration
• Refrigeration of 45o or below*
– Levels of Vp cells slowly decrease
– Cells can start to die under these conditions
*FDA Interpretive Summary: Quantitative Risk Assessment on the Public Health Impact of Pathogenic Vp in Raw Oysters (July 2005)
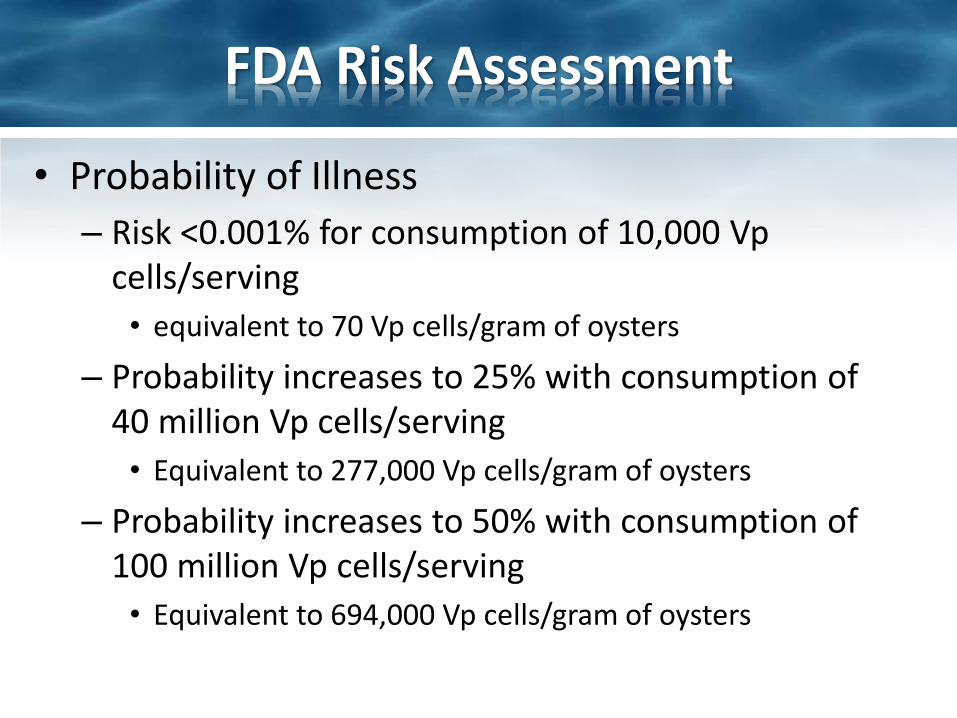
FDA Risk Assessment
• Probability of Illness
– Risk <0.001% for consumption of 10,000 Vp cells/serving
• equivalent to 70 Vp cells/gram of oysters
– Probability increases to 25% with consumption of 40 million Vp cells/serving
• Equivalent to 277,000 Vp cells/gram of oysters
– Probability increases to 50% with consumption of 100 million Vp cells/serving
• Equivalent to 694,000 Vp cells/gram of oysters
Current Local Vp Research
Vibrio Seasonality Study (CCCE/WHSG)
Vibrio Time Interval Study (CCCE/WHSG)
Develop more efficient methods of Vp detection (NRAC Grant)
Vibrio Seasonality Study
• Vibrio Seasonality Study (CCCE/WHSG)
– Study to examine effects of ‘season’ on Vp levels in oysters from 2 SE MA locations
– RWU (Dr. Smolowitz) lab analyses
– Initiated June 2013
• Work to continue in 2014
Vibrio Time Interval Study
• Vibrio Time Interval Study (CCCE/WHSG)
– Analysis of Vp levels in oysters at varying time intervals
• 5 hours out of water
• 1 hour back in water
• 5 hours back in water
• 19 hours in water
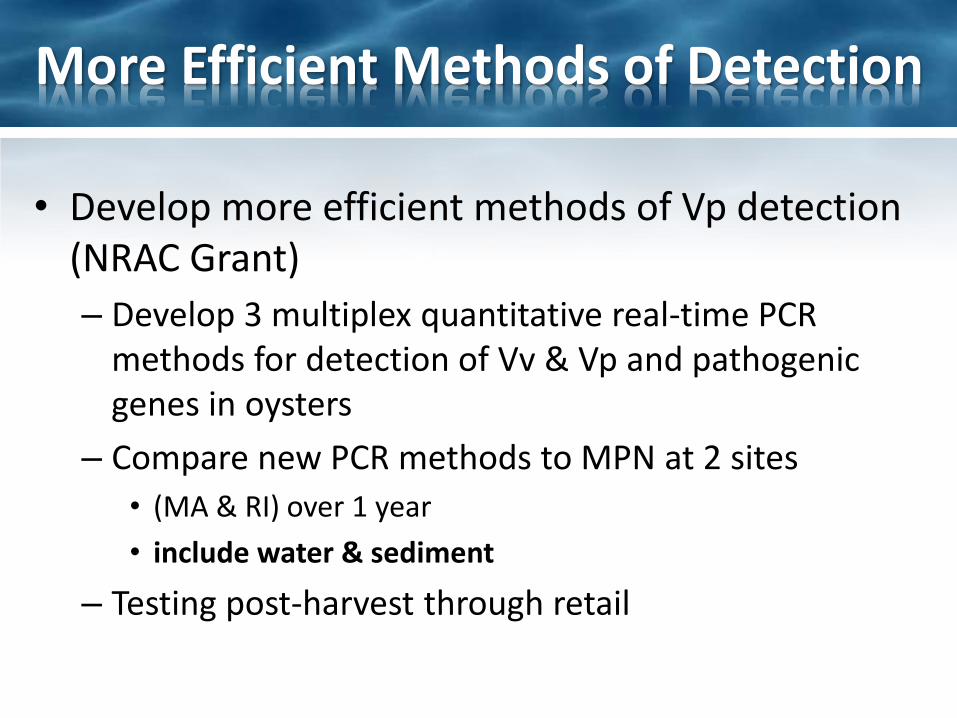
More Efficient Methods of Detection
• Develop more efficient methods of Vp detection (NRAC Grant)
– Develop 3 multiplex quantitative real-time PCR methods for detection of Vv & Vp and pathogenic genes in oysters
– Compare new PCR methods to MPN at 2 sites
• (MA & RI) over 1 year
• include water & sediment
– Testing post-harvest through retail
Thank-you!
Diane Murphy Fisheries & Aquaculture Specialist Woods Hole Sea Grant & Cape Cod Cooperative Extension Box 367 Barnstable, MA 02630 508-375-6953 [email protected]