Well-to-Wheels Analysis of Landfill Gas-Based Pathways and Their
65
ANL/ESD/10-3 Well-to-Wheels Analysis of Landfll Gas-Based Pathways and Their Addition to the GREET Model Energy Systems Division
Transcript of Well-to-Wheels Analysis of Landfill Gas-Based Pathways and Their

ANLESD10-3
Well-to-Wheels Analysis of Landfill Gas-Based Pathways and Their Addition to the GREET Model
Energy Systems Division
About Argonne National Laboratory Argonne is a US Department of Energy laboratory managed by UChicago Argonne LLC under contract DE-AC02-06CH11357 The Laboratoryrsquos main facility is outside Chicago at 9700 South Cass Avenue Argonne Illinois 60439 For information about Argonne and its pioneering science and technology programs see wwwanlgov
Availability of This Report This report is available at no cost at httpwwwostigovbridge It is also available on paper to the US Department of Energy and its contractors for a processing fee from US Department of EnergyOffice of Scientific and Technical InformationPO Box 62Oak Ridge TN 37831-0062phone (865) 576-8401fax (865) 576-5728reportsadonisostigov
Disclaimer This report was prepared as an account of work sponsored by an agency of the United States Government Neither the United States Government nor any agency thereof nor UChicago Argonne LLC nor any of their employees or officers makes any warranty express or implied or assumes any legal liability or responsibility for the accuracy completeness or usefulness of any information apparatus product or process disclosed or represents that its use would not infringe privately owned rights Reference herein to any specific commercial product process or service by trade name trademark manufacturer or otherwise does not necessarily constitute or imply its endorsement recommendation or favoring by the United States Government or any agency thereof The views and opinions of document authors expressed herein do not necessarily state or reflect those of the United States Government or any agency thereof Argonne National Laboratory or UChicago Argonne LLC
ANLESD10-3
Well-to-Wheels Analysis of Landfill Gas-Based Pathways and Their Addition to the GREET Model
by M Mintz J Han M Wang and C Saricks Center for Transportation Research Energy Systems Division Argonne National Laboratory
May 2010
CONTENTS
ACKNOWLEDGMENTS vii
EXECUTIVE SUMMARY 1
1 INTRODUCTION 2
11 Background 2 12 US Natural Gas Resources 3 13 Natural Gas as a Vehicle Fuel 5 14 Renewable Natural Gas and GHG Emissions 5 15 Fuel Cycle Analysis 5 16 Scope 6
2 LANDFILL GAS 7
21 Resource Base 7 22 Resource Development 10 23 Additions to the Resource Base 10 24 Landfill Gas Composition 11
3 FUEL CYCLE ANALYSIS OF LANDFILL-GAS-BASED PATHWAYS 13
31 LFG Reference Case 13 311 Flaring versus Venting Landfill Gas 13 312 Carbon Fate in LFG Fossil NG and Petroleum Fuel Cycles 15
32 Overview of LFG-to-CNGLNG Fuel Cycle 17 33 Gas Collection 18 34 Natural Gas Production 18
341 Pre-Purification 19 342 CO2 Removal 19 343 Process Efficiency 21 344 Energy Use Accounting 22
35 On-Site Power Generation 22 351 Technologies 23 352 Criteria Pollutant Emissions 23
36 Liquefaction 24 37 Transportation and Distribution 25
371 Transportation and Distribution of CNG 25 372 Transportation and Distribution of LNG 26
38 Vehicle Operation 26
iii
CONTENTS (CONT)
4 RESULTS AND DISCUSSION 28
41 Energy and Greenhouse Gas Emission Rates 28 411 WTW Energy 28 412 WTW Fossil Energy 30 413 WTW Greenhouse Gas Emissions 32
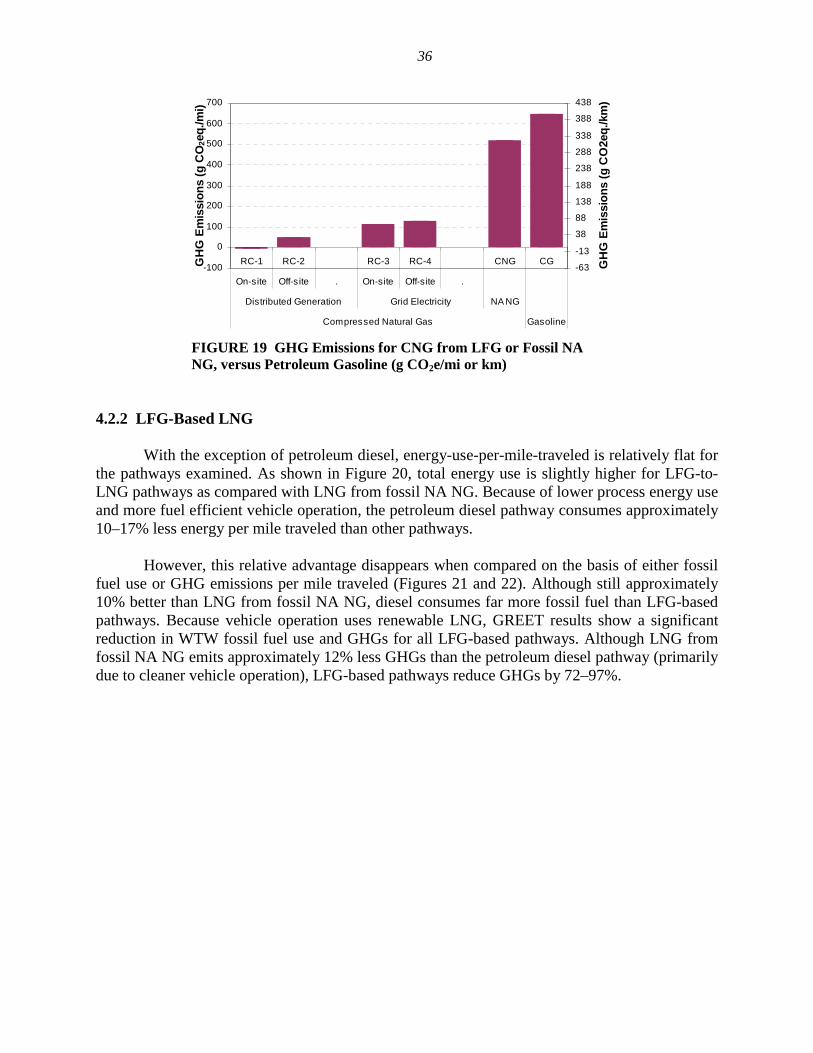
42 Energy and Greenhouse Gas Emissions per Mile Traveled 34 421 LFG-Based CNG 34 422 LFG-Based LNG 36
43 Balancing Energy Efficiency with Greenhouse Gas Emissions 38 44 Co-Product and Renewable Energy Credits 39
441 Carbon Dioxide 39 442 Renewable Energy Credits and Other Incentives 40
45 Criteria Pollutant Emissions 41
5 CONCLUSIONS 42
6 REFERENCES 44
APPENDIX A SMALL-SCALE NATURAL GAS LIQUEFACTION 49
APPENDIX B CRITERIA POLLUTANTS 52
FIGURES
1 Natural Gas Reserve Additions as Percent of Annual Production 1997ndash2007 3
2 Pipeline Capacity Additions 1998ndash2008 4
3 Disposition of Municipal Solid Waste 1960ndash2007 8
4 Typical Landfill Gas Production and Recovery Profile 9
5 Operational LFG-to-Energy Projects and Candidate Landfills by State 11
6 Fuel Cycle for Landfill-Gas-Based CNG and LNG as Used in GREET Modeling 14
7 CO2 Equivalent Emissions of Flaring versus Venting Landfill Gas 15
8 CO2 Emissions in LFG-to-CNGLNG Fuel Cycle 16
iv
FIGURES (CONT)
9 CO2 Emissions in Fossil NG-to-CNGLNG Fuel Cycle 16
10 CO2 Emissions in Petroleum GasolineDiesel Fuel Cycle 16
11 Gas Processing Cost (GPC) Associated with 1- 2- and 3-Stage Membranes 20
12 CO2 Washreg Process 21
13 NG Processing Efficiencies of LFG-Based Projects Producing Vehicle Fuel 22
14 WTP PTW and WTW Energy Use for LFG-to-CNGLNG Pathways versus Fossil NG-to-CNGLNG Gasoline and Diesel Pathways 29
15 WTW Fossil Fuel Use for LFG-Based Pathways versus NA NG and Petroleum Gasoline and Diesel Pathways 31
16 WTW GHG Emissions for LFG-Based Pathways Compared with NA NG and Petroleum Gasoline and Diesel Pathways 33
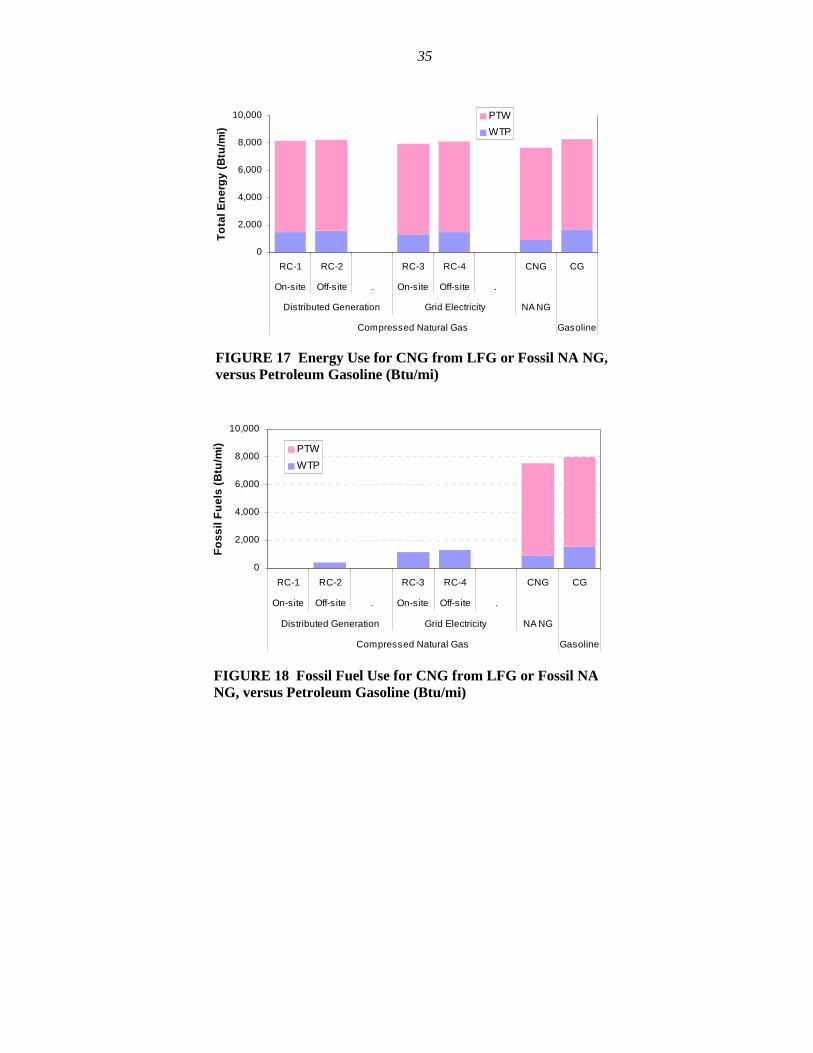
17 Energy Use for CNG from LFG or Fossil NA NG versus Petroleum Gasoline 35
18 Fossil Fuel Use for CNG from LFG or Fossil NA NG versus Petroleum Gasoline 35
19 GHG Emissions for CNG from LFG or Fossil NA NG versus Petroleum Gasoline 36
20 Energy Use for LNG from LFG or Fossil NA NG versus Petroleum Diesel 37
21 Fossil Fuel Use for LNG from LFG or Fossil NA NG versus Petroleum Diesel 37
22 GHG Emissions for LNG from LFG or Fossil NA NG versus Petroleum Diesel 38
A-1 Schematics of NG Liquefaction Processes 49
B-1 CO Emissions for LFG-Based Pathways Compared with NA NG and Petroleum Gasoline and Diesel Pathways 52
B-2 NOx Emissions for LFG-Based Pathways Compared with NA NG and Petroleum Gasoline and Diesel Pathways 53
B-3 PM10 Emissions for LFG-Based Pathways Compared with NA NG and Petroleum Gasoline and Diesel Pathways 53
v
FIGURES (CONT)
B-4 PM25 Emissions for LFG-Based Pathways Compared with NA NG and Petroleum Gasoline and Diesel Pathways 54
B-5 SOx Emissions for LFG-Based Pathways Compared with NA NG and Petroleum Gasoline and Diesel Pathways 54
TABLES
1 Distribution of Municipal Solid Waste 1960ndash2007 8
3 Assumptions for LFG-Based CNGLNG Fossil CNGLNG and
4 Emission Factors for LFG-Fueled IC Engines LFG Flares and
2 Composition and Characteristics of Biomethane and Fossil Natural Gas 12
Petroleum Pathways 17
US Power Generation 24
5 Plant Efficiencies of NG Liquefaction Technologies 25
6 Emission Factors for Diesel- and LNG-Fueled Heavy-Duty Trucks 27
7 WTW Total Energy Use for LFG-to-CNG Pathways by Stage 30
8 WTW Total Energy Use for LFG-to-LNG Pathways by Stage 30
9 WTW Fossil Fuel Use for LFG-to-CNG Pathways by Stage 31
10 WTW Fossil Fuel Use for LFG-to-LNG Pathways by Stage 32
11 WTW GHG Emissions for LFG-to-CNG by Pathway Stage 33
12 WTW GHG Emissions for LFG-to-CNG by Pathway Stage 33
13 WTW GHG Emissions for LFG-to-LNG by Pathway Stage 34
14 WTW GHG Emissions for LFG-to-LNG by Pathway Stage 34
A-1 Process and Train Efficiencies of Major NG Liquefaction Processes 50
vi
ACKNOWLEDGMENTS
The authors gratefully acknowledge Dennis Smith National Clean Cities Director and Vehicle Technologies Deployment Manager at the US Department of Energy who supported this effort They also acknowledge the assistance of Jeffrey Hahn of Covanta-Haverhill Inc and Andrew Burnham Amgad Elgowainy and Thomas Wallner of Argonnersquos Center for Transportation Research who provided their time and expertise to analyze and interpret data and advise us of its strengths and limitations Stephanie Young (formerly of the California Integrated Waste Management Board) Scott Walker of the California Department of Resources and Recovery (CalRecycle) Chuck White of Waste Management Inc and John Barclay of Prometheus Energy who provided access to documents and other resources and Rachel Goldstein of USEPA Jeffrey Clarke of NGVAmerica and Sean Turner of Gladstein Neandross amp Associates who reviewed an earlier draft of this report Thank you all
vii
viii
1
WELL-TO-WHEELS ANALYSIS OF LANDFILL GAS-BASED PATHWAYS AND THEIR ADDITION TO THE GREET MODEL
Marianne Mintz Jeongwoo Han Michael Wang and Christopher Saricks
EXECUTIVE SUMMARY
Today approximately 300 million standard cubic ftday (mmscfd) of natural gas and 1600 MW of electricity are produced from the decomposition of organic waste at 519 US landfills (EPA 2010a) Since landfill gas (LFG) is a renewable resource this energy is considered renewable When used as a vehicle fuel compressed natural gas (CNG) produced from LFG consumes up to 185000 Btu of fossil fuel and generates from 15 to 184 kg of carbon dioxide-equivalent (CO2e) emissions per million Btu of fuel on a ldquowell-to-wheelrdquo (WTW) basis This compares with approximately 11 million Btu and 782 kg of CO2e per million Btu for CNG from fossil natural gas and 12 million Btu and 975 kg of CO2e per million Btu for petroleum gasoline Because of the additional energy required for liquefaction LFG-based liquefied natural gas (LNG) requires more fossil fuel (222000ndash227000 Btumillion Btu WTW) and generates more GHG emissions (approximately 22 kg CO2e MM Btu WTW) if grid electricity is used for the liquefaction process However if some of the LFG is used to generate electricity for gas cleanup and liquefaction (or compression in the case of CNG) vehicle fuel produced from LFG can have no fossil fuel input and only minimal GHG emissions (15ndash77 kg CO2e MM Btu) on a WTW basis Thus LFG-based natural gas can be one of the lowest GHG-emitting fuels for light- or heavy-duty vehicles
This report discusses the size and scope of biomethane resources from landfills and the pathways by which those resources can be turned into and utilized as vehicle fuel It includes characterizations of the LFG stream and the processes used to convert low-Btu LFG into high-Btu renewable natural gas (RNG) documents the conversion efficiencies and losses of those processes the choice of processes modeled in GREET and other assumptions used to construct GREET pathways and presents GREET results by pathway stage GREET estimates of well-toshypump (WTP) pump-to-wheel (PTW) and WTW energy fossil fuel and GHG emissions for each LFG-based pathway are then summarized and compared with similar estimates for fossil natural gas and petroleum pathways
2
1 INTRODUCTION
Renewable energy is a growing part of the US energy mix rising from 4076 trillion Btu (64 of total energy production) in 1970 to approximately 6800 trillion Btu (95 of total energy production) in 2007 (EIA 2009a) To meet goals for reducing import dependence and greenhouse gas emissions major efforts are under way to increase production of wind solar geothermal and ldquonext-generationrdquo biofuels from energy crops agricultural residues wood waste and other organic materials Although the spotlight tends to focus on sophisticated new technologies ldquolow-techrdquo processes (like anaerobic digestion) have long produced renewable fuel Biomethane from municipal solid waste (MSW) deposited in sanitary landfills is one such option Comprising roughly one-half of the gaseous mixture known as landfill gas (LFG) this renewable energy source has only recently begun to be recovered in the United States In the past standard procedure was to either vent the gas or capture and flare it in a collection system (along with the other constituents in the mixture) While flaring reduces the global warming potential (GWP) of the LFG stream by a factor of eight it fails to utilize the approximately 500 Btustandard cubic ft (scf) in the stream1
Today 519 landfills recover energy from landfill gas (EPA 2010a) Projects range from small internal combustion engines or microturbines using LFG to generate power for site electrical needs to multiple generation units supporting site needs and exporting excess power to the grid A few projects use power (generated on-site from the LFG or purchased from the electric grid) to purify the LFG stream convert it into pipeline-quality natural gas (NG) and pressurize it either for injection into the NG pipeline system or use as a vehicle fuel A handful of projects liquefy the natural gas to fuel buses or refuse trucks or to be sold into the bulk liquefied natural gas (LNG) market These latter options mdash producing compressed natural gas (CNG) or LNG and using it as a vehicle fuel or for injection into the pipeline system mdash are the focus of this report
11 BACKGROUND
This project was undertaken in response to growing interest in applying well-to-wheels (WTW) analysis to renewable fuels There are many motivations for this interest Utilities are interested in identifying and pursuing options to meet renewable energy mandates States considering low carbon fuel standards are interested in promoting lower carbon options many of which are also renewable The US Environmental Protection Agency (EPA) is interested in reducing landfill emissions by assisting in LFG energy project development The US Department of Energy (DOE) is interested in providing information and guidance to support transparent objective comparisons of alternative fuel productiondeliveryutilization pathways
There is also continued interest in reducing reliance on foreign energy sources Natural gas is a clean-burning domestic resource that produces fewer greenhouse gases (GHGs) per unit than petroleum gasoline or diesel Supplies of this lower carbon fuel are plentiful now and likely
1 See Section 311 for a discussion of net reductions in greenhouse gases (GHGs) and GWP achieved from flaring landfill gas
3
to remain so for the foreseeable future (see Section 12) Moreover if sizable quantities of LFG-based NG were added to the NG fuel ldquopoolrdquo the carbon content of that pool could be reduced rendering NG an even more attractive fuel choice
This project applies WTW analysis to several LFG-based pathways Energy consumption and GHG emissions for each of those pathways are quantified and compared with petroleum gasoline and North American natural gas (NA NG) pathways for producing distributing and utilizing the respective fuel in motor vehicles This study is supported by DOErsquos Office of Vehicle Technologies (OVT) The OVT has long supported research on technologies to produce natural gas as a vehicle fuel engine modifications to better utilize natural gas fuel and analysis to determine the impacts of natural gas-based vehicle fuels Some of that work in support of pilot projects to demonstrate LFG-based vehicle fuel production is included in the data base developed for this study
12 US NATURAL GAS RESOURCES
In the past decade advanced ldquohorizontal drillingrdquo technology and historically high natural gas prices have spurred domestic drilling activity in turn increasing natural gas reserves and motivating developers to seek new markets for natural gas US annual reserve additions have grown from a level where they barely kept up with NG production to one that is now more than double production (Figure 1) Most of these new reserves are from so-called unconventional sources primarily coal-bed methane and shale gas each of which now accounts for 9 of US proved NG reserves (EIA 2008) By year-end 2007 the United States had 2377 trillion cubic feet (tcf) of proved reserves of dry natural gas the highest year-end volume in the 31 years that EIA (2008) has published such estimates
FIGURE 1 Natural Gas Reserve Additions as Percent of Annual Production 1997ndash2007 (EIA 2008)
4
In concert with vigorous exploration and production activity NG pipeline construction has climbed to connect new supplies to the existing gas distribution infrastructure as well as to expand distribution capacity system wide In 2008 pipeline capacity increased by four times the average for the prior decade (Figure 2)
FIGURE 2 Pipeline Capacity Additions 1998ndash2008 (EIA 2009b)
With increased reserves and distribution capacity developers are looking for new natural gas markets One possibility is to replace conventional coal-fired power plants with NG-fueled integrated-gasification-combined-cycle power plants2 Another is to replace motor gasoline or diesel with lower-carbon natural gas This latter option could be particularly attractive if the intent is to achieve deep CO2 cuts in sectors that currently have few economic low-carbon alternatives Transportation is one such sector Resource developers like TB Pickens (2009) have targeted transportation vehicles as a potential new market for natural gas Although compressed natural gas (CNG) -fueled vehicles have been available for many years the lack of a widespread public fueling infrastructure has limited their appeal to all but centrally fueled fleets Even then many centrally fueled fleets have been reluctant to invest in additional fueling infrastructure and vehicles with uncertain resale values
Uncertainty has been an especially strong barrier to the market acceptance of NG-fueled motor vehicles Transit operatorsrsquo need to meet ever-tougher exhaust emissions standards has spurred them to consider CNG or LNG-fueled buses However other technologies mdash like hybrids and a new generation of low-emission diesels mdash may also meet the standards With no clear technology ldquowinnerrdquo the looming prospect of a low-carbon fuel standard may be a persuasive argument for NG particularly from low-carbon sources like landfill gas
2 Note however that this option is most attractive when the difference between the cost of electricity and the cost of the fuel required to produce electricity is relatively small Called the ldquospark spreadrdquo this difference narrowed over the past decade but has increased since 2007
5
13 NATURAL GAS AS A VEHICLE FUEL
Historically natural gas has been used mostly for power production space heating industrial processes and as a petrochemical feedstock In the past decade however its relatively low emissions (as compared with diesel engines in internal combustion engines) have made it increasingly attractive as an urban bus fuel especially in California where emission standards for nitrous oxides (NOx) and particulate matter (PM) are particularly stringent To use natural gas as a vehicle fuel many transit operators have replaced diesel buses with CNG buses containing a new generation of spark-ignited engines Fueling generally relies on existing local distribution pipelines to deliver the gas under relatively low pressure compressors to increase the pressure to roughly 3600 psi for on-site storage and storagedispensing systems to load the gas onto vehicles at 3000ndash3600 psi Fleets that are not served by natural gas pipelines or that must travel a longer distance between fueling usually use liquefied natural gas (LNG) which is generally delivered in cryogenic tank trucks
Spurred by Californiarsquos Low Carbon Fuel Standard and the possibility of a similar national standard there is increasing interest in vehicle fuels with lower carbon footprints CNG and LNG derived from landfill gas are particularly promising For each million Btu of energy petroleum diesel contains 21600 grams of carbon while North American fossil-derived natural gas (NA NG) contains 16200 grams If only vehicle operation is taken into account on a Btu-to-Btu displacement basis switching from petroleum diesel to NA fossil-based CNG can reduce carbon emissions by 25 (assuming comparable operating efficiencies) As shown in Section 31 switching from NA fossil-based CNG to LFG-based CNG can reduce carbon emissions much more
14 RENEWABLE NATURAL GAS AND GHG EMISSIONS
Natural gas derived from LFG is considered a renewable fuel since the original source of the carbon in the decomposed waste can be traced back to organic sources that naturally replenish it It is also a low-carbon fuel Whether in the form of CNG or LNG LFG-based NG has negative GHG emissions since its conversion to vehicle fuel displaces GHG emissions that would have occurred if the LFG had been oxidized into CO2 in the landfill flare
Renewable natural gas is particularly attractive to utilities subject to renewable fuel mandates LFG-based CNG or LNG is attractive to fleet operators in states with low-carbon fuel standards Since natural gas is fungible the entity purchasing the rights to a supply of LFG-based NG need not take physical possession of it to gain renewable fuel credits
15 FUEL CYCLE ANALYSIS
To understand a fuelrsquos impact the entire fuel cycle mdash from production of raw materials to delivery and end use mdash must be considered This requires a systematic accounting of the energy and emissions of each stage in the cycle from ldquowellrdquo to ldquowheelrdquo (WTW) This study was undertaken to characterize pathways for producing vehicle fuel from landfill gas estimate WTW
6
energy and GHG emissions at each stage in these pathways and compare results with petroleum-and fossil NG-based alternatives In this context the ldquowellrdquo is the landfill gas resource and the ldquowheelrdquo is the vehicle consuming the fuel
The analysis was conducted by using the GREET (Greenhouse gases Regulated Emissions and Energy use in Transportation) model created by Argonne National Laboratory Developed in Microsoftreg Excel with a graphical user interface GREET is structured to systematically account for a range of potential feedstocks fuels and conversion processes for any defined WTW pathway Downloadable at httpwwwtransportationanlgov modeling_simulationGREET GREET calculates emissions of three greenhouse gases (CO2 CH4 and N2O) and six criteria pollutants (VOC CO NOx SOx PM10 and PM25) and consumption of each of the following total energy fossil fuel petroleum natural gas and coal
In the years since its development GREET has become a familiar and respected tool for evaluating vehicle technologies and fuels on a consistent systematic basis Working with industry and government experts Argonne continues to upgrade and update the GREET model With support from the US Department of Energy (DOE) Argonne has added a number of hydrogen production pathways for stationary and mobile internal combustion engine and fuel cell applications and extensive simulations of biofuel production pathways Most recently Argonne has upgraded simulations of plug-in hybrid electric vehicles (PHEVs) in GREET The most recent GREET fuel-cycle model (GREET18d0) was released in June 2010 Currently there are more than 10000 registered GREET users
16 SCOPE
As stated above this report documents the conceptual approach data and initial results for a set of LFG-to-vehicle fuel pathways These landfill gas-based pathways have been added to GREET 18d0
The report itself is organized into five sections supplemented by two appendices Following this brief Introduction Section 2 describes the size and characteristics of the LFG resource base while Section 3 discusses WTW pathways their key stages and important features of the fuel cycle analysis In Sections 4 and 5 estimates of well-to-wheel (WTW) fossil fuel use and GHG emissions are presented and conclusions are discussed Appendix A provides additional detail on liquefaction assumptions and Appendix B presents estimates of WTW emissions of criteria pollutants
7
2 LANDFILL GAS
At present most of the biomethane generated at US landfills is flared in conjunction with emissions-abatement practices (For further discussions of flaring and ldquoreference caserdquo assumptions see Sections 21 and 31) Relative to venting flaring reduces criteria pollutant and GHG emissions but it captures none of the energy (approximately 500 Btuscf) in the gas that is burned3 Moreover by destroying a valuable energy resource it precludes the generation of additional revenue by the landfill owner ndash either as energy sales or in various forms of carbon and renewable energy credits For these reasons there is increasing interest in converting methane in the collected LFG into usable energy like natural gas hydrogen methanol ethanol or electricity This study investigates the potential for WTW energy and GHG emission benefits as the result of producing LFG-based natural gas for vehicle use
21 RESOURCE BASE
Since the mid-1960s sanitary landfills have been the main disposal method for municipal solid waste (MSW) in the United States In 2007 there were an estimated 1754 ldquoactiverdquo landfills accepting 137 million tons of waste annually or approximately 54 of the total MSW generated in the United States (EPA 2008)4 As shown in Table 1 and Figure 3 this share has been dropping steadily since 1960
An additional 6000 landfills are inactive (ie no longer receiving waste) 5 Over their lifetime landfills produce significant quantities of landfill gas (LFG) primarily methane (CH4) and carbon dioxide (CO2) from the anaerobic decomposition of organic materials which typically comprise some 60 of the waste-to-landfill stream The EPA actively monitors emission compliance and energy recovery at active landfills the latter through its Landfill Methane Outreach Program (LMOP) Figure 4 produced from a model developed by EPArsquos LMOP illustrates a typical LFG generation and recovery profile for a site opened in 1980 at which peak recovery occurs in 2014 (EPA 2008) In conventional landfills gas recovery typically begins a decade or more after the waste is deposited and continues for several decades In newer designs (eg conventional cells with leachate circulation bioreactors or anaerobic
3 In 1994 EPA created the Landfill Methane Outreach Program (LMOP) to help reduce methane emissions from landfills by encouraging the recovery and use of landfill gas (LFG) as an energy resource LMOP is a voluntary program to promote alliances among states energy users and providers landfill owners and operators and communities by providing information analysis and support for LFG-to-energy projects
4 The other 46 consists of construction waste from new construction or remodeling activities debris from the demolition of buildings and roads industrial waste from manufacturing processes and wastes banned from the MSW waste stream (including MSW ash and medical waste)
5 Inactive landfills must comply with EPA post-closure requirements which include monitoring and maintaining waste containment systems and monitoring groundwater to ensure that waste is not escaping and polluting the surrounding environment These activities are generally required for 30 years from site closure During this time inactive landfills continue to emit methane and other gases At larger landfills equipped with gas collection systems LFG is usually captured and flared in a thermal oxidizer At smaller landfills LFG is usually uncontrolled
8
TABLE 1 Distribution of Municipal Solid Waste 1960ndash2007 (EPA 2008)
Percent of Total Generation
Activity 1960 1970 1980 1990 2000 2004 2005 2006 2007
Generation 100 100 100 100 100 100 100 100 100 Recovery for recycling 64 66 96 142 221 230 235 241 249 Recovery for compostinga Neg Neg Neg 20 69 82 82 82 85 Total materials recovery 64 66 96 162 290 312 317 323 334 Combustion with energy recoveryb 00 03 18 145 141 126 126 126 126 Discards to landfill other disposalc 936 931 886 693 569 562 557 551 540
Pounds per Person per Day
Activity 1960 1970 1980 1990 2000 2004 2005 2006 2007
Generation 268 325 366 450 465 466 463 465 462 Recovery for recycling 017 022 035 064 103 107 109 112 115 Recovery for compostinga Neg Neg Neg 009 032 038 038 038 039 Total materials recovery 017 022 035 073 135 145 147 150 154 Combustion with energy recoveryb 000 001 007 065 066 059 058 058 058 Discards to landfill other disposalc 251 302 324 312 264 262 258 257 250
a Includes composting of yard trimmings food scraps and other MSW organic material excludes backyard composting
b Includes combustion of MSW in mass burn or refuse-derived fuel form and combustion with energy recovery of source-separated materials in MSW (eg wood pallets and tire-derived fuel)
c Discards after recovery minus combustion with energy recovery Discards include combustion without energy recovery Details may not add to totals due to rounding
FIGURE 3 Disposition of Municipal Solid Waste 1960ndash2007 (EPA 2008)
9
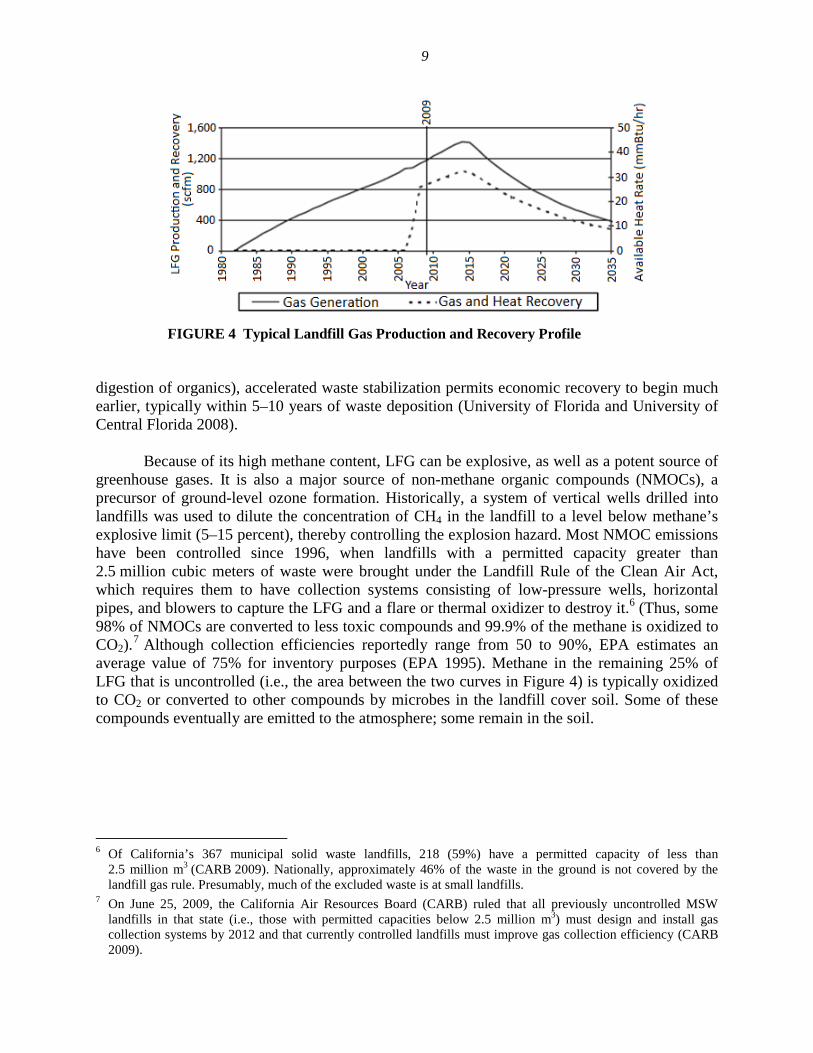
FIGURE 4 Typical Landfill Gas Production and Recovery Profile
digestion of organics) accelerated waste stabilization permits economic recovery to begin much earlier typically within 5ndash10 years of waste deposition (University of Florida and University of Central Florida 2008)
Because of its high methane content LFG can be explosive as well as a potent source of greenhouse gases It is also a major source of non-methane organic compounds (NMOCs) a precursor of ground-level ozone formation Historically a system of vertical wells drilled into landfills was used to dilute the concentration of CH4 in the landfill to a level below methanersquos explosive limit (5ndash15 percent) thereby controlling the explosion hazard Most NMOC emissions have been controlled since 1996 when landfills with a permitted capacity greater than 25 million cubic meters of waste were brought under the Landfill Rule of the Clean Air Act which requires them to have collection systems consisting of low-pressure wells horizontal pipes and blowers to capture the LFG and a flare or thermal oxidizer to destroy it6 (Thus some 98 of NMOCs are converted to less toxic compounds and 999 of the methane is oxidized to CO2)
7 Although collection efficiencies reportedly range from 50 to 90 EPA estimates an average value of 75 for inventory purposes (EPA 1995) Methane in the remaining 25 of LFG that is uncontrolled (ie the area between the two curves in Figure 4) is typically oxidized to CO2 or converted to other compounds by microbes in the landfill cover soil Some of these compounds eventually are emitted to the atmosphere some remain in the soil
6 Of Californiarsquos 367 municipal solid waste landfills 218 (59) have a permitted capacity of less than 25 million m3 (CARB 2009) Nationally approximately 46 of the waste in the ground is not covered by the landfill gas rule Presumably much of the excluded waste is at small landfills
7 On June 25 2009 the California Air Resources Board (CARB) ruled that all previously uncontrolled MSW landfills in that state (ie those with permitted capacities below 25 million m3) must design and install gas collection systems by 2012 and that currently controlled landfills must improve gas collection efficiency (CARB 2009)
10
22 RESOURCE DEVELOPMENT
As of April 2010 EPA reports that 519 projects are recovering energy from landfills (EPA 2010a) More than 70 of these projects generate power most of the others minimally process the LFG and use it in boilers or various manufacturing applications (Godlove 2010) Approximately 13 billion kWh of electricity and 102 billion cubic feet (bcf) of natural gas are generated each year from recovered LFG (Godlove 2010) representing about 03 of US electricity and 03 of US natural gas consumption (EIA 2009a)
Some 32 projects currently convert LFG into high-Btu NG or ldquorenewable natural gasrdquo (RNG) mostly for injection into the pipeline system (Godlove 2010) A handful of these projects include vehicle fueling either as CNG or LNG (Ludwig 2009) In the past these latter projects have tended to be pre-commercial or pilot scale Now however several are coming on line at commercial scale or growing to commercial scale as second phases become operational These latter projects include
bull Altamont Landfill LFG-to-LNG in Livermore CA bull Frank R Bowerman Landfill LFG-to-LNG in Orange County CA bull Franklin County Landfill LFG-to-CNG in Columbus OH bull McCommas Bluff Landfill LFG-to-CNG and pipeline gas in Dallas TX bull Rumpke Landfill LFG-to-CNG and pipeline gas in Cincinnati OH
To the extent possible these projects are included in the database developed for this analysis Data on the following North American pilot-scale projects are also included in the database
bull Central Landfill LFG-to-CNG in Sonoma County CA bull Burlington County Landfill LFG-to-LNG in NJ bull Puente Hills Landfill LFG-to-CNG in Los Angeles CA bull Les Entreprises Berthier Inc (EBI) Landfill LFG-to-pipeline gas in Quebec bull Highland Valley Copper Landfill LFG-to-pipeline gas in Vancouver
Figure 5 shows operational LFG-to-energy projects as of April 2010 as well as landfills identified by the EPArsquos LMOP as candidates for future projects
23 ADDITIONS TO THE RESOURCE BASE
In addition to the ldquoin placerdquo LFG resource LFG continues to be generated by MSW decomposition Lear and Burdelski (2009) estimate that the current US population generates some 27 billion cubic ft (bcf) of ldquonewrdquo LFG each year equivalent to approximately 121 million gal of gasoline
11
FIGURE 5 Operational LFG-to-Energy Projects and Candidate Landfills by State (EPA 2010a)
24 LANDFILL GAS COMPOSITION
As shown in Table 2 methane (CH4) is the predominant constituent in both fossil natural gas and LFG Although gas composition varies from one site to another LFG typically contains around 45ndash50 methane (CH4) 35ndash40 carbon dioxide (CO2) and 10ndash15 nitrogen (N2) with smaller amounts of hydrogen (H2) oxygen (O2) hydrogen sulfide (H2S) and ammonia (NH3) The gas is usually saturated with water vapor
LFG may contain more than 500 different contaminants including a variety of sulfur compounds that are corrosive in the presence of water halogenated compounds (eg carbon tetrachloride chlorobenzene chloroform) that produce corrosive combustion products and organic silicon compounds (eg siloxanes) that form siliceous deposits in downstream applications mdash like internal combustion engines (Persson et al 2006) Thus an initial cleanup or pre-purification step is needed before LFG can be used in any application involving combustion
12
TABLE 2 Composition and Characteristics of Biomethane and Fossil Natural Gas
Parameter Unit EU LFG EU AD-Based
Biogas NG from NA
Gas Field NG from NNA
Gas Field NG distributed in
US
Source
LHV average range
Density average range
Btuft3
gft3
(Persson et al 2006)
406 584
348 321
1081 835ndash1336
224 195ndash279
(Segeler 1965)
1145 627ndash1717
1049 945ndash1121
239 195ndash369
215 203ndash246
CH4 average range
vol 45 36ndash65
63 53ndash70
515 847ndash988
770 228ndash980
894 728ndash952
H2 average vol 0-3 0 ndash ndash ndash
CO2 average range
vol 40 15ndash50
47 30ndash47
055 0ndash60
41 0ndash290
07 0ndash20
N2 average range
vol 15 5ndash40
02 ndash
403 0ndash294
17 0ndash121
29 0ndash171
O2 average range
vol 1 0ndash5
0 ndash
006 0ndash04
01 0ndash14
00 0ndash04
H2S average range
ppmv lt100 0ndash100
lt1000 0-10000
100 0ndash3100
400 0ndash5200
NMOC average (as Hexane) range
ppmv 1100 0ndash6600
2000 0ndash17000
400 0ndash1400
NH3 ppm 5 lt100 ndash ndash ndash
13
3 FUEL CYCLE ANALYSIS OF LANDFILL-GAS-BASED PATHWAYS
31 LFG REFERENCE CASE
The benchmark or reference case is critical to estimating the change in energy and emissions associated with introducing any new fuel or vehicle technology For fossil fuels the question is usually trivial mdash were it not for development of the resource to produce the new fuel energy and emissions would not occur Although process energy use and vehicle emissions may change in response to mandates requiring different fuel properties (eg low-sulfur diesel in place of conventional diesel or reformulated gasoline in place of unleaded gasoline) the resulting ldquonewrdquo fuel comes from the same feedstock as before and the benchmark or reference is the ldquooldrdquo fuel Thus the energy and GHG impact of the ldquonewrdquo fuel is simply the difference between the values associated with the ldquonewrdquo and ldquooldrdquo fossil fuels
This is not usually the case with renewable fuels If the feedstock historically has not been used to produce fuel the energy and GHG impact of the new fuel is the difference between energy and GHG emissions associated with the resourcersquos typical prior use (ie the pathway or reference case) and its new one With respect to landfill gas the key questions are
bull What is the typical prior use for LFG
bull Would the LFG have been produced in a conventional landfill gathered in a standard gas collection system and flared Or would it have been produced some other way With different constituents With more methane emitted to the atmosphere
bull At what point does the new LFG pathway diverge from the old
Since we are concerned with the difference in energy and GHG emissions between the two pathways the answer to the last of the above questions helps bound our system Shared stages can be ignored since they are in both ldquooldrdquo and ldquonewrdquo pathways Thus for example gas that continues to be flared (ldquoFlared LFGrdquo in Figure 6) is excluded from LFG-based pathways which are labeled as cases within the dashed system boundary shown in Figure 6
311 Flaring versus Venting Landfill Gas
Since the mid-1990s MSW landfills with a design capacity of 25 million m3 or more have been regulated under the Landfill Rule of the Clean Air Act (EPA 2000) To reduce emissions of volatile organic compounds air toxics and methane these large landfills are required to install collection wells into the landfill and route the gas to a suitable energy recovery or combustion device (flare) to monitor surface methane on a quarterly basis and to expand their collection systems if the methane concentration exceeds 500 parts per million
As shown in Figure 7 flaring dramatically reduces the impact of carbon contained in organic waste Emitted to the atmosphere as CH4 the carbon in the waste has a CO2 equivalence
14
of 368 emitted as CO2 the equivalence is reduced to 44 The resulting ratio (36844 = 836) is the relative benefit of flaring over venting the landfill gas
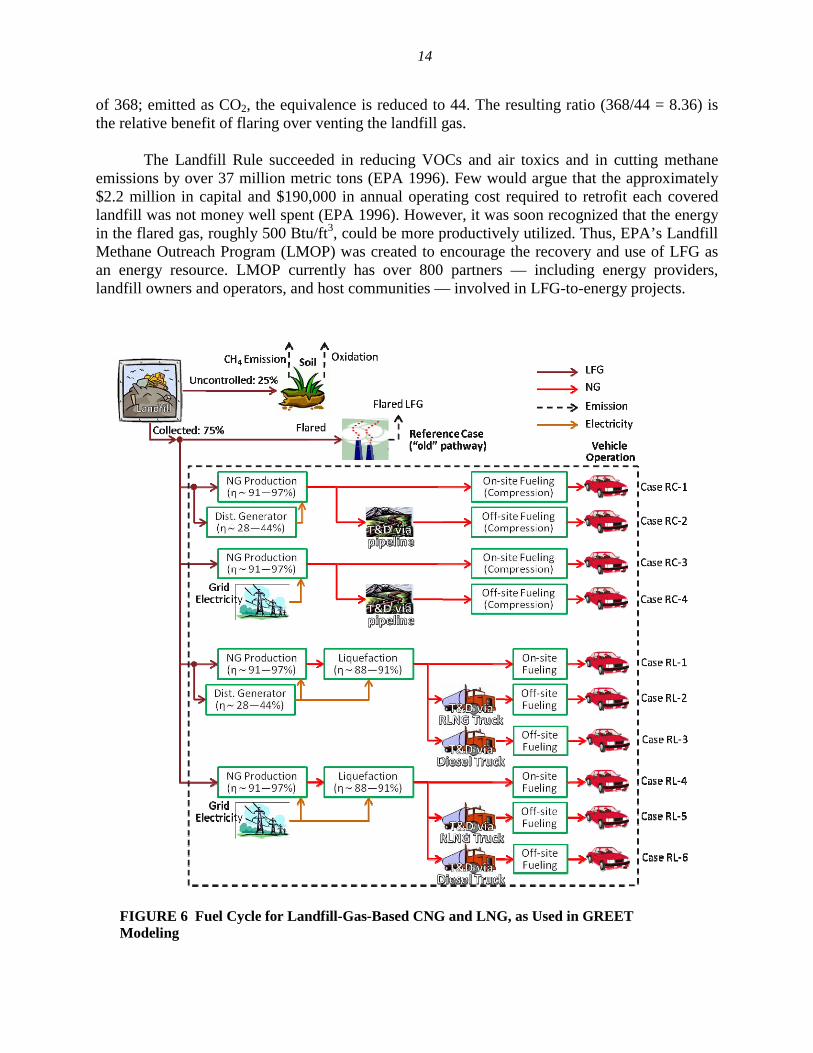
The Landfill Rule succeeded in reducing VOCs and air toxics and in cutting methane emissions by over 37 million metric tons (EPA 1996) Few would argue that the approximately $22 million in capital and $190000 in annual operating cost required to retrofit each covered landfill was not money well spent (EPA 1996) However it was soon recognized that the energy in the flared gas roughly 500 Btuft3 could be more productively utilized Thus EPArsquos Landfill Methane Outreach Program (LMOP) was created to encourage the recovery and use of LFG as an energy resource LMOP currently has over 800 partners mdash including energy providers landfill owners and operators and host communities mdash involved in LFG-to-energy projects
FIGURE 6 Fuel Cycle for Landfill-Gas-Based CNG and LNG as Used in GREET Modeling
15
FIGURE 7 CO2 Equivalent Emissions of Flaring versus Venting Landfill Gas
312 Carbon Fate in LFG Fossil NG and Petroleum Fuel Cycles
As discussed above flaring emits CO2 Purifying the LFG and converting it into CNG or LNG for vehicle fuel still emits CO2 However the CO2 would have been emitted anyway (hence there is no net addition) Moreover the CO2 from LFG displaces a near equivalent amount of CO2 from fossil fuels (natural gas or petroleum) that would have been emitted if the vehicles operating on LFG-derived CNGLNG had not been converted from their original fossil fuel
Figures 8ndash10 depict the various stages of the LFG fossil NG and petroleum fuel cycles showing where carbon is emitted to the atmosphere As discussed earlier the LFG fuel cycle (Figure 8) begins with gas collection which is assumed to capture 75 of the total LFG produced A portion of the collected carbon is assumed to be flared either in waste gas from the purification process or as excess LFG that cannot be processed Carbon is also emitted in transportation and distribution (TampD) and vehicle operation
For comparison purposes Figures 9 and 10 show fossil NG and petroleum fuel cycles As in the LFG fuel cycle carbon is emitted in feedstock production processingrefining TampD and vehicle operation
16
FIGURE 8 CO2 Emissions in LFG-to-CNGLNG Fuel Cycle
FIGURE 9 CO2 Emissions in Fossil NG-to-CNGLNG Fuel Cycle
FIGURE 10 CO2 Emissions in Petroleum GasolineDiesel Fuel Cycle
17
32 OVERVIEW OF LFG-TO-CNGLNG FUEL CYCLE
Figure 6 illustrates the 10 LFG-based pathways investigated in this study Shown within the dashed system boundary pathways include the resource mdash LFG collected by the gas collection system (discussed in Section 33) a cleanuppurification process to convert it into NG (discussed in Section 34) electricity from either an on-site generator or the grid assuming the US average generation mix (discussed in Section 35) and if fueling is off-site pipeline or truck delivery of the product NG to stations where it is compressed for vehicle fueling For pathways in which LNG is produced a liquefaction process (discussed in Section 36) occurs between production and transportation and distribution (TampD which is discussed in Section 37) Note that this fuel cycle is but a portion of the lifecycle of municipal solid waste
Table 3 summarizes the assumptions of each pathway The collected LFG is converted to NG via pre-purification and CO2 removal The NG production process usually requires electricity as a process fuel that can be delivered by an on-site distributed generator (RC-1 RC-2 RL-1 RL-2 and RL-3) or from the grid (RC-3 RC-4 RL-4 RL-5 and RL-6) During NG processing waste gases (including contaminants CO2 and unrecovered CH4) may be returned to the input stream or flared Since the waste gases are not involved in NG processing (ie they essentially flow through the process) they are subtracted from the LFG feed for modeling purposes Thus in all GREET-modeled pathways the LFG feed is assumed to include only CH4
converted into NG or used for on-site power generation
TABLE 3 Assumptions for LFG-Based CNGLNG Fossil CNGLNG and Petroleum Pathways
Case Transportation amp No Feedstock Fuel Electricity Source Fueling Distribution (TampD)
RC-1 LFG CNG Site Generation On-site NA RC-2 LFG CNG Site Generation Off-site Pipeline RC-3 LFG CNG US Average Mix On-site NA RC-4 LFG CNG US Average Mix Off-site Pipeline CNG NA NG CNG US Average Mix Off-site Pipeline CG Crude Gasoline US Average Mix Off-site Mixed Mode
RL-1 LFG LNG Site Generation On-site NA RL-2 LFG LNG Site Generation Off-site LNG Truck RL-3 LFG LNG Site Generation Off-site Diesel Truck RL-4 LFG LNG US Average Mix On-site NA RL-5 LFG LNG US Average Mix Off-site LNG Truck RL-6 LFG LNG US Average Mix Off-site Diesel Truck LNG NA NG LNG US Average Mix Off-site Pipeline LSD Crude Diesel US Average Mix Off-site Mixed Mode
18
For renewable CNG (RC cases in Figure 6) the produced gas is compressed by an electric compressor at a fuel station For on-site fueling cases (RC-1 and RC-3) the necessary electricity is supplied by the genset for off-site fueling cases (RC-2 and RC-4) electricity comes from the grid For renewable LNG (RL cases in Figure 6) the produced gas is liquefied by a small on-site liquefier NG production and liquefaction use the same power source (ie a distributed generator for RL-1 RL-2 and RL-3 and the grid for RL-4 RL-5 and RL-6) The produced liquid can be dispensed at an on-site fuel station (RL-1 and RL-4) or transported to off-site stations via LNG trucks (RL-2 and RL-5) or diesel trucks (RL-3 and RL-6) Note that LNG trucks are fueled by the LFG-based LNG
In this study energy and material inputs and outputs are characterized for the steps in the LFG-to-CNG and LFG-to-LNG fuel cycles in order to estimate overall energy and greenhouse gas emissions associated with pathways As with other GREET pathways results for LFG-based CNG and LNG are estimated in units of energy use and emissions per unit of consumed energy andor per mile driven with vehicles fueled with CNGLNG For ldquowell-to-pumprdquo (WTP) results this includes NG production transmission and distribution of the fuels for ldquowell-to-wheelsrdquo (WTW) results it includes WTP results plus consumption or emissions during vehicle operation Estimates are then compared with results for fossil North American natural gas (NA NG) and conventional petroleum pathways
Note that conventional NA NG and petroleum pathways start with energy in the unrecovered feedstock while the landfill gas pathway starts with energy in the collected feedstock (ie LFG) As pointed out in Brinkman et al (2005) the GREET model accounts for energy use at different starting points for different fuels For fossil fuels mdash such as NA NG gasoline diesel and electricity from fossil fuels mdash the accounting system starts with primary feedstock recovery In this study the energy in the collected LFG is not of concern because it would have been flared if not converted to NG Therefore landfill gas pathways start with the processing of collected LFG Details about the energy accounting are discussed in Section 344
33 GAS COLLECTION
As stated earlier pathways begin with a process stream of LFG which is assumed to be 75 of the total LFG produced (Figure 6) While this share is consistent with EPA assumptions it is not a critical parameter8 Instead of going to the flare a blower diverts the collected LFG to a cleanup unit
34 NATURAL GAS PRODUCTION
The NG production process includes pre-purification and purification (primarily CO2
removal) The processes can use similar technologies and are closely integrated in many cases Also the required process energy or process efficiency is often reported as an integrated process
8 Others claim that the average share of LFG collected is closer to 90 (Sullivan 2010) However because GREET pathways begin with the processing of collected LFG the share lies outside our fuel cycle system boundary and does not affect results
19
Therefore NG production efficiency in this study is defined as the energy in the produced NG divided by the sum of the energy in the LFG fed to the pre-purification step plus the process electricity for pre-purification and CO2 removal
341 Pre-Purification
The collected landfill gas must be treated to remove impurities before it enters the CO2
removal process Impurities include corrosive hydrogen compounds low concentrations (parts per million) of non-methane organic compounds (NMOCs including siloxane) and water As stated in 40 CFR Parts 72 and 75 the level of hydrogen sulfide (H2S) mdash a corrosive toxic and flammable gas with unpleasant odor mdash must be reduced to less than 5 ppm (or 03 g100 scf) for pipeline natural gas Many well-established processes (eg absorption adsorption and chemical and thermal oxidation)9 are available for H2S removal from gas fluxes (Syed et al 2006) One of the most common is an iron oxide-based sulfur scavenging process (Kohl and Nielsen 1997) in which hydrogen sulfide reacts with iron oxide to form iron sulfide while the landfill gas flows through granular iron-oxide in a bed The process is suitable for the treatment of relatively small volumes of gas For dehydration pressure swing adsorption (PSA) or refrigerated drying are widely used
The output mdash pre-purified landfill gas mdash can then be used to fuel an on-site power-generator providing electricity for CO2 removal and further conditioning steps as well as export power
342 CO2 Removal
The H2S-treated and dehydrated landfill gas is further purified by removing CO2 from the gas stream Four types of technologies are widely employed membrane separation adsorption absorption and cryogenic distillation To enhance the quality of the product fuel more than one technology may be used in series Further details are explained below
Membrane Separation
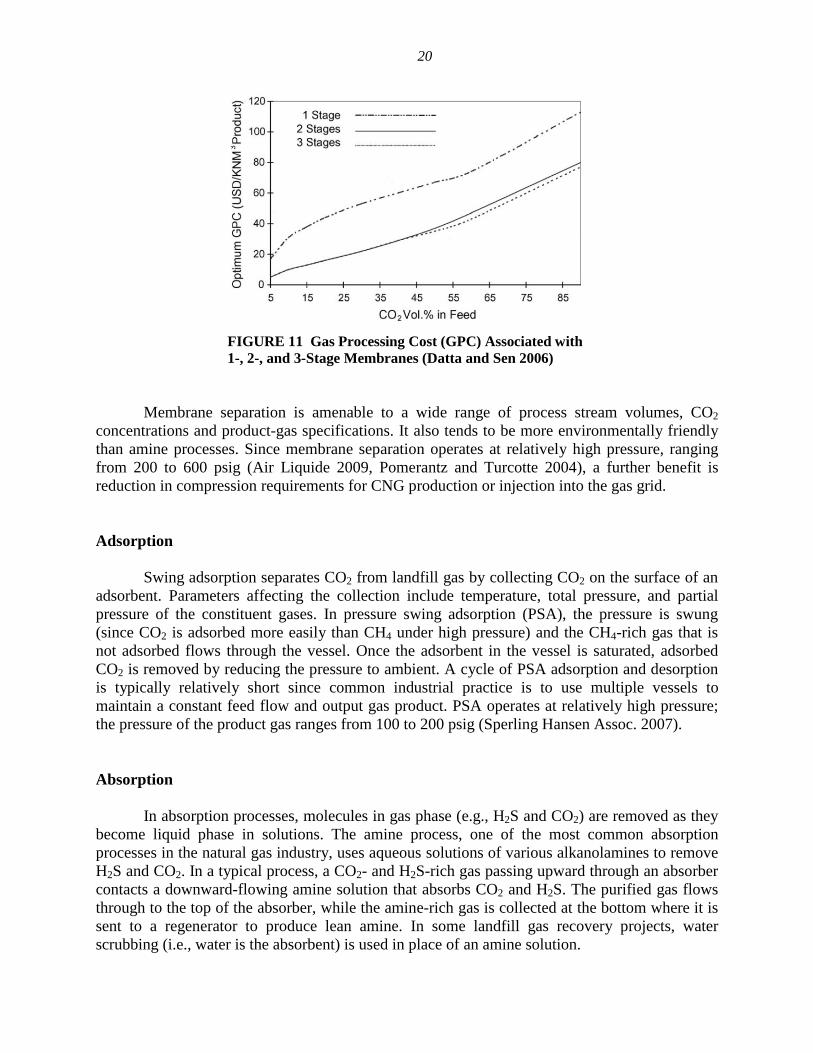
Since CO2 is more permeable than CH4 the two may be separated by selective permeation through membranes When the landfill gas contacts the membrane more CO2 than CH4 permeates although quantities depend on the partial pressure difference across the membrane As shown in Figure 11 CO2 concentration in the LFG feed affects the optimum number of membrane stages (Spillman 1995 Datta and Sen 2006) Since two-stage and three-stage membrane systems are more economical (in dollars per normal m3 of product gas) than single-stage systems a second membrane system or a secondary amine process is often used in landfill gas projects (Pomerantz and Turcotte 2004)
9 These same technologies are used in large-scale NG processing plants but with somewhat different sulfur scavenging processes
20
FIGURE 11 Gas Processing Cost (GPC) Associated with 1- 2- and 3-Stage Membranes (Datta and Sen 2006)
Membrane separation is amenable to a wide range of process stream volumes CO2
concentrations and product-gas specifications It also tends to be more environmentally friendly than amine processes Since membrane separation operates at relatively high pressure ranging from 200 to 600 psig (Air Liquide 2009 Pomerantz and Turcotte 2004) a further benefit is reduction in compression requirements for CNG production or injection into the gas grid
Adsorption
Swing adsorption separates CO2 from landfill gas by collecting CO2 on the surface of an adsorbent Parameters affecting the collection include temperature total pressure and partial pressure of the constituent gases In pressure swing adsorption (PSA) the pressure is swung (since CO2 is adsorbed more easily than CH4 under high pressure) and the CH4-rich gas that is not adsorbed flows through the vessel Once the adsorbent in the vessel is saturated adsorbed CO2 is removed by reducing the pressure to ambient A cycle of PSA adsorption and desorption is typically relatively short since common industrial practice is to use multiple vessels to maintain a constant feed flow and output gas product PSA operates at relatively high pressure the pressure of the product gas ranges from 100 to 200 psig (Sperling Hansen Assoc 2007)
Absorption
In absorption processes molecules in gas phase (eg H2S and CO2) are removed as they become liquid phase in solutions The amine process one of the most common absorption processes in the natural gas industry uses aqueous solutions of various alkanolamines to remove H2S and CO2 In a typical process a CO2- and H2S-rich gas passing upward through an absorber contacts a downward-flowing amine solution that absorbs CO2 and H2S The purified gas flows through to the top of the absorber while the amine-rich gas is collected at the bottom where it is sent to a regenerator to produce lean amine In some landfill gas recovery projects water scrubbing (ie water is the absorbent) is used in place of an amine solution
21
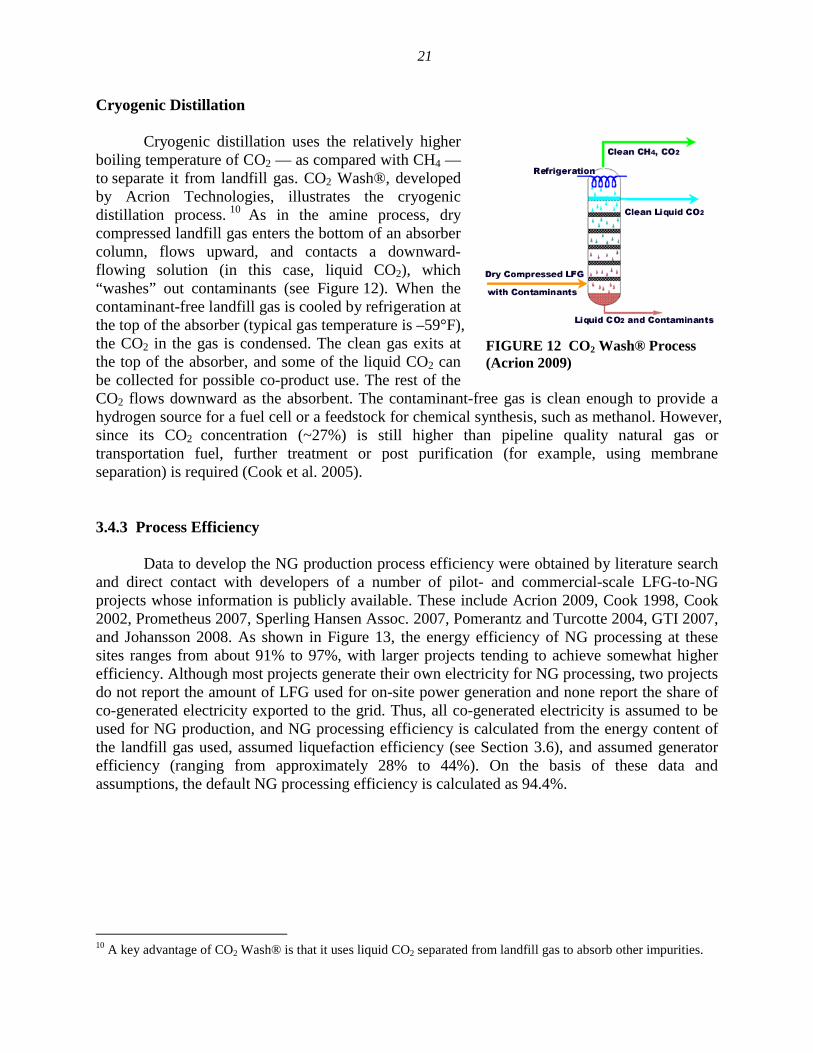
Cryogenic Distillation
Cryogenic distillation uses the relatively higher boiling temperature of CO2 mdash as compared with CH4 mdash to separate it from landfill gas CO2 Washreg developed by Acrion Technologies illustrates the cryogenic distillation process 10 As in the amine process dry compressed landfill gas enters the bottom of an absorber column flows upward and contacts a downward-flowing solution (in this case liquid CO2) which ldquowashesrdquo out contaminants (see Figure 12) When the contaminant-free landfill gas is cooled by refrigeration at the top of the absorber (typical gas temperature is ndash59degF) the CO2 in the gas is condensed The clean gas exits at the top of the absorber and some of the liquid CO2 can be collected for possible co-product use The rest of the CO2 flows downward as the absorbent The contaminant-free gas is clean enough to provide a hydrogen source for a fuel cell or a feedstock for chemical synthesis such as methanol However since its CO2 concentration (~27) is still higher than pipeline quality natural gas or transportation fuel further treatment or post purification (for example using membrane separation) is required (Cook et al 2005)
343 Process Efficiency
Data to develop the NG production process efficiency were obtained by literature search and direct contact with developers of a number of pilot- and commercial-scale LFG-to-NG projects whose information is publicly available These include Acrion 2009 Cook 1998 Cook 2002 Prometheus 2007 Sperling Hansen Assoc 2007 Pomerantz and Turcotte 2004 GTI 2007 and Johansson 2008 As shown in Figure 13 the energy efficiency of NG processing at these sites ranges from about 91 to 97 with larger projects tending to achieve somewhat higher efficiency Although most projects generate their own electricity for NG processing two projects do not report the amount of LFG used for on-site power generation and none report the share of co-generated electricity exported to the grid Thus all co-generated electricity is assumed to be used for NG production and NG processing efficiency is calculated from the energy content of the landfill gas used assumed liquefaction efficiency (see Section 36) and assumed generator efficiency (ranging from approximately 28 to 44) On the basis of these data and assumptions the default NG processing efficiency is calculated as 944
FIGURE 12 CO2 Washreg Process (Acrion 2009)
10 A key advantage of CO2 Washreg is that it uses liquid CO2 separated from landfill gas to absorb other impurities
22
FIGURE 13 NG Processing Efficiencies of LFG-Based Projects Producing Vehicle Fuel
344 Energy Use Accounting
Although LFG-based CNGLNG contains the same amount of energy as fossil-based CNGLNG the former is renewable (ultimately from solar energy) while the latter is not This highlights a key issue in GREET simulation of LFG-based pathways mdash namely the appropriate treatment of the energy in LFG This energy is produced from the decomposition of organic materials by methanogenic bacteria in the waste stream From the point of view of energy accounting the ldquosystemrdquo includes only the solar energy recovered from the organic materials since the losses from solar energy to organic material and from organic material to LFG are irrelevant As with other biogenic energy sources the solar energy embedded in LFG can be ignored since it would be unused if not captured Thus the LFG fuel cycle includes only the energy in the LFG (as total energy but not fossil fuel) when it is used to generate power for processing (or for addition to the grid) for compressionliquefaction and TampD and for vehicle operation However if the amount of co-generated electricity equals the amount of process electricity required (for LFG processing and compression or liquefaction) or the plant does not import or export electricity only the energy used by the genset or converted to NG needs to be counted On the other hand if the generator produces less electricity than needed for processing the remainder must be imported from the grid and upstream energy use and emissions for imported grid electricity must be included in the fuel cycle analysis Likewise if the amount of co-generated electricity exceeds process needs the excess can be sold to the grid (displacing an equivalent amount of electricity) and upstream energy and emissions (for the displaced grid electricity) must be taken as credits11
35 ON-SITE POWER GENERATION
Many landfill gas recovery projects incorporate on-site generators to produce process electricity Established technologies include internal combustion engines (ICEs) and natural gas turbines
11 For LFG-based CNGLNG pathways we assume that the genset generates the same amount of electricity as the amount of process electricity required meaning no electricity is imported or exported
23
351 Technologies
ICEs are typically spark-ignition reciprocating engines powered by the pre-purified landfill gas (or biogas) ICEs offer low initial cost easy start-up proven reliability and good part-load characteristics and heat recovery potential Emissions can be controlled by exhaust catalysts selective catalytic reduction and better control of the combustion process NREL and EPRI forecast electric efficiencies for natural gas ICEs ranging from 33 for rich-burn engines to 44 for lean-burn engines by 2010 (Goldstein et al 2003 EPRI 2004)
Combustion turbines can develop power over a wide capacity range from several kilowatts to hundreds of megawatts Microturbines small combustion turbines with outputs in the range of 30ndash200 kW are suited to lower-capacity applications like LFG recovery Microturbines (MTs) are capable of producing power at improved efficiencies by recuperating heat from the exhaust gas to the incoming air stream They also have the advantage of no gearbox or lubricating oil requirement and high engine speed (ranging from 80000 to 100000 rpm) (Dunn 2000) NREL and EPRI forecast microturbine and small gas turbine efficiencies of 29ndash40 by 2010 (Goldstein et al 2003 EPRI 2004)
352 Criteria Pollutant Emissions
Since all but one of the landfill gas projects reviewed in this study use ICEs for on-site power generation and emissions data are more generally available for LFG-fueled ICEs than for MTs ICE engines are the default technology for LFG-fueled power generation in GREET On the basis of available data their default electric efficiency (electricity from the genset divided by energy in the LFG feed to the genset) is set to 35
Since it is assumed that electricity is the only energy source used in the process (other than the LFG itself) emissions from power generation are the only emissions that need be taken into account in the fuel cycle analysis These are calculated from newly developed GREET emission factors for LFG-fueled stationary IC engines Most current projects producing pipeline-quality gas or CNGLNG for vehicle fuel utilize IC engines in the range of 1ndash2 MW that must meet point source standards for criteria pollutant emissions Since local rules are often stricter than federal standards GREET emission factors are based on the former calculated from project-level data contained in permit applications and source tests Default factors for emissions of volatile organic compounds (VOCs) carbon monoxide (CO) nitrogen oxides (NOx) and particulates of 10 micrometers or more (PM10) are calculated from these data Methane (CH4) and nitrous oxide (N2O) emissions are rarely reported in source tests since they are not regulated12 Moreover field measurements of N2O are generally below detection limits Thus GREET emission factors for unburned methane (ie CH4 slip) from the IC engine are based on the relative methane destruction efficiency of stationary IC engines as compared with the flare GREET default emission factors for carbon dioxide (CO2) and sulfur oxide (SOx) from on-site power generation are estimated as a function of genset efficiencies the carbon and sulfur content of input and output gas streams and values reported in the literature
12 Although CH4 could be calculated as the difference between total HC and NMHC the result is not accurate because the methodologies are not consistent
24
TABLE 4 Emission Factors for LFG-Fueled IC Engines LFG Flares and US Power Generation
Factor (gmmBtu) VOC CO NOx PM10 PM25 SOx CH4 N2O CO2
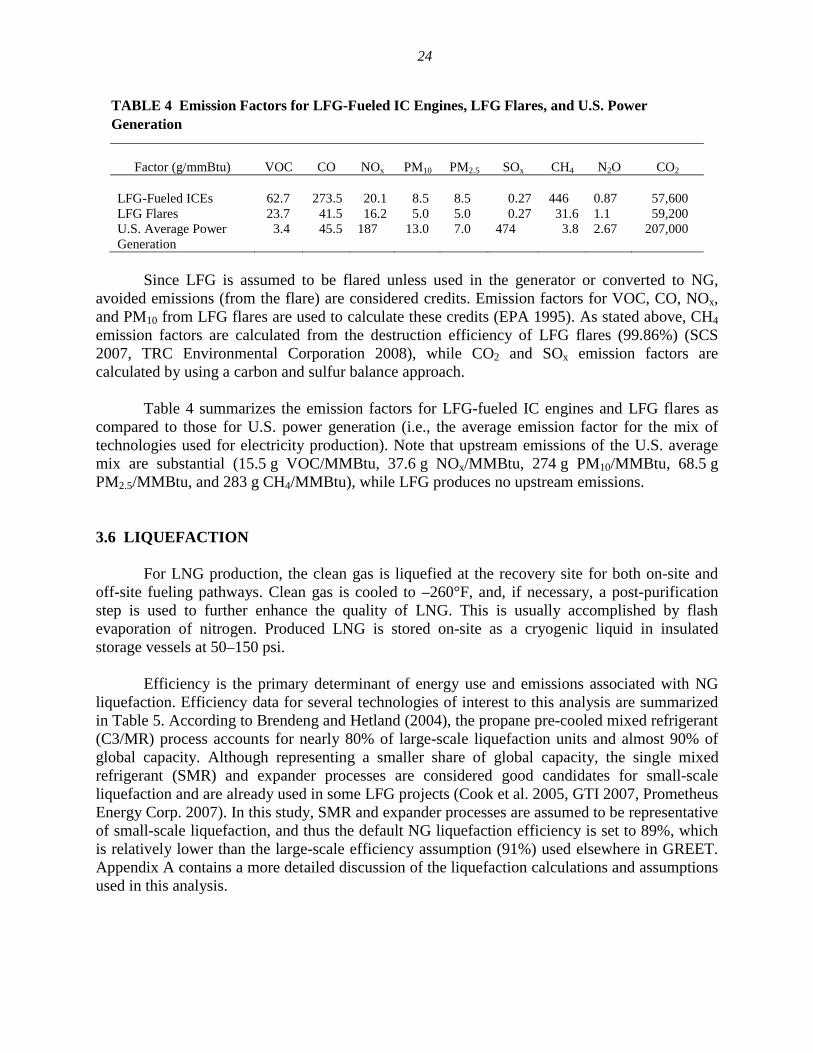
LFG-Fueled ICEs 627 2735 201 85 85 027 446 087 57600 LFG Flares 237 415 162 50 50 027 316 11 59200 US Average Power 34 455 187 130 70 474 38 267 207000 Generation
Since LFG is assumed to be flared unless used in the generator or converted to NG avoided emissions (from the flare) are considered credits Emission factors for VOC CO NOx and PM10 from LFG flares are used to calculate these credits (EPA 1995) As stated above CH4
emission factors are calculated from the destruction efficiency of LFG flares (9986) (SCS 2007 TRC Environmental Corporation 2008) while CO2 and SOx emission factors are calculated by using a carbon and sulfur balance approach
Table 4 summarizes the emission factors for LFG-fueled IC engines and LFG flares as compared to those for US power generation (ie the average emission factor for the mix of technologies used for electricity production) Note that upstream emissions of the US average mix are substantial (155 g VOCMMBtu 376 g NOxMMBtu 274 g PM10MMBtu 685 g PM25MMBtu and 283 g CH4MMBtu) while LFG produces no upstream emissions
36 LIQUEFACTION
For LNG production the clean gas is liquefied at the recovery site for both on-site and off-site fueling pathways Clean gas is cooled to ndash260degF and if necessary a post-purification step is used to further enhance the quality of LNG This is usually accomplished by flash evaporation of nitrogen Produced LNG is stored on-site as a cryogenic liquid in insulated storage vessels at 50ndash150 psi
Efficiency is the primary determinant of energy use and emissions associated with NG liquefaction Efficiency data for several technologies of interest to this analysis are summarized in Table 5 According to Brendeng and Hetland (2004) the propane pre-cooled mixed refrigerant (C3MR) process accounts for nearly 80 of large-scale liquefaction units and almost 90 of global capacity Although representing a smaller share of global capacity the single mixed refrigerant (SMR) and expander processes are considered good candidates for small-scale liquefaction and are already used in some LFG projects (Cook et al 2005 GTI 2007 Prometheus Energy Corp 2007) In this study SMR and expander processes are assumed to be representative of small-scale liquefaction and thus the default NG liquefaction efficiency is set to 89 which is relatively lower than the large-scale efficiency assumption (91) used elsewhere in GREET Appendix A contains a more detailed discussion of the liquefaction calculations and assumptions used in this analysis
25
TABLE 5 Plant Efficiencies of NG Liquefaction Technologies (Vink and Nagelvoort 1998)
Technology C3MRa Cascade DMRb SMRc Expander
Plant Efficiency () 907 890 905 894 882 a
b C3MR Propane pre-cooled mixed refrigerant DMR Dual mixed refrigerant
c SMR Single mixed refrigerant
37 TRANSPORTATION AND DISTRIBUTION
As mentioned earlier the produced CNGLNG can be dispensed at an on-site fuel station or transported to off-site fuel stations via pipeline (if CNG) or heavy-duty truck (if LNG) For off-site fueling GREET default assumptions are used to calculate feedstock loss and transport energy consumption but transport distance is reduced to 50 miles
371 Transportation and Distribution of CNG
Assuming that the pressure of the produced NG is high enough to be directly injected into a local distribution system (200 psig) no addition energy consumption or emissions are considered for both on-site and off-site CNG cases other than those in conjunction with dispensing into a CNG-fueled vehicle At fuel stations the produced NG is compressed to 4000 psia by electric compressors The electric compressors at an on-site station are assumed to use electricity supplied by the on-site LFG-fueled generator while those at off-site stations are powered by grid electricity Compression efficiency defined as the heating value of the compressed gas divided by the sum of energy used during NG compression and the heating value of the compressed gas is calculated from the following formula based on an adiabatic process (Wang et al 2001)
Compression Efficiency =
FD Wmin +
FDCE x EE
where
Wmin
N k M
= = = =
minimum work required for gas compression (W) number of compression stages (6 for off-site 5 for on-site fuel stations) ratio of specific heats (132 for NG) mass flow (kgs)
26
R = universal gas constant (Jkg K 518 for NG) T = temperature (K) Z = compressibility factor obtained from the Redlich-Kwong equation of state P2 = final pressure (4000 psia for fuel station) P1 = initial pressure (200 psia for on-site stations 50 psia for off-site fuel
stations)
Compression Efficiency = overall efficiency of compression FD = fuel delivered (kW) CE = work efficiency of compressors (80 for pipeline and 65 for fuel station)
and EE = engine efficiency (92ndash95 with electric motors)
372 Transportation and Distribution of LNG
As mentioned earlier LNG can be dispensed at an on-site fuel station or transported to off-site fuel stations via cryogenic tank truck Trucks are assumed to be fueled by either LFG-based LNG from the plant or petroleum diesel If LFG-based LNG is used the direct NG consumption is excluded from fossil fuel accounting but not total energy accounting since the produced LNG is a renewable fuel Also avoided emissions (from the flare) due to the LFG-based LNG use are considered credits
38 VEHICLE OPERATION
Fuel economy is essential for estimating fuel cycle results per mile traveled In this study we assume that light-duty vehicles (LDVs) operate on CNG while heavy-duty vehicles (HDVs especially refuse trucks) operate on LNG Thus results for CNG- and LNG-fueled vehicles are compared to those for conventional gasoline (CG) LDVs and diesel (CD) HDVs respectively We also assume that CG LDVs achieve the GREET default fuel economy and emissions and that CNG LDVs are as efficient as CG LDVs
On the other hand LFG-based LNG is expected to fuel buses and refuse trucks The latter application is particularly appealing since vehicles could be fueled on-site in the course of their normal duty cycle As with LDVs results for a ldquoper mile traveledrdquo metric require estimating the fuel economy of diesel- and LNG-fueled HDVs Refuse truck fuel economy is reported in only a few publications According to Chandler et al (2001) the fuel economy of diesel-fueled refuse trucks is 257 mpg Transit bus fuel economy is more readily available According to Watt (2000) Chandler et al (2000) Chandler et al (2006) and Barnitt et al (2006) current diesel-fueled transit buses are 20 more fuel efficient than CNGLNG-fueled buses However this advantage is likely to drop as manufacturers equip new diesel buses with particulate traps and other controls in order to meet stiff 2010 emissions standards Cummins-Westportrsquos new ISL G line of natural gas engines is already achieving fuel efficiencies that more closely mirror diesel fuel efficiencies (CWI 2009) For this study we assume that diesel-fueled HDVs will be 10 more fuel-efficient than LNG-fueled HDVs
27
HDV emission factors for CO PM and NOx are based on EPArsquos engine certification data for Cummins ISL G engines (EPA 2010b) converted to gmi by using conversion factors and brake specific fuel consumption (BSFC) for heavy-duty vehicles provided by ARCADIS Geraghry amp Miller Inc (2002) Since hydrocarbon emissions (including CH4 and VOC) are below detection limits in the certification data base emission factors for these pollutants are set to zero N2O emission factors are based on existing GREET defaults while SOx and CO2
emissions are estimated from carbon and sulfur balance calculations Table 6 summarizes the resulting emission factors for diesel- and LNG-fueled heavy-duty trucks
TABLE 6 Emission Factors for Diesel- and LNG-Fueled Heavy-Duty Trucks
Emissions by Pollutant (gmi)
Fuel VOC CO NOx PM10 PM25 SOx CH4 N2O CO2
DieselLNG
0 0
008 660
166 105
0007 0
0007 0
0024 0
0 0
010 009
3533 2857
28
4 RESULTS AND DISCUSSION
Total energy fossil energy criteria pollutant emissions and greenhouse gas emissions for 10 LFG-based pathways have been added to the GREET model WTW results are discussed below
41 ENERGY AND GREENHOUSE GAS EMISSION RATES
Total energy use per MMBtu of fuel consumed ldquoat the wheelrdquo is nearly flat for the four LFG-to-CNG-based pathways and roughly comparable to LNG from NA NG and petroleum diesel pathways The six LFG-to-LNG pathways are roughly comparable to each other and to the petroleum gasoline pathway CNG from NA NG has somewhat lower WTW energy use than other pathways because fossil NG processing consumes substantially less energy than either LFG-based processing or petroleum refining
Fossil energy use and GHG emissions present a very different picture Because vehicle operation uses renewable LFG-based fuel GREET results show a significant reduction in WTW fossil fuel use and GHGs for all LFG-based pathways The largest reductions are for LFG-to-CNG pathways using LFG-fueled on-site power generation With on-site vehicle fueling (ie no TampD for the produced CNG) fossil fuel use is completely eliminated
411 WTW Energy
Figure 14 compares well-to-pump (WTP) pump-to-wheels (PTW) and well-to-wheels (WTW) energy use for each LFG-based pathway with similar results for fossil NG (CNG from NA NG LNG from NA NG) gasoline from conventional petroleum and diesel from conventional petroleum Petroleum-based pathways are shown to permit comparison with cases in which the LFG-based fuel replaces gasoline in light-duty vehicles or diesel in heavy-duty vehicles Since LFG-based LNG could replace diesel in refuse haulers or transfer trucks the latter case is particularly interesting to operators of landfills or fleets of waste collection vehicles
As stated earlier WTW total energy use (the sum of WTP and PTW bars in Figure 14) depends largely on system efficiency Thus landfill gas-based CNG typically requires more total energy than fossil CNG or petroleum gasoline and LFG-based LNG requires more total energy than fossil LNG or petroleum diesel Because compression is more energy efficient than liquefaction LNG requires more total energy than CNG By contrast the choice of process fuel in NG processing or for TampD has little effect on WTW total energy use because the difference in energy efficiency is relatively small and total energy use is dominated by vehicle operation (PTW)
29
To
tal E
ner
gy
(Btu
mm
Btu
) 1400000
1200000
1000000
800000
600000
400000
200000
0
RC-1 RC-2 RC-3 RC-4 CNG CG RL-1 RL-2 RL-3 RL-4 RL-5 RL-6 LNG LSD
On-site Off-site On-site Off-site On-site Off-site LNG
Off-site Diesel
On-site Off-site LNG
Off-site Diesel
Distributed Generation Grid Electricity NA NG Distributed Generation Grid Electricity NA NG
Compressed Natural Gas Gasoline Liquefied Natural Gas Diesel
PTW
WTP
FIGURE 14 WTP PTW and WTW Energy Use for LFG-to-CNGLNG Pathways versus Fossil NG-to-CNGLNG Gasoline and Diesel Pathways
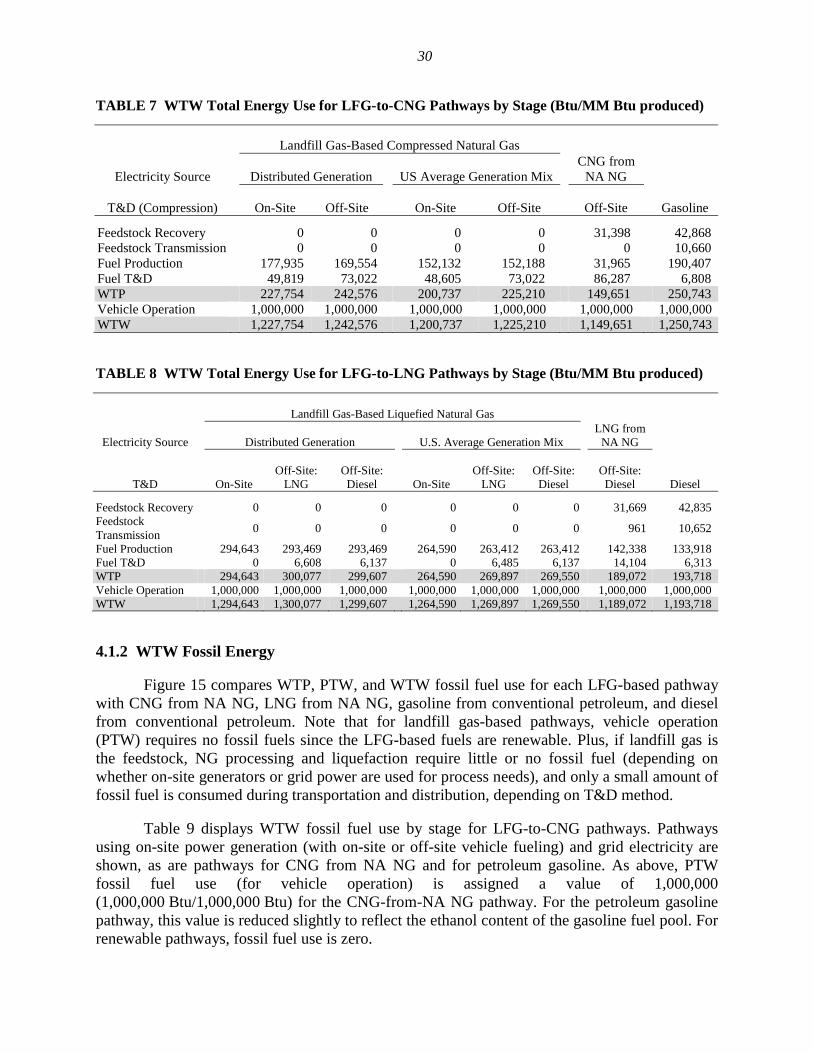
Table 7 displays WTW energy use by stage for LFG-to-CNG pathways Pathways using on-site power generation (with on-site or off-site vehicle fueling) and grid electricity are shown as are pathways for CNG from NA NG (with off-site fueling) and for petroleum gasoline Cells corresponding to subcategories are shown without shading while cells corresponding to subtotals for WTP and WTW energy are shaded gray As discussed earlier the life cycle for LFG-based fuels begins with fuel production hence there are no entries for feedstock recovery or feedstock transportation in Table 7 Fuel production and vehicle operation are the main energy-consuming stages Because production of CNG from LFG is on a much smaller scale and requires more cleanup than CNG from NA NG it uses 4ndash5 times the fuel production energy of CNG from NA NG Nonetheless production of CNG from LFG uses less energy than production of petroleum gasoline Adding its far greater energy expenditure for TampD (primarily for compression during vehicle fueling) CNG from LFG has comparable WTP and WTW energy use to petroleum gasoline (but not CNG from NA NG which it exceeds by 30ndash35)
By definition PTW (or vehicle operation) energy use has a value of 1000000 (1000000 fuel Btu per 1000000 Btu of energy use) for all pathways shown in Table 7 Since grid electricity is more energy efficient than on-site generation fuel production with grid electricity uses approximately 10 less energy
Table 8 contains a comparable breakdown of WTW energy use for LFG-to-LNG NA NG-to-LNG and petroleum diesel pathways Pathways using on-site power generation (with on-site or off-site vehicle fueling) and grid electricity are shown as are pathways using LFG-based LNG or petroleum diesel for fuel TampD Again feedstock recovery and transmission stages do not apply to LFG-based pathways fuel production is the major energy expenditure use of distributed power increases energy use and vehicle efficiencies are set to 1000000 Here however LNG from LFG uses approximately 50 more energy WTP than LNG from NA NG
30
TABLE 7 WTW Total Energy Use for LFG-to-CNG Pathways by Stage (BtuMM Btu produced)
Landfill Gas-Based Compressed Natural Gas CNG from
Electricity Source Distributed Generation US Average Generation Mix NA NG
TampD (Compression) On-Site Off-Site On-Site Off-Site Off-Site Gasoline
Feedstock Recovery 0 0 0 0 31398 42868 Feedstock Transmission 0 0 0 0 0 10660 Fuel Production 177935 169554 152132 152188 31965 190407 Fuel TampD 49819 73022 48605 73022 86287 6808 WTP 227754 242576 200737 225210 149651 250743 Vehicle Operation 1000000 1000000 1000000 1000000 1000000 1000000 WTW 1227754 1242576 1200737 1225210 1149651 1250743
TABLE 8 WTW Total Energy Use for LFG-to-LNG Pathways by Stage (BtuMM Btu produced)
Landfill Gas-Based Liquefied Natural Gas LNG from
Electricity Source Distributed Generation US Average Generation Mix NA NG
Off-Site Off-Site Off-Site Off-Site Off-Site TampD On-Site LNG Diesel On-Site LNG Diesel Diesel Diesel
Feedstock Recovery 0 0 0 0 0 0 31669 42835 Feedstock Transmission
0 0 0 0 0 0 961 10652
Fuel Production 294643 293469 293469 264590 263412 263412 142338 133918 Fuel TampD 0 6608 6137 0 6485 14104 6313 WTP 294643 300077 299607 264590 269897 189072 193718 Vehicle Operation 1000000 1000000 1000000 1000000 1000000 1000000 1000000 1000000 WTW 1294643 1300077 1299607 1264590 1269897 1269550 1189072 1193718
6137 269550
412 WTW Fossil Energy
Figure 15 compares WTP PTW and WTW fossil fuel use for each LFG-based pathway with CNG from NA NG LNG from NA NG gasoline from conventional petroleum and diesel from conventional petroleum Note that for landfill gas-based pathways vehicle operation (PTW) requires no fossil fuels since the LFG-based fuels are renewable Plus if landfill gas is the feedstock NG processing and liquefaction require little or no fossil fuel (depending on whether on-site generators or grid power are used for process needs) and only a small amount of fossil fuel is consumed during transportation and distribution depending on TampD method
Table 9 displays WTW fossil fuel use by stage for LFG-to-CNG pathways Pathways using on-site power generation (with on-site or off-site vehicle fueling) and grid electricity are shown as are pathways for CNG from NA NG and for petroleum gasoline As above PTW fossil fuel use (for vehicle operation) is assigned a value of 1000000 (1000000 Btu1000000 Btu) for the CNG-from-NA NG pathway For the petroleum gasoline pathway this value is reduced slightly to reflect the ethanol content of the gasoline fuel pool For renewable pathways fossil fuel use is zero
31
Fo
ssil
Fu
els
(Btu
mm
Btu
) 1400000
1200000
1000000
800000
600000
400000
200000
0
RC-1 RC-2 RC-3 RC-4 CNG
On-site Off-site On-site Off-site
Distributed Generation Grid Electricity NA NG
Compressed Natural Gas
PTW
WTP
CG
Gasoline
RL-1 RL-2 RL-3
On-s ite Off-site Off-s ite LNG Diesel
Distributed Generation
RL-4 RL-5 RL-6 LNG LSD
On-site Off-site Off-site LNG Diesel
Grid Electricity NA NG
Liquefied Natural Gas Diesel
FIGURE 15 WTW Fossil Fuel Use for LFG-Based Pathways versus NA NG and Petroleum Gasoline and Diesel Pathways
TABLE 9 WTW Fossil Fuel Use for LFG-to-CNG Pathways by Stage (BtuMM Btu produced)
Landfill Gas-Based Compressed Natural Gas
Electricity Source Distributed Generation US Average Generation Mix CNG from
NA NG
TampD (Compression) On-Site Off-Site On-Site Off-Site Off-Site Gasoline
Feedstock Recovery Feedstock Transmission Fuel Production Fuel TampD WTP Vehicle Operation WTW
0
0 0 0 0 0 0
0
0 0
62892 62892
0 62892
0
0 131549
42029 173577
0 173577
0
0 131597
62892 194489
0 194489
31290
0 31668 76376
139333 1000000 1139333
41363
10517 170067
6753 228700 979201
1207901
Depending on whether vehicle fueling is on-site or off-site LFG-based CNG using on-site or distributed power can consume no fossil fuel WTP or about half that consumed by CNG from NA NG On a WTW basis LFG-based CNG can consume 0ndash15 of the fossil fuel consumed by petroleum gasoline
Petroleum gasoline petroleum diesel and NA NG-to-LNG pathways consume similar amounts of fossil fuel Because of relatively higher processing efficiency CNG from NA NG uses somewhat less fossil fuel WTP than petroleum gasoline or LNG pathways
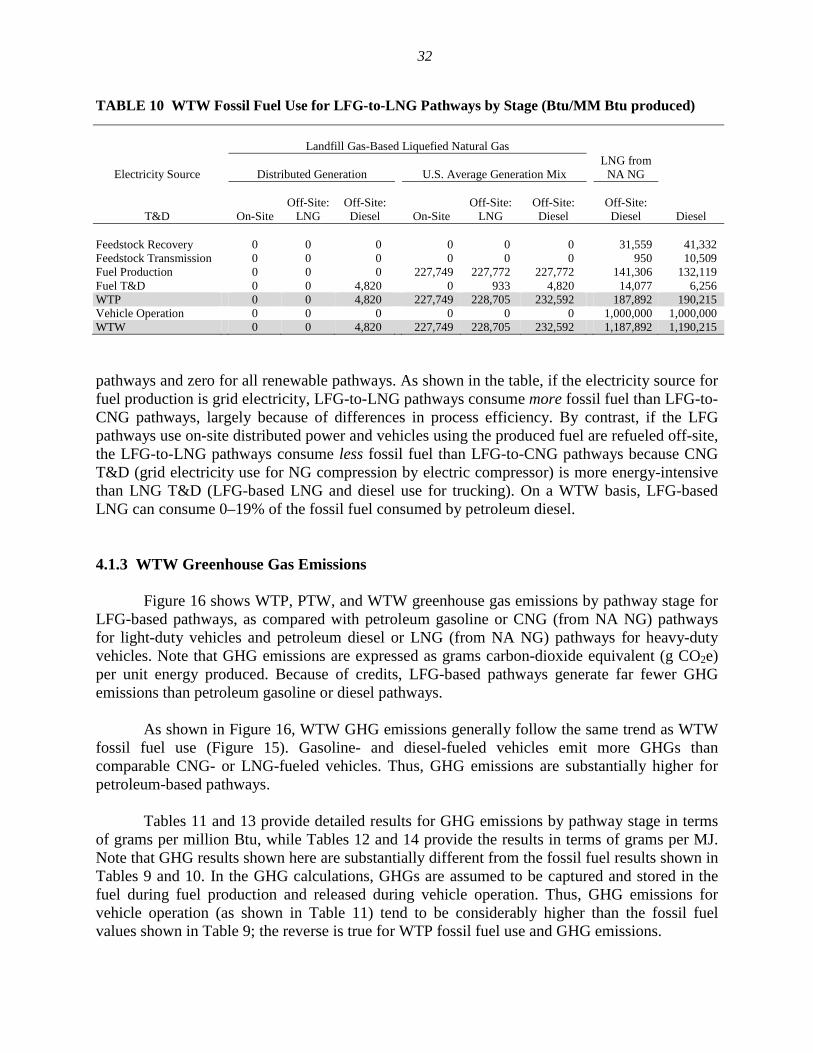
Table 10 provides comparable results for LFG-to-LNG pathways Again pathways using on-site power generation and grid electricity are shown as are pathways for LNG from NA NG and petroleum diesel and PTW fossil fuel use is assigned a value of 1000000 for all fossil
32
TABLE 10 WTW Fossil Fuel Use for LFG-to-LNG Pathways by Stage (BtuMM Btu produced)
Landfill Gas-Based Liquefied Natural Gas LNG from
Electricity Source Distributed Generation US Average Generation Mix NA NG
Off-Site Off-Site Off-Site Off-Site Off-Site TampD On-Site LNG Diesel On-Site LNG Diesel Diesel Diesel
Feedstock Recovery 0 0 0 0 0 0 31559 41332 Feedstock Transmission 0 0 0 0 0 0 950 10509 Fuel Production 0 0 0 227749 227772 227772 141306 132119 Fuel TampD 0 0 4820 0 933 4820 14077 6256 WTP 0 0 4820 227749 228705 232592 187892 190215 Vehicle Operation 0 0 0 0 0 0 1000000 1000000 WTW 0 0 4820 227749 228705 232592 1187892 1190215
pathways and zero for all renewable pathways As shown in the table if the electricity source for fuel production is grid electricity LFG-to-LNG pathways consume more fossil fuel than LFG-to-CNG pathways largely because of differences in process efficiency By contrast if the LFG pathways use on-site distributed power and vehicles using the produced fuel are refueled off-site the LFG-to-LNG pathways consume less fossil fuel than LFG-to-CNG pathways because CNG TampD (grid electricity use for NG compression by electric compressor) is more energy-intensive than LNG TampD (LFG-based LNG and diesel use for trucking) On a WTW basis LFG-based LNG can consume 0ndash19 of the fossil fuel consumed by petroleum diesel
413 WTW Greenhouse Gas Emissions
Figure 16 shows WTP PTW and WTW greenhouse gas emissions by pathway stage for LFG-based pathways as compared with petroleum gasoline or CNG (from NA NG) pathways for light-duty vehicles and petroleum diesel or LNG (from NA NG) pathways for heavy-duty vehicles Note that GHG emissions are expressed as grams carbon-dioxide equivalent (g CO2e) per unit energy produced Because of credits LFG-based pathways generate far fewer GHG emissions than petroleum gasoline or diesel pathways
As shown in Figure 16 WTW GHG emissions generally follow the same trend as WTW fossil fuel use (Figure 15) Gasoline- and diesel-fueled vehicles emit more GHGs than comparable CNG- or LNG-fueled vehicles Thus GHG emissions are substantially higher for petroleum-based pathways
Tables 11 and 13 provide detailed results for GHG emissions by pathway stage in terms of grams per million Btu while Tables 12 and 14 provide the results in terms of grams per MJ Note that GHG results shown here are substantially different from the fossil fuel results shown in Tables 9 and 10 In the GHG calculations GHGs are assumed to be captured and stored in the fuel during fuel production and released during vehicle operation Thus GHG emissions for vehicle operation (as shown in Table 11) tend to be considerably higher than the fossil fuel values shown in Table 9 the reverse is true for WTP fossil fuel use and GHG emissions
33
-80000
-60000
-40000
-20000
0
20000
40000
60000
80000
100000
RC-1 RC-2 RC-3 RC-4 CNG CG RL-1 RL-2 RL-3 RL-4 RL-5 RL-6 LNG LSD
On-site Off-site On-site Off-site On-site Off-site LNG
Off-site Diesel
On-site Off-site LNG
Off-site Diesel
Distributed Generation Grid Electricity NA NG Distributed Generation Grid Electricity NA NG
Compressed Natural Gas Gasoline Liquefied Natural Gas Diesel
GH
G E
mis
sio
ns
(g C
O2e
qm
mB
tu)
-76
-56
-36
-16
4
24
44
64
84
GH
G E
mis
sio
ns
(g C
O2eq
MJ)
PTW
WTP
WTW
FIGURE 16 WTW GHG Emissions for LFG-Based Pathways Compared with NA NG and Petroleum Gasoline and Diesel Pathways
TABLE 11 WTW GHG Emissions for LFG-to-CNG by Pathway Stage (g CO2eMM Btu produced)
Landfill Gas-Based Compressed Natural Gas CNG from
Electricity Source Distributed Generation US Average Generation Mix NA NG
TampD (Compression) On-Site Off-Site On-Site Off-Site Off-Site Gasoline
Feedstock Recovery 0 0 0 0 3758 3153 Feedstock Transmission 0 0 0 0 0 2635 Fuel Production -64988 -59119 -47328 -47551 4012 13532 Fuel TampD 3467 6460 4190 6460 9914 549 WTP -61521 -52659 -43138 -41091 17684 19869 Vehicle Operation 60484 60484 60484 60484 60484 77594 WTW -1036 7825 17346 19393 78169 97463
TABLE 12 WTW GHG Emissions for LFG-to-CNG by Pathway Stage (g CO2eMJ produced)
Landfill Gas-Based Compressed Natural Gas CNG from
Electricity Source Distributed Generation US Average Generation Mix NA NG
TampD (Compression) On-Site Off-Site On-Site Off-Site Off-Site Gasoline
Feedstock Recovery 00 00 00 00 36 30 Feedstock Transmission 00 00 00 00 00 25 Fuel Production -616 -560 -449 -451 38 128 Fuel TampD 33 61 40 61 94 05 WTP -583 -499 -409 -389 168 188 Vehicle Operation 573 573 573 573 573 735 WTW -10 74 164 184 741 924
34
TABLE 13 WTW GHG Emissions for LFG-to-LNG by Pathway Stage (g CO2eMM Btu produced)
Landfill Gas-Based Liquefied Natural Gas LNG from
Electricity Source Distributed Generation US Average Generation Mix NA NG
Off-Site Off-Site Off-Site Off-Site Off-Site TampD On-Site LNG Diesel On-Site LNG Diesel Diesel Diesel
Feedstock Recovery 0 0 0 0 0 0 3790 4706 Feedstock Transmission 0 0 0 0 0 0 250 2635 Fuel Production -57831 -61155 -61155 -37810 -41132 -41133 11727 10328 Fuel TampD 0 3331 3711 0 3413 3711 1980 506 WTP -57831 -57824 -57444 -37810 -37719 -37421 17748 18175 Vehicle Operation 60198 60198 60198 60198 60198 60198 60198 79719 WTW 2367 2374 2754 22388 22479 22777 77946 97894
TABLE 14 WTW GHG Emissions for LFG-to-LNG by Pathway Stage (g CO2eMJ produced)
Electricity Source
Landfill Gas-Based Liquefied Natural Gas
Distributed Generation US Average Generation Mix LNG from
NA NG
TampD On-Site Off-Site
LNG Off-Site Diesel On-Site
Off-Site LNG
Off-Site Diesel
Off-Site Diesel Diesel
Feedstock Recovery 00 00 00 00 00 00 36 45 Feedstock Transmission 00 00 00 00 00 00 02 25 Fuel Production -548 -580 -580 -358 -390 -390 111 98 Fuel TampD 00 32 35 00 32 35 19 05 WTP -548 -548 -544 -358 -358 -355 168 172 Vehicle Operation 571 571 571 571 571 571 571 756 WTW 22 22 26 212 213 216 739 928
42 ENERGY AND GREENHOUSE GAS EMISSIONS PER MILE TRAVELED
421 LFG-Based CNG
As shown in Figure 17 total energy use across all LFG-to-CNG pathways and for the petroleum gasoline pathway is nearly flat Total energy use is slightly higher for petroleum gasoline and slightly lower for LFG-to-CNG pathways with grid electricity Because of lower process energy use the NA NG-based CNG pathway consumes approximately 5ndash8 less energy per mile traveled than other pathways
However this relative advantage disappears when compared on the basis of either fossil fuel use or GHG emissions per mile traveled (Figures 18 and 19) Although approximately 6 better than petroleum gasoline CNG from NA NG consumes more fossil fuel and emits more GHGs than LFG-based CNG Because vehicle operation uses renewable LFG-based fuel GREET results show a reduction in WTW fossil fuel use and GHGs of 76ndash100 for LFG-based pathways as compared with fossil NA NG
35
10000
8000
6000
4000
2000
0
FIGURE 17 Energy Use for CNG from LFG or Fossil NA NG versus Petroleum Gasoline (Btumi)
RC-1 RC-2 RC-3 RC-4 CNG CG
On-site Off-s ite On-site Off-site
Distributed Generation Grid Electricity NA NG
Compressed Natural Gas Gasoline
PTW
WTP
To
tal
En
erg
y (
Btu
mi)
RC-1 RC-2 RC-3 RC-4 CNG CG
On-site Off-site On-site Off-site
Distributed Generation Grid Electricity NA NG
Compressed Natural Gas Gasoline
PTW
WTP
FIGURE 18 Fossil Fuel Use for CNG from LFG or Fossil NA NG versus Petroleum Gasoline (Btumi)
10000
Fo
ss
il F
ue
ls (
Btu
mi)
8000
6000
4000
2000
0
36
700
600
500
400
300
GH
G E
mis
sio
ns
(g C
O2eq
mi)
200
100
0
-100 RC-1 RC-2 RC-3 RC-4 CNG CG
On-site Off-s ite On-site Off-site
Distributed Generation Grid Electricity NA NG
Compressed Natural Gas Gasoline
-63
-13
38
88
138
188
238
288
338
388
438
GH
G E
mis
sio
ns
(g C
O2e
qk
m)
FIGURE 19 GHG Emissions for CNG from LFG or Fossil NA NG versus Petroleum Gasoline (g CO2emi or km)
422 LFG-Based LNG
With the exception of petroleum diesel energy-use-per-mile-traveled is relatively flat for the pathways examined As shown in Figure 20 total energy use is slightly higher for LFG-to-LNG pathways as compared with LNG from fossil NA NG Because of lower process energy use and more fuel efficient vehicle operation the petroleum diesel pathway consumes approximately 10ndash17 less energy per mile traveled than other pathways
However this relative advantage disappears when compared on the basis of either fossil fuel use or GHG emissions per mile traveled (Figures 21 and 22) Although still approximately 10 better than LNG from fossil NA NG diesel consumes far more fossil fuel than LFG-based pathways Because vehicle operation uses renewable LNG GREET results show a significant reduction in WTW fossil fuel use and GHGs for all LFG-based pathways Although LNG from fossil NA NG emits approximately 12 less GHGs than the petroleum diesel pathway (primarily due to cleaner vehicle operation) LFG-based pathways reduce GHGs by 72ndash97
37
RL-1 RL-2 RL-3 RL-4 RL-5 RL-6 LNG LSD
On-site Off-site LNG
Off-site Diesel
On-site Off-site LNG
Off-site Diesel
Distributed Generation Grid Electricity NA NG
Liquefied Natural Gas Diesel
PTW
WTP
FIGURE 20 Energy Use for LNG from LFG or Fossil NA NG versus Petroleum Diesel (Btumi)
To
tal E
ner
gy
(Btu
mi)
70000
60000
50000
40000
30000
20000
10000
0
Fo
ssil
Fu
els
(Btu
mi)
70000
60000
50000
40000
30000
20000
10000
0
PTW
WTP
RL-1 RL-2 RL-3 RL-4 RL-5 RL-6 LNG LSD
On-site Off-site Off-site On-site Off-site Off-site LNG Diesel LNG Diesel
Distributed Generation Grid Electricity NA NG
Liquefied Natural Gas Diesel
FIGURE 21 Fossil Fuel Use for LNG from LFG or Fossil NA NG versus Petroleum Diesel (Btumi)
38
GH
G E
mis
sio
ns
(g C
O2e
qm
i) 5000
4000
3000
2000
1000
0
RL-1 RL-2 RL-3 RL-4 RL-5 RL-6 LNG LSD
On-site Off-site LNG
Off-site Diesel
On-site Off-site LNG
Off-site Diesel
Distributed Generation Grid Electricity NA NG
Liquefied Natural Gas Diesel
3000
2500
2000
1500
1000
500
0
GH
G E
mis
sio
ns
(g C
O2e
qk
m)
FIGURE 22 GHG Emissions for LNG from LFG or Fossil NA NG versus Petroleum Diesel (g CO2emi or km)
43 BALANCING ENERGY EFFICIENCY WITH GREENHOUSE GAS EMISSIONS
Grid electricity is almost always more energy efficient than LFG-fueled generators since the formerrsquos fuel source is more energy dense and power plants can achieve better process integration and on-line operation at larger scale Thus LFG-based pathways are often less energy efficient than petroleum and NA NG-based pathways However because LFG-based CNG and LNG are renewable fuels total energy use is not a relevant metric for comparison with fossil fuels By definition renewable energy is not ldquoconsumedrdquo Within the timeframe of lifecycle analysis (eg 100 years) the supply of renewable energy is infinite and there is no detriment to tapping larger quantities Thus renewable energy ldquouserdquo is irrelevant and a renewable pathway is preferable to a non-renewable one on the basis of total energy use13
On the other hand we can compare the fossil fuel use and emissions of renewable and non-renewable fuel pathways because the relevant systems can be well defined and the units of analysis can be properly measured As a result although comparisons of total energy fossil energy and greenhouse gas emissions are presented above the reader is urged to focus on fossil energy and greenhouse gas emissions Those are the key comparisons between two fundamentally different types of fuel pathways
13 Among renewable pathways however it can be argued that lower energy pathways are preferable (all other things equal) since more work can be produced for a given quantity of energy thereby increasing the benefit to society (eg by increasing displacement of imported oil)
39
44 CO-PRODUCT AND RENEWABLE ENERGY CREDITS
In addition to generating excess power to the grid (ie co-product electricity) LFG-based pathways may produce elemental sulfur ash and carbon dioxide (CO2) as well as renewable energy credits14 Since ash would have been produced from the flare in the reference case (see Figure 6) it is not considered a by-product of LFG-based pathways Similarly capturing sulfur upstream (instead of at the flare) is not a net change Thus CO2 is the major potential co-product Although not a co-product per se renewable energy credits are an important side benefit since they can provide significant financial incentives to LFG fuel projects
441 Carbon Dioxide
Each year some 50 million short tons of CO2 for chemical or mechanical use are produced from US wells Production from industrial processes accounts for another 15 million tons The vast majority (35 million short tons) is used for enhanced oil recovery (EOR) mostly via pipeline from large supplies While by-product CO2 produced from LFG conversion to natural gas could serve nearby EOR needs or supplement pipeline supplies geography and scale are likely to limit its market potential
Similarly CO2 produced from LFG is unlikely to penetrate the beer or carbonated soft drink market since ample quantities of ldquofood-graderdquo CO2 are available from natural or other sources including ethanol processing So despite the ability of some LFG-to-NG processors to certify their CO2 co-product to food-grade standards the beverage market is unlikely to become a major customer
On the other hand dry ice (solid CO2) urea manufacture and pest control are promising options for LFG-based CO2 co-product Dry ice has long been the refrigerant of choice for packaging and small-lot transport of perishables that must remain frozen until use However since dry ice requires further processing a secondary deposition process would be needed at LFG sites to transform CO2 into blocks and sheets suitable for packaging A more promising market is in chemical manufacturing where CO2 has long played multiple roles as raw material reactant pressurizing agent and coolant Production of various carbonates polycarbonate resins and urea rely on CO2 as a feedstock The urea market is estimated to demand nearly 4 million tonsyr of CO2 which should expand if selective catalytic reduction of NOx in diesel engine exhaust becomes the emission control technology of choice for heavy-duty trucks
Outside California pest fumigation (especially in large-scale grain storage) may be a good logistical match for co-product CO2 Historically ethyl di-bromide (EDB) and methyl bromide (MB) were the main fumigants used in grain storage However EPA banned EDB in 1984 (as a suspected carcinogen) and ordered a phaseout of MB in 2005 (as an ozone-depleting chemical) CO2 and nitrogen are potential alternatives to MB The main advantage of CO2 is that it is toxic to insects and can tolerate up to 3 oxygen in controlled atmospheres which nitrogen cannot A disadvantage is the porosity of most storage facilities which can lose their CO2-rich
14 Since all NG produced from LFG is assumed to be used as a vehicle fuel (with either on-site or off-site fueling) GREET pathways have no NG co-product
40
fumigation atmospheres before the approximately nine days required for full effectiveness If this latter problem can be resolved CO2 application to elevator storage of spring and winter wheat could represent a market for up to 20000 tyr of CO2
Additional uses for CO2 (eg as a foam blowing agent in polyurethane and polystyrene production an aerosol propellant a cleaning agent at paper pulp mills or as a natural plant nutrient in greenhouses) hold limited promise generally circumscribed by geographic proximities and other competing compounds Because of the above-noted uncertainties and the likelihood that market success will be very site-specific co-product CO2 is not represented in the LFG-based pathways developed for this study
442 Renewable Energy Credits and Other Incentives
Thirty-five states currently require electric utilities to generate a minimum share of the power sold within their borders from renewable or alternative energy sources by a given date (Pew 2009) Called ldquoRenewable Portfolio Standardsrdquo (RPSs) most of these mandates specifically include landfill gas as an eligible energy source (Pew 2009 EPA 2009a) Although RPSs focus on replacing fossil with renewable fuels for power generation the concept is likely to be expanded to natural gas in the form of low carbon fuel standards (like those already adopted in California) or greenhouse gas allowances (like those being considered under various carbon cap and trade proposals) Already a few states (eg Montana Michigan and Kansas) frame their RPSs in terms of energy (as opposed to electricity) consumption LFG pathways to vehicle-fuel or pipeline-quality gas may qualify under these latter standards
Several states have adopted or are considering the adoption of regulations permitting utilities to buy sell or trade Renewable Energy Certificates (RECs) in order to comply with RPSs or other mandates RECs are tradable commodities that represent proof that a given amount of electricity was generated from an eligible renewable energy resource In states with a REC program ldquogreenrdquo energy providers (such as producers of LFG-based electricity that is exported to the grid or of pipeline quality gas that is used to generate renewable electricity) are credited with one REC for every 1000 kWh (1 MWh) of electricity produced A certifying agency gives each REC a unique identification number to make sure it does not get double-counted The green energy is fed into the electric grid and the accompanying REC can be sold traded or bartered on the open market The owner of the REC can then claim to have purchased renewable energy even though the energy associated with the REC is sold separately and used by another party (EPA 2009a)
Various federal incentives are available to support LFG projects These include tax credits and funding sources like the Renewable Electricity Production Tax Credit the Business Energy Investment Tax Credit and Clean Renewable Energy Bonds (authorized under Sections 45 48 and 54 respectively of the US Tax Code) Qualified Energy Conservation Bonds and the Renewable Energy Production Incentive (created in 1992 and reauthorized to extend through 2026) Other incentives include Renewable Energy Grants Energy Efficiency and Conservation Block Grants and Innovative Technology loan guarantees Historically most of these incentives have been limited to generating power from LFG and exporting it to the grid Now however a number of them have been expanded to cover facilities ldquofunctionally related and subordinate to the generation facility itselfrdquo (which could include gas cleanup compression and pipeline injection) and funding has been supplemented with appropriations from the American Recovery and Reinvestment Act (ARRA)
41
The waste-to-energy industry is poised for growth as new markets for their ldquogreen powerrdquo emerge and new funding sources provide the wherewithal to accelerate LFG-based fuel development According to David Wentworth president of Renewable Solutions Group ldquoLandfill gas to electricity projects have flourished over the past several decades primarily as a means to capture federal tax benefits but they produce limited environmental benefits when compared to high Btu applicationshellipThe next evolution is landfill gas to pipeline-quality gas projects which can be used to heat homes power natural gas vehicles and illuminate city streets all while providing financial and environmental benefitsrdquo (Pomerantz 2009)
45 CRITERIA POLLUTANT EMISSIONS
Detailed well-to-wheel estimates of criteria pollutant emissions are provided in Appendix B For criteria pollutants like carbon monoxide (CO) emissions are dominated by vehicle operation since relatively little of the pollutant is emitted from fuel production For others (eg NOx PM and SOx) emissions are pathway dependent NOx and PM emissions vary with grid electricity use because the emission factors of the US average power mix (see Table 4) are much higher than those of on-site power generators which in turn are higher than those of LFG flares WTW SOx emissions are virtually eliminated if no grid electricity is used in the pathway because all sulfur emissions are balanced with the credit from the avoided LFG flaring
42
5 CONCLUSIONS
This study characterized landfill gas (LFG) resources and the technologies to convert what until recently was considered a waste product into a renewable fuel for vehicles By using this information several LFG-based pathways were added to the GREET model Results show
bull As compared with North American natural gas (NA NG) or petroleum-based fuel LFG-based fuels require roughly the same quantity of energy for their production transport and utilization in vehicles However with LFG-based fuels much of this energy is considered renewable since it is from organic sources and is replenished naturally
bull LFG-based fuels can save significant amounts of fossil fuel The size of such savings however depends on the amount of electricity used in the pathway
bull LFG-based fuels can dramatically reduce greenhouse gas (GHG) emissions particularly if process energy is supplied by on-site power generators using renewable LFG If process energy is supplied by grid electricity reductions in GHG emissions depend on the US power generation mix
bull WTW criteria pollutant emissions depend on both the amount of electricity used and differences in emission factors between relevant pathway components and the base or reference case (eg CNGLNG versus gasolinediesel vehicles LFG flares versus IC engines LFG gensets versus the average US power generation mix)
Because of limited time and resources this study could not address several issues and concerns Chief among them are emissions of toxics and hazardous substances from landfills These substances are present in the current waste stream and we assume that they are successfully captured and destroyed in the thermal oxidizer (flare) However some argue that LFG capture rates are less than assumed destruction of NMOC and other pollutants is incomplete (contributing to additional emissions) and that some hazardous materials are not adequately sequestered within the landfill These issues are extremely important and merit a detailed examination That examination is beyond the scope of this analysis
This analysis also assumes that conventional waste management strategies will continue to be used and to produce landfill gas comprising some 45ndash50 methane and 35ndash40 CO2 (see Table 2) As noted above LFG capture is uncertain and may change with new technologies like bioreactors or source-separation coupled with anaerobic digestion of organic materials These technologies are extremely promising since they speed waste stabilization and therefore the economic recovery of product gas Beyond this however they may also increase LFG capture rates and methane concentrations in the LFG feed Although extremely important and significant these issues lie outside the system boundary and thus could not be addressed in this analysis
Finally while this study assumes a robust market for LFG-based fuel market issues are beyond the scope of this analysis Because there are many renewable sources for electricity but few for natural gas renewable natural gas may be an increasingly attractive option for entities
43
required to implement low carbon fuel standards and renewable portfolio standards However recent historically low spark spreads between natural gas and electricity prices have given way to low natural gas prices and high spark spreads As a result projects to produce pipeline quality natural gas are less viable in todayrsquos economic climate than they were a couple of years ago However the price differential between natural gas for stationary applications versus competing motor fuels remains significant
44
6 REFERENCES
Acrion Technologies Inc 2009 Acrionrsquos CO2 Wash Process for Contaminants Removal from Landfill Gas accessed Aug 2009 at httpwwwacrioncomCO2washhtm
Air Liquide 2009 Biogas Recovery System accessed Sept 2009 at httpwwwdtaairliquidecomfileotherelementpjplaquette-biogaz57164pdf
ARCADIS Geraghty amp Miller Inc 2002 ldquoUpdate Heavy-Duty Engine Emission Conversion Factors for MOBILE6 Analysis of BSFCs and Calculation of Heavy-Duty Engine Emission Conversion Factorsrdquo EPA420-R-02-005 January 2002
Barnitt R and K Chandler 2006 New York City Transit Hybrid and CNG Transit Buses Interim Evaluation Results National Renewable Energy Laboratory Report NRELTP-540-38843 November
Brendeng E and J Hetland 2004 ldquoState of the Art in Liquefaction Technologies for Natural Gas NATO Science Series Series II Mathematics Physics and Chemistry edited by J Hetland and T Gochitashvili Vol 149
Brinkman N M Wang T Weber and T Darlington 2005 Well-to-Wheels Analysis of Advanced FuelVehicle Systems mdash A North American Study of Energy Use Greenhouse Gas Emissions and Criteria Pollutant Emissions Argonne National Laboratory Argonne IL
California Air Resources Board (CARB) 2009 ARB Adopts Landfill Measure to Reduce Potent Global Warming Gas News Release California Environmental Protection Agency June 25
Chandler K P Norton and N Clark 2001 Waste Managementrsquos LNG Truck Fleet Final Results National Renewable Energy Laboratory Report NRELBR-540-29073 January
Chandler K P Norton and N Clark 2000 Dallas Area Rapid Transitrsquos (DART) LNG Bus Fleet Final Results National Renewable Energy Laboratory Report NRELBR-540-28739 November
Chandler K E Eberts and M Melendez 2006 Washington Metropolitan Area Transit Authority Compressed Natural Gas Transit Bus Evaluation National Renewable Energy Laboratory Report NRELTP-540-37626 April
Cook W W Brown L Siwajek W Sanders and I Botgros 1998 Greenhouse Gas Reduction by Recovery and Utilization of Landfill Methane and CO2 Technical and Market Feasibility Study Boului Landfill Bucharest Romania US DOE Assistant Secretary for Energy Efficiency and Renewable Energy Report DOEEE35034ndashT1 Washington DC
Cook W M Neyman L Siwajek and W Brown 2002 Landfill Gas to LNG and LCO2 2001 Annual Report Brookhaven National Laboratory Upton NY
45
Cook W W Brown L Siwajek M Neyman T Reppert and B Smackey 2005 Production of Liquid Methane Truck Fuel from Landfill Gas Final Report Brookhaven National Laboratory Upton NY
Cummins-Westport Inc (CWI) 2009 ISL G (North America) accessed Sept 2009 at httpwwwcumminswestportcomproductsislgphp
Datta AK and PK Sen 2006 ldquoOptimization of Membrane Unit for Removing Carbon Dioxide from Natural Gasrdquo Journal of Membrane Science 283(1ndash2)291ndash300
Dunn S 2000 ldquoMicropower The Next Electrical Erardquo Worldwatch Paper 151 Worldwatch Institute Washington DC
Electric Power Research Institute (EPRI) 2004 Distributed Energy Resources Emissions Survey and Technology Characterization Electricity Innovation Institute Palo Alto CA
Energy Information Administration (EIA) 2008 US Crude Oil Natural Gas and Natural Gas Liquids Reserves 2007 Annual Report accessed Aug 2009 at httpwwweiadoegov puboil_gasnatural_gasdata_publicationscrude_oil_natural_gas_reserveshistorical2007 cr2007html
EIA 2009a Annual Energy Review 2008 Report No DOEEIA-0384(2008) accessed Aug 2009 at httpwwweiadoegovemeuaercontentshtml
EIA 2009b Natural Gas Year-In-Review 2008 accessed Aug 2009 at httpwwweiadoegov puboil_gasnatural_gasfeature_articles2009ngyir2008ngyir2008html
Finn AJ GL Johnson and TR Tomlinson 1999 ldquoDevelopments in Natural Gas Liquefactionrdquo in Hydrocarbon Processing pp 47ndash59
Franklin Associates a Division of ERG Review of State Solid Waste Management Websites cited in US EPA 2008 Municipal Solid Waste in the United States Facts and Figures for 2007 EPAndash530ndashRndash08ndash010 Office of Solid Waste Washington DC
Gas Technology Institute (GTI) 2007 Liquefied Natural Gas from Landfill Gas Demonstration Grant California Integrated Waste Management Board
Goldstein L B Hedman D Knowles S Freedman R Woods and T Schweizer 2003 Gas-Fired Distributed Energy Resource Technology Characterizations National Renewable Energy Laboratory Report NRELTPndash620ndash34783 Golden CO
Godlove C 2010 Landfill Gas Successes and Challenges in an Increasingly Complex Market SWANArsquos 33rd Annual Landfill Gas Symposium San Diego March 10
Johansson N 2008 Production of Liquid Biogas LBG with Cryogenic and Conventional Upgrading Technology mdash Description of Systems and Evaluations of Energy Balances MS Thesis Lunds University Sweden
46
Kikkawa Y and I Aoki 1999 Gas to Liquid of 21st Century AIChE Spring National Meeting Houston p 48 March 14ndash18
Kikkawa Y and N Nozawa 1999 Optimizing Liquefied Natural Gas Power Chain AIChE Spring National Meeting Houston March 14ndash18
Kikkawa Y and YN Liu 2001 Zero CO2 Emission for LNG Power Chain 13th International Conference and Exhibition on Liquefied Natural Gas PS5ndash3
Kohl A and R Nielsen 1997 Gas Purification 5th ed Gulf Publishing Houston
Lear J and J Burdelski 2009 US Department of EnergyBrookhaven National Laboratory Biomethane Analysis Draft Report
Ludwig V 2009 Landfill Gas to Energy Webcast (transcript and slides) USEPA Feb 18 accessed Aug 2009 at httpwwwepagovcleanenergyenergy-programsstate-andshylocalwebcasthtmlfeb5
Persson M O Joumlnsson and A Wellinger 2006 Biogas Upgrading to Vehicle Fuel Standards and Grid Injection IEA Bioenergy Task 37 ndash Energy from Biogas and Landfill Gas accessed June 28 2010 at httpwwwiea-biogasnetDokumenteupgrading_report_finalpdf
Pew Center on Global Climate Change 2009 Renewable and Alternative Energy Portfolio Standards July 29 accessed Aug 2009 at httpwwwpewclimateorgwhat_s_being_done in_the_statesrpscfm
Pickens TB Pickens Plan undated accessed Sept 2009 at httpwwwpickensplancom theplan
Pomerantz M 2009 ldquoTapping the Trashrdquo Waste Age April 1 accessed Aug 2009 at httpwasteagecomLandfill_Managementlandfill-methane-pipeline-quality-gas-200904
Pomerantz M and L Turcotte 2004 Production of Pipeline Gas from Landfill Gas in Canada Wastecon 2004 Sept 21ndash23 Phoenix
Prometheus Energy Company 2007 Liquefied Natural Gas from Landfill Gas Demonstration Grant California Integrated Waste Management Board
Remeljej CW and AF Hoadley 2006 ldquoAn Exergy Analysis of Small-Scale Liquefied Natural Gas (LNG) Liquefaction Processesrdquo Energy 312005ndash2019
SCS Engineers 2007 Current MSW Industry Position and State of the Practice on Methane Destruction Efficiency in Flares Turbines and Engines prepared for Solid Waste Industry for Climate Solutions July
Segeler CG 1965 Gas Engineers Handbook Industrial Press
47
Sperling Hansen Associates 2007 Highland Valley Centre for Sustainable Waste Management ndash Landfill Gas Utilization Options SHAndashPRJ06014 accessed July 2009 at httpa100govbccaappsdataepichtmldeployepic_project_doc_index_263html
Spillman R 1995 ldquoEconomics of Gas Separation Membrane Processrdquo in Membrane Separations Technology Principles and Applications 3rd Edition (edited by RD Noble SA Stern) Elsevier Science
Sullivan P 2010 The Importance of Landfill Gas Capture and Utilization in the US Council for Sustainable Use of Resources and Earth Engineering Center Columbia University April accessed May 2010 at httpwwwscsengineerscomPapersSullivan_Importance_of_LFG_ Capture_and_Utilization_in_the_USpdf
Syed M G Soreanu P Falletta and M Beland 2006 ldquoRemoval of Hydrogen Sulfide from Gas Streams Using Biological Processes A Reviewrdquo Canadian Biosystems Engineering 4821ndash214
TRC Environmental Corp 2008 Emissions Testing of the Ward Hill Neck Landfill Enclosed Landfill Gas Flare and Landfill Gas Engine prepared for Covanta Haverhill Inc Windsor CT TRC project no 158673-0000-00000 July 21
US Environmental Protection Agency (EPA) 1995 Compilation of Air Pollutant Emission Factors Vol 1 Stationary Point and Area Sources APndash42 5th Edition Research Triangle Park NC
US EPA 2008 Municipal Solid Waste in the United States Facts and Figures for 2007 EPAndash 530ndashRndash08ndash010 Office of Solid Waste Washington DC
US EPA 2010a Energy Projects and Candidate Landfills as of April 2010 accessed May 2010 at httpwwwepagovlmopprojects-candidatesindexhtmlmap-area
US EPA 2010b Engine Certification Data accessed May 2010 at httpwwwepagovoms certdatahtmlargeng
US EPA 2009a Renewable Portfolio Standards An Effective Policy to Support Clean Energy Supply April accessed Aug 2009 at httpwwwepagovchpstate-policyrenewable_fshtml
US EPA Office of Air Quality 2000 Economic Impact Analysis Municipal Solid Waste Landfills EPA-452D-00-005 Sept accessed Sept 2009 at httpyosemiteepagoveeepa riansfvwANA2000-37pdf$fileA2000-37pdf
US EPA Natl Center for Environmental Economics 1996 Landfill Rules Tightened from I Fisher ldquoEPA Rules Require Curbs on Landfillsrsquo Gas Emissionsrdquo New York Times March 3 accessed Sept 2009 at httpyosemiteepagoveeepalibnwletnsf434d5673ac53b1548525 64cd007a8a0d6422179d25e7e87e852564d800092f41OpenDocument
48
University of Florida and University of Central Florida 2008 Florida Bioreactor Landfill Demonstration Project Executive Summary July 1 accessed Aug 2009 at httpwwwbioreactororg
Vink KJ and RK Nagelvoort 1998 Comparison of Baseload Liquefaction Processes in Proc 12th Intl Conference and Exhibition on Liquefied Natural Gas Perth Australia p 36 May 4ndash7
Wang M D He A Finizza T Weber M Miller D Masten G Skellenger and JP Wallace 2001 Well-to-Wheel Energy Use and Greenhouse Gas Emissions of Advanced FuelVehicle Systems mdash North American Analysis General Motors Corporation Argonne National Laboratory BP ExxonMobil Shell accessed July 2009 at httpwwwtransportationanlgov pdfsTA163pdf
Watt GM 2000 Natural Gas Vehicle Transit Bus Fleets The Current International Experience 7th Intl Conference and Exhibition on Natural Gas Vehicles (NGV 2000) Oct 17ndash19 Yokohama Japan
49
APPENDIX A SMALL-SCALE NATURAL GAS LIQUEFACTION
Liquefied natural gas (LNG) is produced by cooling natural gas (NG) to its boiling point (-260degF) at atmospheric pressure A number of different processes (or cycles) can be used the chief types being cascade mixed refrigerant and expander Schematics of the processes are presented in Figure A-1
(a) Cascade Cycle
(b) Mixed Refrigerant Cycle
(c) Expander Cycle
FIGURE A-1 Schematics of NG Liquefaction Processes
The cascade cycle generally uses a different pure refrigerant (propane ethane [or ethylene] or methane) for each of its three stages The major advantage of the cycle is its high efficiency and simplicity of design disadvantages include relatively high capital cost due to the number of refrigerant compression cycles
50
The mixed refrigerant cycle uses a single mixed refrigerant instead of multiple pure refrigerants as in the cascade cycle The refrigerant is usually a mixture of nitrogen methane ethane propane butane and pentane Since it requires only one refrigerant compression cycle its capital cost is relatively low Theoretically a single mixed refrigerant (SMR) cycle should provide sufficient refrigeration to cool NG to its boiling point at atmospheric pressure In practice however a pre-cooling step is needed since the thermo-physical properties of the mixed refrigerant and machinery reduce efficiency Thus the NG feed is usually pre-cooled by a three-stage propane refrigeration cycle (C3MR) or by a separate mixed refrigeration cycle (dual mixed refrigerant (DMR) cycle)
The expander cycle uses an expansion turbine to expand the cycle gas in a near isentropic manner at an appropriate temperature thereby reducing its temperature The expansion generates useful work that is recovered through a booster compressor A major disadvantage of this cycle is its relatively high power consumption compared to either the cascade or MR cycles An expander cycle is however best suited to smaller plants with shorter operating periods because of its relatively rapid and simple start-up and shutdown
NG liquefaction efficiency can be defined in terms of process efficiency or train efficiency depending on the system boundary Process efficiency obtained from specific power includes the power consumed by pre-cooling and liquefaction Train efficiency is the total lower heating value (LHV) of valuable products (LNG and condensate) divided by the LHV of the feed (including energy for pre-cooling liquefaction power generation and utilities) Process efficiencies are documented in many published sources Train efficiencies are less readily available Values and sources of process and trail efficiencies are summarized in Table A-1
TABLE A-1 Process and Train Efficiencies of Major NG Liquefaction Processes
C3MR Cascade DMR SMR Expander
Specific Power (kWhton LNG) Process Efficiency () Vink and Nagelvoort 1998 979 976 Kikkawa and Nozawa 1999 Brendeng and Hetland 2004
976 966
Finn et al 1999 976 979
978
979
975
975
974
973
965 Kikkawa and Liu 2001 980 Remeljej and Hoadley 2006
Average 978 974 978 975 975 969
Train Efficiency () Vink and Nagelvoort 1998 Kikkawa and Aoki 1999 Kikkawa and Liu 2001
907 90
890 905 894 882
51
According to Brendeng and Hetland (2004) nearly 80 of large-scale liquefaction units and almost 90 of global LNG-production capacity currently use C3MR However it is not at all clear that C3MR is the best option for LFG-based liquefaction Most of the sources reviewed for this effort indicate that SMR and expander cycles are good candidates for small-scale liquefaction Moreover for actual LFG-to-LNG projects two current projects (Bowerman and Altamont) use SMR while a pilot project (Burlington) used a nitrogen expander
GREETrsquos default efficiency for large-scale liquefaction is 91 On average SMR and expander cycles respectively take 14 and 40 more specific power than C3MR Assuming that C3MR represents large-scale liquefiers while SMR and expander cycles represent small-scale liquefiers and that the ratio between processing and train efficiencies remains constant we estimate the average train efficiencies of SMR and expander cycles to be 899 and 878 respectively These values compare well to the train efficiencies reported by Vink and Nagelvoort (1998) Using these data GREETrsquos small-scale liquefaction efficiency is set to 89
52
APPENDIX B CRITERIA POLLUTANTS
Estimates of well-to-wheel (WTW) well-to-pump (WTP) and pump-to-wheel (PTW) criteria pollutant emissions for landfill gas (LFG) and fossil fuel-based pathways are shown in Figures B-1 through B-5 When PTW results are negative (eg CO emissions for pathways using grid electricity or NOx emissions for pathways using on-site power generation) the sum of WTP and PTW emissions is drawn as a darker shade of rose and is shown superimposed over its two components
As shown in Figures B-1 B-2 and B-4 LFG-based pathways to CNG use in light-duty vehicles (LDVs) produce WTW CO NOx and PM25 emissions comparable to or less than those of fossil-based pathways to CNG NA NG or petroleum gasoline For heavy-duty vehicles (HDVs) WTW NOx and CO emissions of LFG-based LNG pathways are comparable to those of fossil-based pathways to NA NG or petroleum diesel Because the US generation mix is heavily weighted toward coal displacing grid electricity with on-site power generation virtually eliminates SOx emissions (except for compression at the refueling station which continues to use grid electricity) and results in major reductions in NOx and PM emissions Since most on-site generators have lower NOx PM and SOx PTW emissions are shown as a credit or negative contribution to WTW results in Figures B-1 through B-5 For LNG-fueled vehicles WTW PM10
and SOx emissions are virtually zero
1400
1210
FIGURE B-1 CO Emissions for LFG-Based Pathways Compared with NA NG and Petroleum Gasoline and Diesel Pathways
RC-1 RC-2 RC-3 RC-4 CNG CG RL-1 RL-2 RL-3 RL-4 RL-5 RL-6 LNG LSD
On-site Off-site On-site Off-site On-site Off-site LNG
Off-site Diesel
On-site Off-site LNG
Off-site Diesel
Distributed Generation Grid Electricity NA NG Distributed Generation Grid Electricity NA NG
Compressed Natural Gas Gasoline Liquefied Natural Gas Diesel
PTW
WTP
WTW
1200
1010 1000
CO
(g
mm
Btu
)
0810 800
0610 600
0410 400
200 0210
0 0010
-200 -0190
CO
(g
MJ)
80
100
0081
25
30
53
FIGURE B-2 NOx Emissions for LFG-Based Pathways Compared with NA NG and Petroleum Gasoline and Diesel Pathways
RC-1 RC-2 RC-3 RC-4 CNG CG RL-1 RL-2 RL-3 RL-4 RL-5 RL-6 LNG LSD
On-site Off-site On-site Off-site On-site Off-site LNG
Off-site Diesel
On-site Off-site LNG
Off-site Diesel
Distributed Generation Grid Electricity NA NG Distributed Generation Grid Electricity NA NG
Compressed Natural Gas Gasoline Liquefied Natural Gas Diesel
PTW
WTP
WTW
NO
x (
gm
mB
tu) 0061
60
0041 40
20 0021
0 0001
-20 -0019
10
15
20
RC-1 RC-2 RC-3 RC-4 CNG CG RL-1 RL-2 RL-3 RL-4 RL-5 RL-6 LNG LSD
On-site Off-site On-site Off-site On-site Off-site LNG
Off-site Diesel
On-site Off-site LNG
Off-site Diesel
Distributed Generation Grid Electricity NA NG Distributed Generation Grid Electricity NA NG
Compressed Natural Gas Gasoline Liquefied Natural Gas Diesel
PM
10 (
gm
mB
tu)
PTW
WTP
WTW
FIGURE B-3 PM10 Emissions for LFG-Based Pathways Compared with NA NG and Petroleum Gasoline and Diesel Pathways
0005 5
0000 0
-5 -0005
PM
10 (
gM
J)
NO
x (
gM
J)
0010
0015
0020
0025
60
54
9 P
M2
5 (
gm
mB
tu)
PTW 0007
7 WTP
WTW 0005 5
0003 3
0001 1
-1 -0001
SO
x (g
MJ)
P
M2
5 (
gM
J)
-3
-5
RC-1 RC-2 RC-3 RC-4 CNG
On-site Off-site On-site Off-site
Distributed Generation Grid Electricity NA NG
Compressed Natural Gas
CG
Gasoline
RL-1 RL-2 RL-3
On-site Off-site Off-site LNG Diesel
Distributed Generation
-0003
-0005
RL-4 RL-5 RL-6 LNG LSD
On-site Off-site Off-site LNG Diesel
Grid Electricity NA NG
Liquefied Natural Gas Diesel
FIGURE B-4 PM25 Emissions for LFG-Based Pathways Compared with NA NG and Petroleum Gasoline and Diesel Pathways
RC-1 RC-2 RC-3 RC-4 CNG CG RL-1 RL-2 RL-3 RL-4 RL-5 RL-6 LNG LSD
On-site Off-site On-site Off-site On-site Off-site LNG
Off-site Diesel
On-site Off-site LNG
Off-site Diesel
Distributed Generation Grid Electricity NA NG Distributed Generation Grid Electricity NA NG
Compressed Natural Gas Gasoline Liquefied Natural Gas Diesel
PTW
WTP
WTW 0041
0031
0021
0011
0001
SO
x (g
mm
Btu
)
50
40
30
20
10
0
-10 -0009
FIGURE B-5 SOx Emissions for LFG-Based Pathways Compared with NA NG and Petroleum Gasoline and Diesel Pathways
0051
Argonne National Laboratory is a US Department of Energy laboratory managed by UChicago Argonne LLC
Energy Systems Division Argonne National Laboratory9700 South Cass Avenue Bldg 362Argonne IL 60439-4815
wwwanlgov
- Cover
- Disclaimer
- Title Page
- Contents
- Acknowledgments
- Executive Summary
- 1 Introduction
-
- 11 Background
- 12 US Natural Gas Resources
- 13 Natural Gas as a Vehicle Fuel
- 14 Renewable Natural Gas and GHG Emissions
- 15 Fuel Cycle Analysis
- 16 Scope
-
- 2 Landfill Gas
-
- 21 Resource Base
- 22 Resource Development
- 23 Additions to the Resource Base
- 24 Landfill Gas Composition
-
- 3 Fuel Cycle Analysis of Landfill-Gas Based Pathways
-
- 31 LFG Reference Case
-
- 311 Flaring versus Venting Landfill Gas
- 312 Carbon Fate in LFG Fossil NG and Petroleum Fuel Cycles
-
- 32 Overview of LFG-to CNGLNG Fuel Cycle
- 33 Gas Collection
- 34 Natural Gas Production
-
- 341 Pre-Purification
- 342 CO2 Removal
- 343 Process Efficiency
- 344 Energy Use Accounting
-
- 35 On-Site Power Generation
-
- 351 Technologies
- 352 Criteria Pollutant Emissions
-
- 36 Liquefaction
- 37 Transportationi and Distribution
-
- 371 Transportation and Distribution of CNG
- 372 Transportation and Distribution of LNG
-
- 38 Vehicle Operation
-
- 4 Results and Discussioni
-
- 41 Energy and Greenhouse Gas Emission Rates
-
- 411 WTW Energy
- 412 WTW Fossil Energy
- 413 WTW Greenhouse Gas Emissions
-
- 42 Energy and Greenhouse Gas Emissioins per Mile Traveled
-
- 421 LFG-Based CNG
- 422 LFG-Based LNG
-
- 43 Balancing Energy Efficiency with Greenhouse Gas Emissions
- 44 Co-Product and Renewable Energy Credits
-
- 441 Carbon Dioxide
- 442 Renewable Energy Credits and Other Incentives
-
- 45 Criteria Pollutant Emissioins
-
- 5 Conclusions
- 6 References
- Appendix A Small-Scale Natural Gas Liquefaction
- Appendix B Criteria Pollutants
-

About Argonne National Laboratory Argonne is a US Department of Energy laboratory managed by UChicago Argonne LLC under contract DE-AC02-06CH11357 The Laboratoryrsquos main facility is outside Chicago at 9700 South Cass Avenue Argonne Illinois 60439 For information about Argonne and its pioneering science and technology programs see wwwanlgov
Availability of This Report This report is available at no cost at httpwwwostigovbridge It is also available on paper to the US Department of Energy and its contractors for a processing fee from US Department of EnergyOffice of Scientific and Technical InformationPO Box 62Oak Ridge TN 37831-0062phone (865) 576-8401fax (865) 576-5728reportsadonisostigov
Disclaimer This report was prepared as an account of work sponsored by an agency of the United States Government Neither the United States Government nor any agency thereof nor UChicago Argonne LLC nor any of their employees or officers makes any warranty express or implied or assumes any legal liability or responsibility for the accuracy completeness or usefulness of any information apparatus product or process disclosed or represents that its use would not infringe privately owned rights Reference herein to any specific commercial product process or service by trade name trademark manufacturer or otherwise does not necessarily constitute or imply its endorsement recommendation or favoring by the United States Government or any agency thereof The views and opinions of document authors expressed herein do not necessarily state or reflect those of the United States Government or any agency thereof Argonne National Laboratory or UChicago Argonne LLC
ANLESD10-3
Well-to-Wheels Analysis of Landfill Gas-Based Pathways and Their Addition to the GREET Model
by M Mintz J Han M Wang and C Saricks Center for Transportation Research Energy Systems Division Argonne National Laboratory
May 2010
CONTENTS
ACKNOWLEDGMENTS vii
EXECUTIVE SUMMARY 1
1 INTRODUCTION 2
11 Background 2 12 US Natural Gas Resources 3 13 Natural Gas as a Vehicle Fuel 5 14 Renewable Natural Gas and GHG Emissions 5 15 Fuel Cycle Analysis 5 16 Scope 6
2 LANDFILL GAS 7
21 Resource Base 7 22 Resource Development 10 23 Additions to the Resource Base 10 24 Landfill Gas Composition 11
3 FUEL CYCLE ANALYSIS OF LANDFILL-GAS-BASED PATHWAYS 13
31 LFG Reference Case 13 311 Flaring versus Venting Landfill Gas 13 312 Carbon Fate in LFG Fossil NG and Petroleum Fuel Cycles 15
32 Overview of LFG-to-CNGLNG Fuel Cycle 17 33 Gas Collection 18 34 Natural Gas Production 18
341 Pre-Purification 19 342 CO2 Removal 19 343 Process Efficiency 21 344 Energy Use Accounting 22
35 On-Site Power Generation 22 351 Technologies 23 352 Criteria Pollutant Emissions 23
36 Liquefaction 24 37 Transportation and Distribution 25
371 Transportation and Distribution of CNG 25 372 Transportation and Distribution of LNG 26
38 Vehicle Operation 26
iii
CONTENTS (CONT)
4 RESULTS AND DISCUSSION 28
41 Energy and Greenhouse Gas Emission Rates 28 411 WTW Energy 28 412 WTW Fossil Energy 30 413 WTW Greenhouse Gas Emissions 32
42 Energy and Greenhouse Gas Emissions per Mile Traveled 34 421 LFG-Based CNG 34 422 LFG-Based LNG 36
43 Balancing Energy Efficiency with Greenhouse Gas Emissions 38 44 Co-Product and Renewable Energy Credits 39
441 Carbon Dioxide 39 442 Renewable Energy Credits and Other Incentives 40
45 Criteria Pollutant Emissions 41
5 CONCLUSIONS 42
6 REFERENCES 44
APPENDIX A SMALL-SCALE NATURAL GAS LIQUEFACTION 49
APPENDIX B CRITERIA POLLUTANTS 52
FIGURES
1 Natural Gas Reserve Additions as Percent of Annual Production 1997ndash2007 3
2 Pipeline Capacity Additions 1998ndash2008 4
3 Disposition of Municipal Solid Waste 1960ndash2007 8
4 Typical Landfill Gas Production and Recovery Profile 9
5 Operational LFG-to-Energy Projects and Candidate Landfills by State 11
6 Fuel Cycle for Landfill-Gas-Based CNG and LNG as Used in GREET Modeling 14
7 CO2 Equivalent Emissions of Flaring versus Venting Landfill Gas 15
8 CO2 Emissions in LFG-to-CNGLNG Fuel Cycle 16
iv
FIGURES (CONT)
9 CO2 Emissions in Fossil NG-to-CNGLNG Fuel Cycle 16
10 CO2 Emissions in Petroleum GasolineDiesel Fuel Cycle 16
11 Gas Processing Cost (GPC) Associated with 1- 2- and 3-Stage Membranes 20
12 CO2 Washreg Process 21
13 NG Processing Efficiencies of LFG-Based Projects Producing Vehicle Fuel 22
14 WTP PTW and WTW Energy Use for LFG-to-CNGLNG Pathways versus Fossil NG-to-CNGLNG Gasoline and Diesel Pathways 29
15 WTW Fossil Fuel Use for LFG-Based Pathways versus NA NG and Petroleum Gasoline and Diesel Pathways 31
16 WTW GHG Emissions for LFG-Based Pathways Compared with NA NG and Petroleum Gasoline and Diesel Pathways 33
17 Energy Use for CNG from LFG or Fossil NA NG versus Petroleum Gasoline 35
18 Fossil Fuel Use for CNG from LFG or Fossil NA NG versus Petroleum Gasoline 35
19 GHG Emissions for CNG from LFG or Fossil NA NG versus Petroleum Gasoline 36
20 Energy Use for LNG from LFG or Fossil NA NG versus Petroleum Diesel 37
21 Fossil Fuel Use for LNG from LFG or Fossil NA NG versus Petroleum Diesel 37
22 GHG Emissions for LNG from LFG or Fossil NA NG versus Petroleum Diesel 38
A-1 Schematics of NG Liquefaction Processes 49
B-1 CO Emissions for LFG-Based Pathways Compared with NA NG and Petroleum Gasoline and Diesel Pathways 52
B-2 NOx Emissions for LFG-Based Pathways Compared with NA NG and Petroleum Gasoline and Diesel Pathways 53
B-3 PM10 Emissions for LFG-Based Pathways Compared with NA NG and Petroleum Gasoline and Diesel Pathways 53
v
FIGURES (CONT)
B-4 PM25 Emissions for LFG-Based Pathways Compared with NA NG and Petroleum Gasoline and Diesel Pathways 54
B-5 SOx Emissions for LFG-Based Pathways Compared with NA NG and Petroleum Gasoline and Diesel Pathways 54
TABLES
1 Distribution of Municipal Solid Waste 1960ndash2007 8
3 Assumptions for LFG-Based CNGLNG Fossil CNGLNG and
4 Emission Factors for LFG-Fueled IC Engines LFG Flares and
2 Composition and Characteristics of Biomethane and Fossil Natural Gas 12
Petroleum Pathways 17
US Power Generation 24
5 Plant Efficiencies of NG Liquefaction Technologies 25
6 Emission Factors for Diesel- and LNG-Fueled Heavy-Duty Trucks 27
7 WTW Total Energy Use for LFG-to-CNG Pathways by Stage 30
8 WTW Total Energy Use for LFG-to-LNG Pathways by Stage 30
9 WTW Fossil Fuel Use for LFG-to-CNG Pathways by Stage 31
10 WTW Fossil Fuel Use for LFG-to-LNG Pathways by Stage 32
11 WTW GHG Emissions for LFG-to-CNG by Pathway Stage 33
12 WTW GHG Emissions for LFG-to-CNG by Pathway Stage 33
13 WTW GHG Emissions for LFG-to-LNG by Pathway Stage 34
14 WTW GHG Emissions for LFG-to-LNG by Pathway Stage 34
A-1 Process and Train Efficiencies of Major NG Liquefaction Processes 50
vi
ACKNOWLEDGMENTS
The authors gratefully acknowledge Dennis Smith National Clean Cities Director and Vehicle Technologies Deployment Manager at the US Department of Energy who supported this effort They also acknowledge the assistance of Jeffrey Hahn of Covanta-Haverhill Inc and Andrew Burnham Amgad Elgowainy and Thomas Wallner of Argonnersquos Center for Transportation Research who provided their time and expertise to analyze and interpret data and advise us of its strengths and limitations Stephanie Young (formerly of the California Integrated Waste Management Board) Scott Walker of the California Department of Resources and Recovery (CalRecycle) Chuck White of Waste Management Inc and John Barclay of Prometheus Energy who provided access to documents and other resources and Rachel Goldstein of USEPA Jeffrey Clarke of NGVAmerica and Sean Turner of Gladstein Neandross amp Associates who reviewed an earlier draft of this report Thank you all
vii
viii
1
WELL-TO-WHEELS ANALYSIS OF LANDFILL GAS-BASED PATHWAYS AND THEIR ADDITION TO THE GREET MODEL
Marianne Mintz Jeongwoo Han Michael Wang and Christopher Saricks
EXECUTIVE SUMMARY
Today approximately 300 million standard cubic ftday (mmscfd) of natural gas and 1600 MW of electricity are produced from the decomposition of organic waste at 519 US landfills (EPA 2010a) Since landfill gas (LFG) is a renewable resource this energy is considered renewable When used as a vehicle fuel compressed natural gas (CNG) produced from LFG consumes up to 185000 Btu of fossil fuel and generates from 15 to 184 kg of carbon dioxide-equivalent (CO2e) emissions per million Btu of fuel on a ldquowell-to-wheelrdquo (WTW) basis This compares with approximately 11 million Btu and 782 kg of CO2e per million Btu for CNG from fossil natural gas and 12 million Btu and 975 kg of CO2e per million Btu for petroleum gasoline Because of the additional energy required for liquefaction LFG-based liquefied natural gas (LNG) requires more fossil fuel (222000ndash227000 Btumillion Btu WTW) and generates more GHG emissions (approximately 22 kg CO2e MM Btu WTW) if grid electricity is used for the liquefaction process However if some of the LFG is used to generate electricity for gas cleanup and liquefaction (or compression in the case of CNG) vehicle fuel produced from LFG can have no fossil fuel input and only minimal GHG emissions (15ndash77 kg CO2e MM Btu) on a WTW basis Thus LFG-based natural gas can be one of the lowest GHG-emitting fuels for light- or heavy-duty vehicles
This report discusses the size and scope of biomethane resources from landfills and the pathways by which those resources can be turned into and utilized as vehicle fuel It includes characterizations of the LFG stream and the processes used to convert low-Btu LFG into high-Btu renewable natural gas (RNG) documents the conversion efficiencies and losses of those processes the choice of processes modeled in GREET and other assumptions used to construct GREET pathways and presents GREET results by pathway stage GREET estimates of well-toshypump (WTP) pump-to-wheel (PTW) and WTW energy fossil fuel and GHG emissions for each LFG-based pathway are then summarized and compared with similar estimates for fossil natural gas and petroleum pathways
2
1 INTRODUCTION
Renewable energy is a growing part of the US energy mix rising from 4076 trillion Btu (64 of total energy production) in 1970 to approximately 6800 trillion Btu (95 of total energy production) in 2007 (EIA 2009a) To meet goals for reducing import dependence and greenhouse gas emissions major efforts are under way to increase production of wind solar geothermal and ldquonext-generationrdquo biofuels from energy crops agricultural residues wood waste and other organic materials Although the spotlight tends to focus on sophisticated new technologies ldquolow-techrdquo processes (like anaerobic digestion) have long produced renewable fuel Biomethane from municipal solid waste (MSW) deposited in sanitary landfills is one such option Comprising roughly one-half of the gaseous mixture known as landfill gas (LFG) this renewable energy source has only recently begun to be recovered in the United States In the past standard procedure was to either vent the gas or capture and flare it in a collection system (along with the other constituents in the mixture) While flaring reduces the global warming potential (GWP) of the LFG stream by a factor of eight it fails to utilize the approximately 500 Btustandard cubic ft (scf) in the stream1
Today 519 landfills recover energy from landfill gas (EPA 2010a) Projects range from small internal combustion engines or microturbines using LFG to generate power for site electrical needs to multiple generation units supporting site needs and exporting excess power to the grid A few projects use power (generated on-site from the LFG or purchased from the electric grid) to purify the LFG stream convert it into pipeline-quality natural gas (NG) and pressurize it either for injection into the NG pipeline system or use as a vehicle fuel A handful of projects liquefy the natural gas to fuel buses or refuse trucks or to be sold into the bulk liquefied natural gas (LNG) market These latter options mdash producing compressed natural gas (CNG) or LNG and using it as a vehicle fuel or for injection into the pipeline system mdash are the focus of this report
11 BACKGROUND
This project was undertaken in response to growing interest in applying well-to-wheels (WTW) analysis to renewable fuels There are many motivations for this interest Utilities are interested in identifying and pursuing options to meet renewable energy mandates States considering low carbon fuel standards are interested in promoting lower carbon options many of which are also renewable The US Environmental Protection Agency (EPA) is interested in reducing landfill emissions by assisting in LFG energy project development The US Department of Energy (DOE) is interested in providing information and guidance to support transparent objective comparisons of alternative fuel productiondeliveryutilization pathways
There is also continued interest in reducing reliance on foreign energy sources Natural gas is a clean-burning domestic resource that produces fewer greenhouse gases (GHGs) per unit than petroleum gasoline or diesel Supplies of this lower carbon fuel are plentiful now and likely
1 See Section 311 for a discussion of net reductions in greenhouse gases (GHGs) and GWP achieved from flaring landfill gas
3
to remain so for the foreseeable future (see Section 12) Moreover if sizable quantities of LFG-based NG were added to the NG fuel ldquopoolrdquo the carbon content of that pool could be reduced rendering NG an even more attractive fuel choice
This project applies WTW analysis to several LFG-based pathways Energy consumption and GHG emissions for each of those pathways are quantified and compared with petroleum gasoline and North American natural gas (NA NG) pathways for producing distributing and utilizing the respective fuel in motor vehicles This study is supported by DOErsquos Office of Vehicle Technologies (OVT) The OVT has long supported research on technologies to produce natural gas as a vehicle fuel engine modifications to better utilize natural gas fuel and analysis to determine the impacts of natural gas-based vehicle fuels Some of that work in support of pilot projects to demonstrate LFG-based vehicle fuel production is included in the data base developed for this study
12 US NATURAL GAS RESOURCES
In the past decade advanced ldquohorizontal drillingrdquo technology and historically high natural gas prices have spurred domestic drilling activity in turn increasing natural gas reserves and motivating developers to seek new markets for natural gas US annual reserve additions have grown from a level where they barely kept up with NG production to one that is now more than double production (Figure 1) Most of these new reserves are from so-called unconventional sources primarily coal-bed methane and shale gas each of which now accounts for 9 of US proved NG reserves (EIA 2008) By year-end 2007 the United States had 2377 trillion cubic feet (tcf) of proved reserves of dry natural gas the highest year-end volume in the 31 years that EIA (2008) has published such estimates
FIGURE 1 Natural Gas Reserve Additions as Percent of Annual Production 1997ndash2007 (EIA 2008)
4
In concert with vigorous exploration and production activity NG pipeline construction has climbed to connect new supplies to the existing gas distribution infrastructure as well as to expand distribution capacity system wide In 2008 pipeline capacity increased by four times the average for the prior decade (Figure 2)
FIGURE 2 Pipeline Capacity Additions 1998ndash2008 (EIA 2009b)
With increased reserves and distribution capacity developers are looking for new natural gas markets One possibility is to replace conventional coal-fired power plants with NG-fueled integrated-gasification-combined-cycle power plants2 Another is to replace motor gasoline or diesel with lower-carbon natural gas This latter option could be particularly attractive if the intent is to achieve deep CO2 cuts in sectors that currently have few economic low-carbon alternatives Transportation is one such sector Resource developers like TB Pickens (2009) have targeted transportation vehicles as a potential new market for natural gas Although compressed natural gas (CNG) -fueled vehicles have been available for many years the lack of a widespread public fueling infrastructure has limited their appeal to all but centrally fueled fleets Even then many centrally fueled fleets have been reluctant to invest in additional fueling infrastructure and vehicles with uncertain resale values
Uncertainty has been an especially strong barrier to the market acceptance of NG-fueled motor vehicles Transit operatorsrsquo need to meet ever-tougher exhaust emissions standards has spurred them to consider CNG or LNG-fueled buses However other technologies mdash like hybrids and a new generation of low-emission diesels mdash may also meet the standards With no clear technology ldquowinnerrdquo the looming prospect of a low-carbon fuel standard may be a persuasive argument for NG particularly from low-carbon sources like landfill gas
2 Note however that this option is most attractive when the difference between the cost of electricity and the cost of the fuel required to produce electricity is relatively small Called the ldquospark spreadrdquo this difference narrowed over the past decade but has increased since 2007
5
13 NATURAL GAS AS A VEHICLE FUEL
Historically natural gas has been used mostly for power production space heating industrial processes and as a petrochemical feedstock In the past decade however its relatively low emissions (as compared with diesel engines in internal combustion engines) have made it increasingly attractive as an urban bus fuel especially in California where emission standards for nitrous oxides (NOx) and particulate matter (PM) are particularly stringent To use natural gas as a vehicle fuel many transit operators have replaced diesel buses with CNG buses containing a new generation of spark-ignited engines Fueling generally relies on existing local distribution pipelines to deliver the gas under relatively low pressure compressors to increase the pressure to roughly 3600 psi for on-site storage and storagedispensing systems to load the gas onto vehicles at 3000ndash3600 psi Fleets that are not served by natural gas pipelines or that must travel a longer distance between fueling usually use liquefied natural gas (LNG) which is generally delivered in cryogenic tank trucks
Spurred by Californiarsquos Low Carbon Fuel Standard and the possibility of a similar national standard there is increasing interest in vehicle fuels with lower carbon footprints CNG and LNG derived from landfill gas are particularly promising For each million Btu of energy petroleum diesel contains 21600 grams of carbon while North American fossil-derived natural gas (NA NG) contains 16200 grams If only vehicle operation is taken into account on a Btu-to-Btu displacement basis switching from petroleum diesel to NA fossil-based CNG can reduce carbon emissions by 25 (assuming comparable operating efficiencies) As shown in Section 31 switching from NA fossil-based CNG to LFG-based CNG can reduce carbon emissions much more
14 RENEWABLE NATURAL GAS AND GHG EMISSIONS
Natural gas derived from LFG is considered a renewable fuel since the original source of the carbon in the decomposed waste can be traced back to organic sources that naturally replenish it It is also a low-carbon fuel Whether in the form of CNG or LNG LFG-based NG has negative GHG emissions since its conversion to vehicle fuel displaces GHG emissions that would have occurred if the LFG had been oxidized into CO2 in the landfill flare
Renewable natural gas is particularly attractive to utilities subject to renewable fuel mandates LFG-based CNG or LNG is attractive to fleet operators in states with low-carbon fuel standards Since natural gas is fungible the entity purchasing the rights to a supply of LFG-based NG need not take physical possession of it to gain renewable fuel credits
15 FUEL CYCLE ANALYSIS
To understand a fuelrsquos impact the entire fuel cycle mdash from production of raw materials to delivery and end use mdash must be considered This requires a systematic accounting of the energy and emissions of each stage in the cycle from ldquowellrdquo to ldquowheelrdquo (WTW) This study was undertaken to characterize pathways for producing vehicle fuel from landfill gas estimate WTW
6
energy and GHG emissions at each stage in these pathways and compare results with petroleum-and fossil NG-based alternatives In this context the ldquowellrdquo is the landfill gas resource and the ldquowheelrdquo is the vehicle consuming the fuel
The analysis was conducted by using the GREET (Greenhouse gases Regulated Emissions and Energy use in Transportation) model created by Argonne National Laboratory Developed in Microsoftreg Excel with a graphical user interface GREET is structured to systematically account for a range of potential feedstocks fuels and conversion processes for any defined WTW pathway Downloadable at httpwwwtransportationanlgov modeling_simulationGREET GREET calculates emissions of three greenhouse gases (CO2 CH4 and N2O) and six criteria pollutants (VOC CO NOx SOx PM10 and PM25) and consumption of each of the following total energy fossil fuel petroleum natural gas and coal
In the years since its development GREET has become a familiar and respected tool for evaluating vehicle technologies and fuels on a consistent systematic basis Working with industry and government experts Argonne continues to upgrade and update the GREET model With support from the US Department of Energy (DOE) Argonne has added a number of hydrogen production pathways for stationary and mobile internal combustion engine and fuel cell applications and extensive simulations of biofuel production pathways Most recently Argonne has upgraded simulations of plug-in hybrid electric vehicles (PHEVs) in GREET The most recent GREET fuel-cycle model (GREET18d0) was released in June 2010 Currently there are more than 10000 registered GREET users
16 SCOPE
As stated above this report documents the conceptual approach data and initial results for a set of LFG-to-vehicle fuel pathways These landfill gas-based pathways have been added to GREET 18d0
The report itself is organized into five sections supplemented by two appendices Following this brief Introduction Section 2 describes the size and characteristics of the LFG resource base while Section 3 discusses WTW pathways their key stages and important features of the fuel cycle analysis In Sections 4 and 5 estimates of well-to-wheel (WTW) fossil fuel use and GHG emissions are presented and conclusions are discussed Appendix A provides additional detail on liquefaction assumptions and Appendix B presents estimates of WTW emissions of criteria pollutants
7
2 LANDFILL GAS
At present most of the biomethane generated at US landfills is flared in conjunction with emissions-abatement practices (For further discussions of flaring and ldquoreference caserdquo assumptions see Sections 21 and 31) Relative to venting flaring reduces criteria pollutant and GHG emissions but it captures none of the energy (approximately 500 Btuscf) in the gas that is burned3 Moreover by destroying a valuable energy resource it precludes the generation of additional revenue by the landfill owner ndash either as energy sales or in various forms of carbon and renewable energy credits For these reasons there is increasing interest in converting methane in the collected LFG into usable energy like natural gas hydrogen methanol ethanol or electricity This study investigates the potential for WTW energy and GHG emission benefits as the result of producing LFG-based natural gas for vehicle use
21 RESOURCE BASE
Since the mid-1960s sanitary landfills have been the main disposal method for municipal solid waste (MSW) in the United States In 2007 there were an estimated 1754 ldquoactiverdquo landfills accepting 137 million tons of waste annually or approximately 54 of the total MSW generated in the United States (EPA 2008)4 As shown in Table 1 and Figure 3 this share has been dropping steadily since 1960
An additional 6000 landfills are inactive (ie no longer receiving waste) 5 Over their lifetime landfills produce significant quantities of landfill gas (LFG) primarily methane (CH4) and carbon dioxide (CO2) from the anaerobic decomposition of organic materials which typically comprise some 60 of the waste-to-landfill stream The EPA actively monitors emission compliance and energy recovery at active landfills the latter through its Landfill Methane Outreach Program (LMOP) Figure 4 produced from a model developed by EPArsquos LMOP illustrates a typical LFG generation and recovery profile for a site opened in 1980 at which peak recovery occurs in 2014 (EPA 2008) In conventional landfills gas recovery typically begins a decade or more after the waste is deposited and continues for several decades In newer designs (eg conventional cells with leachate circulation bioreactors or anaerobic
3 In 1994 EPA created the Landfill Methane Outreach Program (LMOP) to help reduce methane emissions from landfills by encouraging the recovery and use of landfill gas (LFG) as an energy resource LMOP is a voluntary program to promote alliances among states energy users and providers landfill owners and operators and communities by providing information analysis and support for LFG-to-energy projects
4 The other 46 consists of construction waste from new construction or remodeling activities debris from the demolition of buildings and roads industrial waste from manufacturing processes and wastes banned from the MSW waste stream (including MSW ash and medical waste)
5 Inactive landfills must comply with EPA post-closure requirements which include monitoring and maintaining waste containment systems and monitoring groundwater to ensure that waste is not escaping and polluting the surrounding environment These activities are generally required for 30 years from site closure During this time inactive landfills continue to emit methane and other gases At larger landfills equipped with gas collection systems LFG is usually captured and flared in a thermal oxidizer At smaller landfills LFG is usually uncontrolled
8
TABLE 1 Distribution of Municipal Solid Waste 1960ndash2007 (EPA 2008)
Percent of Total Generation
Activity 1960 1970 1980 1990 2000 2004 2005 2006 2007
Generation 100 100 100 100 100 100 100 100 100 Recovery for recycling 64 66 96 142 221 230 235 241 249 Recovery for compostinga Neg Neg Neg 20 69 82 82 82 85 Total materials recovery 64 66 96 162 290 312 317 323 334 Combustion with energy recoveryb 00 03 18 145 141 126 126 126 126 Discards to landfill other disposalc 936 931 886 693 569 562 557 551 540
Pounds per Person per Day
Activity 1960 1970 1980 1990 2000 2004 2005 2006 2007
Generation 268 325 366 450 465 466 463 465 462 Recovery for recycling 017 022 035 064 103 107 109 112 115 Recovery for compostinga Neg Neg Neg 009 032 038 038 038 039 Total materials recovery 017 022 035 073 135 145 147 150 154 Combustion with energy recoveryb 000 001 007 065 066 059 058 058 058 Discards to landfill other disposalc 251 302 324 312 264 262 258 257 250
a Includes composting of yard trimmings food scraps and other MSW organic material excludes backyard composting
b Includes combustion of MSW in mass burn or refuse-derived fuel form and combustion with energy recovery of source-separated materials in MSW (eg wood pallets and tire-derived fuel)
c Discards after recovery minus combustion with energy recovery Discards include combustion without energy recovery Details may not add to totals due to rounding
FIGURE 3 Disposition of Municipal Solid Waste 1960ndash2007 (EPA 2008)
9
FIGURE 4 Typical Landfill Gas Production and Recovery Profile
digestion of organics) accelerated waste stabilization permits economic recovery to begin much earlier typically within 5ndash10 years of waste deposition (University of Florida and University of Central Florida 2008)
Because of its high methane content LFG can be explosive as well as a potent source of greenhouse gases It is also a major source of non-methane organic compounds (NMOCs) a precursor of ground-level ozone formation Historically a system of vertical wells drilled into landfills was used to dilute the concentration of CH4 in the landfill to a level below methanersquos explosive limit (5ndash15 percent) thereby controlling the explosion hazard Most NMOC emissions have been controlled since 1996 when landfills with a permitted capacity greater than 25 million cubic meters of waste were brought under the Landfill Rule of the Clean Air Act which requires them to have collection systems consisting of low-pressure wells horizontal pipes and blowers to capture the LFG and a flare or thermal oxidizer to destroy it6 (Thus some 98 of NMOCs are converted to less toxic compounds and 999 of the methane is oxidized to CO2)
7 Although collection efficiencies reportedly range from 50 to 90 EPA estimates an average value of 75 for inventory purposes (EPA 1995) Methane in the remaining 25 of LFG that is uncontrolled (ie the area between the two curves in Figure 4) is typically oxidized to CO2 or converted to other compounds by microbes in the landfill cover soil Some of these compounds eventually are emitted to the atmosphere some remain in the soil
6 Of Californiarsquos 367 municipal solid waste landfills 218 (59) have a permitted capacity of less than 25 million m3 (CARB 2009) Nationally approximately 46 of the waste in the ground is not covered by the landfill gas rule Presumably much of the excluded waste is at small landfills
7 On June 25 2009 the California Air Resources Board (CARB) ruled that all previously uncontrolled MSW landfills in that state (ie those with permitted capacities below 25 million m3) must design and install gas collection systems by 2012 and that currently controlled landfills must improve gas collection efficiency (CARB 2009)
10
22 RESOURCE DEVELOPMENT
As of April 2010 EPA reports that 519 projects are recovering energy from landfills (EPA 2010a) More than 70 of these projects generate power most of the others minimally process the LFG and use it in boilers or various manufacturing applications (Godlove 2010) Approximately 13 billion kWh of electricity and 102 billion cubic feet (bcf) of natural gas are generated each year from recovered LFG (Godlove 2010) representing about 03 of US electricity and 03 of US natural gas consumption (EIA 2009a)
Some 32 projects currently convert LFG into high-Btu NG or ldquorenewable natural gasrdquo (RNG) mostly for injection into the pipeline system (Godlove 2010) A handful of these projects include vehicle fueling either as CNG or LNG (Ludwig 2009) In the past these latter projects have tended to be pre-commercial or pilot scale Now however several are coming on line at commercial scale or growing to commercial scale as second phases become operational These latter projects include
bull Altamont Landfill LFG-to-LNG in Livermore CA bull Frank R Bowerman Landfill LFG-to-LNG in Orange County CA bull Franklin County Landfill LFG-to-CNG in Columbus OH bull McCommas Bluff Landfill LFG-to-CNG and pipeline gas in Dallas TX bull Rumpke Landfill LFG-to-CNG and pipeline gas in Cincinnati OH
To the extent possible these projects are included in the database developed for this analysis Data on the following North American pilot-scale projects are also included in the database
bull Central Landfill LFG-to-CNG in Sonoma County CA bull Burlington County Landfill LFG-to-LNG in NJ bull Puente Hills Landfill LFG-to-CNG in Los Angeles CA bull Les Entreprises Berthier Inc (EBI) Landfill LFG-to-pipeline gas in Quebec bull Highland Valley Copper Landfill LFG-to-pipeline gas in Vancouver
Figure 5 shows operational LFG-to-energy projects as of April 2010 as well as landfills identified by the EPArsquos LMOP as candidates for future projects
23 ADDITIONS TO THE RESOURCE BASE
In addition to the ldquoin placerdquo LFG resource LFG continues to be generated by MSW decomposition Lear and Burdelski (2009) estimate that the current US population generates some 27 billion cubic ft (bcf) of ldquonewrdquo LFG each year equivalent to approximately 121 million gal of gasoline
11
FIGURE 5 Operational LFG-to-Energy Projects and Candidate Landfills by State (EPA 2010a)
24 LANDFILL GAS COMPOSITION
As shown in Table 2 methane (CH4) is the predominant constituent in both fossil natural gas and LFG Although gas composition varies from one site to another LFG typically contains around 45ndash50 methane (CH4) 35ndash40 carbon dioxide (CO2) and 10ndash15 nitrogen (N2) with smaller amounts of hydrogen (H2) oxygen (O2) hydrogen sulfide (H2S) and ammonia (NH3) The gas is usually saturated with water vapor
LFG may contain more than 500 different contaminants including a variety of sulfur compounds that are corrosive in the presence of water halogenated compounds (eg carbon tetrachloride chlorobenzene chloroform) that produce corrosive combustion products and organic silicon compounds (eg siloxanes) that form siliceous deposits in downstream applications mdash like internal combustion engines (Persson et al 2006) Thus an initial cleanup or pre-purification step is needed before LFG can be used in any application involving combustion
12
TABLE 2 Composition and Characteristics of Biomethane and Fossil Natural Gas
Parameter Unit EU LFG EU AD-Based
Biogas NG from NA
Gas Field NG from NNA
Gas Field NG distributed in
US
Source
LHV average range
Density average range
Btuft3
gft3
(Persson et al 2006)
406 584
348 321
1081 835ndash1336
224 195ndash279
(Segeler 1965)
1145 627ndash1717
1049 945ndash1121
239 195ndash369
215 203ndash246
CH4 average range
vol 45 36ndash65
63 53ndash70
515 847ndash988
770 228ndash980
894 728ndash952
H2 average vol 0-3 0 ndash ndash ndash
CO2 average range
vol 40 15ndash50
47 30ndash47
055 0ndash60
41 0ndash290
07 0ndash20
N2 average range
vol 15 5ndash40
02 ndash
403 0ndash294
17 0ndash121
29 0ndash171
O2 average range
vol 1 0ndash5
0 ndash
006 0ndash04
01 0ndash14
00 0ndash04
H2S average range
ppmv lt100 0ndash100
lt1000 0-10000
100 0ndash3100
400 0ndash5200
NMOC average (as Hexane) range
ppmv 1100 0ndash6600
2000 0ndash17000
400 0ndash1400
NH3 ppm 5 lt100 ndash ndash ndash
13
3 FUEL CYCLE ANALYSIS OF LANDFILL-GAS-BASED PATHWAYS
31 LFG REFERENCE CASE
The benchmark or reference case is critical to estimating the change in energy and emissions associated with introducing any new fuel or vehicle technology For fossil fuels the question is usually trivial mdash were it not for development of the resource to produce the new fuel energy and emissions would not occur Although process energy use and vehicle emissions may change in response to mandates requiring different fuel properties (eg low-sulfur diesel in place of conventional diesel or reformulated gasoline in place of unleaded gasoline) the resulting ldquonewrdquo fuel comes from the same feedstock as before and the benchmark or reference is the ldquooldrdquo fuel Thus the energy and GHG impact of the ldquonewrdquo fuel is simply the difference between the values associated with the ldquonewrdquo and ldquooldrdquo fossil fuels
This is not usually the case with renewable fuels If the feedstock historically has not been used to produce fuel the energy and GHG impact of the new fuel is the difference between energy and GHG emissions associated with the resourcersquos typical prior use (ie the pathway or reference case) and its new one With respect to landfill gas the key questions are
bull What is the typical prior use for LFG
bull Would the LFG have been produced in a conventional landfill gathered in a standard gas collection system and flared Or would it have been produced some other way With different constituents With more methane emitted to the atmosphere
bull At what point does the new LFG pathway diverge from the old
Since we are concerned with the difference in energy and GHG emissions between the two pathways the answer to the last of the above questions helps bound our system Shared stages can be ignored since they are in both ldquooldrdquo and ldquonewrdquo pathways Thus for example gas that continues to be flared (ldquoFlared LFGrdquo in Figure 6) is excluded from LFG-based pathways which are labeled as cases within the dashed system boundary shown in Figure 6
311 Flaring versus Venting Landfill Gas
Since the mid-1990s MSW landfills with a design capacity of 25 million m3 or more have been regulated under the Landfill Rule of the Clean Air Act (EPA 2000) To reduce emissions of volatile organic compounds air toxics and methane these large landfills are required to install collection wells into the landfill and route the gas to a suitable energy recovery or combustion device (flare) to monitor surface methane on a quarterly basis and to expand their collection systems if the methane concentration exceeds 500 parts per million
As shown in Figure 7 flaring dramatically reduces the impact of carbon contained in organic waste Emitted to the atmosphere as CH4 the carbon in the waste has a CO2 equivalence
14
of 368 emitted as CO2 the equivalence is reduced to 44 The resulting ratio (36844 = 836) is the relative benefit of flaring over venting the landfill gas
The Landfill Rule succeeded in reducing VOCs and air toxics and in cutting methane emissions by over 37 million metric tons (EPA 1996) Few would argue that the approximately $22 million in capital and $190000 in annual operating cost required to retrofit each covered landfill was not money well spent (EPA 1996) However it was soon recognized that the energy in the flared gas roughly 500 Btuft3 could be more productively utilized Thus EPArsquos Landfill Methane Outreach Program (LMOP) was created to encourage the recovery and use of LFG as an energy resource LMOP currently has over 800 partners mdash including energy providers landfill owners and operators and host communities mdash involved in LFG-to-energy projects
FIGURE 6 Fuel Cycle for Landfill-Gas-Based CNG and LNG as Used in GREET Modeling
15
FIGURE 7 CO2 Equivalent Emissions of Flaring versus Venting Landfill Gas
312 Carbon Fate in LFG Fossil NG and Petroleum Fuel Cycles
As discussed above flaring emits CO2 Purifying the LFG and converting it into CNG or LNG for vehicle fuel still emits CO2 However the CO2 would have been emitted anyway (hence there is no net addition) Moreover the CO2 from LFG displaces a near equivalent amount of CO2 from fossil fuels (natural gas or petroleum) that would have been emitted if the vehicles operating on LFG-derived CNGLNG had not been converted from their original fossil fuel
Figures 8ndash10 depict the various stages of the LFG fossil NG and petroleum fuel cycles showing where carbon is emitted to the atmosphere As discussed earlier the LFG fuel cycle (Figure 8) begins with gas collection which is assumed to capture 75 of the total LFG produced A portion of the collected carbon is assumed to be flared either in waste gas from the purification process or as excess LFG that cannot be processed Carbon is also emitted in transportation and distribution (TampD) and vehicle operation
For comparison purposes Figures 9 and 10 show fossil NG and petroleum fuel cycles As in the LFG fuel cycle carbon is emitted in feedstock production processingrefining TampD and vehicle operation
16
FIGURE 8 CO2 Emissions in LFG-to-CNGLNG Fuel Cycle
FIGURE 9 CO2 Emissions in Fossil NG-to-CNGLNG Fuel Cycle
FIGURE 10 CO2 Emissions in Petroleum GasolineDiesel Fuel Cycle
17
32 OVERVIEW OF LFG-TO-CNGLNG FUEL CYCLE
Figure 6 illustrates the 10 LFG-based pathways investigated in this study Shown within the dashed system boundary pathways include the resource mdash LFG collected by the gas collection system (discussed in Section 33) a cleanuppurification process to convert it into NG (discussed in Section 34) electricity from either an on-site generator or the grid assuming the US average generation mix (discussed in Section 35) and if fueling is off-site pipeline or truck delivery of the product NG to stations where it is compressed for vehicle fueling For pathways in which LNG is produced a liquefaction process (discussed in Section 36) occurs between production and transportation and distribution (TampD which is discussed in Section 37) Note that this fuel cycle is but a portion of the lifecycle of municipal solid waste
Table 3 summarizes the assumptions of each pathway The collected LFG is converted to NG via pre-purification and CO2 removal The NG production process usually requires electricity as a process fuel that can be delivered by an on-site distributed generator (RC-1 RC-2 RL-1 RL-2 and RL-3) or from the grid (RC-3 RC-4 RL-4 RL-5 and RL-6) During NG processing waste gases (including contaminants CO2 and unrecovered CH4) may be returned to the input stream or flared Since the waste gases are not involved in NG processing (ie they essentially flow through the process) they are subtracted from the LFG feed for modeling purposes Thus in all GREET-modeled pathways the LFG feed is assumed to include only CH4
converted into NG or used for on-site power generation
TABLE 3 Assumptions for LFG-Based CNGLNG Fossil CNGLNG and Petroleum Pathways
Case Transportation amp No Feedstock Fuel Electricity Source Fueling Distribution (TampD)
RC-1 LFG CNG Site Generation On-site NA RC-2 LFG CNG Site Generation Off-site Pipeline RC-3 LFG CNG US Average Mix On-site NA RC-4 LFG CNG US Average Mix Off-site Pipeline CNG NA NG CNG US Average Mix Off-site Pipeline CG Crude Gasoline US Average Mix Off-site Mixed Mode
RL-1 LFG LNG Site Generation On-site NA RL-2 LFG LNG Site Generation Off-site LNG Truck RL-3 LFG LNG Site Generation Off-site Diesel Truck RL-4 LFG LNG US Average Mix On-site NA RL-5 LFG LNG US Average Mix Off-site LNG Truck RL-6 LFG LNG US Average Mix Off-site Diesel Truck LNG NA NG LNG US Average Mix Off-site Pipeline LSD Crude Diesel US Average Mix Off-site Mixed Mode
18
For renewable CNG (RC cases in Figure 6) the produced gas is compressed by an electric compressor at a fuel station For on-site fueling cases (RC-1 and RC-3) the necessary electricity is supplied by the genset for off-site fueling cases (RC-2 and RC-4) electricity comes from the grid For renewable LNG (RL cases in Figure 6) the produced gas is liquefied by a small on-site liquefier NG production and liquefaction use the same power source (ie a distributed generator for RL-1 RL-2 and RL-3 and the grid for RL-4 RL-5 and RL-6) The produced liquid can be dispensed at an on-site fuel station (RL-1 and RL-4) or transported to off-site stations via LNG trucks (RL-2 and RL-5) or diesel trucks (RL-3 and RL-6) Note that LNG trucks are fueled by the LFG-based LNG
In this study energy and material inputs and outputs are characterized for the steps in the LFG-to-CNG and LFG-to-LNG fuel cycles in order to estimate overall energy and greenhouse gas emissions associated with pathways As with other GREET pathways results for LFG-based CNG and LNG are estimated in units of energy use and emissions per unit of consumed energy andor per mile driven with vehicles fueled with CNGLNG For ldquowell-to-pumprdquo (WTP) results this includes NG production transmission and distribution of the fuels for ldquowell-to-wheelsrdquo (WTW) results it includes WTP results plus consumption or emissions during vehicle operation Estimates are then compared with results for fossil North American natural gas (NA NG) and conventional petroleum pathways
Note that conventional NA NG and petroleum pathways start with energy in the unrecovered feedstock while the landfill gas pathway starts with energy in the collected feedstock (ie LFG) As pointed out in Brinkman et al (2005) the GREET model accounts for energy use at different starting points for different fuels For fossil fuels mdash such as NA NG gasoline diesel and electricity from fossil fuels mdash the accounting system starts with primary feedstock recovery In this study the energy in the collected LFG is not of concern because it would have been flared if not converted to NG Therefore landfill gas pathways start with the processing of collected LFG Details about the energy accounting are discussed in Section 344
33 GAS COLLECTION
As stated earlier pathways begin with a process stream of LFG which is assumed to be 75 of the total LFG produced (Figure 6) While this share is consistent with EPA assumptions it is not a critical parameter8 Instead of going to the flare a blower diverts the collected LFG to a cleanup unit
34 NATURAL GAS PRODUCTION
The NG production process includes pre-purification and purification (primarily CO2
removal) The processes can use similar technologies and are closely integrated in many cases Also the required process energy or process efficiency is often reported as an integrated process
8 Others claim that the average share of LFG collected is closer to 90 (Sullivan 2010) However because GREET pathways begin with the processing of collected LFG the share lies outside our fuel cycle system boundary and does not affect results
19
Therefore NG production efficiency in this study is defined as the energy in the produced NG divided by the sum of the energy in the LFG fed to the pre-purification step plus the process electricity for pre-purification and CO2 removal
341 Pre-Purification
The collected landfill gas must be treated to remove impurities before it enters the CO2
removal process Impurities include corrosive hydrogen compounds low concentrations (parts per million) of non-methane organic compounds (NMOCs including siloxane) and water As stated in 40 CFR Parts 72 and 75 the level of hydrogen sulfide (H2S) mdash a corrosive toxic and flammable gas with unpleasant odor mdash must be reduced to less than 5 ppm (or 03 g100 scf) for pipeline natural gas Many well-established processes (eg absorption adsorption and chemical and thermal oxidation)9 are available for H2S removal from gas fluxes (Syed et al 2006) One of the most common is an iron oxide-based sulfur scavenging process (Kohl and Nielsen 1997) in which hydrogen sulfide reacts with iron oxide to form iron sulfide while the landfill gas flows through granular iron-oxide in a bed The process is suitable for the treatment of relatively small volumes of gas For dehydration pressure swing adsorption (PSA) or refrigerated drying are widely used
The output mdash pre-purified landfill gas mdash can then be used to fuel an on-site power-generator providing electricity for CO2 removal and further conditioning steps as well as export power
342 CO2 Removal
The H2S-treated and dehydrated landfill gas is further purified by removing CO2 from the gas stream Four types of technologies are widely employed membrane separation adsorption absorption and cryogenic distillation To enhance the quality of the product fuel more than one technology may be used in series Further details are explained below
Membrane Separation
Since CO2 is more permeable than CH4 the two may be separated by selective permeation through membranes When the landfill gas contacts the membrane more CO2 than CH4 permeates although quantities depend on the partial pressure difference across the membrane As shown in Figure 11 CO2 concentration in the LFG feed affects the optimum number of membrane stages (Spillman 1995 Datta and Sen 2006) Since two-stage and three-stage membrane systems are more economical (in dollars per normal m3 of product gas) than single-stage systems a second membrane system or a secondary amine process is often used in landfill gas projects (Pomerantz and Turcotte 2004)
9 These same technologies are used in large-scale NG processing plants but with somewhat different sulfur scavenging processes
20
FIGURE 11 Gas Processing Cost (GPC) Associated with 1- 2- and 3-Stage Membranes (Datta and Sen 2006)
Membrane separation is amenable to a wide range of process stream volumes CO2
concentrations and product-gas specifications It also tends to be more environmentally friendly than amine processes Since membrane separation operates at relatively high pressure ranging from 200 to 600 psig (Air Liquide 2009 Pomerantz and Turcotte 2004) a further benefit is reduction in compression requirements for CNG production or injection into the gas grid
Adsorption
Swing adsorption separates CO2 from landfill gas by collecting CO2 on the surface of an adsorbent Parameters affecting the collection include temperature total pressure and partial pressure of the constituent gases In pressure swing adsorption (PSA) the pressure is swung (since CO2 is adsorbed more easily than CH4 under high pressure) and the CH4-rich gas that is not adsorbed flows through the vessel Once the adsorbent in the vessel is saturated adsorbed CO2 is removed by reducing the pressure to ambient A cycle of PSA adsorption and desorption is typically relatively short since common industrial practice is to use multiple vessels to maintain a constant feed flow and output gas product PSA operates at relatively high pressure the pressure of the product gas ranges from 100 to 200 psig (Sperling Hansen Assoc 2007)
Absorption
In absorption processes molecules in gas phase (eg H2S and CO2) are removed as they become liquid phase in solutions The amine process one of the most common absorption processes in the natural gas industry uses aqueous solutions of various alkanolamines to remove H2S and CO2 In a typical process a CO2- and H2S-rich gas passing upward through an absorber contacts a downward-flowing amine solution that absorbs CO2 and H2S The purified gas flows through to the top of the absorber while the amine-rich gas is collected at the bottom where it is sent to a regenerator to produce lean amine In some landfill gas recovery projects water scrubbing (ie water is the absorbent) is used in place of an amine solution
21
Cryogenic Distillation
Cryogenic distillation uses the relatively higher boiling temperature of CO2 mdash as compared with CH4 mdash to separate it from landfill gas CO2 Washreg developed by Acrion Technologies illustrates the cryogenic distillation process 10 As in the amine process dry compressed landfill gas enters the bottom of an absorber column flows upward and contacts a downward-flowing solution (in this case liquid CO2) which ldquowashesrdquo out contaminants (see Figure 12) When the contaminant-free landfill gas is cooled by refrigeration at the top of the absorber (typical gas temperature is ndash59degF) the CO2 in the gas is condensed The clean gas exits at the top of the absorber and some of the liquid CO2 can be collected for possible co-product use The rest of the CO2 flows downward as the absorbent The contaminant-free gas is clean enough to provide a hydrogen source for a fuel cell or a feedstock for chemical synthesis such as methanol However since its CO2 concentration (~27) is still higher than pipeline quality natural gas or transportation fuel further treatment or post purification (for example using membrane separation) is required (Cook et al 2005)
343 Process Efficiency
Data to develop the NG production process efficiency were obtained by literature search and direct contact with developers of a number of pilot- and commercial-scale LFG-to-NG projects whose information is publicly available These include Acrion 2009 Cook 1998 Cook 2002 Prometheus 2007 Sperling Hansen Assoc 2007 Pomerantz and Turcotte 2004 GTI 2007 and Johansson 2008 As shown in Figure 13 the energy efficiency of NG processing at these sites ranges from about 91 to 97 with larger projects tending to achieve somewhat higher efficiency Although most projects generate their own electricity for NG processing two projects do not report the amount of LFG used for on-site power generation and none report the share of co-generated electricity exported to the grid Thus all co-generated electricity is assumed to be used for NG production and NG processing efficiency is calculated from the energy content of the landfill gas used assumed liquefaction efficiency (see Section 36) and assumed generator efficiency (ranging from approximately 28 to 44) On the basis of these data and assumptions the default NG processing efficiency is calculated as 944
FIGURE 12 CO2 Washreg Process (Acrion 2009)
10 A key advantage of CO2 Washreg is that it uses liquid CO2 separated from landfill gas to absorb other impurities
22
FIGURE 13 NG Processing Efficiencies of LFG-Based Projects Producing Vehicle Fuel
344 Energy Use Accounting
Although LFG-based CNGLNG contains the same amount of energy as fossil-based CNGLNG the former is renewable (ultimately from solar energy) while the latter is not This highlights a key issue in GREET simulation of LFG-based pathways mdash namely the appropriate treatment of the energy in LFG This energy is produced from the decomposition of organic materials by methanogenic bacteria in the waste stream From the point of view of energy accounting the ldquosystemrdquo includes only the solar energy recovered from the organic materials since the losses from solar energy to organic material and from organic material to LFG are irrelevant As with other biogenic energy sources the solar energy embedded in LFG can be ignored since it would be unused if not captured Thus the LFG fuel cycle includes only the energy in the LFG (as total energy but not fossil fuel) when it is used to generate power for processing (or for addition to the grid) for compressionliquefaction and TampD and for vehicle operation However if the amount of co-generated electricity equals the amount of process electricity required (for LFG processing and compression or liquefaction) or the plant does not import or export electricity only the energy used by the genset or converted to NG needs to be counted On the other hand if the generator produces less electricity than needed for processing the remainder must be imported from the grid and upstream energy use and emissions for imported grid electricity must be included in the fuel cycle analysis Likewise if the amount of co-generated electricity exceeds process needs the excess can be sold to the grid (displacing an equivalent amount of electricity) and upstream energy and emissions (for the displaced grid electricity) must be taken as credits11
35 ON-SITE POWER GENERATION
Many landfill gas recovery projects incorporate on-site generators to produce process electricity Established technologies include internal combustion engines (ICEs) and natural gas turbines
11 For LFG-based CNGLNG pathways we assume that the genset generates the same amount of electricity as the amount of process electricity required meaning no electricity is imported or exported
23
351 Technologies
ICEs are typically spark-ignition reciprocating engines powered by the pre-purified landfill gas (or biogas) ICEs offer low initial cost easy start-up proven reliability and good part-load characteristics and heat recovery potential Emissions can be controlled by exhaust catalysts selective catalytic reduction and better control of the combustion process NREL and EPRI forecast electric efficiencies for natural gas ICEs ranging from 33 for rich-burn engines to 44 for lean-burn engines by 2010 (Goldstein et al 2003 EPRI 2004)
Combustion turbines can develop power over a wide capacity range from several kilowatts to hundreds of megawatts Microturbines small combustion turbines with outputs in the range of 30ndash200 kW are suited to lower-capacity applications like LFG recovery Microturbines (MTs) are capable of producing power at improved efficiencies by recuperating heat from the exhaust gas to the incoming air stream They also have the advantage of no gearbox or lubricating oil requirement and high engine speed (ranging from 80000 to 100000 rpm) (Dunn 2000) NREL and EPRI forecast microturbine and small gas turbine efficiencies of 29ndash40 by 2010 (Goldstein et al 2003 EPRI 2004)
352 Criteria Pollutant Emissions
Since all but one of the landfill gas projects reviewed in this study use ICEs for on-site power generation and emissions data are more generally available for LFG-fueled ICEs than for MTs ICE engines are the default technology for LFG-fueled power generation in GREET On the basis of available data their default electric efficiency (electricity from the genset divided by energy in the LFG feed to the genset) is set to 35
Since it is assumed that electricity is the only energy source used in the process (other than the LFG itself) emissions from power generation are the only emissions that need be taken into account in the fuel cycle analysis These are calculated from newly developed GREET emission factors for LFG-fueled stationary IC engines Most current projects producing pipeline-quality gas or CNGLNG for vehicle fuel utilize IC engines in the range of 1ndash2 MW that must meet point source standards for criteria pollutant emissions Since local rules are often stricter than federal standards GREET emission factors are based on the former calculated from project-level data contained in permit applications and source tests Default factors for emissions of volatile organic compounds (VOCs) carbon monoxide (CO) nitrogen oxides (NOx) and particulates of 10 micrometers or more (PM10) are calculated from these data Methane (CH4) and nitrous oxide (N2O) emissions are rarely reported in source tests since they are not regulated12 Moreover field measurements of N2O are generally below detection limits Thus GREET emission factors for unburned methane (ie CH4 slip) from the IC engine are based on the relative methane destruction efficiency of stationary IC engines as compared with the flare GREET default emission factors for carbon dioxide (CO2) and sulfur oxide (SOx) from on-site power generation are estimated as a function of genset efficiencies the carbon and sulfur content of input and output gas streams and values reported in the literature
12 Although CH4 could be calculated as the difference between total HC and NMHC the result is not accurate because the methodologies are not consistent
24
TABLE 4 Emission Factors for LFG-Fueled IC Engines LFG Flares and US Power Generation
Factor (gmmBtu) VOC CO NOx PM10 PM25 SOx CH4 N2O CO2
LFG-Fueled ICEs 627 2735 201 85 85 027 446 087 57600 LFG Flares 237 415 162 50 50 027 316 11 59200 US Average Power 34 455 187 130 70 474 38 267 207000 Generation
Since LFG is assumed to be flared unless used in the generator or converted to NG avoided emissions (from the flare) are considered credits Emission factors for VOC CO NOx and PM10 from LFG flares are used to calculate these credits (EPA 1995) As stated above CH4
emission factors are calculated from the destruction efficiency of LFG flares (9986) (SCS 2007 TRC Environmental Corporation 2008) while CO2 and SOx emission factors are calculated by using a carbon and sulfur balance approach
Table 4 summarizes the emission factors for LFG-fueled IC engines and LFG flares as compared to those for US power generation (ie the average emission factor for the mix of technologies used for electricity production) Note that upstream emissions of the US average mix are substantial (155 g VOCMMBtu 376 g NOxMMBtu 274 g PM10MMBtu 685 g PM25MMBtu and 283 g CH4MMBtu) while LFG produces no upstream emissions
36 LIQUEFACTION
For LNG production the clean gas is liquefied at the recovery site for both on-site and off-site fueling pathways Clean gas is cooled to ndash260degF and if necessary a post-purification step is used to further enhance the quality of LNG This is usually accomplished by flash evaporation of nitrogen Produced LNG is stored on-site as a cryogenic liquid in insulated storage vessels at 50ndash150 psi
Efficiency is the primary determinant of energy use and emissions associated with NG liquefaction Efficiency data for several technologies of interest to this analysis are summarized in Table 5 According to Brendeng and Hetland (2004) the propane pre-cooled mixed refrigerant (C3MR) process accounts for nearly 80 of large-scale liquefaction units and almost 90 of global capacity Although representing a smaller share of global capacity the single mixed refrigerant (SMR) and expander processes are considered good candidates for small-scale liquefaction and are already used in some LFG projects (Cook et al 2005 GTI 2007 Prometheus Energy Corp 2007) In this study SMR and expander processes are assumed to be representative of small-scale liquefaction and thus the default NG liquefaction efficiency is set to 89 which is relatively lower than the large-scale efficiency assumption (91) used elsewhere in GREET Appendix A contains a more detailed discussion of the liquefaction calculations and assumptions used in this analysis
25
TABLE 5 Plant Efficiencies of NG Liquefaction Technologies (Vink and Nagelvoort 1998)
Technology C3MRa Cascade DMRb SMRc Expander
Plant Efficiency () 907 890 905 894 882 a
b C3MR Propane pre-cooled mixed refrigerant DMR Dual mixed refrigerant
c SMR Single mixed refrigerant
37 TRANSPORTATION AND DISTRIBUTION
As mentioned earlier the produced CNGLNG can be dispensed at an on-site fuel station or transported to off-site fuel stations via pipeline (if CNG) or heavy-duty truck (if LNG) For off-site fueling GREET default assumptions are used to calculate feedstock loss and transport energy consumption but transport distance is reduced to 50 miles
371 Transportation and Distribution of CNG
Assuming that the pressure of the produced NG is high enough to be directly injected into a local distribution system (200 psig) no addition energy consumption or emissions are considered for both on-site and off-site CNG cases other than those in conjunction with dispensing into a CNG-fueled vehicle At fuel stations the produced NG is compressed to 4000 psia by electric compressors The electric compressors at an on-site station are assumed to use electricity supplied by the on-site LFG-fueled generator while those at off-site stations are powered by grid electricity Compression efficiency defined as the heating value of the compressed gas divided by the sum of energy used during NG compression and the heating value of the compressed gas is calculated from the following formula based on an adiabatic process (Wang et al 2001)
Compression Efficiency =
FD Wmin +
FDCE x EE
where
Wmin
N k M
= = = =
minimum work required for gas compression (W) number of compression stages (6 for off-site 5 for on-site fuel stations) ratio of specific heats (132 for NG) mass flow (kgs)
26
R = universal gas constant (Jkg K 518 for NG) T = temperature (K) Z = compressibility factor obtained from the Redlich-Kwong equation of state P2 = final pressure (4000 psia for fuel station) P1 = initial pressure (200 psia for on-site stations 50 psia for off-site fuel
stations)
Compression Efficiency = overall efficiency of compression FD = fuel delivered (kW) CE = work efficiency of compressors (80 for pipeline and 65 for fuel station)
and EE = engine efficiency (92ndash95 with electric motors)
372 Transportation and Distribution of LNG
As mentioned earlier LNG can be dispensed at an on-site fuel station or transported to off-site fuel stations via cryogenic tank truck Trucks are assumed to be fueled by either LFG-based LNG from the plant or petroleum diesel If LFG-based LNG is used the direct NG consumption is excluded from fossil fuel accounting but not total energy accounting since the produced LNG is a renewable fuel Also avoided emissions (from the flare) due to the LFG-based LNG use are considered credits
38 VEHICLE OPERATION
Fuel economy is essential for estimating fuel cycle results per mile traveled In this study we assume that light-duty vehicles (LDVs) operate on CNG while heavy-duty vehicles (HDVs especially refuse trucks) operate on LNG Thus results for CNG- and LNG-fueled vehicles are compared to those for conventional gasoline (CG) LDVs and diesel (CD) HDVs respectively We also assume that CG LDVs achieve the GREET default fuel economy and emissions and that CNG LDVs are as efficient as CG LDVs
On the other hand LFG-based LNG is expected to fuel buses and refuse trucks The latter application is particularly appealing since vehicles could be fueled on-site in the course of their normal duty cycle As with LDVs results for a ldquoper mile traveledrdquo metric require estimating the fuel economy of diesel- and LNG-fueled HDVs Refuse truck fuel economy is reported in only a few publications According to Chandler et al (2001) the fuel economy of diesel-fueled refuse trucks is 257 mpg Transit bus fuel economy is more readily available According to Watt (2000) Chandler et al (2000) Chandler et al (2006) and Barnitt et al (2006) current diesel-fueled transit buses are 20 more fuel efficient than CNGLNG-fueled buses However this advantage is likely to drop as manufacturers equip new diesel buses with particulate traps and other controls in order to meet stiff 2010 emissions standards Cummins-Westportrsquos new ISL G line of natural gas engines is already achieving fuel efficiencies that more closely mirror diesel fuel efficiencies (CWI 2009) For this study we assume that diesel-fueled HDVs will be 10 more fuel-efficient than LNG-fueled HDVs
27
HDV emission factors for CO PM and NOx are based on EPArsquos engine certification data for Cummins ISL G engines (EPA 2010b) converted to gmi by using conversion factors and brake specific fuel consumption (BSFC) for heavy-duty vehicles provided by ARCADIS Geraghry amp Miller Inc (2002) Since hydrocarbon emissions (including CH4 and VOC) are below detection limits in the certification data base emission factors for these pollutants are set to zero N2O emission factors are based on existing GREET defaults while SOx and CO2
emissions are estimated from carbon and sulfur balance calculations Table 6 summarizes the resulting emission factors for diesel- and LNG-fueled heavy-duty trucks
TABLE 6 Emission Factors for Diesel- and LNG-Fueled Heavy-Duty Trucks
Emissions by Pollutant (gmi)
Fuel VOC CO NOx PM10 PM25 SOx CH4 N2O CO2
DieselLNG
0 0
008 660
166 105
0007 0
0007 0
0024 0
0 0
010 009
3533 2857
28
4 RESULTS AND DISCUSSION
Total energy fossil energy criteria pollutant emissions and greenhouse gas emissions for 10 LFG-based pathways have been added to the GREET model WTW results are discussed below
41 ENERGY AND GREENHOUSE GAS EMISSION RATES
Total energy use per MMBtu of fuel consumed ldquoat the wheelrdquo is nearly flat for the four LFG-to-CNG-based pathways and roughly comparable to LNG from NA NG and petroleum diesel pathways The six LFG-to-LNG pathways are roughly comparable to each other and to the petroleum gasoline pathway CNG from NA NG has somewhat lower WTW energy use than other pathways because fossil NG processing consumes substantially less energy than either LFG-based processing or petroleum refining
Fossil energy use and GHG emissions present a very different picture Because vehicle operation uses renewable LFG-based fuel GREET results show a significant reduction in WTW fossil fuel use and GHGs for all LFG-based pathways The largest reductions are for LFG-to-CNG pathways using LFG-fueled on-site power generation With on-site vehicle fueling (ie no TampD for the produced CNG) fossil fuel use is completely eliminated
411 WTW Energy
Figure 14 compares well-to-pump (WTP) pump-to-wheels (PTW) and well-to-wheels (WTW) energy use for each LFG-based pathway with similar results for fossil NG (CNG from NA NG LNG from NA NG) gasoline from conventional petroleum and diesel from conventional petroleum Petroleum-based pathways are shown to permit comparison with cases in which the LFG-based fuel replaces gasoline in light-duty vehicles or diesel in heavy-duty vehicles Since LFG-based LNG could replace diesel in refuse haulers or transfer trucks the latter case is particularly interesting to operators of landfills or fleets of waste collection vehicles
As stated earlier WTW total energy use (the sum of WTP and PTW bars in Figure 14) depends largely on system efficiency Thus landfill gas-based CNG typically requires more total energy than fossil CNG or petroleum gasoline and LFG-based LNG requires more total energy than fossil LNG or petroleum diesel Because compression is more energy efficient than liquefaction LNG requires more total energy than CNG By contrast the choice of process fuel in NG processing or for TampD has little effect on WTW total energy use because the difference in energy efficiency is relatively small and total energy use is dominated by vehicle operation (PTW)
29
To
tal E
ner
gy
(Btu
mm
Btu
) 1400000
1200000
1000000
800000
600000
400000
200000
0
RC-1 RC-2 RC-3 RC-4 CNG CG RL-1 RL-2 RL-3 RL-4 RL-5 RL-6 LNG LSD
On-site Off-site On-site Off-site On-site Off-site LNG
Off-site Diesel
On-site Off-site LNG
Off-site Diesel
Distributed Generation Grid Electricity NA NG Distributed Generation Grid Electricity NA NG
Compressed Natural Gas Gasoline Liquefied Natural Gas Diesel
PTW
WTP
FIGURE 14 WTP PTW and WTW Energy Use for LFG-to-CNGLNG Pathways versus Fossil NG-to-CNGLNG Gasoline and Diesel Pathways
Table 7 displays WTW energy use by stage for LFG-to-CNG pathways Pathways using on-site power generation (with on-site or off-site vehicle fueling) and grid electricity are shown as are pathways for CNG from NA NG (with off-site fueling) and for petroleum gasoline Cells corresponding to subcategories are shown without shading while cells corresponding to subtotals for WTP and WTW energy are shaded gray As discussed earlier the life cycle for LFG-based fuels begins with fuel production hence there are no entries for feedstock recovery or feedstock transportation in Table 7 Fuel production and vehicle operation are the main energy-consuming stages Because production of CNG from LFG is on a much smaller scale and requires more cleanup than CNG from NA NG it uses 4ndash5 times the fuel production energy of CNG from NA NG Nonetheless production of CNG from LFG uses less energy than production of petroleum gasoline Adding its far greater energy expenditure for TampD (primarily for compression during vehicle fueling) CNG from LFG has comparable WTP and WTW energy use to petroleum gasoline (but not CNG from NA NG which it exceeds by 30ndash35)
By definition PTW (or vehicle operation) energy use has a value of 1000000 (1000000 fuel Btu per 1000000 Btu of energy use) for all pathways shown in Table 7 Since grid electricity is more energy efficient than on-site generation fuel production with grid electricity uses approximately 10 less energy
Table 8 contains a comparable breakdown of WTW energy use for LFG-to-LNG NA NG-to-LNG and petroleum diesel pathways Pathways using on-site power generation (with on-site or off-site vehicle fueling) and grid electricity are shown as are pathways using LFG-based LNG or petroleum diesel for fuel TampD Again feedstock recovery and transmission stages do not apply to LFG-based pathways fuel production is the major energy expenditure use of distributed power increases energy use and vehicle efficiencies are set to 1000000 Here however LNG from LFG uses approximately 50 more energy WTP than LNG from NA NG
30
TABLE 7 WTW Total Energy Use for LFG-to-CNG Pathways by Stage (BtuMM Btu produced)
Landfill Gas-Based Compressed Natural Gas CNG from
Electricity Source Distributed Generation US Average Generation Mix NA NG
TampD (Compression) On-Site Off-Site On-Site Off-Site Off-Site Gasoline
Feedstock Recovery 0 0 0 0 31398 42868 Feedstock Transmission 0 0 0 0 0 10660 Fuel Production 177935 169554 152132 152188 31965 190407 Fuel TampD 49819 73022 48605 73022 86287 6808 WTP 227754 242576 200737 225210 149651 250743 Vehicle Operation 1000000 1000000 1000000 1000000 1000000 1000000 WTW 1227754 1242576 1200737 1225210 1149651 1250743
TABLE 8 WTW Total Energy Use for LFG-to-LNG Pathways by Stage (BtuMM Btu produced)
Landfill Gas-Based Liquefied Natural Gas LNG from
Electricity Source Distributed Generation US Average Generation Mix NA NG
Off-Site Off-Site Off-Site Off-Site Off-Site TampD On-Site LNG Diesel On-Site LNG Diesel Diesel Diesel
Feedstock Recovery 0 0 0 0 0 0 31669 42835 Feedstock Transmission
0 0 0 0 0 0 961 10652
Fuel Production 294643 293469 293469 264590 263412 263412 142338 133918 Fuel TampD 0 6608 6137 0 6485 14104 6313 WTP 294643 300077 299607 264590 269897 189072 193718 Vehicle Operation 1000000 1000000 1000000 1000000 1000000 1000000 1000000 1000000 WTW 1294643 1300077 1299607 1264590 1269897 1269550 1189072 1193718
6137 269550
412 WTW Fossil Energy
Figure 15 compares WTP PTW and WTW fossil fuel use for each LFG-based pathway with CNG from NA NG LNG from NA NG gasoline from conventional petroleum and diesel from conventional petroleum Note that for landfill gas-based pathways vehicle operation (PTW) requires no fossil fuels since the LFG-based fuels are renewable Plus if landfill gas is the feedstock NG processing and liquefaction require little or no fossil fuel (depending on whether on-site generators or grid power are used for process needs) and only a small amount of fossil fuel is consumed during transportation and distribution depending on TampD method
Table 9 displays WTW fossil fuel use by stage for LFG-to-CNG pathways Pathways using on-site power generation (with on-site or off-site vehicle fueling) and grid electricity are shown as are pathways for CNG from NA NG and for petroleum gasoline As above PTW fossil fuel use (for vehicle operation) is assigned a value of 1000000 (1000000 Btu1000000 Btu) for the CNG-from-NA NG pathway For the petroleum gasoline pathway this value is reduced slightly to reflect the ethanol content of the gasoline fuel pool For renewable pathways fossil fuel use is zero
31
Fo
ssil
Fu
els
(Btu
mm
Btu
) 1400000
1200000
1000000
800000
600000
400000
200000
0
RC-1 RC-2 RC-3 RC-4 CNG
On-site Off-site On-site Off-site
Distributed Generation Grid Electricity NA NG
Compressed Natural Gas
PTW
WTP
CG
Gasoline
RL-1 RL-2 RL-3
On-s ite Off-site Off-s ite LNG Diesel
Distributed Generation
RL-4 RL-5 RL-6 LNG LSD
On-site Off-site Off-site LNG Diesel
Grid Electricity NA NG
Liquefied Natural Gas Diesel
FIGURE 15 WTW Fossil Fuel Use for LFG-Based Pathways versus NA NG and Petroleum Gasoline and Diesel Pathways
TABLE 9 WTW Fossil Fuel Use for LFG-to-CNG Pathways by Stage (BtuMM Btu produced)
Landfill Gas-Based Compressed Natural Gas
Electricity Source Distributed Generation US Average Generation Mix CNG from
NA NG
TampD (Compression) On-Site Off-Site On-Site Off-Site Off-Site Gasoline
Feedstock Recovery Feedstock Transmission Fuel Production Fuel TampD WTP Vehicle Operation WTW
0
0 0 0 0 0 0
0
0 0
62892 62892
0 62892
0
0 131549
42029 173577
0 173577
0
0 131597
62892 194489
0 194489
31290
0 31668 76376
139333 1000000 1139333
41363
10517 170067
6753 228700 979201
1207901
Depending on whether vehicle fueling is on-site or off-site LFG-based CNG using on-site or distributed power can consume no fossil fuel WTP or about half that consumed by CNG from NA NG On a WTW basis LFG-based CNG can consume 0ndash15 of the fossil fuel consumed by petroleum gasoline
Petroleum gasoline petroleum diesel and NA NG-to-LNG pathways consume similar amounts of fossil fuel Because of relatively higher processing efficiency CNG from NA NG uses somewhat less fossil fuel WTP than petroleum gasoline or LNG pathways
Table 10 provides comparable results for LFG-to-LNG pathways Again pathways using on-site power generation and grid electricity are shown as are pathways for LNG from NA NG and petroleum diesel and PTW fossil fuel use is assigned a value of 1000000 for all fossil
32
TABLE 10 WTW Fossil Fuel Use for LFG-to-LNG Pathways by Stage (BtuMM Btu produced)
Landfill Gas-Based Liquefied Natural Gas LNG from
Electricity Source Distributed Generation US Average Generation Mix NA NG
Off-Site Off-Site Off-Site Off-Site Off-Site TampD On-Site LNG Diesel On-Site LNG Diesel Diesel Diesel
Feedstock Recovery 0 0 0 0 0 0 31559 41332 Feedstock Transmission 0 0 0 0 0 0 950 10509 Fuel Production 0 0 0 227749 227772 227772 141306 132119 Fuel TampD 0 0 4820 0 933 4820 14077 6256 WTP 0 0 4820 227749 228705 232592 187892 190215 Vehicle Operation 0 0 0 0 0 0 1000000 1000000 WTW 0 0 4820 227749 228705 232592 1187892 1190215
pathways and zero for all renewable pathways As shown in the table if the electricity source for fuel production is grid electricity LFG-to-LNG pathways consume more fossil fuel than LFG-to-CNG pathways largely because of differences in process efficiency By contrast if the LFG pathways use on-site distributed power and vehicles using the produced fuel are refueled off-site the LFG-to-LNG pathways consume less fossil fuel than LFG-to-CNG pathways because CNG TampD (grid electricity use for NG compression by electric compressor) is more energy-intensive than LNG TampD (LFG-based LNG and diesel use for trucking) On a WTW basis LFG-based LNG can consume 0ndash19 of the fossil fuel consumed by petroleum diesel
413 WTW Greenhouse Gas Emissions
Figure 16 shows WTP PTW and WTW greenhouse gas emissions by pathway stage for LFG-based pathways as compared with petroleum gasoline or CNG (from NA NG) pathways for light-duty vehicles and petroleum diesel or LNG (from NA NG) pathways for heavy-duty vehicles Note that GHG emissions are expressed as grams carbon-dioxide equivalent (g CO2e) per unit energy produced Because of credits LFG-based pathways generate far fewer GHG emissions than petroleum gasoline or diesel pathways
As shown in Figure 16 WTW GHG emissions generally follow the same trend as WTW fossil fuel use (Figure 15) Gasoline- and diesel-fueled vehicles emit more GHGs than comparable CNG- or LNG-fueled vehicles Thus GHG emissions are substantially higher for petroleum-based pathways
Tables 11 and 13 provide detailed results for GHG emissions by pathway stage in terms of grams per million Btu while Tables 12 and 14 provide the results in terms of grams per MJ Note that GHG results shown here are substantially different from the fossil fuel results shown in Tables 9 and 10 In the GHG calculations GHGs are assumed to be captured and stored in the fuel during fuel production and released during vehicle operation Thus GHG emissions for vehicle operation (as shown in Table 11) tend to be considerably higher than the fossil fuel values shown in Table 9 the reverse is true for WTP fossil fuel use and GHG emissions
33
-80000
-60000
-40000
-20000
0
20000
40000
60000
80000
100000
RC-1 RC-2 RC-3 RC-4 CNG CG RL-1 RL-2 RL-3 RL-4 RL-5 RL-6 LNG LSD
On-site Off-site On-site Off-site On-site Off-site LNG
Off-site Diesel
On-site Off-site LNG
Off-site Diesel
Distributed Generation Grid Electricity NA NG Distributed Generation Grid Electricity NA NG
Compressed Natural Gas Gasoline Liquefied Natural Gas Diesel
GH
G E
mis
sio
ns
(g C
O2e
qm
mB
tu)
-76
-56
-36
-16
4
24
44
64
84
GH
G E
mis
sio
ns
(g C
O2eq
MJ)
PTW
WTP
WTW
FIGURE 16 WTW GHG Emissions for LFG-Based Pathways Compared with NA NG and Petroleum Gasoline and Diesel Pathways
TABLE 11 WTW GHG Emissions for LFG-to-CNG by Pathway Stage (g CO2eMM Btu produced)
Landfill Gas-Based Compressed Natural Gas CNG from
Electricity Source Distributed Generation US Average Generation Mix NA NG
TampD (Compression) On-Site Off-Site On-Site Off-Site Off-Site Gasoline
Feedstock Recovery 0 0 0 0 3758 3153 Feedstock Transmission 0 0 0 0 0 2635 Fuel Production -64988 -59119 -47328 -47551 4012 13532 Fuel TampD 3467 6460 4190 6460 9914 549 WTP -61521 -52659 -43138 -41091 17684 19869 Vehicle Operation 60484 60484 60484 60484 60484 77594 WTW -1036 7825 17346 19393 78169 97463
TABLE 12 WTW GHG Emissions for LFG-to-CNG by Pathway Stage (g CO2eMJ produced)
Landfill Gas-Based Compressed Natural Gas CNG from
Electricity Source Distributed Generation US Average Generation Mix NA NG
TampD (Compression) On-Site Off-Site On-Site Off-Site Off-Site Gasoline
Feedstock Recovery 00 00 00 00 36 30 Feedstock Transmission 00 00 00 00 00 25 Fuel Production -616 -560 -449 -451 38 128 Fuel TampD 33 61 40 61 94 05 WTP -583 -499 -409 -389 168 188 Vehicle Operation 573 573 573 573 573 735 WTW -10 74 164 184 741 924
34
TABLE 13 WTW GHG Emissions for LFG-to-LNG by Pathway Stage (g CO2eMM Btu produced)
Landfill Gas-Based Liquefied Natural Gas LNG from
Electricity Source Distributed Generation US Average Generation Mix NA NG
Off-Site Off-Site Off-Site Off-Site Off-Site TampD On-Site LNG Diesel On-Site LNG Diesel Diesel Diesel
Feedstock Recovery 0 0 0 0 0 0 3790 4706 Feedstock Transmission 0 0 0 0 0 0 250 2635 Fuel Production -57831 -61155 -61155 -37810 -41132 -41133 11727 10328 Fuel TampD 0 3331 3711 0 3413 3711 1980 506 WTP -57831 -57824 -57444 -37810 -37719 -37421 17748 18175 Vehicle Operation 60198 60198 60198 60198 60198 60198 60198 79719 WTW 2367 2374 2754 22388 22479 22777 77946 97894
TABLE 14 WTW GHG Emissions for LFG-to-LNG by Pathway Stage (g CO2eMJ produced)
Electricity Source
Landfill Gas-Based Liquefied Natural Gas
Distributed Generation US Average Generation Mix LNG from
NA NG
TampD On-Site Off-Site
LNG Off-Site Diesel On-Site
Off-Site LNG
Off-Site Diesel
Off-Site Diesel Diesel
Feedstock Recovery 00 00 00 00 00 00 36 45 Feedstock Transmission 00 00 00 00 00 00 02 25 Fuel Production -548 -580 -580 -358 -390 -390 111 98 Fuel TampD 00 32 35 00 32 35 19 05 WTP -548 -548 -544 -358 -358 -355 168 172 Vehicle Operation 571 571 571 571 571 571 571 756 WTW 22 22 26 212 213 216 739 928
42 ENERGY AND GREENHOUSE GAS EMISSIONS PER MILE TRAVELED
421 LFG-Based CNG
As shown in Figure 17 total energy use across all LFG-to-CNG pathways and for the petroleum gasoline pathway is nearly flat Total energy use is slightly higher for petroleum gasoline and slightly lower for LFG-to-CNG pathways with grid electricity Because of lower process energy use the NA NG-based CNG pathway consumes approximately 5ndash8 less energy per mile traveled than other pathways
However this relative advantage disappears when compared on the basis of either fossil fuel use or GHG emissions per mile traveled (Figures 18 and 19) Although approximately 6 better than petroleum gasoline CNG from NA NG consumes more fossil fuel and emits more GHGs than LFG-based CNG Because vehicle operation uses renewable LFG-based fuel GREET results show a reduction in WTW fossil fuel use and GHGs of 76ndash100 for LFG-based pathways as compared with fossil NA NG
35
10000
8000
6000
4000
2000
0
FIGURE 17 Energy Use for CNG from LFG or Fossil NA NG versus Petroleum Gasoline (Btumi)
RC-1 RC-2 RC-3 RC-4 CNG CG
On-site Off-s ite On-site Off-site
Distributed Generation Grid Electricity NA NG
Compressed Natural Gas Gasoline
PTW
WTP
To
tal
En
erg
y (
Btu
mi)
RC-1 RC-2 RC-3 RC-4 CNG CG
On-site Off-site On-site Off-site
Distributed Generation Grid Electricity NA NG
Compressed Natural Gas Gasoline
PTW
WTP
FIGURE 18 Fossil Fuel Use for CNG from LFG or Fossil NA NG versus Petroleum Gasoline (Btumi)
10000
Fo
ss
il F
ue
ls (
Btu
mi)
8000
6000
4000
2000
0
36
700
600
500
400
300
GH
G E
mis
sio
ns
(g C
O2eq
mi)
200
100
0
-100 RC-1 RC-2 RC-3 RC-4 CNG CG
On-site Off-s ite On-site Off-site
Distributed Generation Grid Electricity NA NG
Compressed Natural Gas Gasoline
-63
-13
38
88
138
188
238
288
338
388
438
GH
G E
mis
sio
ns
(g C
O2e
qk
m)
FIGURE 19 GHG Emissions for CNG from LFG or Fossil NA NG versus Petroleum Gasoline (g CO2emi or km)
422 LFG-Based LNG
With the exception of petroleum diesel energy-use-per-mile-traveled is relatively flat for the pathways examined As shown in Figure 20 total energy use is slightly higher for LFG-to-LNG pathways as compared with LNG from fossil NA NG Because of lower process energy use and more fuel efficient vehicle operation the petroleum diesel pathway consumes approximately 10ndash17 less energy per mile traveled than other pathways
However this relative advantage disappears when compared on the basis of either fossil fuel use or GHG emissions per mile traveled (Figures 21 and 22) Although still approximately 10 better than LNG from fossil NA NG diesel consumes far more fossil fuel than LFG-based pathways Because vehicle operation uses renewable LNG GREET results show a significant reduction in WTW fossil fuel use and GHGs for all LFG-based pathways Although LNG from fossil NA NG emits approximately 12 less GHGs than the petroleum diesel pathway (primarily due to cleaner vehicle operation) LFG-based pathways reduce GHGs by 72ndash97
37
RL-1 RL-2 RL-3 RL-4 RL-5 RL-6 LNG LSD
On-site Off-site LNG
Off-site Diesel
On-site Off-site LNG
Off-site Diesel
Distributed Generation Grid Electricity NA NG
Liquefied Natural Gas Diesel
PTW
WTP
FIGURE 20 Energy Use for LNG from LFG or Fossil NA NG versus Petroleum Diesel (Btumi)
To
tal E
ner
gy
(Btu
mi)
70000
60000
50000
40000
30000
20000
10000
0
Fo
ssil
Fu
els
(Btu
mi)
70000
60000
50000
40000
30000
20000
10000
0
PTW
WTP
RL-1 RL-2 RL-3 RL-4 RL-5 RL-6 LNG LSD
On-site Off-site Off-site On-site Off-site Off-site LNG Diesel LNG Diesel
Distributed Generation Grid Electricity NA NG
Liquefied Natural Gas Diesel
FIGURE 21 Fossil Fuel Use for LNG from LFG or Fossil NA NG versus Petroleum Diesel (Btumi)
38
GH
G E
mis
sio
ns
(g C
O2e
qm
i) 5000
4000
3000
2000
1000
0
RL-1 RL-2 RL-3 RL-4 RL-5 RL-6 LNG LSD
On-site Off-site LNG
Off-site Diesel
On-site Off-site LNG
Off-site Diesel
Distributed Generation Grid Electricity NA NG
Liquefied Natural Gas Diesel
3000
2500
2000
1500
1000
500
0
GH
G E
mis
sio
ns
(g C
O2e
qk
m)
FIGURE 22 GHG Emissions for LNG from LFG or Fossil NA NG versus Petroleum Diesel (g CO2emi or km)
43 BALANCING ENERGY EFFICIENCY WITH GREENHOUSE GAS EMISSIONS
Grid electricity is almost always more energy efficient than LFG-fueled generators since the formerrsquos fuel source is more energy dense and power plants can achieve better process integration and on-line operation at larger scale Thus LFG-based pathways are often less energy efficient than petroleum and NA NG-based pathways However because LFG-based CNG and LNG are renewable fuels total energy use is not a relevant metric for comparison with fossil fuels By definition renewable energy is not ldquoconsumedrdquo Within the timeframe of lifecycle analysis (eg 100 years) the supply of renewable energy is infinite and there is no detriment to tapping larger quantities Thus renewable energy ldquouserdquo is irrelevant and a renewable pathway is preferable to a non-renewable one on the basis of total energy use13
On the other hand we can compare the fossil fuel use and emissions of renewable and non-renewable fuel pathways because the relevant systems can be well defined and the units of analysis can be properly measured As a result although comparisons of total energy fossil energy and greenhouse gas emissions are presented above the reader is urged to focus on fossil energy and greenhouse gas emissions Those are the key comparisons between two fundamentally different types of fuel pathways
13 Among renewable pathways however it can be argued that lower energy pathways are preferable (all other things equal) since more work can be produced for a given quantity of energy thereby increasing the benefit to society (eg by increasing displacement of imported oil)
39
44 CO-PRODUCT AND RENEWABLE ENERGY CREDITS
In addition to generating excess power to the grid (ie co-product electricity) LFG-based pathways may produce elemental sulfur ash and carbon dioxide (CO2) as well as renewable energy credits14 Since ash would have been produced from the flare in the reference case (see Figure 6) it is not considered a by-product of LFG-based pathways Similarly capturing sulfur upstream (instead of at the flare) is not a net change Thus CO2 is the major potential co-product Although not a co-product per se renewable energy credits are an important side benefit since they can provide significant financial incentives to LFG fuel projects
441 Carbon Dioxide
Each year some 50 million short tons of CO2 for chemical or mechanical use are produced from US wells Production from industrial processes accounts for another 15 million tons The vast majority (35 million short tons) is used for enhanced oil recovery (EOR) mostly via pipeline from large supplies While by-product CO2 produced from LFG conversion to natural gas could serve nearby EOR needs or supplement pipeline supplies geography and scale are likely to limit its market potential
Similarly CO2 produced from LFG is unlikely to penetrate the beer or carbonated soft drink market since ample quantities of ldquofood-graderdquo CO2 are available from natural or other sources including ethanol processing So despite the ability of some LFG-to-NG processors to certify their CO2 co-product to food-grade standards the beverage market is unlikely to become a major customer
On the other hand dry ice (solid CO2) urea manufacture and pest control are promising options for LFG-based CO2 co-product Dry ice has long been the refrigerant of choice for packaging and small-lot transport of perishables that must remain frozen until use However since dry ice requires further processing a secondary deposition process would be needed at LFG sites to transform CO2 into blocks and sheets suitable for packaging A more promising market is in chemical manufacturing where CO2 has long played multiple roles as raw material reactant pressurizing agent and coolant Production of various carbonates polycarbonate resins and urea rely on CO2 as a feedstock The urea market is estimated to demand nearly 4 million tonsyr of CO2 which should expand if selective catalytic reduction of NOx in diesel engine exhaust becomes the emission control technology of choice for heavy-duty trucks
Outside California pest fumigation (especially in large-scale grain storage) may be a good logistical match for co-product CO2 Historically ethyl di-bromide (EDB) and methyl bromide (MB) were the main fumigants used in grain storage However EPA banned EDB in 1984 (as a suspected carcinogen) and ordered a phaseout of MB in 2005 (as an ozone-depleting chemical) CO2 and nitrogen are potential alternatives to MB The main advantage of CO2 is that it is toxic to insects and can tolerate up to 3 oxygen in controlled atmospheres which nitrogen cannot A disadvantage is the porosity of most storage facilities which can lose their CO2-rich
14 Since all NG produced from LFG is assumed to be used as a vehicle fuel (with either on-site or off-site fueling) GREET pathways have no NG co-product
40
fumigation atmospheres before the approximately nine days required for full effectiveness If this latter problem can be resolved CO2 application to elevator storage of spring and winter wheat could represent a market for up to 20000 tyr of CO2
Additional uses for CO2 (eg as a foam blowing agent in polyurethane and polystyrene production an aerosol propellant a cleaning agent at paper pulp mills or as a natural plant nutrient in greenhouses) hold limited promise generally circumscribed by geographic proximities and other competing compounds Because of the above-noted uncertainties and the likelihood that market success will be very site-specific co-product CO2 is not represented in the LFG-based pathways developed for this study
442 Renewable Energy Credits and Other Incentives
Thirty-five states currently require electric utilities to generate a minimum share of the power sold within their borders from renewable or alternative energy sources by a given date (Pew 2009) Called ldquoRenewable Portfolio Standardsrdquo (RPSs) most of these mandates specifically include landfill gas as an eligible energy source (Pew 2009 EPA 2009a) Although RPSs focus on replacing fossil with renewable fuels for power generation the concept is likely to be expanded to natural gas in the form of low carbon fuel standards (like those already adopted in California) or greenhouse gas allowances (like those being considered under various carbon cap and trade proposals) Already a few states (eg Montana Michigan and Kansas) frame their RPSs in terms of energy (as opposed to electricity) consumption LFG pathways to vehicle-fuel or pipeline-quality gas may qualify under these latter standards
Several states have adopted or are considering the adoption of regulations permitting utilities to buy sell or trade Renewable Energy Certificates (RECs) in order to comply with RPSs or other mandates RECs are tradable commodities that represent proof that a given amount of electricity was generated from an eligible renewable energy resource In states with a REC program ldquogreenrdquo energy providers (such as producers of LFG-based electricity that is exported to the grid or of pipeline quality gas that is used to generate renewable electricity) are credited with one REC for every 1000 kWh (1 MWh) of electricity produced A certifying agency gives each REC a unique identification number to make sure it does not get double-counted The green energy is fed into the electric grid and the accompanying REC can be sold traded or bartered on the open market The owner of the REC can then claim to have purchased renewable energy even though the energy associated with the REC is sold separately and used by another party (EPA 2009a)
Various federal incentives are available to support LFG projects These include tax credits and funding sources like the Renewable Electricity Production Tax Credit the Business Energy Investment Tax Credit and Clean Renewable Energy Bonds (authorized under Sections 45 48 and 54 respectively of the US Tax Code) Qualified Energy Conservation Bonds and the Renewable Energy Production Incentive (created in 1992 and reauthorized to extend through 2026) Other incentives include Renewable Energy Grants Energy Efficiency and Conservation Block Grants and Innovative Technology loan guarantees Historically most of these incentives have been limited to generating power from LFG and exporting it to the grid Now however a number of them have been expanded to cover facilities ldquofunctionally related and subordinate to the generation facility itselfrdquo (which could include gas cleanup compression and pipeline injection) and funding has been supplemented with appropriations from the American Recovery and Reinvestment Act (ARRA)
41
The waste-to-energy industry is poised for growth as new markets for their ldquogreen powerrdquo emerge and new funding sources provide the wherewithal to accelerate LFG-based fuel development According to David Wentworth president of Renewable Solutions Group ldquoLandfill gas to electricity projects have flourished over the past several decades primarily as a means to capture federal tax benefits but they produce limited environmental benefits when compared to high Btu applicationshellipThe next evolution is landfill gas to pipeline-quality gas projects which can be used to heat homes power natural gas vehicles and illuminate city streets all while providing financial and environmental benefitsrdquo (Pomerantz 2009)
45 CRITERIA POLLUTANT EMISSIONS
Detailed well-to-wheel estimates of criteria pollutant emissions are provided in Appendix B For criteria pollutants like carbon monoxide (CO) emissions are dominated by vehicle operation since relatively little of the pollutant is emitted from fuel production For others (eg NOx PM and SOx) emissions are pathway dependent NOx and PM emissions vary with grid electricity use because the emission factors of the US average power mix (see Table 4) are much higher than those of on-site power generators which in turn are higher than those of LFG flares WTW SOx emissions are virtually eliminated if no grid electricity is used in the pathway because all sulfur emissions are balanced with the credit from the avoided LFG flaring
42
5 CONCLUSIONS
This study characterized landfill gas (LFG) resources and the technologies to convert what until recently was considered a waste product into a renewable fuel for vehicles By using this information several LFG-based pathways were added to the GREET model Results show
bull As compared with North American natural gas (NA NG) or petroleum-based fuel LFG-based fuels require roughly the same quantity of energy for their production transport and utilization in vehicles However with LFG-based fuels much of this energy is considered renewable since it is from organic sources and is replenished naturally
bull LFG-based fuels can save significant amounts of fossil fuel The size of such savings however depends on the amount of electricity used in the pathway
bull LFG-based fuels can dramatically reduce greenhouse gas (GHG) emissions particularly if process energy is supplied by on-site power generators using renewable LFG If process energy is supplied by grid electricity reductions in GHG emissions depend on the US power generation mix
bull WTW criteria pollutant emissions depend on both the amount of electricity used and differences in emission factors between relevant pathway components and the base or reference case (eg CNGLNG versus gasolinediesel vehicles LFG flares versus IC engines LFG gensets versus the average US power generation mix)
Because of limited time and resources this study could not address several issues and concerns Chief among them are emissions of toxics and hazardous substances from landfills These substances are present in the current waste stream and we assume that they are successfully captured and destroyed in the thermal oxidizer (flare) However some argue that LFG capture rates are less than assumed destruction of NMOC and other pollutants is incomplete (contributing to additional emissions) and that some hazardous materials are not adequately sequestered within the landfill These issues are extremely important and merit a detailed examination That examination is beyond the scope of this analysis
This analysis also assumes that conventional waste management strategies will continue to be used and to produce landfill gas comprising some 45ndash50 methane and 35ndash40 CO2 (see Table 2) As noted above LFG capture is uncertain and may change with new technologies like bioreactors or source-separation coupled with anaerobic digestion of organic materials These technologies are extremely promising since they speed waste stabilization and therefore the economic recovery of product gas Beyond this however they may also increase LFG capture rates and methane concentrations in the LFG feed Although extremely important and significant these issues lie outside the system boundary and thus could not be addressed in this analysis
Finally while this study assumes a robust market for LFG-based fuel market issues are beyond the scope of this analysis Because there are many renewable sources for electricity but few for natural gas renewable natural gas may be an increasingly attractive option for entities
43
required to implement low carbon fuel standards and renewable portfolio standards However recent historically low spark spreads between natural gas and electricity prices have given way to low natural gas prices and high spark spreads As a result projects to produce pipeline quality natural gas are less viable in todayrsquos economic climate than they were a couple of years ago However the price differential between natural gas for stationary applications versus competing motor fuels remains significant
44
6 REFERENCES
Acrion Technologies Inc 2009 Acrionrsquos CO2 Wash Process for Contaminants Removal from Landfill Gas accessed Aug 2009 at httpwwwacrioncomCO2washhtm
Air Liquide 2009 Biogas Recovery System accessed Sept 2009 at httpwwwdtaairliquidecomfileotherelementpjplaquette-biogaz57164pdf
ARCADIS Geraghty amp Miller Inc 2002 ldquoUpdate Heavy-Duty Engine Emission Conversion Factors for MOBILE6 Analysis of BSFCs and Calculation of Heavy-Duty Engine Emission Conversion Factorsrdquo EPA420-R-02-005 January 2002
Barnitt R and K Chandler 2006 New York City Transit Hybrid and CNG Transit Buses Interim Evaluation Results National Renewable Energy Laboratory Report NRELTP-540-38843 November
Brendeng E and J Hetland 2004 ldquoState of the Art in Liquefaction Technologies for Natural Gas NATO Science Series Series II Mathematics Physics and Chemistry edited by J Hetland and T Gochitashvili Vol 149
Brinkman N M Wang T Weber and T Darlington 2005 Well-to-Wheels Analysis of Advanced FuelVehicle Systems mdash A North American Study of Energy Use Greenhouse Gas Emissions and Criteria Pollutant Emissions Argonne National Laboratory Argonne IL
California Air Resources Board (CARB) 2009 ARB Adopts Landfill Measure to Reduce Potent Global Warming Gas News Release California Environmental Protection Agency June 25
Chandler K P Norton and N Clark 2001 Waste Managementrsquos LNG Truck Fleet Final Results National Renewable Energy Laboratory Report NRELBR-540-29073 January
Chandler K P Norton and N Clark 2000 Dallas Area Rapid Transitrsquos (DART) LNG Bus Fleet Final Results National Renewable Energy Laboratory Report NRELBR-540-28739 November
Chandler K E Eberts and M Melendez 2006 Washington Metropolitan Area Transit Authority Compressed Natural Gas Transit Bus Evaluation National Renewable Energy Laboratory Report NRELTP-540-37626 April
Cook W W Brown L Siwajek W Sanders and I Botgros 1998 Greenhouse Gas Reduction by Recovery and Utilization of Landfill Methane and CO2 Technical and Market Feasibility Study Boului Landfill Bucharest Romania US DOE Assistant Secretary for Energy Efficiency and Renewable Energy Report DOEEE35034ndashT1 Washington DC
Cook W M Neyman L Siwajek and W Brown 2002 Landfill Gas to LNG and LCO2 2001 Annual Report Brookhaven National Laboratory Upton NY
45
Cook W W Brown L Siwajek M Neyman T Reppert and B Smackey 2005 Production of Liquid Methane Truck Fuel from Landfill Gas Final Report Brookhaven National Laboratory Upton NY
Cummins-Westport Inc (CWI) 2009 ISL G (North America) accessed Sept 2009 at httpwwwcumminswestportcomproductsislgphp
Datta AK and PK Sen 2006 ldquoOptimization of Membrane Unit for Removing Carbon Dioxide from Natural Gasrdquo Journal of Membrane Science 283(1ndash2)291ndash300
Dunn S 2000 ldquoMicropower The Next Electrical Erardquo Worldwatch Paper 151 Worldwatch Institute Washington DC
Electric Power Research Institute (EPRI) 2004 Distributed Energy Resources Emissions Survey and Technology Characterization Electricity Innovation Institute Palo Alto CA
Energy Information Administration (EIA) 2008 US Crude Oil Natural Gas and Natural Gas Liquids Reserves 2007 Annual Report accessed Aug 2009 at httpwwweiadoegov puboil_gasnatural_gasdata_publicationscrude_oil_natural_gas_reserveshistorical2007 cr2007html
EIA 2009a Annual Energy Review 2008 Report No DOEEIA-0384(2008) accessed Aug 2009 at httpwwweiadoegovemeuaercontentshtml
EIA 2009b Natural Gas Year-In-Review 2008 accessed Aug 2009 at httpwwweiadoegov puboil_gasnatural_gasfeature_articles2009ngyir2008ngyir2008html
Finn AJ GL Johnson and TR Tomlinson 1999 ldquoDevelopments in Natural Gas Liquefactionrdquo in Hydrocarbon Processing pp 47ndash59
Franklin Associates a Division of ERG Review of State Solid Waste Management Websites cited in US EPA 2008 Municipal Solid Waste in the United States Facts and Figures for 2007 EPAndash530ndashRndash08ndash010 Office of Solid Waste Washington DC
Gas Technology Institute (GTI) 2007 Liquefied Natural Gas from Landfill Gas Demonstration Grant California Integrated Waste Management Board
Goldstein L B Hedman D Knowles S Freedman R Woods and T Schweizer 2003 Gas-Fired Distributed Energy Resource Technology Characterizations National Renewable Energy Laboratory Report NRELTPndash620ndash34783 Golden CO
Godlove C 2010 Landfill Gas Successes and Challenges in an Increasingly Complex Market SWANArsquos 33rd Annual Landfill Gas Symposium San Diego March 10
Johansson N 2008 Production of Liquid Biogas LBG with Cryogenic and Conventional Upgrading Technology mdash Description of Systems and Evaluations of Energy Balances MS Thesis Lunds University Sweden
46
Kikkawa Y and I Aoki 1999 Gas to Liquid of 21st Century AIChE Spring National Meeting Houston p 48 March 14ndash18
Kikkawa Y and N Nozawa 1999 Optimizing Liquefied Natural Gas Power Chain AIChE Spring National Meeting Houston March 14ndash18
Kikkawa Y and YN Liu 2001 Zero CO2 Emission for LNG Power Chain 13th International Conference and Exhibition on Liquefied Natural Gas PS5ndash3
Kohl A and R Nielsen 1997 Gas Purification 5th ed Gulf Publishing Houston
Lear J and J Burdelski 2009 US Department of EnergyBrookhaven National Laboratory Biomethane Analysis Draft Report
Ludwig V 2009 Landfill Gas to Energy Webcast (transcript and slides) USEPA Feb 18 accessed Aug 2009 at httpwwwepagovcleanenergyenergy-programsstate-andshylocalwebcasthtmlfeb5
Persson M O Joumlnsson and A Wellinger 2006 Biogas Upgrading to Vehicle Fuel Standards and Grid Injection IEA Bioenergy Task 37 ndash Energy from Biogas and Landfill Gas accessed June 28 2010 at httpwwwiea-biogasnetDokumenteupgrading_report_finalpdf
Pew Center on Global Climate Change 2009 Renewable and Alternative Energy Portfolio Standards July 29 accessed Aug 2009 at httpwwwpewclimateorgwhat_s_being_done in_the_statesrpscfm
Pickens TB Pickens Plan undated accessed Sept 2009 at httpwwwpickensplancom theplan
Pomerantz M 2009 ldquoTapping the Trashrdquo Waste Age April 1 accessed Aug 2009 at httpwasteagecomLandfill_Managementlandfill-methane-pipeline-quality-gas-200904
Pomerantz M and L Turcotte 2004 Production of Pipeline Gas from Landfill Gas in Canada Wastecon 2004 Sept 21ndash23 Phoenix
Prometheus Energy Company 2007 Liquefied Natural Gas from Landfill Gas Demonstration Grant California Integrated Waste Management Board
Remeljej CW and AF Hoadley 2006 ldquoAn Exergy Analysis of Small-Scale Liquefied Natural Gas (LNG) Liquefaction Processesrdquo Energy 312005ndash2019
SCS Engineers 2007 Current MSW Industry Position and State of the Practice on Methane Destruction Efficiency in Flares Turbines and Engines prepared for Solid Waste Industry for Climate Solutions July
Segeler CG 1965 Gas Engineers Handbook Industrial Press
47
Sperling Hansen Associates 2007 Highland Valley Centre for Sustainable Waste Management ndash Landfill Gas Utilization Options SHAndashPRJ06014 accessed July 2009 at httpa100govbccaappsdataepichtmldeployepic_project_doc_index_263html
Spillman R 1995 ldquoEconomics of Gas Separation Membrane Processrdquo in Membrane Separations Technology Principles and Applications 3rd Edition (edited by RD Noble SA Stern) Elsevier Science
Sullivan P 2010 The Importance of Landfill Gas Capture and Utilization in the US Council for Sustainable Use of Resources and Earth Engineering Center Columbia University April accessed May 2010 at httpwwwscsengineerscomPapersSullivan_Importance_of_LFG_ Capture_and_Utilization_in_the_USpdf
Syed M G Soreanu P Falletta and M Beland 2006 ldquoRemoval of Hydrogen Sulfide from Gas Streams Using Biological Processes A Reviewrdquo Canadian Biosystems Engineering 4821ndash214
TRC Environmental Corp 2008 Emissions Testing of the Ward Hill Neck Landfill Enclosed Landfill Gas Flare and Landfill Gas Engine prepared for Covanta Haverhill Inc Windsor CT TRC project no 158673-0000-00000 July 21
US Environmental Protection Agency (EPA) 1995 Compilation of Air Pollutant Emission Factors Vol 1 Stationary Point and Area Sources APndash42 5th Edition Research Triangle Park NC
US EPA 2008 Municipal Solid Waste in the United States Facts and Figures for 2007 EPAndash 530ndashRndash08ndash010 Office of Solid Waste Washington DC
US EPA 2010a Energy Projects and Candidate Landfills as of April 2010 accessed May 2010 at httpwwwepagovlmopprojects-candidatesindexhtmlmap-area
US EPA 2010b Engine Certification Data accessed May 2010 at httpwwwepagovoms certdatahtmlargeng
US EPA 2009a Renewable Portfolio Standards An Effective Policy to Support Clean Energy Supply April accessed Aug 2009 at httpwwwepagovchpstate-policyrenewable_fshtml
US EPA Office of Air Quality 2000 Economic Impact Analysis Municipal Solid Waste Landfills EPA-452D-00-005 Sept accessed Sept 2009 at httpyosemiteepagoveeepa riansfvwANA2000-37pdf$fileA2000-37pdf
US EPA Natl Center for Environmental Economics 1996 Landfill Rules Tightened from I Fisher ldquoEPA Rules Require Curbs on Landfillsrsquo Gas Emissionsrdquo New York Times March 3 accessed Sept 2009 at httpyosemiteepagoveeepalibnwletnsf434d5673ac53b1548525 64cd007a8a0d6422179d25e7e87e852564d800092f41OpenDocument
48
University of Florida and University of Central Florida 2008 Florida Bioreactor Landfill Demonstration Project Executive Summary July 1 accessed Aug 2009 at httpwwwbioreactororg
Vink KJ and RK Nagelvoort 1998 Comparison of Baseload Liquefaction Processes in Proc 12th Intl Conference and Exhibition on Liquefied Natural Gas Perth Australia p 36 May 4ndash7
Wang M D He A Finizza T Weber M Miller D Masten G Skellenger and JP Wallace 2001 Well-to-Wheel Energy Use and Greenhouse Gas Emissions of Advanced FuelVehicle Systems mdash North American Analysis General Motors Corporation Argonne National Laboratory BP ExxonMobil Shell accessed July 2009 at httpwwwtransportationanlgov pdfsTA163pdf
Watt GM 2000 Natural Gas Vehicle Transit Bus Fleets The Current International Experience 7th Intl Conference and Exhibition on Natural Gas Vehicles (NGV 2000) Oct 17ndash19 Yokohama Japan
49
APPENDIX A SMALL-SCALE NATURAL GAS LIQUEFACTION
Liquefied natural gas (LNG) is produced by cooling natural gas (NG) to its boiling point (-260degF) at atmospheric pressure A number of different processes (or cycles) can be used the chief types being cascade mixed refrigerant and expander Schematics of the processes are presented in Figure A-1
(a) Cascade Cycle
(b) Mixed Refrigerant Cycle
(c) Expander Cycle
FIGURE A-1 Schematics of NG Liquefaction Processes
The cascade cycle generally uses a different pure refrigerant (propane ethane [or ethylene] or methane) for each of its three stages The major advantage of the cycle is its high efficiency and simplicity of design disadvantages include relatively high capital cost due to the number of refrigerant compression cycles
50
The mixed refrigerant cycle uses a single mixed refrigerant instead of multiple pure refrigerants as in the cascade cycle The refrigerant is usually a mixture of nitrogen methane ethane propane butane and pentane Since it requires only one refrigerant compression cycle its capital cost is relatively low Theoretically a single mixed refrigerant (SMR) cycle should provide sufficient refrigeration to cool NG to its boiling point at atmospheric pressure In practice however a pre-cooling step is needed since the thermo-physical properties of the mixed refrigerant and machinery reduce efficiency Thus the NG feed is usually pre-cooled by a three-stage propane refrigeration cycle (C3MR) or by a separate mixed refrigeration cycle (dual mixed refrigerant (DMR) cycle)
The expander cycle uses an expansion turbine to expand the cycle gas in a near isentropic manner at an appropriate temperature thereby reducing its temperature The expansion generates useful work that is recovered through a booster compressor A major disadvantage of this cycle is its relatively high power consumption compared to either the cascade or MR cycles An expander cycle is however best suited to smaller plants with shorter operating periods because of its relatively rapid and simple start-up and shutdown
NG liquefaction efficiency can be defined in terms of process efficiency or train efficiency depending on the system boundary Process efficiency obtained from specific power includes the power consumed by pre-cooling and liquefaction Train efficiency is the total lower heating value (LHV) of valuable products (LNG and condensate) divided by the LHV of the feed (including energy for pre-cooling liquefaction power generation and utilities) Process efficiencies are documented in many published sources Train efficiencies are less readily available Values and sources of process and trail efficiencies are summarized in Table A-1
TABLE A-1 Process and Train Efficiencies of Major NG Liquefaction Processes
C3MR Cascade DMR SMR Expander
Specific Power (kWhton LNG) Process Efficiency () Vink and Nagelvoort 1998 979 976 Kikkawa and Nozawa 1999 Brendeng and Hetland 2004
976 966
Finn et al 1999 976 979
978
979
975
975
974
973
965 Kikkawa and Liu 2001 980 Remeljej and Hoadley 2006
Average 978 974 978 975 975 969
Train Efficiency () Vink and Nagelvoort 1998 Kikkawa and Aoki 1999 Kikkawa and Liu 2001
907 90
890 905 894 882
51
According to Brendeng and Hetland (2004) nearly 80 of large-scale liquefaction units and almost 90 of global LNG-production capacity currently use C3MR However it is not at all clear that C3MR is the best option for LFG-based liquefaction Most of the sources reviewed for this effort indicate that SMR and expander cycles are good candidates for small-scale liquefaction Moreover for actual LFG-to-LNG projects two current projects (Bowerman and Altamont) use SMR while a pilot project (Burlington) used a nitrogen expander
GREETrsquos default efficiency for large-scale liquefaction is 91 On average SMR and expander cycles respectively take 14 and 40 more specific power than C3MR Assuming that C3MR represents large-scale liquefiers while SMR and expander cycles represent small-scale liquefiers and that the ratio between processing and train efficiencies remains constant we estimate the average train efficiencies of SMR and expander cycles to be 899 and 878 respectively These values compare well to the train efficiencies reported by Vink and Nagelvoort (1998) Using these data GREETrsquos small-scale liquefaction efficiency is set to 89
52
APPENDIX B CRITERIA POLLUTANTS
Estimates of well-to-wheel (WTW) well-to-pump (WTP) and pump-to-wheel (PTW) criteria pollutant emissions for landfill gas (LFG) and fossil fuel-based pathways are shown in Figures B-1 through B-5 When PTW results are negative (eg CO emissions for pathways using grid electricity or NOx emissions for pathways using on-site power generation) the sum of WTP and PTW emissions is drawn as a darker shade of rose and is shown superimposed over its two components
As shown in Figures B-1 B-2 and B-4 LFG-based pathways to CNG use in light-duty vehicles (LDVs) produce WTW CO NOx and PM25 emissions comparable to or less than those of fossil-based pathways to CNG NA NG or petroleum gasoline For heavy-duty vehicles (HDVs) WTW NOx and CO emissions of LFG-based LNG pathways are comparable to those of fossil-based pathways to NA NG or petroleum diesel Because the US generation mix is heavily weighted toward coal displacing grid electricity with on-site power generation virtually eliminates SOx emissions (except for compression at the refueling station which continues to use grid electricity) and results in major reductions in NOx and PM emissions Since most on-site generators have lower NOx PM and SOx PTW emissions are shown as a credit or negative contribution to WTW results in Figures B-1 through B-5 For LNG-fueled vehicles WTW PM10
and SOx emissions are virtually zero
1400
1210
FIGURE B-1 CO Emissions for LFG-Based Pathways Compared with NA NG and Petroleum Gasoline and Diesel Pathways
RC-1 RC-2 RC-3 RC-4 CNG CG RL-1 RL-2 RL-3 RL-4 RL-5 RL-6 LNG LSD
On-site Off-site On-site Off-site On-site Off-site LNG
Off-site Diesel
On-site Off-site LNG
Off-site Diesel
Distributed Generation Grid Electricity NA NG Distributed Generation Grid Electricity NA NG
Compressed Natural Gas Gasoline Liquefied Natural Gas Diesel
PTW
WTP
WTW
1200
1010 1000
CO
(g
mm
Btu
)
0810 800
0610 600
0410 400
200 0210
0 0010
-200 -0190
CO
(g
MJ)
80
100
0081
25
30
53
FIGURE B-2 NOx Emissions for LFG-Based Pathways Compared with NA NG and Petroleum Gasoline and Diesel Pathways
RC-1 RC-2 RC-3 RC-4 CNG CG RL-1 RL-2 RL-3 RL-4 RL-5 RL-6 LNG LSD
On-site Off-site On-site Off-site On-site Off-site LNG
Off-site Diesel
On-site Off-site LNG
Off-site Diesel
Distributed Generation Grid Electricity NA NG Distributed Generation Grid Electricity NA NG
Compressed Natural Gas Gasoline Liquefied Natural Gas Diesel
PTW
WTP
WTW
NO
x (
gm
mB
tu) 0061
60
0041 40
20 0021
0 0001
-20 -0019
10
15
20
RC-1 RC-2 RC-3 RC-4 CNG CG RL-1 RL-2 RL-3 RL-4 RL-5 RL-6 LNG LSD
On-site Off-site On-site Off-site On-site Off-site LNG
Off-site Diesel
On-site Off-site LNG
Off-site Diesel
Distributed Generation Grid Electricity NA NG Distributed Generation Grid Electricity NA NG
Compressed Natural Gas Gasoline Liquefied Natural Gas Diesel
PM
10 (
gm
mB
tu)
PTW
WTP
WTW
FIGURE B-3 PM10 Emissions for LFG-Based Pathways Compared with NA NG and Petroleum Gasoline and Diesel Pathways
0005 5
0000 0
-5 -0005
PM
10 (
gM
J)
NO
x (
gM
J)
0010
0015
0020
0025
60
54
9 P
M2
5 (
gm
mB
tu)
PTW 0007
7 WTP
WTW 0005 5
0003 3
0001 1
-1 -0001
SO
x (g
MJ)
P
M2
5 (
gM
J)
-3
-5
RC-1 RC-2 RC-3 RC-4 CNG
On-site Off-site On-site Off-site
Distributed Generation Grid Electricity NA NG
Compressed Natural Gas
CG
Gasoline
RL-1 RL-2 RL-3
On-site Off-site Off-site LNG Diesel
Distributed Generation
-0003
-0005
RL-4 RL-5 RL-6 LNG LSD
On-site Off-site Off-site LNG Diesel
Grid Electricity NA NG
Liquefied Natural Gas Diesel
FIGURE B-4 PM25 Emissions for LFG-Based Pathways Compared with NA NG and Petroleum Gasoline and Diesel Pathways
RC-1 RC-2 RC-3 RC-4 CNG CG RL-1 RL-2 RL-3 RL-4 RL-5 RL-6 LNG LSD
On-site Off-site On-site Off-site On-site Off-site LNG
Off-site Diesel
On-site Off-site LNG
Off-site Diesel
Distributed Generation Grid Electricity NA NG Distributed Generation Grid Electricity NA NG
Compressed Natural Gas Gasoline Liquefied Natural Gas Diesel
PTW
WTP
WTW 0041
0031
0021
0011
0001
SO
x (g
mm
Btu
)
50
40
30
20
10
0
-10 -0009
FIGURE B-5 SOx Emissions for LFG-Based Pathways Compared with NA NG and Petroleum Gasoline and Diesel Pathways
0051
Argonne National Laboratory is a US Department of Energy laboratory managed by UChicago Argonne LLC
Energy Systems Division Argonne National Laboratory9700 South Cass Avenue Bldg 362Argonne IL 60439-4815
wwwanlgov
- Cover
- Disclaimer
- Title Page
- Contents
- Acknowledgments
- Executive Summary
- 1 Introduction
-
- 11 Background
- 12 US Natural Gas Resources
- 13 Natural Gas as a Vehicle Fuel
- 14 Renewable Natural Gas and GHG Emissions
- 15 Fuel Cycle Analysis
- 16 Scope
-
- 2 Landfill Gas
-
- 21 Resource Base
- 22 Resource Development
- 23 Additions to the Resource Base
- 24 Landfill Gas Composition
-
- 3 Fuel Cycle Analysis of Landfill-Gas Based Pathways
-
- 31 LFG Reference Case
-
- 311 Flaring versus Venting Landfill Gas
- 312 Carbon Fate in LFG Fossil NG and Petroleum Fuel Cycles
-
- 32 Overview of LFG-to CNGLNG Fuel Cycle
- 33 Gas Collection
- 34 Natural Gas Production
-
- 341 Pre-Purification
- 342 CO2 Removal
- 343 Process Efficiency
- 344 Energy Use Accounting
-
- 35 On-Site Power Generation
-
- 351 Technologies
- 352 Criteria Pollutant Emissions
-
- 36 Liquefaction
- 37 Transportationi and Distribution
-
- 371 Transportation and Distribution of CNG
- 372 Transportation and Distribution of LNG
-
- 38 Vehicle Operation
-
- 4 Results and Discussioni
-
- 41 Energy and Greenhouse Gas Emission Rates
-
- 411 WTW Energy
- 412 WTW Fossil Energy
- 413 WTW Greenhouse Gas Emissions
-
- 42 Energy and Greenhouse Gas Emissioins per Mile Traveled
-
- 421 LFG-Based CNG
- 422 LFG-Based LNG
-
- 43 Balancing Energy Efficiency with Greenhouse Gas Emissions
- 44 Co-Product and Renewable Energy Credits
-
- 441 Carbon Dioxide
- 442 Renewable Energy Credits and Other Incentives
-
- 45 Criteria Pollutant Emissioins
-
- 5 Conclusions
- 6 References
- Appendix A Small-Scale Natural Gas Liquefaction
- Appendix B Criteria Pollutants
-
FIGURES (CONT)
9 CO2 Emissions in Fossil NG-to-CNGLNG Fuel Cycle 16
10 CO2 Emissions in Petroleum GasolineDiesel Fuel Cycle 16
11 Gas Processing Cost (GPC) Associated with 1- 2- and 3-Stage Membranes 20
12 CO2 Washreg Process 21
13 NG Processing Efficiencies of LFG-Based Projects Producing Vehicle Fuel 22
14 WTP PTW and WTW Energy Use for LFG-to-CNGLNG Pathways versus Fossil NG-to-CNGLNG Gasoline and Diesel Pathways 29
15 WTW Fossil Fuel Use for LFG-Based Pathways versus NA NG and Petroleum Gasoline and Diesel Pathways 31
16 WTW GHG Emissions for LFG-Based Pathways Compared with NA NG and Petroleum Gasoline and Diesel Pathways 33
17 Energy Use for CNG from LFG or Fossil NA NG versus Petroleum Gasoline 35
18 Fossil Fuel Use for CNG from LFG or Fossil NA NG versus Petroleum Gasoline 35
19 GHG Emissions for CNG from LFG or Fossil NA NG versus Petroleum Gasoline 36
20 Energy Use for LNG from LFG or Fossil NA NG versus Petroleum Diesel 37
21 Fossil Fuel Use for LNG from LFG or Fossil NA NG versus Petroleum Diesel 37
22 GHG Emissions for LNG from LFG or Fossil NA NG versus Petroleum Diesel 38
A-1 Schematics of NG Liquefaction Processes 49
B-1 CO Emissions for LFG-Based Pathways Compared with NA NG and Petroleum Gasoline and Diesel Pathways 52
B-2 NOx Emissions for LFG-Based Pathways Compared with NA NG and Petroleum Gasoline and Diesel Pathways 53
B-3 PM10 Emissions for LFG-Based Pathways Compared with NA NG and Petroleum Gasoline and Diesel Pathways 53
v
FIGURES (CONT)
B-4 PM25 Emissions for LFG-Based Pathways Compared with NA NG and Petroleum Gasoline and Diesel Pathways 54
B-5 SOx Emissions for LFG-Based Pathways Compared with NA NG and Petroleum Gasoline and Diesel Pathways 54
TABLES
1 Distribution of Municipal Solid Waste 1960ndash2007 8
3 Assumptions for LFG-Based CNGLNG Fossil CNGLNG and
4 Emission Factors for LFG-Fueled IC Engines LFG Flares and
2 Composition and Characteristics of Biomethane and Fossil Natural Gas 12
Petroleum Pathways 17
US Power Generation 24
5 Plant Efficiencies of NG Liquefaction Technologies 25
6 Emission Factors for Diesel- and LNG-Fueled Heavy-Duty Trucks 27
7 WTW Total Energy Use for LFG-to-CNG Pathways by Stage 30
8 WTW Total Energy Use for LFG-to-LNG Pathways by Stage 30
9 WTW Fossil Fuel Use for LFG-to-CNG Pathways by Stage 31
10 WTW Fossil Fuel Use for LFG-to-LNG Pathways by Stage 32
11 WTW GHG Emissions for LFG-to-CNG by Pathway Stage 33
12 WTW GHG Emissions for LFG-to-CNG by Pathway Stage 33
13 WTW GHG Emissions for LFG-to-LNG by Pathway Stage 34
14 WTW GHG Emissions for LFG-to-LNG by Pathway Stage 34
A-1 Process and Train Efficiencies of Major NG Liquefaction Processes 50
vi
ACKNOWLEDGMENTS
The authors gratefully acknowledge Dennis Smith National Clean Cities Director and Vehicle Technologies Deployment Manager at the US Department of Energy who supported this effort They also acknowledge the assistance of Jeffrey Hahn of Covanta-Haverhill Inc and Andrew Burnham Amgad Elgowainy and Thomas Wallner of Argonnersquos Center for Transportation Research who provided their time and expertise to analyze and interpret data and advise us of its strengths and limitations Stephanie Young (formerly of the California Integrated Waste Management Board) Scott Walker of the California Department of Resources and Recovery (CalRecycle) Chuck White of Waste Management Inc and John Barclay of Prometheus Energy who provided access to documents and other resources and Rachel Goldstein of USEPA Jeffrey Clarke of NGVAmerica and Sean Turner of Gladstein Neandross amp Associates who reviewed an earlier draft of this report Thank you all
vii
viii
1
WELL-TO-WHEELS ANALYSIS OF LANDFILL GAS-BASED PATHWAYS AND THEIR ADDITION TO THE GREET MODEL
Marianne Mintz Jeongwoo Han Michael Wang and Christopher Saricks
EXECUTIVE SUMMARY
Today approximately 300 million standard cubic ftday (mmscfd) of natural gas and 1600 MW of electricity are produced from the decomposition of organic waste at 519 US landfills (EPA 2010a) Since landfill gas (LFG) is a renewable resource this energy is considered renewable When used as a vehicle fuel compressed natural gas (CNG) produced from LFG consumes up to 185000 Btu of fossil fuel and generates from 15 to 184 kg of carbon dioxide-equivalent (CO2e) emissions per million Btu of fuel on a ldquowell-to-wheelrdquo (WTW) basis This compares with approximately 11 million Btu and 782 kg of CO2e per million Btu for CNG from fossil natural gas and 12 million Btu and 975 kg of CO2e per million Btu for petroleum gasoline Because of the additional energy required for liquefaction LFG-based liquefied natural gas (LNG) requires more fossil fuel (222000ndash227000 Btumillion Btu WTW) and generates more GHG emissions (approximately 22 kg CO2e MM Btu WTW) if grid electricity is used for the liquefaction process However if some of the LFG is used to generate electricity for gas cleanup and liquefaction (or compression in the case of CNG) vehicle fuel produced from LFG can have no fossil fuel input and only minimal GHG emissions (15ndash77 kg CO2e MM Btu) on a WTW basis Thus LFG-based natural gas can be one of the lowest GHG-emitting fuels for light- or heavy-duty vehicles
This report discusses the size and scope of biomethane resources from landfills and the pathways by which those resources can be turned into and utilized as vehicle fuel It includes characterizations of the LFG stream and the processes used to convert low-Btu LFG into high-Btu renewable natural gas (RNG) documents the conversion efficiencies and losses of those processes the choice of processes modeled in GREET and other assumptions used to construct GREET pathways and presents GREET results by pathway stage GREET estimates of well-toshypump (WTP) pump-to-wheel (PTW) and WTW energy fossil fuel and GHG emissions for each LFG-based pathway are then summarized and compared with similar estimates for fossil natural gas and petroleum pathways
2
1 INTRODUCTION
Renewable energy is a growing part of the US energy mix rising from 4076 trillion Btu (64 of total energy production) in 1970 to approximately 6800 trillion Btu (95 of total energy production) in 2007 (EIA 2009a) To meet goals for reducing import dependence and greenhouse gas emissions major efforts are under way to increase production of wind solar geothermal and ldquonext-generationrdquo biofuels from energy crops agricultural residues wood waste and other organic materials Although the spotlight tends to focus on sophisticated new technologies ldquolow-techrdquo processes (like anaerobic digestion) have long produced renewable fuel Biomethane from municipal solid waste (MSW) deposited in sanitary landfills is one such option Comprising roughly one-half of the gaseous mixture known as landfill gas (LFG) this renewable energy source has only recently begun to be recovered in the United States In the past standard procedure was to either vent the gas or capture and flare it in a collection system (along with the other constituents in the mixture) While flaring reduces the global warming potential (GWP) of the LFG stream by a factor of eight it fails to utilize the approximately 500 Btustandard cubic ft (scf) in the stream1
Today 519 landfills recover energy from landfill gas (EPA 2010a) Projects range from small internal combustion engines or microturbines using LFG to generate power for site electrical needs to multiple generation units supporting site needs and exporting excess power to the grid A few projects use power (generated on-site from the LFG or purchased from the electric grid) to purify the LFG stream convert it into pipeline-quality natural gas (NG) and pressurize it either for injection into the NG pipeline system or use as a vehicle fuel A handful of projects liquefy the natural gas to fuel buses or refuse trucks or to be sold into the bulk liquefied natural gas (LNG) market These latter options mdash producing compressed natural gas (CNG) or LNG and using it as a vehicle fuel or for injection into the pipeline system mdash are the focus of this report
11 BACKGROUND
This project was undertaken in response to growing interest in applying well-to-wheels (WTW) analysis to renewable fuels There are many motivations for this interest Utilities are interested in identifying and pursuing options to meet renewable energy mandates States considering low carbon fuel standards are interested in promoting lower carbon options many of which are also renewable The US Environmental Protection Agency (EPA) is interested in reducing landfill emissions by assisting in LFG energy project development The US Department of Energy (DOE) is interested in providing information and guidance to support transparent objective comparisons of alternative fuel productiondeliveryutilization pathways
There is also continued interest in reducing reliance on foreign energy sources Natural gas is a clean-burning domestic resource that produces fewer greenhouse gases (GHGs) per unit than petroleum gasoline or diesel Supplies of this lower carbon fuel are plentiful now and likely
1 See Section 311 for a discussion of net reductions in greenhouse gases (GHGs) and GWP achieved from flaring landfill gas
3
to remain so for the foreseeable future (see Section 12) Moreover if sizable quantities of LFG-based NG were added to the NG fuel ldquopoolrdquo the carbon content of that pool could be reduced rendering NG an even more attractive fuel choice
This project applies WTW analysis to several LFG-based pathways Energy consumption and GHG emissions for each of those pathways are quantified and compared with petroleum gasoline and North American natural gas (NA NG) pathways for producing distributing and utilizing the respective fuel in motor vehicles This study is supported by DOErsquos Office of Vehicle Technologies (OVT) The OVT has long supported research on technologies to produce natural gas as a vehicle fuel engine modifications to better utilize natural gas fuel and analysis to determine the impacts of natural gas-based vehicle fuels Some of that work in support of pilot projects to demonstrate LFG-based vehicle fuel production is included in the data base developed for this study
12 US NATURAL GAS RESOURCES
In the past decade advanced ldquohorizontal drillingrdquo technology and historically high natural gas prices have spurred domestic drilling activity in turn increasing natural gas reserves and motivating developers to seek new markets for natural gas US annual reserve additions have grown from a level where they barely kept up with NG production to one that is now more than double production (Figure 1) Most of these new reserves are from so-called unconventional sources primarily coal-bed methane and shale gas each of which now accounts for 9 of US proved NG reserves (EIA 2008) By year-end 2007 the United States had 2377 trillion cubic feet (tcf) of proved reserves of dry natural gas the highest year-end volume in the 31 years that EIA (2008) has published such estimates
FIGURE 1 Natural Gas Reserve Additions as Percent of Annual Production 1997ndash2007 (EIA 2008)
4
In concert with vigorous exploration and production activity NG pipeline construction has climbed to connect new supplies to the existing gas distribution infrastructure as well as to expand distribution capacity system wide In 2008 pipeline capacity increased by four times the average for the prior decade (Figure 2)
FIGURE 2 Pipeline Capacity Additions 1998ndash2008 (EIA 2009b)
With increased reserves and distribution capacity developers are looking for new natural gas markets One possibility is to replace conventional coal-fired power plants with NG-fueled integrated-gasification-combined-cycle power plants2 Another is to replace motor gasoline or diesel with lower-carbon natural gas This latter option could be particularly attractive if the intent is to achieve deep CO2 cuts in sectors that currently have few economic low-carbon alternatives Transportation is one such sector Resource developers like TB Pickens (2009) have targeted transportation vehicles as a potential new market for natural gas Although compressed natural gas (CNG) -fueled vehicles have been available for many years the lack of a widespread public fueling infrastructure has limited their appeal to all but centrally fueled fleets Even then many centrally fueled fleets have been reluctant to invest in additional fueling infrastructure and vehicles with uncertain resale values
Uncertainty has been an especially strong barrier to the market acceptance of NG-fueled motor vehicles Transit operatorsrsquo need to meet ever-tougher exhaust emissions standards has spurred them to consider CNG or LNG-fueled buses However other technologies mdash like hybrids and a new generation of low-emission diesels mdash may also meet the standards With no clear technology ldquowinnerrdquo the looming prospect of a low-carbon fuel standard may be a persuasive argument for NG particularly from low-carbon sources like landfill gas
2 Note however that this option is most attractive when the difference between the cost of electricity and the cost of the fuel required to produce electricity is relatively small Called the ldquospark spreadrdquo this difference narrowed over the past decade but has increased since 2007
5
13 NATURAL GAS AS A VEHICLE FUEL
Historically natural gas has been used mostly for power production space heating industrial processes and as a petrochemical feedstock In the past decade however its relatively low emissions (as compared with diesel engines in internal combustion engines) have made it increasingly attractive as an urban bus fuel especially in California where emission standards for nitrous oxides (NOx) and particulate matter (PM) are particularly stringent To use natural gas as a vehicle fuel many transit operators have replaced diesel buses with CNG buses containing a new generation of spark-ignited engines Fueling generally relies on existing local distribution pipelines to deliver the gas under relatively low pressure compressors to increase the pressure to roughly 3600 psi for on-site storage and storagedispensing systems to load the gas onto vehicles at 3000ndash3600 psi Fleets that are not served by natural gas pipelines or that must travel a longer distance between fueling usually use liquefied natural gas (LNG) which is generally delivered in cryogenic tank trucks
Spurred by Californiarsquos Low Carbon Fuel Standard and the possibility of a similar national standard there is increasing interest in vehicle fuels with lower carbon footprints CNG and LNG derived from landfill gas are particularly promising For each million Btu of energy petroleum diesel contains 21600 grams of carbon while North American fossil-derived natural gas (NA NG) contains 16200 grams If only vehicle operation is taken into account on a Btu-to-Btu displacement basis switching from petroleum diesel to NA fossil-based CNG can reduce carbon emissions by 25 (assuming comparable operating efficiencies) As shown in Section 31 switching from NA fossil-based CNG to LFG-based CNG can reduce carbon emissions much more
14 RENEWABLE NATURAL GAS AND GHG EMISSIONS
Natural gas derived from LFG is considered a renewable fuel since the original source of the carbon in the decomposed waste can be traced back to organic sources that naturally replenish it It is also a low-carbon fuel Whether in the form of CNG or LNG LFG-based NG has negative GHG emissions since its conversion to vehicle fuel displaces GHG emissions that would have occurred if the LFG had been oxidized into CO2 in the landfill flare
Renewable natural gas is particularly attractive to utilities subject to renewable fuel mandates LFG-based CNG or LNG is attractive to fleet operators in states with low-carbon fuel standards Since natural gas is fungible the entity purchasing the rights to a supply of LFG-based NG need not take physical possession of it to gain renewable fuel credits
15 FUEL CYCLE ANALYSIS
To understand a fuelrsquos impact the entire fuel cycle mdash from production of raw materials to delivery and end use mdash must be considered This requires a systematic accounting of the energy and emissions of each stage in the cycle from ldquowellrdquo to ldquowheelrdquo (WTW) This study was undertaken to characterize pathways for producing vehicle fuel from landfill gas estimate WTW
6
energy and GHG emissions at each stage in these pathways and compare results with petroleum-and fossil NG-based alternatives In this context the ldquowellrdquo is the landfill gas resource and the ldquowheelrdquo is the vehicle consuming the fuel
The analysis was conducted by using the GREET (Greenhouse gases Regulated Emissions and Energy use in Transportation) model created by Argonne National Laboratory Developed in Microsoftreg Excel with a graphical user interface GREET is structured to systematically account for a range of potential feedstocks fuels and conversion processes for any defined WTW pathway Downloadable at httpwwwtransportationanlgov modeling_simulationGREET GREET calculates emissions of three greenhouse gases (CO2 CH4 and N2O) and six criteria pollutants (VOC CO NOx SOx PM10 and PM25) and consumption of each of the following total energy fossil fuel petroleum natural gas and coal
In the years since its development GREET has become a familiar and respected tool for evaluating vehicle technologies and fuels on a consistent systematic basis Working with industry and government experts Argonne continues to upgrade and update the GREET model With support from the US Department of Energy (DOE) Argonne has added a number of hydrogen production pathways for stationary and mobile internal combustion engine and fuel cell applications and extensive simulations of biofuel production pathways Most recently Argonne has upgraded simulations of plug-in hybrid electric vehicles (PHEVs) in GREET The most recent GREET fuel-cycle model (GREET18d0) was released in June 2010 Currently there are more than 10000 registered GREET users
16 SCOPE
As stated above this report documents the conceptual approach data and initial results for a set of LFG-to-vehicle fuel pathways These landfill gas-based pathways have been added to GREET 18d0
The report itself is organized into five sections supplemented by two appendices Following this brief Introduction Section 2 describes the size and characteristics of the LFG resource base while Section 3 discusses WTW pathways their key stages and important features of the fuel cycle analysis In Sections 4 and 5 estimates of well-to-wheel (WTW) fossil fuel use and GHG emissions are presented and conclusions are discussed Appendix A provides additional detail on liquefaction assumptions and Appendix B presents estimates of WTW emissions of criteria pollutants
7
2 LANDFILL GAS
At present most of the biomethane generated at US landfills is flared in conjunction with emissions-abatement practices (For further discussions of flaring and ldquoreference caserdquo assumptions see Sections 21 and 31) Relative to venting flaring reduces criteria pollutant and GHG emissions but it captures none of the energy (approximately 500 Btuscf) in the gas that is burned3 Moreover by destroying a valuable energy resource it precludes the generation of additional revenue by the landfill owner ndash either as energy sales or in various forms of carbon and renewable energy credits For these reasons there is increasing interest in converting methane in the collected LFG into usable energy like natural gas hydrogen methanol ethanol or electricity This study investigates the potential for WTW energy and GHG emission benefits as the result of producing LFG-based natural gas for vehicle use
21 RESOURCE BASE
Since the mid-1960s sanitary landfills have been the main disposal method for municipal solid waste (MSW) in the United States In 2007 there were an estimated 1754 ldquoactiverdquo landfills accepting 137 million tons of waste annually or approximately 54 of the total MSW generated in the United States (EPA 2008)4 As shown in Table 1 and Figure 3 this share has been dropping steadily since 1960
An additional 6000 landfills are inactive (ie no longer receiving waste) 5 Over their lifetime landfills produce significant quantities of landfill gas (LFG) primarily methane (CH4) and carbon dioxide (CO2) from the anaerobic decomposition of organic materials which typically comprise some 60 of the waste-to-landfill stream The EPA actively monitors emission compliance and energy recovery at active landfills the latter through its Landfill Methane Outreach Program (LMOP) Figure 4 produced from a model developed by EPArsquos LMOP illustrates a typical LFG generation and recovery profile for a site opened in 1980 at which peak recovery occurs in 2014 (EPA 2008) In conventional landfills gas recovery typically begins a decade or more after the waste is deposited and continues for several decades In newer designs (eg conventional cells with leachate circulation bioreactors or anaerobic
3 In 1994 EPA created the Landfill Methane Outreach Program (LMOP) to help reduce methane emissions from landfills by encouraging the recovery and use of landfill gas (LFG) as an energy resource LMOP is a voluntary program to promote alliances among states energy users and providers landfill owners and operators and communities by providing information analysis and support for LFG-to-energy projects
4 The other 46 consists of construction waste from new construction or remodeling activities debris from the demolition of buildings and roads industrial waste from manufacturing processes and wastes banned from the MSW waste stream (including MSW ash and medical waste)
5 Inactive landfills must comply with EPA post-closure requirements which include monitoring and maintaining waste containment systems and monitoring groundwater to ensure that waste is not escaping and polluting the surrounding environment These activities are generally required for 30 years from site closure During this time inactive landfills continue to emit methane and other gases At larger landfills equipped with gas collection systems LFG is usually captured and flared in a thermal oxidizer At smaller landfills LFG is usually uncontrolled
8
TABLE 1 Distribution of Municipal Solid Waste 1960ndash2007 (EPA 2008)
Percent of Total Generation
Activity 1960 1970 1980 1990 2000 2004 2005 2006 2007
Generation 100 100 100 100 100 100 100 100 100 Recovery for recycling 64 66 96 142 221 230 235 241 249 Recovery for compostinga Neg Neg Neg 20 69 82 82 82 85 Total materials recovery 64 66 96 162 290 312 317 323 334 Combustion with energy recoveryb 00 03 18 145 141 126 126 126 126 Discards to landfill other disposalc 936 931 886 693 569 562 557 551 540
Pounds per Person per Day
Activity 1960 1970 1980 1990 2000 2004 2005 2006 2007
Generation 268 325 366 450 465 466 463 465 462 Recovery for recycling 017 022 035 064 103 107 109 112 115 Recovery for compostinga Neg Neg Neg 009 032 038 038 038 039 Total materials recovery 017 022 035 073 135 145 147 150 154 Combustion with energy recoveryb 000 001 007 065 066 059 058 058 058 Discards to landfill other disposalc 251 302 324 312 264 262 258 257 250
a Includes composting of yard trimmings food scraps and other MSW organic material excludes backyard composting
b Includes combustion of MSW in mass burn or refuse-derived fuel form and combustion with energy recovery of source-separated materials in MSW (eg wood pallets and tire-derived fuel)
c Discards after recovery minus combustion with energy recovery Discards include combustion without energy recovery Details may not add to totals due to rounding
FIGURE 3 Disposition of Municipal Solid Waste 1960ndash2007 (EPA 2008)
9
FIGURE 4 Typical Landfill Gas Production and Recovery Profile
digestion of organics) accelerated waste stabilization permits economic recovery to begin much earlier typically within 5ndash10 years of waste deposition (University of Florida and University of Central Florida 2008)
Because of its high methane content LFG can be explosive as well as a potent source of greenhouse gases It is also a major source of non-methane organic compounds (NMOCs) a precursor of ground-level ozone formation Historically a system of vertical wells drilled into landfills was used to dilute the concentration of CH4 in the landfill to a level below methanersquos explosive limit (5ndash15 percent) thereby controlling the explosion hazard Most NMOC emissions have been controlled since 1996 when landfills with a permitted capacity greater than 25 million cubic meters of waste were brought under the Landfill Rule of the Clean Air Act which requires them to have collection systems consisting of low-pressure wells horizontal pipes and blowers to capture the LFG and a flare or thermal oxidizer to destroy it6 (Thus some 98 of NMOCs are converted to less toxic compounds and 999 of the methane is oxidized to CO2)
7 Although collection efficiencies reportedly range from 50 to 90 EPA estimates an average value of 75 for inventory purposes (EPA 1995) Methane in the remaining 25 of LFG that is uncontrolled (ie the area between the two curves in Figure 4) is typically oxidized to CO2 or converted to other compounds by microbes in the landfill cover soil Some of these compounds eventually are emitted to the atmosphere some remain in the soil
6 Of Californiarsquos 367 municipal solid waste landfills 218 (59) have a permitted capacity of less than 25 million m3 (CARB 2009) Nationally approximately 46 of the waste in the ground is not covered by the landfill gas rule Presumably much of the excluded waste is at small landfills
7 On June 25 2009 the California Air Resources Board (CARB) ruled that all previously uncontrolled MSW landfills in that state (ie those with permitted capacities below 25 million m3) must design and install gas collection systems by 2012 and that currently controlled landfills must improve gas collection efficiency (CARB 2009)
10
22 RESOURCE DEVELOPMENT
As of April 2010 EPA reports that 519 projects are recovering energy from landfills (EPA 2010a) More than 70 of these projects generate power most of the others minimally process the LFG and use it in boilers or various manufacturing applications (Godlove 2010) Approximately 13 billion kWh of electricity and 102 billion cubic feet (bcf) of natural gas are generated each year from recovered LFG (Godlove 2010) representing about 03 of US electricity and 03 of US natural gas consumption (EIA 2009a)
Some 32 projects currently convert LFG into high-Btu NG or ldquorenewable natural gasrdquo (RNG) mostly for injection into the pipeline system (Godlove 2010) A handful of these projects include vehicle fueling either as CNG or LNG (Ludwig 2009) In the past these latter projects have tended to be pre-commercial or pilot scale Now however several are coming on line at commercial scale or growing to commercial scale as second phases become operational These latter projects include
bull Altamont Landfill LFG-to-LNG in Livermore CA bull Frank R Bowerman Landfill LFG-to-LNG in Orange County CA bull Franklin County Landfill LFG-to-CNG in Columbus OH bull McCommas Bluff Landfill LFG-to-CNG and pipeline gas in Dallas TX bull Rumpke Landfill LFG-to-CNG and pipeline gas in Cincinnati OH
To the extent possible these projects are included in the database developed for this analysis Data on the following North American pilot-scale projects are also included in the database
bull Central Landfill LFG-to-CNG in Sonoma County CA bull Burlington County Landfill LFG-to-LNG in NJ bull Puente Hills Landfill LFG-to-CNG in Los Angeles CA bull Les Entreprises Berthier Inc (EBI) Landfill LFG-to-pipeline gas in Quebec bull Highland Valley Copper Landfill LFG-to-pipeline gas in Vancouver
Figure 5 shows operational LFG-to-energy projects as of April 2010 as well as landfills identified by the EPArsquos LMOP as candidates for future projects
23 ADDITIONS TO THE RESOURCE BASE
In addition to the ldquoin placerdquo LFG resource LFG continues to be generated by MSW decomposition Lear and Burdelski (2009) estimate that the current US population generates some 27 billion cubic ft (bcf) of ldquonewrdquo LFG each year equivalent to approximately 121 million gal of gasoline
11
FIGURE 5 Operational LFG-to-Energy Projects and Candidate Landfills by State (EPA 2010a)
24 LANDFILL GAS COMPOSITION
As shown in Table 2 methane (CH4) is the predominant constituent in both fossil natural gas and LFG Although gas composition varies from one site to another LFG typically contains around 45ndash50 methane (CH4) 35ndash40 carbon dioxide (CO2) and 10ndash15 nitrogen (N2) with smaller amounts of hydrogen (H2) oxygen (O2) hydrogen sulfide (H2S) and ammonia (NH3) The gas is usually saturated with water vapor
LFG may contain more than 500 different contaminants including a variety of sulfur compounds that are corrosive in the presence of water halogenated compounds (eg carbon tetrachloride chlorobenzene chloroform) that produce corrosive combustion products and organic silicon compounds (eg siloxanes) that form siliceous deposits in downstream applications mdash like internal combustion engines (Persson et al 2006) Thus an initial cleanup or pre-purification step is needed before LFG can be used in any application involving combustion
12
TABLE 2 Composition and Characteristics of Biomethane and Fossil Natural Gas
Parameter Unit EU LFG EU AD-Based
Biogas NG from NA
Gas Field NG from NNA
Gas Field NG distributed in
US
Source
LHV average range
Density average range
Btuft3
gft3
(Persson et al 2006)
406 584
348 321
1081 835ndash1336
224 195ndash279
(Segeler 1965)
1145 627ndash1717
1049 945ndash1121
239 195ndash369
215 203ndash246
CH4 average range
vol 45 36ndash65
63 53ndash70
515 847ndash988
770 228ndash980
894 728ndash952
H2 average vol 0-3 0 ndash ndash ndash
CO2 average range
vol 40 15ndash50
47 30ndash47
055 0ndash60
41 0ndash290
07 0ndash20
N2 average range
vol 15 5ndash40
02 ndash
403 0ndash294
17 0ndash121
29 0ndash171
O2 average range
vol 1 0ndash5
0 ndash
006 0ndash04
01 0ndash14
00 0ndash04
H2S average range
ppmv lt100 0ndash100
lt1000 0-10000
100 0ndash3100
400 0ndash5200
NMOC average (as Hexane) range
ppmv 1100 0ndash6600
2000 0ndash17000
400 0ndash1400
NH3 ppm 5 lt100 ndash ndash ndash
13
3 FUEL CYCLE ANALYSIS OF LANDFILL-GAS-BASED PATHWAYS
31 LFG REFERENCE CASE
The benchmark or reference case is critical to estimating the change in energy and emissions associated with introducing any new fuel or vehicle technology For fossil fuels the question is usually trivial mdash were it not for development of the resource to produce the new fuel energy and emissions would not occur Although process energy use and vehicle emissions may change in response to mandates requiring different fuel properties (eg low-sulfur diesel in place of conventional diesel or reformulated gasoline in place of unleaded gasoline) the resulting ldquonewrdquo fuel comes from the same feedstock as before and the benchmark or reference is the ldquooldrdquo fuel Thus the energy and GHG impact of the ldquonewrdquo fuel is simply the difference between the values associated with the ldquonewrdquo and ldquooldrdquo fossil fuels
This is not usually the case with renewable fuels If the feedstock historically has not been used to produce fuel the energy and GHG impact of the new fuel is the difference between energy and GHG emissions associated with the resourcersquos typical prior use (ie the pathway or reference case) and its new one With respect to landfill gas the key questions are
bull What is the typical prior use for LFG
bull Would the LFG have been produced in a conventional landfill gathered in a standard gas collection system and flared Or would it have been produced some other way With different constituents With more methane emitted to the atmosphere
bull At what point does the new LFG pathway diverge from the old
Since we are concerned with the difference in energy and GHG emissions between the two pathways the answer to the last of the above questions helps bound our system Shared stages can be ignored since they are in both ldquooldrdquo and ldquonewrdquo pathways Thus for example gas that continues to be flared (ldquoFlared LFGrdquo in Figure 6) is excluded from LFG-based pathways which are labeled as cases within the dashed system boundary shown in Figure 6
311 Flaring versus Venting Landfill Gas
Since the mid-1990s MSW landfills with a design capacity of 25 million m3 or more have been regulated under the Landfill Rule of the Clean Air Act (EPA 2000) To reduce emissions of volatile organic compounds air toxics and methane these large landfills are required to install collection wells into the landfill and route the gas to a suitable energy recovery or combustion device (flare) to monitor surface methane on a quarterly basis and to expand their collection systems if the methane concentration exceeds 500 parts per million
As shown in Figure 7 flaring dramatically reduces the impact of carbon contained in organic waste Emitted to the atmosphere as CH4 the carbon in the waste has a CO2 equivalence
14
of 368 emitted as CO2 the equivalence is reduced to 44 The resulting ratio (36844 = 836) is the relative benefit of flaring over venting the landfill gas
The Landfill Rule succeeded in reducing VOCs and air toxics and in cutting methane emissions by over 37 million metric tons (EPA 1996) Few would argue that the approximately $22 million in capital and $190000 in annual operating cost required to retrofit each covered landfill was not money well spent (EPA 1996) However it was soon recognized that the energy in the flared gas roughly 500 Btuft3 could be more productively utilized Thus EPArsquos Landfill Methane Outreach Program (LMOP) was created to encourage the recovery and use of LFG as an energy resource LMOP currently has over 800 partners mdash including energy providers landfill owners and operators and host communities mdash involved in LFG-to-energy projects
FIGURE 6 Fuel Cycle for Landfill-Gas-Based CNG and LNG as Used in GREET Modeling
15
FIGURE 7 CO2 Equivalent Emissions of Flaring versus Venting Landfill Gas
312 Carbon Fate in LFG Fossil NG and Petroleum Fuel Cycles
As discussed above flaring emits CO2 Purifying the LFG and converting it into CNG or LNG for vehicle fuel still emits CO2 However the CO2 would have been emitted anyway (hence there is no net addition) Moreover the CO2 from LFG displaces a near equivalent amount of CO2 from fossil fuels (natural gas or petroleum) that would have been emitted if the vehicles operating on LFG-derived CNGLNG had not been converted from their original fossil fuel
Figures 8ndash10 depict the various stages of the LFG fossil NG and petroleum fuel cycles showing where carbon is emitted to the atmosphere As discussed earlier the LFG fuel cycle (Figure 8) begins with gas collection which is assumed to capture 75 of the total LFG produced A portion of the collected carbon is assumed to be flared either in waste gas from the purification process or as excess LFG that cannot be processed Carbon is also emitted in transportation and distribution (TampD) and vehicle operation
For comparison purposes Figures 9 and 10 show fossil NG and petroleum fuel cycles As in the LFG fuel cycle carbon is emitted in feedstock production processingrefining TampD and vehicle operation
16
FIGURE 8 CO2 Emissions in LFG-to-CNGLNG Fuel Cycle
FIGURE 9 CO2 Emissions in Fossil NG-to-CNGLNG Fuel Cycle
FIGURE 10 CO2 Emissions in Petroleum GasolineDiesel Fuel Cycle
17
32 OVERVIEW OF LFG-TO-CNGLNG FUEL CYCLE
Figure 6 illustrates the 10 LFG-based pathways investigated in this study Shown within the dashed system boundary pathways include the resource mdash LFG collected by the gas collection system (discussed in Section 33) a cleanuppurification process to convert it into NG (discussed in Section 34) electricity from either an on-site generator or the grid assuming the US average generation mix (discussed in Section 35) and if fueling is off-site pipeline or truck delivery of the product NG to stations where it is compressed for vehicle fueling For pathways in which LNG is produced a liquefaction process (discussed in Section 36) occurs between production and transportation and distribution (TampD which is discussed in Section 37) Note that this fuel cycle is but a portion of the lifecycle of municipal solid waste
Table 3 summarizes the assumptions of each pathway The collected LFG is converted to NG via pre-purification and CO2 removal The NG production process usually requires electricity as a process fuel that can be delivered by an on-site distributed generator (RC-1 RC-2 RL-1 RL-2 and RL-3) or from the grid (RC-3 RC-4 RL-4 RL-5 and RL-6) During NG processing waste gases (including contaminants CO2 and unrecovered CH4) may be returned to the input stream or flared Since the waste gases are not involved in NG processing (ie they essentially flow through the process) they are subtracted from the LFG feed for modeling purposes Thus in all GREET-modeled pathways the LFG feed is assumed to include only CH4
converted into NG or used for on-site power generation
TABLE 3 Assumptions for LFG-Based CNGLNG Fossil CNGLNG and Petroleum Pathways
Case Transportation amp No Feedstock Fuel Electricity Source Fueling Distribution (TampD)
RC-1 LFG CNG Site Generation On-site NA RC-2 LFG CNG Site Generation Off-site Pipeline RC-3 LFG CNG US Average Mix On-site NA RC-4 LFG CNG US Average Mix Off-site Pipeline CNG NA NG CNG US Average Mix Off-site Pipeline CG Crude Gasoline US Average Mix Off-site Mixed Mode
RL-1 LFG LNG Site Generation On-site NA RL-2 LFG LNG Site Generation Off-site LNG Truck RL-3 LFG LNG Site Generation Off-site Diesel Truck RL-4 LFG LNG US Average Mix On-site NA RL-5 LFG LNG US Average Mix Off-site LNG Truck RL-6 LFG LNG US Average Mix Off-site Diesel Truck LNG NA NG LNG US Average Mix Off-site Pipeline LSD Crude Diesel US Average Mix Off-site Mixed Mode
18
For renewable CNG (RC cases in Figure 6) the produced gas is compressed by an electric compressor at a fuel station For on-site fueling cases (RC-1 and RC-3) the necessary electricity is supplied by the genset for off-site fueling cases (RC-2 and RC-4) electricity comes from the grid For renewable LNG (RL cases in Figure 6) the produced gas is liquefied by a small on-site liquefier NG production and liquefaction use the same power source (ie a distributed generator for RL-1 RL-2 and RL-3 and the grid for RL-4 RL-5 and RL-6) The produced liquid can be dispensed at an on-site fuel station (RL-1 and RL-4) or transported to off-site stations via LNG trucks (RL-2 and RL-5) or diesel trucks (RL-3 and RL-6) Note that LNG trucks are fueled by the LFG-based LNG
In this study energy and material inputs and outputs are characterized for the steps in the LFG-to-CNG and LFG-to-LNG fuel cycles in order to estimate overall energy and greenhouse gas emissions associated with pathways As with other GREET pathways results for LFG-based CNG and LNG are estimated in units of energy use and emissions per unit of consumed energy andor per mile driven with vehicles fueled with CNGLNG For ldquowell-to-pumprdquo (WTP) results this includes NG production transmission and distribution of the fuels for ldquowell-to-wheelsrdquo (WTW) results it includes WTP results plus consumption or emissions during vehicle operation Estimates are then compared with results for fossil North American natural gas (NA NG) and conventional petroleum pathways
Note that conventional NA NG and petroleum pathways start with energy in the unrecovered feedstock while the landfill gas pathway starts with energy in the collected feedstock (ie LFG) As pointed out in Brinkman et al (2005) the GREET model accounts for energy use at different starting points for different fuels For fossil fuels mdash such as NA NG gasoline diesel and electricity from fossil fuels mdash the accounting system starts with primary feedstock recovery In this study the energy in the collected LFG is not of concern because it would have been flared if not converted to NG Therefore landfill gas pathways start with the processing of collected LFG Details about the energy accounting are discussed in Section 344
33 GAS COLLECTION
As stated earlier pathways begin with a process stream of LFG which is assumed to be 75 of the total LFG produced (Figure 6) While this share is consistent with EPA assumptions it is not a critical parameter8 Instead of going to the flare a blower diverts the collected LFG to a cleanup unit
34 NATURAL GAS PRODUCTION
The NG production process includes pre-purification and purification (primarily CO2
removal) The processes can use similar technologies and are closely integrated in many cases Also the required process energy or process efficiency is often reported as an integrated process
8 Others claim that the average share of LFG collected is closer to 90 (Sullivan 2010) However because GREET pathways begin with the processing of collected LFG the share lies outside our fuel cycle system boundary and does not affect results
19
Therefore NG production efficiency in this study is defined as the energy in the produced NG divided by the sum of the energy in the LFG fed to the pre-purification step plus the process electricity for pre-purification and CO2 removal
341 Pre-Purification
The collected landfill gas must be treated to remove impurities before it enters the CO2
removal process Impurities include corrosive hydrogen compounds low concentrations (parts per million) of non-methane organic compounds (NMOCs including siloxane) and water As stated in 40 CFR Parts 72 and 75 the level of hydrogen sulfide (H2S) mdash a corrosive toxic and flammable gas with unpleasant odor mdash must be reduced to less than 5 ppm (or 03 g100 scf) for pipeline natural gas Many well-established processes (eg absorption adsorption and chemical and thermal oxidation)9 are available for H2S removal from gas fluxes (Syed et al 2006) One of the most common is an iron oxide-based sulfur scavenging process (Kohl and Nielsen 1997) in which hydrogen sulfide reacts with iron oxide to form iron sulfide while the landfill gas flows through granular iron-oxide in a bed The process is suitable for the treatment of relatively small volumes of gas For dehydration pressure swing adsorption (PSA) or refrigerated drying are widely used
The output mdash pre-purified landfill gas mdash can then be used to fuel an on-site power-generator providing electricity for CO2 removal and further conditioning steps as well as export power
342 CO2 Removal
The H2S-treated and dehydrated landfill gas is further purified by removing CO2 from the gas stream Four types of technologies are widely employed membrane separation adsorption absorption and cryogenic distillation To enhance the quality of the product fuel more than one technology may be used in series Further details are explained below
Membrane Separation
Since CO2 is more permeable than CH4 the two may be separated by selective permeation through membranes When the landfill gas contacts the membrane more CO2 than CH4 permeates although quantities depend on the partial pressure difference across the membrane As shown in Figure 11 CO2 concentration in the LFG feed affects the optimum number of membrane stages (Spillman 1995 Datta and Sen 2006) Since two-stage and three-stage membrane systems are more economical (in dollars per normal m3 of product gas) than single-stage systems a second membrane system or a secondary amine process is often used in landfill gas projects (Pomerantz and Turcotte 2004)
9 These same technologies are used in large-scale NG processing plants but with somewhat different sulfur scavenging processes
20
FIGURE 11 Gas Processing Cost (GPC) Associated with 1- 2- and 3-Stage Membranes (Datta and Sen 2006)
Membrane separation is amenable to a wide range of process stream volumes CO2
concentrations and product-gas specifications It also tends to be more environmentally friendly than amine processes Since membrane separation operates at relatively high pressure ranging from 200 to 600 psig (Air Liquide 2009 Pomerantz and Turcotte 2004) a further benefit is reduction in compression requirements for CNG production or injection into the gas grid
Adsorption
Swing adsorption separates CO2 from landfill gas by collecting CO2 on the surface of an adsorbent Parameters affecting the collection include temperature total pressure and partial pressure of the constituent gases In pressure swing adsorption (PSA) the pressure is swung (since CO2 is adsorbed more easily than CH4 under high pressure) and the CH4-rich gas that is not adsorbed flows through the vessel Once the adsorbent in the vessel is saturated adsorbed CO2 is removed by reducing the pressure to ambient A cycle of PSA adsorption and desorption is typically relatively short since common industrial practice is to use multiple vessels to maintain a constant feed flow and output gas product PSA operates at relatively high pressure the pressure of the product gas ranges from 100 to 200 psig (Sperling Hansen Assoc 2007)
Absorption
In absorption processes molecules in gas phase (eg H2S and CO2) are removed as they become liquid phase in solutions The amine process one of the most common absorption processes in the natural gas industry uses aqueous solutions of various alkanolamines to remove H2S and CO2 In a typical process a CO2- and H2S-rich gas passing upward through an absorber contacts a downward-flowing amine solution that absorbs CO2 and H2S The purified gas flows through to the top of the absorber while the amine-rich gas is collected at the bottom where it is sent to a regenerator to produce lean amine In some landfill gas recovery projects water scrubbing (ie water is the absorbent) is used in place of an amine solution
21
Cryogenic Distillation
Cryogenic distillation uses the relatively higher boiling temperature of CO2 mdash as compared with CH4 mdash to separate it from landfill gas CO2 Washreg developed by Acrion Technologies illustrates the cryogenic distillation process 10 As in the amine process dry compressed landfill gas enters the bottom of an absorber column flows upward and contacts a downward-flowing solution (in this case liquid CO2) which ldquowashesrdquo out contaminants (see Figure 12) When the contaminant-free landfill gas is cooled by refrigeration at the top of the absorber (typical gas temperature is ndash59degF) the CO2 in the gas is condensed The clean gas exits at the top of the absorber and some of the liquid CO2 can be collected for possible co-product use The rest of the CO2 flows downward as the absorbent The contaminant-free gas is clean enough to provide a hydrogen source for a fuel cell or a feedstock for chemical synthesis such as methanol However since its CO2 concentration (~27) is still higher than pipeline quality natural gas or transportation fuel further treatment or post purification (for example using membrane separation) is required (Cook et al 2005)
343 Process Efficiency
Data to develop the NG production process efficiency were obtained by literature search and direct contact with developers of a number of pilot- and commercial-scale LFG-to-NG projects whose information is publicly available These include Acrion 2009 Cook 1998 Cook 2002 Prometheus 2007 Sperling Hansen Assoc 2007 Pomerantz and Turcotte 2004 GTI 2007 and Johansson 2008 As shown in Figure 13 the energy efficiency of NG processing at these sites ranges from about 91 to 97 with larger projects tending to achieve somewhat higher efficiency Although most projects generate their own electricity for NG processing two projects do not report the amount of LFG used for on-site power generation and none report the share of co-generated electricity exported to the grid Thus all co-generated electricity is assumed to be used for NG production and NG processing efficiency is calculated from the energy content of the landfill gas used assumed liquefaction efficiency (see Section 36) and assumed generator efficiency (ranging from approximately 28 to 44) On the basis of these data and assumptions the default NG processing efficiency is calculated as 944
FIGURE 12 CO2 Washreg Process (Acrion 2009)
10 A key advantage of CO2 Washreg is that it uses liquid CO2 separated from landfill gas to absorb other impurities
22
FIGURE 13 NG Processing Efficiencies of LFG-Based Projects Producing Vehicle Fuel
344 Energy Use Accounting
Although LFG-based CNGLNG contains the same amount of energy as fossil-based CNGLNG the former is renewable (ultimately from solar energy) while the latter is not This highlights a key issue in GREET simulation of LFG-based pathways mdash namely the appropriate treatment of the energy in LFG This energy is produced from the decomposition of organic materials by methanogenic bacteria in the waste stream From the point of view of energy accounting the ldquosystemrdquo includes only the solar energy recovered from the organic materials since the losses from solar energy to organic material and from organic material to LFG are irrelevant As with other biogenic energy sources the solar energy embedded in LFG can be ignored since it would be unused if not captured Thus the LFG fuel cycle includes only the energy in the LFG (as total energy but not fossil fuel) when it is used to generate power for processing (or for addition to the grid) for compressionliquefaction and TampD and for vehicle operation However if the amount of co-generated electricity equals the amount of process electricity required (for LFG processing and compression or liquefaction) or the plant does not import or export electricity only the energy used by the genset or converted to NG needs to be counted On the other hand if the generator produces less electricity than needed for processing the remainder must be imported from the grid and upstream energy use and emissions for imported grid electricity must be included in the fuel cycle analysis Likewise if the amount of co-generated electricity exceeds process needs the excess can be sold to the grid (displacing an equivalent amount of electricity) and upstream energy and emissions (for the displaced grid electricity) must be taken as credits11
35 ON-SITE POWER GENERATION
Many landfill gas recovery projects incorporate on-site generators to produce process electricity Established technologies include internal combustion engines (ICEs) and natural gas turbines
11 For LFG-based CNGLNG pathways we assume that the genset generates the same amount of electricity as the amount of process electricity required meaning no electricity is imported or exported
23
351 Technologies
ICEs are typically spark-ignition reciprocating engines powered by the pre-purified landfill gas (or biogas) ICEs offer low initial cost easy start-up proven reliability and good part-load characteristics and heat recovery potential Emissions can be controlled by exhaust catalysts selective catalytic reduction and better control of the combustion process NREL and EPRI forecast electric efficiencies for natural gas ICEs ranging from 33 for rich-burn engines to 44 for lean-burn engines by 2010 (Goldstein et al 2003 EPRI 2004)
Combustion turbines can develop power over a wide capacity range from several kilowatts to hundreds of megawatts Microturbines small combustion turbines with outputs in the range of 30ndash200 kW are suited to lower-capacity applications like LFG recovery Microturbines (MTs) are capable of producing power at improved efficiencies by recuperating heat from the exhaust gas to the incoming air stream They also have the advantage of no gearbox or lubricating oil requirement and high engine speed (ranging from 80000 to 100000 rpm) (Dunn 2000) NREL and EPRI forecast microturbine and small gas turbine efficiencies of 29ndash40 by 2010 (Goldstein et al 2003 EPRI 2004)
352 Criteria Pollutant Emissions
Since all but one of the landfill gas projects reviewed in this study use ICEs for on-site power generation and emissions data are more generally available for LFG-fueled ICEs than for MTs ICE engines are the default technology for LFG-fueled power generation in GREET On the basis of available data their default electric efficiency (electricity from the genset divided by energy in the LFG feed to the genset) is set to 35
Since it is assumed that electricity is the only energy source used in the process (other than the LFG itself) emissions from power generation are the only emissions that need be taken into account in the fuel cycle analysis These are calculated from newly developed GREET emission factors for LFG-fueled stationary IC engines Most current projects producing pipeline-quality gas or CNGLNG for vehicle fuel utilize IC engines in the range of 1ndash2 MW that must meet point source standards for criteria pollutant emissions Since local rules are often stricter than federal standards GREET emission factors are based on the former calculated from project-level data contained in permit applications and source tests Default factors for emissions of volatile organic compounds (VOCs) carbon monoxide (CO) nitrogen oxides (NOx) and particulates of 10 micrometers or more (PM10) are calculated from these data Methane (CH4) and nitrous oxide (N2O) emissions are rarely reported in source tests since they are not regulated12 Moreover field measurements of N2O are generally below detection limits Thus GREET emission factors for unburned methane (ie CH4 slip) from the IC engine are based on the relative methane destruction efficiency of stationary IC engines as compared with the flare GREET default emission factors for carbon dioxide (CO2) and sulfur oxide (SOx) from on-site power generation are estimated as a function of genset efficiencies the carbon and sulfur content of input and output gas streams and values reported in the literature
12 Although CH4 could be calculated as the difference between total HC and NMHC the result is not accurate because the methodologies are not consistent
24
TABLE 4 Emission Factors for LFG-Fueled IC Engines LFG Flares and US Power Generation
Factor (gmmBtu) VOC CO NOx PM10 PM25 SOx CH4 N2O CO2
LFG-Fueled ICEs 627 2735 201 85 85 027 446 087 57600 LFG Flares 237 415 162 50 50 027 316 11 59200 US Average Power 34 455 187 130 70 474 38 267 207000 Generation
Since LFG is assumed to be flared unless used in the generator or converted to NG avoided emissions (from the flare) are considered credits Emission factors for VOC CO NOx and PM10 from LFG flares are used to calculate these credits (EPA 1995) As stated above CH4
emission factors are calculated from the destruction efficiency of LFG flares (9986) (SCS 2007 TRC Environmental Corporation 2008) while CO2 and SOx emission factors are calculated by using a carbon and sulfur balance approach
Table 4 summarizes the emission factors for LFG-fueled IC engines and LFG flares as compared to those for US power generation (ie the average emission factor for the mix of technologies used for electricity production) Note that upstream emissions of the US average mix are substantial (155 g VOCMMBtu 376 g NOxMMBtu 274 g PM10MMBtu 685 g PM25MMBtu and 283 g CH4MMBtu) while LFG produces no upstream emissions
36 LIQUEFACTION
For LNG production the clean gas is liquefied at the recovery site for both on-site and off-site fueling pathways Clean gas is cooled to ndash260degF and if necessary a post-purification step is used to further enhance the quality of LNG This is usually accomplished by flash evaporation of nitrogen Produced LNG is stored on-site as a cryogenic liquid in insulated storage vessels at 50ndash150 psi
Efficiency is the primary determinant of energy use and emissions associated with NG liquefaction Efficiency data for several technologies of interest to this analysis are summarized in Table 5 According to Brendeng and Hetland (2004) the propane pre-cooled mixed refrigerant (C3MR) process accounts for nearly 80 of large-scale liquefaction units and almost 90 of global capacity Although representing a smaller share of global capacity the single mixed refrigerant (SMR) and expander processes are considered good candidates for small-scale liquefaction and are already used in some LFG projects (Cook et al 2005 GTI 2007 Prometheus Energy Corp 2007) In this study SMR and expander processes are assumed to be representative of small-scale liquefaction and thus the default NG liquefaction efficiency is set to 89 which is relatively lower than the large-scale efficiency assumption (91) used elsewhere in GREET Appendix A contains a more detailed discussion of the liquefaction calculations and assumptions used in this analysis
25
TABLE 5 Plant Efficiencies of NG Liquefaction Technologies (Vink and Nagelvoort 1998)
Technology C3MRa Cascade DMRb SMRc Expander
Plant Efficiency () 907 890 905 894 882 a
b C3MR Propane pre-cooled mixed refrigerant DMR Dual mixed refrigerant
c SMR Single mixed refrigerant
37 TRANSPORTATION AND DISTRIBUTION
As mentioned earlier the produced CNGLNG can be dispensed at an on-site fuel station or transported to off-site fuel stations via pipeline (if CNG) or heavy-duty truck (if LNG) For off-site fueling GREET default assumptions are used to calculate feedstock loss and transport energy consumption but transport distance is reduced to 50 miles
371 Transportation and Distribution of CNG
Assuming that the pressure of the produced NG is high enough to be directly injected into a local distribution system (200 psig) no addition energy consumption or emissions are considered for both on-site and off-site CNG cases other than those in conjunction with dispensing into a CNG-fueled vehicle At fuel stations the produced NG is compressed to 4000 psia by electric compressors The electric compressors at an on-site station are assumed to use electricity supplied by the on-site LFG-fueled generator while those at off-site stations are powered by grid electricity Compression efficiency defined as the heating value of the compressed gas divided by the sum of energy used during NG compression and the heating value of the compressed gas is calculated from the following formula based on an adiabatic process (Wang et al 2001)
Compression Efficiency =
FD Wmin +
FDCE x EE
where
Wmin
N k M
= = = =
minimum work required for gas compression (W) number of compression stages (6 for off-site 5 for on-site fuel stations) ratio of specific heats (132 for NG) mass flow (kgs)
26
R = universal gas constant (Jkg K 518 for NG) T = temperature (K) Z = compressibility factor obtained from the Redlich-Kwong equation of state P2 = final pressure (4000 psia for fuel station) P1 = initial pressure (200 psia for on-site stations 50 psia for off-site fuel
stations)
Compression Efficiency = overall efficiency of compression FD = fuel delivered (kW) CE = work efficiency of compressors (80 for pipeline and 65 for fuel station)
and EE = engine efficiency (92ndash95 with electric motors)
372 Transportation and Distribution of LNG
As mentioned earlier LNG can be dispensed at an on-site fuel station or transported to off-site fuel stations via cryogenic tank truck Trucks are assumed to be fueled by either LFG-based LNG from the plant or petroleum diesel If LFG-based LNG is used the direct NG consumption is excluded from fossil fuel accounting but not total energy accounting since the produced LNG is a renewable fuel Also avoided emissions (from the flare) due to the LFG-based LNG use are considered credits
38 VEHICLE OPERATION
Fuel economy is essential for estimating fuel cycle results per mile traveled In this study we assume that light-duty vehicles (LDVs) operate on CNG while heavy-duty vehicles (HDVs especially refuse trucks) operate on LNG Thus results for CNG- and LNG-fueled vehicles are compared to those for conventional gasoline (CG) LDVs and diesel (CD) HDVs respectively We also assume that CG LDVs achieve the GREET default fuel economy and emissions and that CNG LDVs are as efficient as CG LDVs
On the other hand LFG-based LNG is expected to fuel buses and refuse trucks The latter application is particularly appealing since vehicles could be fueled on-site in the course of their normal duty cycle As with LDVs results for a ldquoper mile traveledrdquo metric require estimating the fuel economy of diesel- and LNG-fueled HDVs Refuse truck fuel economy is reported in only a few publications According to Chandler et al (2001) the fuel economy of diesel-fueled refuse trucks is 257 mpg Transit bus fuel economy is more readily available According to Watt (2000) Chandler et al (2000) Chandler et al (2006) and Barnitt et al (2006) current diesel-fueled transit buses are 20 more fuel efficient than CNGLNG-fueled buses However this advantage is likely to drop as manufacturers equip new diesel buses with particulate traps and other controls in order to meet stiff 2010 emissions standards Cummins-Westportrsquos new ISL G line of natural gas engines is already achieving fuel efficiencies that more closely mirror diesel fuel efficiencies (CWI 2009) For this study we assume that diesel-fueled HDVs will be 10 more fuel-efficient than LNG-fueled HDVs
27
HDV emission factors for CO PM and NOx are based on EPArsquos engine certification data for Cummins ISL G engines (EPA 2010b) converted to gmi by using conversion factors and brake specific fuel consumption (BSFC) for heavy-duty vehicles provided by ARCADIS Geraghry amp Miller Inc (2002) Since hydrocarbon emissions (including CH4 and VOC) are below detection limits in the certification data base emission factors for these pollutants are set to zero N2O emission factors are based on existing GREET defaults while SOx and CO2
emissions are estimated from carbon and sulfur balance calculations Table 6 summarizes the resulting emission factors for diesel- and LNG-fueled heavy-duty trucks
TABLE 6 Emission Factors for Diesel- and LNG-Fueled Heavy-Duty Trucks
Emissions by Pollutant (gmi)
Fuel VOC CO NOx PM10 PM25 SOx CH4 N2O CO2
DieselLNG
0 0
008 660
166 105
0007 0
0007 0
0024 0
0 0
010 009
3533 2857
28
4 RESULTS AND DISCUSSION
Total energy fossil energy criteria pollutant emissions and greenhouse gas emissions for 10 LFG-based pathways have been added to the GREET model WTW results are discussed below
41 ENERGY AND GREENHOUSE GAS EMISSION RATES
Total energy use per MMBtu of fuel consumed ldquoat the wheelrdquo is nearly flat for the four LFG-to-CNG-based pathways and roughly comparable to LNG from NA NG and petroleum diesel pathways The six LFG-to-LNG pathways are roughly comparable to each other and to the petroleum gasoline pathway CNG from NA NG has somewhat lower WTW energy use than other pathways because fossil NG processing consumes substantially less energy than either LFG-based processing or petroleum refining
Fossil energy use and GHG emissions present a very different picture Because vehicle operation uses renewable LFG-based fuel GREET results show a significant reduction in WTW fossil fuel use and GHGs for all LFG-based pathways The largest reductions are for LFG-to-CNG pathways using LFG-fueled on-site power generation With on-site vehicle fueling (ie no TampD for the produced CNG) fossil fuel use is completely eliminated
411 WTW Energy
Figure 14 compares well-to-pump (WTP) pump-to-wheels (PTW) and well-to-wheels (WTW) energy use for each LFG-based pathway with similar results for fossil NG (CNG from NA NG LNG from NA NG) gasoline from conventional petroleum and diesel from conventional petroleum Petroleum-based pathways are shown to permit comparison with cases in which the LFG-based fuel replaces gasoline in light-duty vehicles or diesel in heavy-duty vehicles Since LFG-based LNG could replace diesel in refuse haulers or transfer trucks the latter case is particularly interesting to operators of landfills or fleets of waste collection vehicles
As stated earlier WTW total energy use (the sum of WTP and PTW bars in Figure 14) depends largely on system efficiency Thus landfill gas-based CNG typically requires more total energy than fossil CNG or petroleum gasoline and LFG-based LNG requires more total energy than fossil LNG or petroleum diesel Because compression is more energy efficient than liquefaction LNG requires more total energy than CNG By contrast the choice of process fuel in NG processing or for TampD has little effect on WTW total energy use because the difference in energy efficiency is relatively small and total energy use is dominated by vehicle operation (PTW)
29
To
tal E
ner
gy
(Btu
mm
Btu
) 1400000
1200000
1000000
800000
600000
400000
200000
0
RC-1 RC-2 RC-3 RC-4 CNG CG RL-1 RL-2 RL-3 RL-4 RL-5 RL-6 LNG LSD
On-site Off-site On-site Off-site On-site Off-site LNG
Off-site Diesel
On-site Off-site LNG
Off-site Diesel
Distributed Generation Grid Electricity NA NG Distributed Generation Grid Electricity NA NG
Compressed Natural Gas Gasoline Liquefied Natural Gas Diesel
PTW
WTP
FIGURE 14 WTP PTW and WTW Energy Use for LFG-to-CNGLNG Pathways versus Fossil NG-to-CNGLNG Gasoline and Diesel Pathways
Table 7 displays WTW energy use by stage for LFG-to-CNG pathways Pathways using on-site power generation (with on-site or off-site vehicle fueling) and grid electricity are shown as are pathways for CNG from NA NG (with off-site fueling) and for petroleum gasoline Cells corresponding to subcategories are shown without shading while cells corresponding to subtotals for WTP and WTW energy are shaded gray As discussed earlier the life cycle for LFG-based fuels begins with fuel production hence there are no entries for feedstock recovery or feedstock transportation in Table 7 Fuel production and vehicle operation are the main energy-consuming stages Because production of CNG from LFG is on a much smaller scale and requires more cleanup than CNG from NA NG it uses 4ndash5 times the fuel production energy of CNG from NA NG Nonetheless production of CNG from LFG uses less energy than production of petroleum gasoline Adding its far greater energy expenditure for TampD (primarily for compression during vehicle fueling) CNG from LFG has comparable WTP and WTW energy use to petroleum gasoline (but not CNG from NA NG which it exceeds by 30ndash35)
By definition PTW (or vehicle operation) energy use has a value of 1000000 (1000000 fuel Btu per 1000000 Btu of energy use) for all pathways shown in Table 7 Since grid electricity is more energy efficient than on-site generation fuel production with grid electricity uses approximately 10 less energy
Table 8 contains a comparable breakdown of WTW energy use for LFG-to-LNG NA NG-to-LNG and petroleum diesel pathways Pathways using on-site power generation (with on-site or off-site vehicle fueling) and grid electricity are shown as are pathways using LFG-based LNG or petroleum diesel for fuel TampD Again feedstock recovery and transmission stages do not apply to LFG-based pathways fuel production is the major energy expenditure use of distributed power increases energy use and vehicle efficiencies are set to 1000000 Here however LNG from LFG uses approximately 50 more energy WTP than LNG from NA NG
30
TABLE 7 WTW Total Energy Use for LFG-to-CNG Pathways by Stage (BtuMM Btu produced)
Landfill Gas-Based Compressed Natural Gas CNG from
Electricity Source Distributed Generation US Average Generation Mix NA NG
TampD (Compression) On-Site Off-Site On-Site Off-Site Off-Site Gasoline
Feedstock Recovery 0 0 0 0 31398 42868 Feedstock Transmission 0 0 0 0 0 10660 Fuel Production 177935 169554 152132 152188 31965 190407 Fuel TampD 49819 73022 48605 73022 86287 6808 WTP 227754 242576 200737 225210 149651 250743 Vehicle Operation 1000000 1000000 1000000 1000000 1000000 1000000 WTW 1227754 1242576 1200737 1225210 1149651 1250743
TABLE 8 WTW Total Energy Use for LFG-to-LNG Pathways by Stage (BtuMM Btu produced)
Landfill Gas-Based Liquefied Natural Gas LNG from
Electricity Source Distributed Generation US Average Generation Mix NA NG
Off-Site Off-Site Off-Site Off-Site Off-Site TampD On-Site LNG Diesel On-Site LNG Diesel Diesel Diesel
Feedstock Recovery 0 0 0 0 0 0 31669 42835 Feedstock Transmission
0 0 0 0 0 0 961 10652
Fuel Production 294643 293469 293469 264590 263412 263412 142338 133918 Fuel TampD 0 6608 6137 0 6485 14104 6313 WTP 294643 300077 299607 264590 269897 189072 193718 Vehicle Operation 1000000 1000000 1000000 1000000 1000000 1000000 1000000 1000000 WTW 1294643 1300077 1299607 1264590 1269897 1269550 1189072 1193718
6137 269550
412 WTW Fossil Energy
Figure 15 compares WTP PTW and WTW fossil fuel use for each LFG-based pathway with CNG from NA NG LNG from NA NG gasoline from conventional petroleum and diesel from conventional petroleum Note that for landfill gas-based pathways vehicle operation (PTW) requires no fossil fuels since the LFG-based fuels are renewable Plus if landfill gas is the feedstock NG processing and liquefaction require little or no fossil fuel (depending on whether on-site generators or grid power are used for process needs) and only a small amount of fossil fuel is consumed during transportation and distribution depending on TampD method
Table 9 displays WTW fossil fuel use by stage for LFG-to-CNG pathways Pathways using on-site power generation (with on-site or off-site vehicle fueling) and grid electricity are shown as are pathways for CNG from NA NG and for petroleum gasoline As above PTW fossil fuel use (for vehicle operation) is assigned a value of 1000000 (1000000 Btu1000000 Btu) for the CNG-from-NA NG pathway For the petroleum gasoline pathway this value is reduced slightly to reflect the ethanol content of the gasoline fuel pool For renewable pathways fossil fuel use is zero
31
Fo
ssil
Fu
els
(Btu
mm
Btu
) 1400000
1200000
1000000
800000
600000
400000
200000
0
RC-1 RC-2 RC-3 RC-4 CNG
On-site Off-site On-site Off-site
Distributed Generation Grid Electricity NA NG
Compressed Natural Gas
PTW
WTP
CG
Gasoline
RL-1 RL-2 RL-3
On-s ite Off-site Off-s ite LNG Diesel
Distributed Generation
RL-4 RL-5 RL-6 LNG LSD
On-site Off-site Off-site LNG Diesel
Grid Electricity NA NG
Liquefied Natural Gas Diesel
FIGURE 15 WTW Fossil Fuel Use for LFG-Based Pathways versus NA NG and Petroleum Gasoline and Diesel Pathways
TABLE 9 WTW Fossil Fuel Use for LFG-to-CNG Pathways by Stage (BtuMM Btu produced)
Landfill Gas-Based Compressed Natural Gas
Electricity Source Distributed Generation US Average Generation Mix CNG from
NA NG
TampD (Compression) On-Site Off-Site On-Site Off-Site Off-Site Gasoline
Feedstock Recovery Feedstock Transmission Fuel Production Fuel TampD WTP Vehicle Operation WTW
0
0 0 0 0 0 0
0
0 0
62892 62892
0 62892
0
0 131549
42029 173577
0 173577
0
0 131597
62892 194489
0 194489
31290
0 31668 76376
139333 1000000 1139333
41363
10517 170067
6753 228700 979201
1207901
Depending on whether vehicle fueling is on-site or off-site LFG-based CNG using on-site or distributed power can consume no fossil fuel WTP or about half that consumed by CNG from NA NG On a WTW basis LFG-based CNG can consume 0ndash15 of the fossil fuel consumed by petroleum gasoline
Petroleum gasoline petroleum diesel and NA NG-to-LNG pathways consume similar amounts of fossil fuel Because of relatively higher processing efficiency CNG from NA NG uses somewhat less fossil fuel WTP than petroleum gasoline or LNG pathways
Table 10 provides comparable results for LFG-to-LNG pathways Again pathways using on-site power generation and grid electricity are shown as are pathways for LNG from NA NG and petroleum diesel and PTW fossil fuel use is assigned a value of 1000000 for all fossil
32
TABLE 10 WTW Fossil Fuel Use for LFG-to-LNG Pathways by Stage (BtuMM Btu produced)
Landfill Gas-Based Liquefied Natural Gas LNG from
Electricity Source Distributed Generation US Average Generation Mix NA NG
Off-Site Off-Site Off-Site Off-Site Off-Site TampD On-Site LNG Diesel On-Site LNG Diesel Diesel Diesel
Feedstock Recovery 0 0 0 0 0 0 31559 41332 Feedstock Transmission 0 0 0 0 0 0 950 10509 Fuel Production 0 0 0 227749 227772 227772 141306 132119 Fuel TampD 0 0 4820 0 933 4820 14077 6256 WTP 0 0 4820 227749 228705 232592 187892 190215 Vehicle Operation 0 0 0 0 0 0 1000000 1000000 WTW 0 0 4820 227749 228705 232592 1187892 1190215
pathways and zero for all renewable pathways As shown in the table if the electricity source for fuel production is grid electricity LFG-to-LNG pathways consume more fossil fuel than LFG-to-CNG pathways largely because of differences in process efficiency By contrast if the LFG pathways use on-site distributed power and vehicles using the produced fuel are refueled off-site the LFG-to-LNG pathways consume less fossil fuel than LFG-to-CNG pathways because CNG TampD (grid electricity use for NG compression by electric compressor) is more energy-intensive than LNG TampD (LFG-based LNG and diesel use for trucking) On a WTW basis LFG-based LNG can consume 0ndash19 of the fossil fuel consumed by petroleum diesel
413 WTW Greenhouse Gas Emissions
Figure 16 shows WTP PTW and WTW greenhouse gas emissions by pathway stage for LFG-based pathways as compared with petroleum gasoline or CNG (from NA NG) pathways for light-duty vehicles and petroleum diesel or LNG (from NA NG) pathways for heavy-duty vehicles Note that GHG emissions are expressed as grams carbon-dioxide equivalent (g CO2e) per unit energy produced Because of credits LFG-based pathways generate far fewer GHG emissions than petroleum gasoline or diesel pathways
As shown in Figure 16 WTW GHG emissions generally follow the same trend as WTW fossil fuel use (Figure 15) Gasoline- and diesel-fueled vehicles emit more GHGs than comparable CNG- or LNG-fueled vehicles Thus GHG emissions are substantially higher for petroleum-based pathways
Tables 11 and 13 provide detailed results for GHG emissions by pathway stage in terms of grams per million Btu while Tables 12 and 14 provide the results in terms of grams per MJ Note that GHG results shown here are substantially different from the fossil fuel results shown in Tables 9 and 10 In the GHG calculations GHGs are assumed to be captured and stored in the fuel during fuel production and released during vehicle operation Thus GHG emissions for vehicle operation (as shown in Table 11) tend to be considerably higher than the fossil fuel values shown in Table 9 the reverse is true for WTP fossil fuel use and GHG emissions
33
-80000
-60000
-40000
-20000
0
20000
40000
60000
80000
100000
RC-1 RC-2 RC-3 RC-4 CNG CG RL-1 RL-2 RL-3 RL-4 RL-5 RL-6 LNG LSD
On-site Off-site On-site Off-site On-site Off-site LNG
Off-site Diesel
On-site Off-site LNG
Off-site Diesel
Distributed Generation Grid Electricity NA NG Distributed Generation Grid Electricity NA NG
Compressed Natural Gas Gasoline Liquefied Natural Gas Diesel
GH
G E
mis
sio
ns
(g C
O2e
qm
mB
tu)
-76
-56
-36
-16
4
24
44
64
84
GH
G E
mis
sio
ns
(g C
O2eq
MJ)
PTW
WTP
WTW
FIGURE 16 WTW GHG Emissions for LFG-Based Pathways Compared with NA NG and Petroleum Gasoline and Diesel Pathways
TABLE 11 WTW GHG Emissions for LFG-to-CNG by Pathway Stage (g CO2eMM Btu produced)
Landfill Gas-Based Compressed Natural Gas CNG from
Electricity Source Distributed Generation US Average Generation Mix NA NG
TampD (Compression) On-Site Off-Site On-Site Off-Site Off-Site Gasoline
Feedstock Recovery 0 0 0 0 3758 3153 Feedstock Transmission 0 0 0 0 0 2635 Fuel Production -64988 -59119 -47328 -47551 4012 13532 Fuel TampD 3467 6460 4190 6460 9914 549 WTP -61521 -52659 -43138 -41091 17684 19869 Vehicle Operation 60484 60484 60484 60484 60484 77594 WTW -1036 7825 17346 19393 78169 97463
TABLE 12 WTW GHG Emissions for LFG-to-CNG by Pathway Stage (g CO2eMJ produced)
Landfill Gas-Based Compressed Natural Gas CNG from
Electricity Source Distributed Generation US Average Generation Mix NA NG
TampD (Compression) On-Site Off-Site On-Site Off-Site Off-Site Gasoline
Feedstock Recovery 00 00 00 00 36 30 Feedstock Transmission 00 00 00 00 00 25 Fuel Production -616 -560 -449 -451 38 128 Fuel TampD 33 61 40 61 94 05 WTP -583 -499 -409 -389 168 188 Vehicle Operation 573 573 573 573 573 735 WTW -10 74 164 184 741 924
34
TABLE 13 WTW GHG Emissions for LFG-to-LNG by Pathway Stage (g CO2eMM Btu produced)
Landfill Gas-Based Liquefied Natural Gas LNG from
Electricity Source Distributed Generation US Average Generation Mix NA NG
Off-Site Off-Site Off-Site Off-Site Off-Site TampD On-Site LNG Diesel On-Site LNG Diesel Diesel Diesel
Feedstock Recovery 0 0 0 0 0 0 3790 4706 Feedstock Transmission 0 0 0 0 0 0 250 2635 Fuel Production -57831 -61155 -61155 -37810 -41132 -41133 11727 10328 Fuel TampD 0 3331 3711 0 3413 3711 1980 506 WTP -57831 -57824 -57444 -37810 -37719 -37421 17748 18175 Vehicle Operation 60198 60198 60198 60198 60198 60198 60198 79719 WTW 2367 2374 2754 22388 22479 22777 77946 97894
TABLE 14 WTW GHG Emissions for LFG-to-LNG by Pathway Stage (g CO2eMJ produced)
Electricity Source
Landfill Gas-Based Liquefied Natural Gas
Distributed Generation US Average Generation Mix LNG from
NA NG
TampD On-Site Off-Site
LNG Off-Site Diesel On-Site
Off-Site LNG
Off-Site Diesel
Off-Site Diesel Diesel
Feedstock Recovery 00 00 00 00 00 00 36 45 Feedstock Transmission 00 00 00 00 00 00 02 25 Fuel Production -548 -580 -580 -358 -390 -390 111 98 Fuel TampD 00 32 35 00 32 35 19 05 WTP -548 -548 -544 -358 -358 -355 168 172 Vehicle Operation 571 571 571 571 571 571 571 756 WTW 22 22 26 212 213 216 739 928
42 ENERGY AND GREENHOUSE GAS EMISSIONS PER MILE TRAVELED
421 LFG-Based CNG
As shown in Figure 17 total energy use across all LFG-to-CNG pathways and for the petroleum gasoline pathway is nearly flat Total energy use is slightly higher for petroleum gasoline and slightly lower for LFG-to-CNG pathways with grid electricity Because of lower process energy use the NA NG-based CNG pathway consumes approximately 5ndash8 less energy per mile traveled than other pathways
However this relative advantage disappears when compared on the basis of either fossil fuel use or GHG emissions per mile traveled (Figures 18 and 19) Although approximately 6 better than petroleum gasoline CNG from NA NG consumes more fossil fuel and emits more GHGs than LFG-based CNG Because vehicle operation uses renewable LFG-based fuel GREET results show a reduction in WTW fossil fuel use and GHGs of 76ndash100 for LFG-based pathways as compared with fossil NA NG
35
10000
8000
6000
4000
2000
0
FIGURE 17 Energy Use for CNG from LFG or Fossil NA NG versus Petroleum Gasoline (Btumi)
RC-1 RC-2 RC-3 RC-4 CNG CG
On-site Off-s ite On-site Off-site
Distributed Generation Grid Electricity NA NG
Compressed Natural Gas Gasoline
PTW
WTP
To
tal
En
erg
y (
Btu
mi)
RC-1 RC-2 RC-3 RC-4 CNG CG
On-site Off-site On-site Off-site
Distributed Generation Grid Electricity NA NG
Compressed Natural Gas Gasoline
PTW
WTP
FIGURE 18 Fossil Fuel Use for CNG from LFG or Fossil NA NG versus Petroleum Gasoline (Btumi)
10000
Fo
ss
il F
ue
ls (
Btu
mi)
8000
6000
4000
2000
0
36
700
600
500
400
300
GH
G E
mis
sio
ns
(g C
O2eq
mi)
200
100
0
-100 RC-1 RC-2 RC-3 RC-4 CNG CG
On-site Off-s ite On-site Off-site
Distributed Generation Grid Electricity NA NG
Compressed Natural Gas Gasoline
-63
-13
38
88
138
188
238
288
338
388
438
GH
G E
mis
sio
ns
(g C
O2e
qk
m)
FIGURE 19 GHG Emissions for CNG from LFG or Fossil NA NG versus Petroleum Gasoline (g CO2emi or km)
422 LFG-Based LNG
With the exception of petroleum diesel energy-use-per-mile-traveled is relatively flat for the pathways examined As shown in Figure 20 total energy use is slightly higher for LFG-to-LNG pathways as compared with LNG from fossil NA NG Because of lower process energy use and more fuel efficient vehicle operation the petroleum diesel pathway consumes approximately 10ndash17 less energy per mile traveled than other pathways
However this relative advantage disappears when compared on the basis of either fossil fuel use or GHG emissions per mile traveled (Figures 21 and 22) Although still approximately 10 better than LNG from fossil NA NG diesel consumes far more fossil fuel than LFG-based pathways Because vehicle operation uses renewable LNG GREET results show a significant reduction in WTW fossil fuel use and GHGs for all LFG-based pathways Although LNG from fossil NA NG emits approximately 12 less GHGs than the petroleum diesel pathway (primarily due to cleaner vehicle operation) LFG-based pathways reduce GHGs by 72ndash97
37
RL-1 RL-2 RL-3 RL-4 RL-5 RL-6 LNG LSD
On-site Off-site LNG
Off-site Diesel
On-site Off-site LNG
Off-site Diesel
Distributed Generation Grid Electricity NA NG
Liquefied Natural Gas Diesel
PTW
WTP
FIGURE 20 Energy Use for LNG from LFG or Fossil NA NG versus Petroleum Diesel (Btumi)
To
tal E
ner
gy
(Btu
mi)
70000
60000
50000
40000
30000
20000
10000
0
Fo
ssil
Fu
els
(Btu
mi)
70000
60000
50000
40000
30000
20000
10000
0
PTW
WTP
RL-1 RL-2 RL-3 RL-4 RL-5 RL-6 LNG LSD
On-site Off-site Off-site On-site Off-site Off-site LNG Diesel LNG Diesel
Distributed Generation Grid Electricity NA NG
Liquefied Natural Gas Diesel
FIGURE 21 Fossil Fuel Use for LNG from LFG or Fossil NA NG versus Petroleum Diesel (Btumi)
38
GH
G E
mis
sio
ns
(g C
O2e
qm
i) 5000
4000
3000
2000
1000
0
RL-1 RL-2 RL-3 RL-4 RL-5 RL-6 LNG LSD
On-site Off-site LNG
Off-site Diesel
On-site Off-site LNG
Off-site Diesel
Distributed Generation Grid Electricity NA NG
Liquefied Natural Gas Diesel
3000
2500
2000
1500
1000
500
0
GH
G E
mis
sio
ns
(g C
O2e
qk
m)
FIGURE 22 GHG Emissions for LNG from LFG or Fossil NA NG versus Petroleum Diesel (g CO2emi or km)
43 BALANCING ENERGY EFFICIENCY WITH GREENHOUSE GAS EMISSIONS
Grid electricity is almost always more energy efficient than LFG-fueled generators since the formerrsquos fuel source is more energy dense and power plants can achieve better process integration and on-line operation at larger scale Thus LFG-based pathways are often less energy efficient than petroleum and NA NG-based pathways However because LFG-based CNG and LNG are renewable fuels total energy use is not a relevant metric for comparison with fossil fuels By definition renewable energy is not ldquoconsumedrdquo Within the timeframe of lifecycle analysis (eg 100 years) the supply of renewable energy is infinite and there is no detriment to tapping larger quantities Thus renewable energy ldquouserdquo is irrelevant and a renewable pathway is preferable to a non-renewable one on the basis of total energy use13
On the other hand we can compare the fossil fuel use and emissions of renewable and non-renewable fuel pathways because the relevant systems can be well defined and the units of analysis can be properly measured As a result although comparisons of total energy fossil energy and greenhouse gas emissions are presented above the reader is urged to focus on fossil energy and greenhouse gas emissions Those are the key comparisons between two fundamentally different types of fuel pathways
13 Among renewable pathways however it can be argued that lower energy pathways are preferable (all other things equal) since more work can be produced for a given quantity of energy thereby increasing the benefit to society (eg by increasing displacement of imported oil)
39
44 CO-PRODUCT AND RENEWABLE ENERGY CREDITS
In addition to generating excess power to the grid (ie co-product electricity) LFG-based pathways may produce elemental sulfur ash and carbon dioxide (CO2) as well as renewable energy credits14 Since ash would have been produced from the flare in the reference case (see Figure 6) it is not considered a by-product of LFG-based pathways Similarly capturing sulfur upstream (instead of at the flare) is not a net change Thus CO2 is the major potential co-product Although not a co-product per se renewable energy credits are an important side benefit since they can provide significant financial incentives to LFG fuel projects
441 Carbon Dioxide
Each year some 50 million short tons of CO2 for chemical or mechanical use are produced from US wells Production from industrial processes accounts for another 15 million tons The vast majority (35 million short tons) is used for enhanced oil recovery (EOR) mostly via pipeline from large supplies While by-product CO2 produced from LFG conversion to natural gas could serve nearby EOR needs or supplement pipeline supplies geography and scale are likely to limit its market potential
Similarly CO2 produced from LFG is unlikely to penetrate the beer or carbonated soft drink market since ample quantities of ldquofood-graderdquo CO2 are available from natural or other sources including ethanol processing So despite the ability of some LFG-to-NG processors to certify their CO2 co-product to food-grade standards the beverage market is unlikely to become a major customer
On the other hand dry ice (solid CO2) urea manufacture and pest control are promising options for LFG-based CO2 co-product Dry ice has long been the refrigerant of choice for packaging and small-lot transport of perishables that must remain frozen until use However since dry ice requires further processing a secondary deposition process would be needed at LFG sites to transform CO2 into blocks and sheets suitable for packaging A more promising market is in chemical manufacturing where CO2 has long played multiple roles as raw material reactant pressurizing agent and coolant Production of various carbonates polycarbonate resins and urea rely on CO2 as a feedstock The urea market is estimated to demand nearly 4 million tonsyr of CO2 which should expand if selective catalytic reduction of NOx in diesel engine exhaust becomes the emission control technology of choice for heavy-duty trucks
Outside California pest fumigation (especially in large-scale grain storage) may be a good logistical match for co-product CO2 Historically ethyl di-bromide (EDB) and methyl bromide (MB) were the main fumigants used in grain storage However EPA banned EDB in 1984 (as a suspected carcinogen) and ordered a phaseout of MB in 2005 (as an ozone-depleting chemical) CO2 and nitrogen are potential alternatives to MB The main advantage of CO2 is that it is toxic to insects and can tolerate up to 3 oxygen in controlled atmospheres which nitrogen cannot A disadvantage is the porosity of most storage facilities which can lose their CO2-rich
14 Since all NG produced from LFG is assumed to be used as a vehicle fuel (with either on-site or off-site fueling) GREET pathways have no NG co-product
40
fumigation atmospheres before the approximately nine days required for full effectiveness If this latter problem can be resolved CO2 application to elevator storage of spring and winter wheat could represent a market for up to 20000 tyr of CO2
Additional uses for CO2 (eg as a foam blowing agent in polyurethane and polystyrene production an aerosol propellant a cleaning agent at paper pulp mills or as a natural plant nutrient in greenhouses) hold limited promise generally circumscribed by geographic proximities and other competing compounds Because of the above-noted uncertainties and the likelihood that market success will be very site-specific co-product CO2 is not represented in the LFG-based pathways developed for this study
442 Renewable Energy Credits and Other Incentives
Thirty-five states currently require electric utilities to generate a minimum share of the power sold within their borders from renewable or alternative energy sources by a given date (Pew 2009) Called ldquoRenewable Portfolio Standardsrdquo (RPSs) most of these mandates specifically include landfill gas as an eligible energy source (Pew 2009 EPA 2009a) Although RPSs focus on replacing fossil with renewable fuels for power generation the concept is likely to be expanded to natural gas in the form of low carbon fuel standards (like those already adopted in California) or greenhouse gas allowances (like those being considered under various carbon cap and trade proposals) Already a few states (eg Montana Michigan and Kansas) frame their RPSs in terms of energy (as opposed to electricity) consumption LFG pathways to vehicle-fuel or pipeline-quality gas may qualify under these latter standards
Several states have adopted or are considering the adoption of regulations permitting utilities to buy sell or trade Renewable Energy Certificates (RECs) in order to comply with RPSs or other mandates RECs are tradable commodities that represent proof that a given amount of electricity was generated from an eligible renewable energy resource In states with a REC program ldquogreenrdquo energy providers (such as producers of LFG-based electricity that is exported to the grid or of pipeline quality gas that is used to generate renewable electricity) are credited with one REC for every 1000 kWh (1 MWh) of electricity produced A certifying agency gives each REC a unique identification number to make sure it does not get double-counted The green energy is fed into the electric grid and the accompanying REC can be sold traded or bartered on the open market The owner of the REC can then claim to have purchased renewable energy even though the energy associated with the REC is sold separately and used by another party (EPA 2009a)
Various federal incentives are available to support LFG projects These include tax credits and funding sources like the Renewable Electricity Production Tax Credit the Business Energy Investment Tax Credit and Clean Renewable Energy Bonds (authorized under Sections 45 48 and 54 respectively of the US Tax Code) Qualified Energy Conservation Bonds and the Renewable Energy Production Incentive (created in 1992 and reauthorized to extend through 2026) Other incentives include Renewable Energy Grants Energy Efficiency and Conservation Block Grants and Innovative Technology loan guarantees Historically most of these incentives have been limited to generating power from LFG and exporting it to the grid Now however a number of them have been expanded to cover facilities ldquofunctionally related and subordinate to the generation facility itselfrdquo (which could include gas cleanup compression and pipeline injection) and funding has been supplemented with appropriations from the American Recovery and Reinvestment Act (ARRA)
41
The waste-to-energy industry is poised for growth as new markets for their ldquogreen powerrdquo emerge and new funding sources provide the wherewithal to accelerate LFG-based fuel development According to David Wentworth president of Renewable Solutions Group ldquoLandfill gas to electricity projects have flourished over the past several decades primarily as a means to capture federal tax benefits but they produce limited environmental benefits when compared to high Btu applicationshellipThe next evolution is landfill gas to pipeline-quality gas projects which can be used to heat homes power natural gas vehicles and illuminate city streets all while providing financial and environmental benefitsrdquo (Pomerantz 2009)
45 CRITERIA POLLUTANT EMISSIONS
Detailed well-to-wheel estimates of criteria pollutant emissions are provided in Appendix B For criteria pollutants like carbon monoxide (CO) emissions are dominated by vehicle operation since relatively little of the pollutant is emitted from fuel production For others (eg NOx PM and SOx) emissions are pathway dependent NOx and PM emissions vary with grid electricity use because the emission factors of the US average power mix (see Table 4) are much higher than those of on-site power generators which in turn are higher than those of LFG flares WTW SOx emissions are virtually eliminated if no grid electricity is used in the pathway because all sulfur emissions are balanced with the credit from the avoided LFG flaring
42
5 CONCLUSIONS
This study characterized landfill gas (LFG) resources and the technologies to convert what until recently was considered a waste product into a renewable fuel for vehicles By using this information several LFG-based pathways were added to the GREET model Results show
bull As compared with North American natural gas (NA NG) or petroleum-based fuel LFG-based fuels require roughly the same quantity of energy for their production transport and utilization in vehicles However with LFG-based fuels much of this energy is considered renewable since it is from organic sources and is replenished naturally
bull LFG-based fuels can save significant amounts of fossil fuel The size of such savings however depends on the amount of electricity used in the pathway
bull LFG-based fuels can dramatically reduce greenhouse gas (GHG) emissions particularly if process energy is supplied by on-site power generators using renewable LFG If process energy is supplied by grid electricity reductions in GHG emissions depend on the US power generation mix
bull WTW criteria pollutant emissions depend on both the amount of electricity used and differences in emission factors between relevant pathway components and the base or reference case (eg CNGLNG versus gasolinediesel vehicles LFG flares versus IC engines LFG gensets versus the average US power generation mix)
Because of limited time and resources this study could not address several issues and concerns Chief among them are emissions of toxics and hazardous substances from landfills These substances are present in the current waste stream and we assume that they are successfully captured and destroyed in the thermal oxidizer (flare) However some argue that LFG capture rates are less than assumed destruction of NMOC and other pollutants is incomplete (contributing to additional emissions) and that some hazardous materials are not adequately sequestered within the landfill These issues are extremely important and merit a detailed examination That examination is beyond the scope of this analysis
This analysis also assumes that conventional waste management strategies will continue to be used and to produce landfill gas comprising some 45ndash50 methane and 35ndash40 CO2 (see Table 2) As noted above LFG capture is uncertain and may change with new technologies like bioreactors or source-separation coupled with anaerobic digestion of organic materials These technologies are extremely promising since they speed waste stabilization and therefore the economic recovery of product gas Beyond this however they may also increase LFG capture rates and methane concentrations in the LFG feed Although extremely important and significant these issues lie outside the system boundary and thus could not be addressed in this analysis
Finally while this study assumes a robust market for LFG-based fuel market issues are beyond the scope of this analysis Because there are many renewable sources for electricity but few for natural gas renewable natural gas may be an increasingly attractive option for entities
43
required to implement low carbon fuel standards and renewable portfolio standards However recent historically low spark spreads between natural gas and electricity prices have given way to low natural gas prices and high spark spreads As a result projects to produce pipeline quality natural gas are less viable in todayrsquos economic climate than they were a couple of years ago However the price differential between natural gas for stationary applications versus competing motor fuels remains significant
44
6 REFERENCES
Acrion Technologies Inc 2009 Acrionrsquos CO2 Wash Process for Contaminants Removal from Landfill Gas accessed Aug 2009 at httpwwwacrioncomCO2washhtm
Air Liquide 2009 Biogas Recovery System accessed Sept 2009 at httpwwwdtaairliquidecomfileotherelementpjplaquette-biogaz57164pdf
ARCADIS Geraghty amp Miller Inc 2002 ldquoUpdate Heavy-Duty Engine Emission Conversion Factors for MOBILE6 Analysis of BSFCs and Calculation of Heavy-Duty Engine Emission Conversion Factorsrdquo EPA420-R-02-005 January 2002
Barnitt R and K Chandler 2006 New York City Transit Hybrid and CNG Transit Buses Interim Evaluation Results National Renewable Energy Laboratory Report NRELTP-540-38843 November
Brendeng E and J Hetland 2004 ldquoState of the Art in Liquefaction Technologies for Natural Gas NATO Science Series Series II Mathematics Physics and Chemistry edited by J Hetland and T Gochitashvili Vol 149
Brinkman N M Wang T Weber and T Darlington 2005 Well-to-Wheels Analysis of Advanced FuelVehicle Systems mdash A North American Study of Energy Use Greenhouse Gas Emissions and Criteria Pollutant Emissions Argonne National Laboratory Argonne IL
California Air Resources Board (CARB) 2009 ARB Adopts Landfill Measure to Reduce Potent Global Warming Gas News Release California Environmental Protection Agency June 25
Chandler K P Norton and N Clark 2001 Waste Managementrsquos LNG Truck Fleet Final Results National Renewable Energy Laboratory Report NRELBR-540-29073 January
Chandler K P Norton and N Clark 2000 Dallas Area Rapid Transitrsquos (DART) LNG Bus Fleet Final Results National Renewable Energy Laboratory Report NRELBR-540-28739 November
Chandler K E Eberts and M Melendez 2006 Washington Metropolitan Area Transit Authority Compressed Natural Gas Transit Bus Evaluation National Renewable Energy Laboratory Report NRELTP-540-37626 April
Cook W W Brown L Siwajek W Sanders and I Botgros 1998 Greenhouse Gas Reduction by Recovery and Utilization of Landfill Methane and CO2 Technical and Market Feasibility Study Boului Landfill Bucharest Romania US DOE Assistant Secretary for Energy Efficiency and Renewable Energy Report DOEEE35034ndashT1 Washington DC
Cook W M Neyman L Siwajek and W Brown 2002 Landfill Gas to LNG and LCO2 2001 Annual Report Brookhaven National Laboratory Upton NY
45
Cook W W Brown L Siwajek M Neyman T Reppert and B Smackey 2005 Production of Liquid Methane Truck Fuel from Landfill Gas Final Report Brookhaven National Laboratory Upton NY
Cummins-Westport Inc (CWI) 2009 ISL G (North America) accessed Sept 2009 at httpwwwcumminswestportcomproductsislgphp
Datta AK and PK Sen 2006 ldquoOptimization of Membrane Unit for Removing Carbon Dioxide from Natural Gasrdquo Journal of Membrane Science 283(1ndash2)291ndash300
Dunn S 2000 ldquoMicropower The Next Electrical Erardquo Worldwatch Paper 151 Worldwatch Institute Washington DC
Electric Power Research Institute (EPRI) 2004 Distributed Energy Resources Emissions Survey and Technology Characterization Electricity Innovation Institute Palo Alto CA
Energy Information Administration (EIA) 2008 US Crude Oil Natural Gas and Natural Gas Liquids Reserves 2007 Annual Report accessed Aug 2009 at httpwwweiadoegov puboil_gasnatural_gasdata_publicationscrude_oil_natural_gas_reserveshistorical2007 cr2007html
EIA 2009a Annual Energy Review 2008 Report No DOEEIA-0384(2008) accessed Aug 2009 at httpwwweiadoegovemeuaercontentshtml
EIA 2009b Natural Gas Year-In-Review 2008 accessed Aug 2009 at httpwwweiadoegov puboil_gasnatural_gasfeature_articles2009ngyir2008ngyir2008html
Finn AJ GL Johnson and TR Tomlinson 1999 ldquoDevelopments in Natural Gas Liquefactionrdquo in Hydrocarbon Processing pp 47ndash59
Franklin Associates a Division of ERG Review of State Solid Waste Management Websites cited in US EPA 2008 Municipal Solid Waste in the United States Facts and Figures for 2007 EPAndash530ndashRndash08ndash010 Office of Solid Waste Washington DC
Gas Technology Institute (GTI) 2007 Liquefied Natural Gas from Landfill Gas Demonstration Grant California Integrated Waste Management Board
Goldstein L B Hedman D Knowles S Freedman R Woods and T Schweizer 2003 Gas-Fired Distributed Energy Resource Technology Characterizations National Renewable Energy Laboratory Report NRELTPndash620ndash34783 Golden CO
Godlove C 2010 Landfill Gas Successes and Challenges in an Increasingly Complex Market SWANArsquos 33rd Annual Landfill Gas Symposium San Diego March 10
Johansson N 2008 Production of Liquid Biogas LBG with Cryogenic and Conventional Upgrading Technology mdash Description of Systems and Evaluations of Energy Balances MS Thesis Lunds University Sweden
46
Kikkawa Y and I Aoki 1999 Gas to Liquid of 21st Century AIChE Spring National Meeting Houston p 48 March 14ndash18
Kikkawa Y and N Nozawa 1999 Optimizing Liquefied Natural Gas Power Chain AIChE Spring National Meeting Houston March 14ndash18
Kikkawa Y and YN Liu 2001 Zero CO2 Emission for LNG Power Chain 13th International Conference and Exhibition on Liquefied Natural Gas PS5ndash3
Kohl A and R Nielsen 1997 Gas Purification 5th ed Gulf Publishing Houston
Lear J and J Burdelski 2009 US Department of EnergyBrookhaven National Laboratory Biomethane Analysis Draft Report
Ludwig V 2009 Landfill Gas to Energy Webcast (transcript and slides) USEPA Feb 18 accessed Aug 2009 at httpwwwepagovcleanenergyenergy-programsstate-andshylocalwebcasthtmlfeb5
Persson M O Joumlnsson and A Wellinger 2006 Biogas Upgrading to Vehicle Fuel Standards and Grid Injection IEA Bioenergy Task 37 ndash Energy from Biogas and Landfill Gas accessed June 28 2010 at httpwwwiea-biogasnetDokumenteupgrading_report_finalpdf
Pew Center on Global Climate Change 2009 Renewable and Alternative Energy Portfolio Standards July 29 accessed Aug 2009 at httpwwwpewclimateorgwhat_s_being_done in_the_statesrpscfm
Pickens TB Pickens Plan undated accessed Sept 2009 at httpwwwpickensplancom theplan
Pomerantz M 2009 ldquoTapping the Trashrdquo Waste Age April 1 accessed Aug 2009 at httpwasteagecomLandfill_Managementlandfill-methane-pipeline-quality-gas-200904
Pomerantz M and L Turcotte 2004 Production of Pipeline Gas from Landfill Gas in Canada Wastecon 2004 Sept 21ndash23 Phoenix
Prometheus Energy Company 2007 Liquefied Natural Gas from Landfill Gas Demonstration Grant California Integrated Waste Management Board
Remeljej CW and AF Hoadley 2006 ldquoAn Exergy Analysis of Small-Scale Liquefied Natural Gas (LNG) Liquefaction Processesrdquo Energy 312005ndash2019
SCS Engineers 2007 Current MSW Industry Position and State of the Practice on Methane Destruction Efficiency in Flares Turbines and Engines prepared for Solid Waste Industry for Climate Solutions July
Segeler CG 1965 Gas Engineers Handbook Industrial Press
47
Sperling Hansen Associates 2007 Highland Valley Centre for Sustainable Waste Management ndash Landfill Gas Utilization Options SHAndashPRJ06014 accessed July 2009 at httpa100govbccaappsdataepichtmldeployepic_project_doc_index_263html
Spillman R 1995 ldquoEconomics of Gas Separation Membrane Processrdquo in Membrane Separations Technology Principles and Applications 3rd Edition (edited by RD Noble SA Stern) Elsevier Science
Sullivan P 2010 The Importance of Landfill Gas Capture and Utilization in the US Council for Sustainable Use of Resources and Earth Engineering Center Columbia University April accessed May 2010 at httpwwwscsengineerscomPapersSullivan_Importance_of_LFG_ Capture_and_Utilization_in_the_USpdf
Syed M G Soreanu P Falletta and M Beland 2006 ldquoRemoval of Hydrogen Sulfide from Gas Streams Using Biological Processes A Reviewrdquo Canadian Biosystems Engineering 4821ndash214
TRC Environmental Corp 2008 Emissions Testing of the Ward Hill Neck Landfill Enclosed Landfill Gas Flare and Landfill Gas Engine prepared for Covanta Haverhill Inc Windsor CT TRC project no 158673-0000-00000 July 21
US Environmental Protection Agency (EPA) 1995 Compilation of Air Pollutant Emission Factors Vol 1 Stationary Point and Area Sources APndash42 5th Edition Research Triangle Park NC
US EPA 2008 Municipal Solid Waste in the United States Facts and Figures for 2007 EPAndash 530ndashRndash08ndash010 Office of Solid Waste Washington DC
US EPA 2010a Energy Projects and Candidate Landfills as of April 2010 accessed May 2010 at httpwwwepagovlmopprojects-candidatesindexhtmlmap-area
US EPA 2010b Engine Certification Data accessed May 2010 at httpwwwepagovoms certdatahtmlargeng
US EPA 2009a Renewable Portfolio Standards An Effective Policy to Support Clean Energy Supply April accessed Aug 2009 at httpwwwepagovchpstate-policyrenewable_fshtml
US EPA Office of Air Quality 2000 Economic Impact Analysis Municipal Solid Waste Landfills EPA-452D-00-005 Sept accessed Sept 2009 at httpyosemiteepagoveeepa riansfvwANA2000-37pdf$fileA2000-37pdf
US EPA Natl Center for Environmental Economics 1996 Landfill Rules Tightened from I Fisher ldquoEPA Rules Require Curbs on Landfillsrsquo Gas Emissionsrdquo New York Times March 3 accessed Sept 2009 at httpyosemiteepagoveeepalibnwletnsf434d5673ac53b1548525 64cd007a8a0d6422179d25e7e87e852564d800092f41OpenDocument
48
University of Florida and University of Central Florida 2008 Florida Bioreactor Landfill Demonstration Project Executive Summary July 1 accessed Aug 2009 at httpwwwbioreactororg
Vink KJ and RK Nagelvoort 1998 Comparison of Baseload Liquefaction Processes in Proc 12th Intl Conference and Exhibition on Liquefied Natural Gas Perth Australia p 36 May 4ndash7
Wang M D He A Finizza T Weber M Miller D Masten G Skellenger and JP Wallace 2001 Well-to-Wheel Energy Use and Greenhouse Gas Emissions of Advanced FuelVehicle Systems mdash North American Analysis General Motors Corporation Argonne National Laboratory BP ExxonMobil Shell accessed July 2009 at httpwwwtransportationanlgov pdfsTA163pdf
Watt GM 2000 Natural Gas Vehicle Transit Bus Fleets The Current International Experience 7th Intl Conference and Exhibition on Natural Gas Vehicles (NGV 2000) Oct 17ndash19 Yokohama Japan
49
APPENDIX A SMALL-SCALE NATURAL GAS LIQUEFACTION
Liquefied natural gas (LNG) is produced by cooling natural gas (NG) to its boiling point (-260degF) at atmospheric pressure A number of different processes (or cycles) can be used the chief types being cascade mixed refrigerant and expander Schematics of the processes are presented in Figure A-1
(a) Cascade Cycle
(b) Mixed Refrigerant Cycle
(c) Expander Cycle
FIGURE A-1 Schematics of NG Liquefaction Processes
The cascade cycle generally uses a different pure refrigerant (propane ethane [or ethylene] or methane) for each of its three stages The major advantage of the cycle is its high efficiency and simplicity of design disadvantages include relatively high capital cost due to the number of refrigerant compression cycles
50
The mixed refrigerant cycle uses a single mixed refrigerant instead of multiple pure refrigerants as in the cascade cycle The refrigerant is usually a mixture of nitrogen methane ethane propane butane and pentane Since it requires only one refrigerant compression cycle its capital cost is relatively low Theoretically a single mixed refrigerant (SMR) cycle should provide sufficient refrigeration to cool NG to its boiling point at atmospheric pressure In practice however a pre-cooling step is needed since the thermo-physical properties of the mixed refrigerant and machinery reduce efficiency Thus the NG feed is usually pre-cooled by a three-stage propane refrigeration cycle (C3MR) or by a separate mixed refrigeration cycle (dual mixed refrigerant (DMR) cycle)
The expander cycle uses an expansion turbine to expand the cycle gas in a near isentropic manner at an appropriate temperature thereby reducing its temperature The expansion generates useful work that is recovered through a booster compressor A major disadvantage of this cycle is its relatively high power consumption compared to either the cascade or MR cycles An expander cycle is however best suited to smaller plants with shorter operating periods because of its relatively rapid and simple start-up and shutdown
NG liquefaction efficiency can be defined in terms of process efficiency or train efficiency depending on the system boundary Process efficiency obtained from specific power includes the power consumed by pre-cooling and liquefaction Train efficiency is the total lower heating value (LHV) of valuable products (LNG and condensate) divided by the LHV of the feed (including energy for pre-cooling liquefaction power generation and utilities) Process efficiencies are documented in many published sources Train efficiencies are less readily available Values and sources of process and trail efficiencies are summarized in Table A-1
TABLE A-1 Process and Train Efficiencies of Major NG Liquefaction Processes
C3MR Cascade DMR SMR Expander
Specific Power (kWhton LNG) Process Efficiency () Vink and Nagelvoort 1998 979 976 Kikkawa and Nozawa 1999 Brendeng and Hetland 2004
976 966
Finn et al 1999 976 979
978
979
975
975
974
973
965 Kikkawa and Liu 2001 980 Remeljej and Hoadley 2006
Average 978 974 978 975 975 969
Train Efficiency () Vink and Nagelvoort 1998 Kikkawa and Aoki 1999 Kikkawa and Liu 2001
907 90
890 905 894 882
51
According to Brendeng and Hetland (2004) nearly 80 of large-scale liquefaction units and almost 90 of global LNG-production capacity currently use C3MR However it is not at all clear that C3MR is the best option for LFG-based liquefaction Most of the sources reviewed for this effort indicate that SMR and expander cycles are good candidates for small-scale liquefaction Moreover for actual LFG-to-LNG projects two current projects (Bowerman and Altamont) use SMR while a pilot project (Burlington) used a nitrogen expander
GREETrsquos default efficiency for large-scale liquefaction is 91 On average SMR and expander cycles respectively take 14 and 40 more specific power than C3MR Assuming that C3MR represents large-scale liquefiers while SMR and expander cycles represent small-scale liquefiers and that the ratio between processing and train efficiencies remains constant we estimate the average train efficiencies of SMR and expander cycles to be 899 and 878 respectively These values compare well to the train efficiencies reported by Vink and Nagelvoort (1998) Using these data GREETrsquos small-scale liquefaction efficiency is set to 89
52
APPENDIX B CRITERIA POLLUTANTS
Estimates of well-to-wheel (WTW) well-to-pump (WTP) and pump-to-wheel (PTW) criteria pollutant emissions for landfill gas (LFG) and fossil fuel-based pathways are shown in Figures B-1 through B-5 When PTW results are negative (eg CO emissions for pathways using grid electricity or NOx emissions for pathways using on-site power generation) the sum of WTP and PTW emissions is drawn as a darker shade of rose and is shown superimposed over its two components
As shown in Figures B-1 B-2 and B-4 LFG-based pathways to CNG use in light-duty vehicles (LDVs) produce WTW CO NOx and PM25 emissions comparable to or less than those of fossil-based pathways to CNG NA NG or petroleum gasoline For heavy-duty vehicles (HDVs) WTW NOx and CO emissions of LFG-based LNG pathways are comparable to those of fossil-based pathways to NA NG or petroleum diesel Because the US generation mix is heavily weighted toward coal displacing grid electricity with on-site power generation virtually eliminates SOx emissions (except for compression at the refueling station which continues to use grid electricity) and results in major reductions in NOx and PM emissions Since most on-site generators have lower NOx PM and SOx PTW emissions are shown as a credit or negative contribution to WTW results in Figures B-1 through B-5 For LNG-fueled vehicles WTW PM10
and SOx emissions are virtually zero
1400
1210
FIGURE B-1 CO Emissions for LFG-Based Pathways Compared with NA NG and Petroleum Gasoline and Diesel Pathways
RC-1 RC-2 RC-3 RC-4 CNG CG RL-1 RL-2 RL-3 RL-4 RL-5 RL-6 LNG LSD
On-site Off-site On-site Off-site On-site Off-site LNG
Off-site Diesel
On-site Off-site LNG
Off-site Diesel
Distributed Generation Grid Electricity NA NG Distributed Generation Grid Electricity NA NG
Compressed Natural Gas Gasoline Liquefied Natural Gas Diesel
PTW
WTP
WTW
1200
1010 1000
CO
(g
mm
Btu
)
0810 800
0610 600
0410 400
200 0210
0 0010
-200 -0190
CO
(g
MJ)
80
100
0081
25
30
53
FIGURE B-2 NOx Emissions for LFG-Based Pathways Compared with NA NG and Petroleum Gasoline and Diesel Pathways
RC-1 RC-2 RC-3 RC-4 CNG CG RL-1 RL-2 RL-3 RL-4 RL-5 RL-6 LNG LSD
On-site Off-site On-site Off-site On-site Off-site LNG
Off-site Diesel
On-site Off-site LNG
Off-site Diesel
Distributed Generation Grid Electricity NA NG Distributed Generation Grid Electricity NA NG
Compressed Natural Gas Gasoline Liquefied Natural Gas Diesel
PTW
WTP
WTW
NO
x (
gm
mB
tu) 0061
60
0041 40
20 0021
0 0001
-20 -0019
10
15
20
RC-1 RC-2 RC-3 RC-4 CNG CG RL-1 RL-2 RL-3 RL-4 RL-5 RL-6 LNG LSD
On-site Off-site On-site Off-site On-site Off-site LNG
Off-site Diesel
On-site Off-site LNG
Off-site Diesel
Distributed Generation Grid Electricity NA NG Distributed Generation Grid Electricity NA NG
Compressed Natural Gas Gasoline Liquefied Natural Gas Diesel
PM
10 (
gm
mB
tu)
PTW
WTP
WTW
FIGURE B-3 PM10 Emissions for LFG-Based Pathways Compared with NA NG and Petroleum Gasoline and Diesel Pathways
0005 5
0000 0
-5 -0005
PM
10 (
gM
J)
NO
x (
gM
J)
0010
0015
0020
0025
60
54
9 P
M2
5 (
gm
mB
tu)
PTW 0007
7 WTP
WTW 0005 5
0003 3
0001 1
-1 -0001
SO
x (g
MJ)
P
M2
5 (
gM
J)
-3
-5
RC-1 RC-2 RC-3 RC-4 CNG
On-site Off-site On-site Off-site
Distributed Generation Grid Electricity NA NG
Compressed Natural Gas
CG
Gasoline
RL-1 RL-2 RL-3
On-site Off-site Off-site LNG Diesel
Distributed Generation
-0003
-0005
RL-4 RL-5 RL-6 LNG LSD
On-site Off-site Off-site LNG Diesel
Grid Electricity NA NG
Liquefied Natural Gas Diesel
FIGURE B-4 PM25 Emissions for LFG-Based Pathways Compared with NA NG and Petroleum Gasoline and Diesel Pathways
RC-1 RC-2 RC-3 RC-4 CNG CG RL-1 RL-2 RL-3 RL-4 RL-5 RL-6 LNG LSD
On-site Off-site On-site Off-site On-site Off-site LNG
Off-site Diesel
On-site Off-site LNG
Off-site Diesel
Distributed Generation Grid Electricity NA NG Distributed Generation Grid Electricity NA NG
Compressed Natural Gas Gasoline Liquefied Natural Gas Diesel
PTW
WTP
WTW 0041
0031
0021
0011
0001
SO
x (g
mm
Btu
)
50
40
30
20
10
0
-10 -0009
FIGURE B-5 SOx Emissions for LFG-Based Pathways Compared with NA NG and Petroleum Gasoline and Diesel Pathways
0051
Argonne National Laboratory is a US Department of Energy laboratory managed by UChicago Argonne LLC
Energy Systems Division Argonne National Laboratory9700 South Cass Avenue Bldg 362Argonne IL 60439-4815
wwwanlgov
- Cover
- Disclaimer
- Title Page
- Contents
- Acknowledgments
- Executive Summary
- 1 Introduction
-
- 11 Background
- 12 US Natural Gas Resources
- 13 Natural Gas as a Vehicle Fuel
- 14 Renewable Natural Gas and GHG Emissions
- 15 Fuel Cycle Analysis
- 16 Scope
-
- 2 Landfill Gas
-
- 21 Resource Base
- 22 Resource Development
- 23 Additions to the Resource Base
- 24 Landfill Gas Composition
-
- 3 Fuel Cycle Analysis of Landfill-Gas Based Pathways
-
- 31 LFG Reference Case
-
- 311 Flaring versus Venting Landfill Gas
- 312 Carbon Fate in LFG Fossil NG and Petroleum Fuel Cycles
-
- 32 Overview of LFG-to CNGLNG Fuel Cycle
- 33 Gas Collection
- 34 Natural Gas Production
-
- 341 Pre-Purification
- 342 CO2 Removal
- 343 Process Efficiency
- 344 Energy Use Accounting
-
- 35 On-Site Power Generation
-
- 351 Technologies
- 352 Criteria Pollutant Emissions
-
- 36 Liquefaction
- 37 Transportationi and Distribution
-
- 371 Transportation and Distribution of CNG
- 372 Transportation and Distribution of LNG
-
- 38 Vehicle Operation
-
- 4 Results and Discussioni
-
- 41 Energy and Greenhouse Gas Emission Rates
-
- 411 WTW Energy
- 412 WTW Fossil Energy
- 413 WTW Greenhouse Gas Emissions
-
- 42 Energy and Greenhouse Gas Emissioins per Mile Traveled
-
- 421 LFG-Based CNG
- 422 LFG-Based LNG
-
- 43 Balancing Energy Efficiency with Greenhouse Gas Emissions
- 44 Co-Product and Renewable Energy Credits
-
- 441 Carbon Dioxide
- 442 Renewable Energy Credits and Other Incentives
-
- 45 Criteria Pollutant Emissioins
-
- 5 Conclusions
- 6 References
- Appendix A Small-Scale Natural Gas Liquefaction
- Appendix B Criteria Pollutants
-
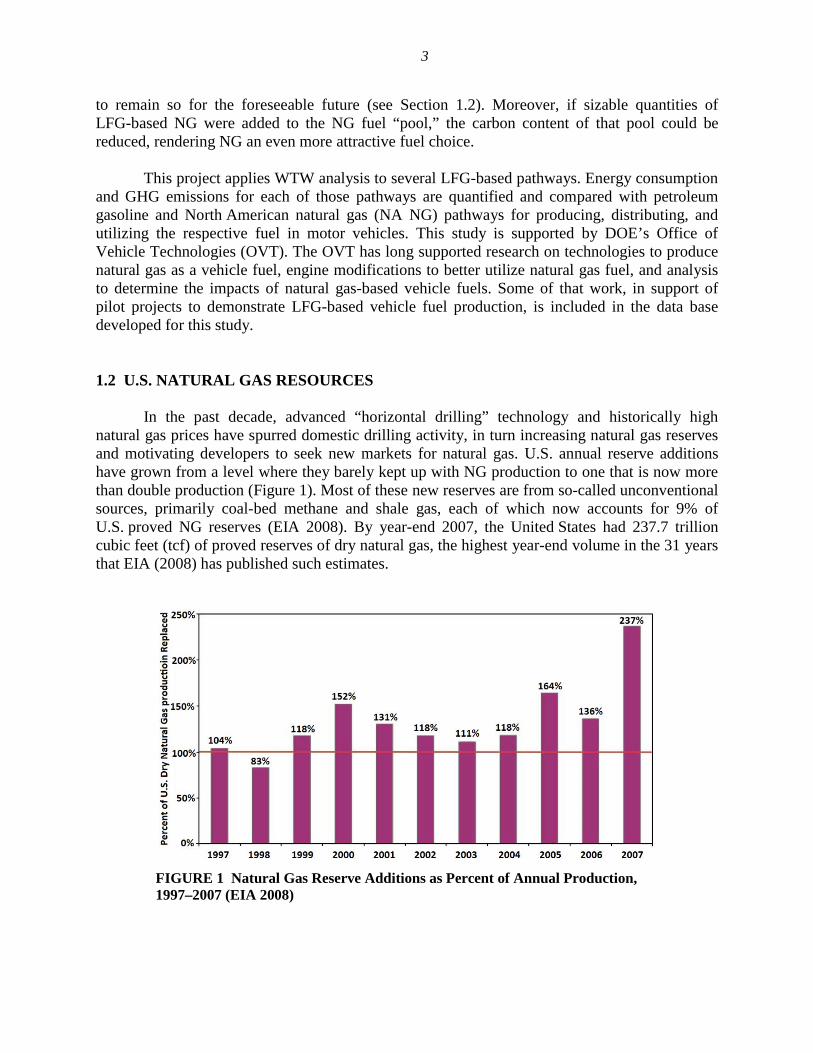
4
In concert with vigorous exploration and production activity NG pipeline construction has climbed to connect new supplies to the existing gas distribution infrastructure as well as to expand distribution capacity system wide In 2008 pipeline capacity increased by four times the average for the prior decade (Figure 2)
FIGURE 2 Pipeline Capacity Additions 1998ndash2008 (EIA 2009b)
With increased reserves and distribution capacity developers are looking for new natural gas markets One possibility is to replace conventional coal-fired power plants with NG-fueled integrated-gasification-combined-cycle power plants2 Another is to replace motor gasoline or diesel with lower-carbon natural gas This latter option could be particularly attractive if the intent is to achieve deep CO2 cuts in sectors that currently have few economic low-carbon alternatives Transportation is one such sector Resource developers like TB Pickens (2009) have targeted transportation vehicles as a potential new market for natural gas Although compressed natural gas (CNG) -fueled vehicles have been available for many years the lack of a widespread public fueling infrastructure has limited their appeal to all but centrally fueled fleets Even then many centrally fueled fleets have been reluctant to invest in additional fueling infrastructure and vehicles with uncertain resale values
Uncertainty has been an especially strong barrier to the market acceptance of NG-fueled motor vehicles Transit operatorsrsquo need to meet ever-tougher exhaust emissions standards has spurred them to consider CNG or LNG-fueled buses However other technologies mdash like hybrids and a new generation of low-emission diesels mdash may also meet the standards With no clear technology ldquowinnerrdquo the looming prospect of a low-carbon fuel standard may be a persuasive argument for NG particularly from low-carbon sources like landfill gas
2 Note however that this option is most attractive when the difference between the cost of electricity and the cost of the fuel required to produce electricity is relatively small Called the ldquospark spreadrdquo this difference narrowed over the past decade but has increased since 2007
5
13 NATURAL GAS AS A VEHICLE FUEL
Historically natural gas has been used mostly for power production space heating industrial processes and as a petrochemical feedstock In the past decade however its relatively low emissions (as compared with diesel engines in internal combustion engines) have made it increasingly attractive as an urban bus fuel especially in California where emission standards for nitrous oxides (NOx) and particulate matter (PM) are particularly stringent To use natural gas as a vehicle fuel many transit operators have replaced diesel buses with CNG buses containing a new generation of spark-ignited engines Fueling generally relies on existing local distribution pipelines to deliver the gas under relatively low pressure compressors to increase the pressure to roughly 3600 psi for on-site storage and storagedispensing systems to load the gas onto vehicles at 3000ndash3600 psi Fleets that are not served by natural gas pipelines or that must travel a longer distance between fueling usually use liquefied natural gas (LNG) which is generally delivered in cryogenic tank trucks
Spurred by Californiarsquos Low Carbon Fuel Standard and the possibility of a similar national standard there is increasing interest in vehicle fuels with lower carbon footprints CNG and LNG derived from landfill gas are particularly promising For each million Btu of energy petroleum diesel contains 21600 grams of carbon while North American fossil-derived natural gas (NA NG) contains 16200 grams If only vehicle operation is taken into account on a Btu-to-Btu displacement basis switching from petroleum diesel to NA fossil-based CNG can reduce carbon emissions by 25 (assuming comparable operating efficiencies) As shown in Section 31 switching from NA fossil-based CNG to LFG-based CNG can reduce carbon emissions much more
14 RENEWABLE NATURAL GAS AND GHG EMISSIONS
Natural gas derived from LFG is considered a renewable fuel since the original source of the carbon in the decomposed waste can be traced back to organic sources that naturally replenish it It is also a low-carbon fuel Whether in the form of CNG or LNG LFG-based NG has negative GHG emissions since its conversion to vehicle fuel displaces GHG emissions that would have occurred if the LFG had been oxidized into CO2 in the landfill flare
Renewable natural gas is particularly attractive to utilities subject to renewable fuel mandates LFG-based CNG or LNG is attractive to fleet operators in states with low-carbon fuel standards Since natural gas is fungible the entity purchasing the rights to a supply of LFG-based NG need not take physical possession of it to gain renewable fuel credits
15 FUEL CYCLE ANALYSIS
To understand a fuelrsquos impact the entire fuel cycle mdash from production of raw materials to delivery and end use mdash must be considered This requires a systematic accounting of the energy and emissions of each stage in the cycle from ldquowellrdquo to ldquowheelrdquo (WTW) This study was undertaken to characterize pathways for producing vehicle fuel from landfill gas estimate WTW
6
energy and GHG emissions at each stage in these pathways and compare results with petroleum-and fossil NG-based alternatives In this context the ldquowellrdquo is the landfill gas resource and the ldquowheelrdquo is the vehicle consuming the fuel
The analysis was conducted by using the GREET (Greenhouse gases Regulated Emissions and Energy use in Transportation) model created by Argonne National Laboratory Developed in Microsoftreg Excel with a graphical user interface GREET is structured to systematically account for a range of potential feedstocks fuels and conversion processes for any defined WTW pathway Downloadable at httpwwwtransportationanlgov modeling_simulationGREET GREET calculates emissions of three greenhouse gases (CO2 CH4 and N2O) and six criteria pollutants (VOC CO NOx SOx PM10 and PM25) and consumption of each of the following total energy fossil fuel petroleum natural gas and coal
In the years since its development GREET has become a familiar and respected tool for evaluating vehicle technologies and fuels on a consistent systematic basis Working with industry and government experts Argonne continues to upgrade and update the GREET model With support from the US Department of Energy (DOE) Argonne has added a number of hydrogen production pathways for stationary and mobile internal combustion engine and fuel cell applications and extensive simulations of biofuel production pathways Most recently Argonne has upgraded simulations of plug-in hybrid electric vehicles (PHEVs) in GREET The most recent GREET fuel-cycle model (GREET18d0) was released in June 2010 Currently there are more than 10000 registered GREET users
16 SCOPE
As stated above this report documents the conceptual approach data and initial results for a set of LFG-to-vehicle fuel pathways These landfill gas-based pathways have been added to GREET 18d0
The report itself is organized into five sections supplemented by two appendices Following this brief Introduction Section 2 describes the size and characteristics of the LFG resource base while Section 3 discusses WTW pathways their key stages and important features of the fuel cycle analysis In Sections 4 and 5 estimates of well-to-wheel (WTW) fossil fuel use and GHG emissions are presented and conclusions are discussed Appendix A provides additional detail on liquefaction assumptions and Appendix B presents estimates of WTW emissions of criteria pollutants
7
2 LANDFILL GAS
At present most of the biomethane generated at US landfills is flared in conjunction with emissions-abatement practices (For further discussions of flaring and ldquoreference caserdquo assumptions see Sections 21 and 31) Relative to venting flaring reduces criteria pollutant and GHG emissions but it captures none of the energy (approximately 500 Btuscf) in the gas that is burned3 Moreover by destroying a valuable energy resource it precludes the generation of additional revenue by the landfill owner ndash either as energy sales or in various forms of carbon and renewable energy credits For these reasons there is increasing interest in converting methane in the collected LFG into usable energy like natural gas hydrogen methanol ethanol or electricity This study investigates the potential for WTW energy and GHG emission benefits as the result of producing LFG-based natural gas for vehicle use
21 RESOURCE BASE
Since the mid-1960s sanitary landfills have been the main disposal method for municipal solid waste (MSW) in the United States In 2007 there were an estimated 1754 ldquoactiverdquo landfills accepting 137 million tons of waste annually or approximately 54 of the total MSW generated in the United States (EPA 2008)4 As shown in Table 1 and Figure 3 this share has been dropping steadily since 1960
An additional 6000 landfills are inactive (ie no longer receiving waste) 5 Over their lifetime landfills produce significant quantities of landfill gas (LFG) primarily methane (CH4) and carbon dioxide (CO2) from the anaerobic decomposition of organic materials which typically comprise some 60 of the waste-to-landfill stream The EPA actively monitors emission compliance and energy recovery at active landfills the latter through its Landfill Methane Outreach Program (LMOP) Figure 4 produced from a model developed by EPArsquos LMOP illustrates a typical LFG generation and recovery profile for a site opened in 1980 at which peak recovery occurs in 2014 (EPA 2008) In conventional landfills gas recovery typically begins a decade or more after the waste is deposited and continues for several decades In newer designs (eg conventional cells with leachate circulation bioreactors or anaerobic
3 In 1994 EPA created the Landfill Methane Outreach Program (LMOP) to help reduce methane emissions from landfills by encouraging the recovery and use of landfill gas (LFG) as an energy resource LMOP is a voluntary program to promote alliances among states energy users and providers landfill owners and operators and communities by providing information analysis and support for LFG-to-energy projects
4 The other 46 consists of construction waste from new construction or remodeling activities debris from the demolition of buildings and roads industrial waste from manufacturing processes and wastes banned from the MSW waste stream (including MSW ash and medical waste)
5 Inactive landfills must comply with EPA post-closure requirements which include monitoring and maintaining waste containment systems and monitoring groundwater to ensure that waste is not escaping and polluting the surrounding environment These activities are generally required for 30 years from site closure During this time inactive landfills continue to emit methane and other gases At larger landfills equipped with gas collection systems LFG is usually captured and flared in a thermal oxidizer At smaller landfills LFG is usually uncontrolled
8
TABLE 1 Distribution of Municipal Solid Waste 1960ndash2007 (EPA 2008)
Percent of Total Generation
Activity 1960 1970 1980 1990 2000 2004 2005 2006 2007
Generation 100 100 100 100 100 100 100 100 100 Recovery for recycling 64 66 96 142 221 230 235 241 249 Recovery for compostinga Neg Neg Neg 20 69 82 82 82 85 Total materials recovery 64 66 96 162 290 312 317 323 334 Combustion with energy recoveryb 00 03 18 145 141 126 126 126 126 Discards to landfill other disposalc 936 931 886 693 569 562 557 551 540
Pounds per Person per Day
Activity 1960 1970 1980 1990 2000 2004 2005 2006 2007
Generation 268 325 366 450 465 466 463 465 462 Recovery for recycling 017 022 035 064 103 107 109 112 115 Recovery for compostinga Neg Neg Neg 009 032 038 038 038 039 Total materials recovery 017 022 035 073 135 145 147 150 154 Combustion with energy recoveryb 000 001 007 065 066 059 058 058 058 Discards to landfill other disposalc 251 302 324 312 264 262 258 257 250
a Includes composting of yard trimmings food scraps and other MSW organic material excludes backyard composting
b Includes combustion of MSW in mass burn or refuse-derived fuel form and combustion with energy recovery of source-separated materials in MSW (eg wood pallets and tire-derived fuel)
c Discards after recovery minus combustion with energy recovery Discards include combustion without energy recovery Details may not add to totals due to rounding
FIGURE 3 Disposition of Municipal Solid Waste 1960ndash2007 (EPA 2008)
9
FIGURE 4 Typical Landfill Gas Production and Recovery Profile
digestion of organics) accelerated waste stabilization permits economic recovery to begin much earlier typically within 5ndash10 years of waste deposition (University of Florida and University of Central Florida 2008)
Because of its high methane content LFG can be explosive as well as a potent source of greenhouse gases It is also a major source of non-methane organic compounds (NMOCs) a precursor of ground-level ozone formation Historically a system of vertical wells drilled into landfills was used to dilute the concentration of CH4 in the landfill to a level below methanersquos explosive limit (5ndash15 percent) thereby controlling the explosion hazard Most NMOC emissions have been controlled since 1996 when landfills with a permitted capacity greater than 25 million cubic meters of waste were brought under the Landfill Rule of the Clean Air Act which requires them to have collection systems consisting of low-pressure wells horizontal pipes and blowers to capture the LFG and a flare or thermal oxidizer to destroy it6 (Thus some 98 of NMOCs are converted to less toxic compounds and 999 of the methane is oxidized to CO2)
7 Although collection efficiencies reportedly range from 50 to 90 EPA estimates an average value of 75 for inventory purposes (EPA 1995) Methane in the remaining 25 of LFG that is uncontrolled (ie the area between the two curves in Figure 4) is typically oxidized to CO2 or converted to other compounds by microbes in the landfill cover soil Some of these compounds eventually are emitted to the atmosphere some remain in the soil
6 Of Californiarsquos 367 municipal solid waste landfills 218 (59) have a permitted capacity of less than 25 million m3 (CARB 2009) Nationally approximately 46 of the waste in the ground is not covered by the landfill gas rule Presumably much of the excluded waste is at small landfills
7 On June 25 2009 the California Air Resources Board (CARB) ruled that all previously uncontrolled MSW landfills in that state (ie those with permitted capacities below 25 million m3) must design and install gas collection systems by 2012 and that currently controlled landfills must improve gas collection efficiency (CARB 2009)
10
22 RESOURCE DEVELOPMENT
As of April 2010 EPA reports that 519 projects are recovering energy from landfills (EPA 2010a) More than 70 of these projects generate power most of the others minimally process the LFG and use it in boilers or various manufacturing applications (Godlove 2010) Approximately 13 billion kWh of electricity and 102 billion cubic feet (bcf) of natural gas are generated each year from recovered LFG (Godlove 2010) representing about 03 of US electricity and 03 of US natural gas consumption (EIA 2009a)
Some 32 projects currently convert LFG into high-Btu NG or ldquorenewable natural gasrdquo (RNG) mostly for injection into the pipeline system (Godlove 2010) A handful of these projects include vehicle fueling either as CNG or LNG (Ludwig 2009) In the past these latter projects have tended to be pre-commercial or pilot scale Now however several are coming on line at commercial scale or growing to commercial scale as second phases become operational These latter projects include
bull Altamont Landfill LFG-to-LNG in Livermore CA bull Frank R Bowerman Landfill LFG-to-LNG in Orange County CA bull Franklin County Landfill LFG-to-CNG in Columbus OH bull McCommas Bluff Landfill LFG-to-CNG and pipeline gas in Dallas TX bull Rumpke Landfill LFG-to-CNG and pipeline gas in Cincinnati OH
To the extent possible these projects are included in the database developed for this analysis Data on the following North American pilot-scale projects are also included in the database
bull Central Landfill LFG-to-CNG in Sonoma County CA bull Burlington County Landfill LFG-to-LNG in NJ bull Puente Hills Landfill LFG-to-CNG in Los Angeles CA bull Les Entreprises Berthier Inc (EBI) Landfill LFG-to-pipeline gas in Quebec bull Highland Valley Copper Landfill LFG-to-pipeline gas in Vancouver
Figure 5 shows operational LFG-to-energy projects as of April 2010 as well as landfills identified by the EPArsquos LMOP as candidates for future projects
23 ADDITIONS TO THE RESOURCE BASE
In addition to the ldquoin placerdquo LFG resource LFG continues to be generated by MSW decomposition Lear and Burdelski (2009) estimate that the current US population generates some 27 billion cubic ft (bcf) of ldquonewrdquo LFG each year equivalent to approximately 121 million gal of gasoline
11
FIGURE 5 Operational LFG-to-Energy Projects and Candidate Landfills by State (EPA 2010a)
24 LANDFILL GAS COMPOSITION
As shown in Table 2 methane (CH4) is the predominant constituent in both fossil natural gas and LFG Although gas composition varies from one site to another LFG typically contains around 45ndash50 methane (CH4) 35ndash40 carbon dioxide (CO2) and 10ndash15 nitrogen (N2) with smaller amounts of hydrogen (H2) oxygen (O2) hydrogen sulfide (H2S) and ammonia (NH3) The gas is usually saturated with water vapor
LFG may contain more than 500 different contaminants including a variety of sulfur compounds that are corrosive in the presence of water halogenated compounds (eg carbon tetrachloride chlorobenzene chloroform) that produce corrosive combustion products and organic silicon compounds (eg siloxanes) that form siliceous deposits in downstream applications mdash like internal combustion engines (Persson et al 2006) Thus an initial cleanup or pre-purification step is needed before LFG can be used in any application involving combustion
12
TABLE 2 Composition and Characteristics of Biomethane and Fossil Natural Gas
Parameter Unit EU LFG EU AD-Based
Biogas NG from NA
Gas Field NG from NNA
Gas Field NG distributed in
US
Source
LHV average range
Density average range
Btuft3
gft3
(Persson et al 2006)
406 584
348 321
1081 835ndash1336
224 195ndash279
(Segeler 1965)
1145 627ndash1717
1049 945ndash1121
239 195ndash369
215 203ndash246
CH4 average range
vol 45 36ndash65
63 53ndash70
515 847ndash988
770 228ndash980
894 728ndash952
H2 average vol 0-3 0 ndash ndash ndash
CO2 average range
vol 40 15ndash50
47 30ndash47
055 0ndash60
41 0ndash290
07 0ndash20
N2 average range
vol 15 5ndash40
02 ndash
403 0ndash294
17 0ndash121
29 0ndash171
O2 average range
vol 1 0ndash5
0 ndash
006 0ndash04
01 0ndash14
00 0ndash04
H2S average range
ppmv lt100 0ndash100
lt1000 0-10000
100 0ndash3100
400 0ndash5200
NMOC average (as Hexane) range
ppmv 1100 0ndash6600
2000 0ndash17000
400 0ndash1400
NH3 ppm 5 lt100 ndash ndash ndash
13
3 FUEL CYCLE ANALYSIS OF LANDFILL-GAS-BASED PATHWAYS
31 LFG REFERENCE CASE
The benchmark or reference case is critical to estimating the change in energy and emissions associated with introducing any new fuel or vehicle technology For fossil fuels the question is usually trivial mdash were it not for development of the resource to produce the new fuel energy and emissions would not occur Although process energy use and vehicle emissions may change in response to mandates requiring different fuel properties (eg low-sulfur diesel in place of conventional diesel or reformulated gasoline in place of unleaded gasoline) the resulting ldquonewrdquo fuel comes from the same feedstock as before and the benchmark or reference is the ldquooldrdquo fuel Thus the energy and GHG impact of the ldquonewrdquo fuel is simply the difference between the values associated with the ldquonewrdquo and ldquooldrdquo fossil fuels
This is not usually the case with renewable fuels If the feedstock historically has not been used to produce fuel the energy and GHG impact of the new fuel is the difference between energy and GHG emissions associated with the resourcersquos typical prior use (ie the pathway or reference case) and its new one With respect to landfill gas the key questions are
bull What is the typical prior use for LFG
bull Would the LFG have been produced in a conventional landfill gathered in a standard gas collection system and flared Or would it have been produced some other way With different constituents With more methane emitted to the atmosphere
bull At what point does the new LFG pathway diverge from the old
Since we are concerned with the difference in energy and GHG emissions between the two pathways the answer to the last of the above questions helps bound our system Shared stages can be ignored since they are in both ldquooldrdquo and ldquonewrdquo pathways Thus for example gas that continues to be flared (ldquoFlared LFGrdquo in Figure 6) is excluded from LFG-based pathways which are labeled as cases within the dashed system boundary shown in Figure 6
311 Flaring versus Venting Landfill Gas
Since the mid-1990s MSW landfills with a design capacity of 25 million m3 or more have been regulated under the Landfill Rule of the Clean Air Act (EPA 2000) To reduce emissions of volatile organic compounds air toxics and methane these large landfills are required to install collection wells into the landfill and route the gas to a suitable energy recovery or combustion device (flare) to monitor surface methane on a quarterly basis and to expand their collection systems if the methane concentration exceeds 500 parts per million
As shown in Figure 7 flaring dramatically reduces the impact of carbon contained in organic waste Emitted to the atmosphere as CH4 the carbon in the waste has a CO2 equivalence
14
of 368 emitted as CO2 the equivalence is reduced to 44 The resulting ratio (36844 = 836) is the relative benefit of flaring over venting the landfill gas
The Landfill Rule succeeded in reducing VOCs and air toxics and in cutting methane emissions by over 37 million metric tons (EPA 1996) Few would argue that the approximately $22 million in capital and $190000 in annual operating cost required to retrofit each covered landfill was not money well spent (EPA 1996) However it was soon recognized that the energy in the flared gas roughly 500 Btuft3 could be more productively utilized Thus EPArsquos Landfill Methane Outreach Program (LMOP) was created to encourage the recovery and use of LFG as an energy resource LMOP currently has over 800 partners mdash including energy providers landfill owners and operators and host communities mdash involved in LFG-to-energy projects
FIGURE 6 Fuel Cycle for Landfill-Gas-Based CNG and LNG as Used in GREET Modeling
15
FIGURE 7 CO2 Equivalent Emissions of Flaring versus Venting Landfill Gas
312 Carbon Fate in LFG Fossil NG and Petroleum Fuel Cycles
As discussed above flaring emits CO2 Purifying the LFG and converting it into CNG or LNG for vehicle fuel still emits CO2 However the CO2 would have been emitted anyway (hence there is no net addition) Moreover the CO2 from LFG displaces a near equivalent amount of CO2 from fossil fuels (natural gas or petroleum) that would have been emitted if the vehicles operating on LFG-derived CNGLNG had not been converted from their original fossil fuel
Figures 8ndash10 depict the various stages of the LFG fossil NG and petroleum fuel cycles showing where carbon is emitted to the atmosphere As discussed earlier the LFG fuel cycle (Figure 8) begins with gas collection which is assumed to capture 75 of the total LFG produced A portion of the collected carbon is assumed to be flared either in waste gas from the purification process or as excess LFG that cannot be processed Carbon is also emitted in transportation and distribution (TampD) and vehicle operation
For comparison purposes Figures 9 and 10 show fossil NG and petroleum fuel cycles As in the LFG fuel cycle carbon is emitted in feedstock production processingrefining TampD and vehicle operation
16
FIGURE 8 CO2 Emissions in LFG-to-CNGLNG Fuel Cycle
FIGURE 9 CO2 Emissions in Fossil NG-to-CNGLNG Fuel Cycle
FIGURE 10 CO2 Emissions in Petroleum GasolineDiesel Fuel Cycle
17
32 OVERVIEW OF LFG-TO-CNGLNG FUEL CYCLE
Figure 6 illustrates the 10 LFG-based pathways investigated in this study Shown within the dashed system boundary pathways include the resource mdash LFG collected by the gas collection system (discussed in Section 33) a cleanuppurification process to convert it into NG (discussed in Section 34) electricity from either an on-site generator or the grid assuming the US average generation mix (discussed in Section 35) and if fueling is off-site pipeline or truck delivery of the product NG to stations where it is compressed for vehicle fueling For pathways in which LNG is produced a liquefaction process (discussed in Section 36) occurs between production and transportation and distribution (TampD which is discussed in Section 37) Note that this fuel cycle is but a portion of the lifecycle of municipal solid waste
Table 3 summarizes the assumptions of each pathway The collected LFG is converted to NG via pre-purification and CO2 removal The NG production process usually requires electricity as a process fuel that can be delivered by an on-site distributed generator (RC-1 RC-2 RL-1 RL-2 and RL-3) or from the grid (RC-3 RC-4 RL-4 RL-5 and RL-6) During NG processing waste gases (including contaminants CO2 and unrecovered CH4) may be returned to the input stream or flared Since the waste gases are not involved in NG processing (ie they essentially flow through the process) they are subtracted from the LFG feed for modeling purposes Thus in all GREET-modeled pathways the LFG feed is assumed to include only CH4
converted into NG or used for on-site power generation
TABLE 3 Assumptions for LFG-Based CNGLNG Fossil CNGLNG and Petroleum Pathways
Case Transportation amp No Feedstock Fuel Electricity Source Fueling Distribution (TampD)
RC-1 LFG CNG Site Generation On-site NA RC-2 LFG CNG Site Generation Off-site Pipeline RC-3 LFG CNG US Average Mix On-site NA RC-4 LFG CNG US Average Mix Off-site Pipeline CNG NA NG CNG US Average Mix Off-site Pipeline CG Crude Gasoline US Average Mix Off-site Mixed Mode
RL-1 LFG LNG Site Generation On-site NA RL-2 LFG LNG Site Generation Off-site LNG Truck RL-3 LFG LNG Site Generation Off-site Diesel Truck RL-4 LFG LNG US Average Mix On-site NA RL-5 LFG LNG US Average Mix Off-site LNG Truck RL-6 LFG LNG US Average Mix Off-site Diesel Truck LNG NA NG LNG US Average Mix Off-site Pipeline LSD Crude Diesel US Average Mix Off-site Mixed Mode
18
For renewable CNG (RC cases in Figure 6) the produced gas is compressed by an electric compressor at a fuel station For on-site fueling cases (RC-1 and RC-3) the necessary electricity is supplied by the genset for off-site fueling cases (RC-2 and RC-4) electricity comes from the grid For renewable LNG (RL cases in Figure 6) the produced gas is liquefied by a small on-site liquefier NG production and liquefaction use the same power source (ie a distributed generator for RL-1 RL-2 and RL-3 and the grid for RL-4 RL-5 and RL-6) The produced liquid can be dispensed at an on-site fuel station (RL-1 and RL-4) or transported to off-site stations via LNG trucks (RL-2 and RL-5) or diesel trucks (RL-3 and RL-6) Note that LNG trucks are fueled by the LFG-based LNG
In this study energy and material inputs and outputs are characterized for the steps in the LFG-to-CNG and LFG-to-LNG fuel cycles in order to estimate overall energy and greenhouse gas emissions associated with pathways As with other GREET pathways results for LFG-based CNG and LNG are estimated in units of energy use and emissions per unit of consumed energy andor per mile driven with vehicles fueled with CNGLNG For ldquowell-to-pumprdquo (WTP) results this includes NG production transmission and distribution of the fuels for ldquowell-to-wheelsrdquo (WTW) results it includes WTP results plus consumption or emissions during vehicle operation Estimates are then compared with results for fossil North American natural gas (NA NG) and conventional petroleum pathways
Note that conventional NA NG and petroleum pathways start with energy in the unrecovered feedstock while the landfill gas pathway starts with energy in the collected feedstock (ie LFG) As pointed out in Brinkman et al (2005) the GREET model accounts for energy use at different starting points for different fuels For fossil fuels mdash such as NA NG gasoline diesel and electricity from fossil fuels mdash the accounting system starts with primary feedstock recovery In this study the energy in the collected LFG is not of concern because it would have been flared if not converted to NG Therefore landfill gas pathways start with the processing of collected LFG Details about the energy accounting are discussed in Section 344
33 GAS COLLECTION
As stated earlier pathways begin with a process stream of LFG which is assumed to be 75 of the total LFG produced (Figure 6) While this share is consistent with EPA assumptions it is not a critical parameter8 Instead of going to the flare a blower diverts the collected LFG to a cleanup unit
34 NATURAL GAS PRODUCTION
The NG production process includes pre-purification and purification (primarily CO2
removal) The processes can use similar technologies and are closely integrated in many cases Also the required process energy or process efficiency is often reported as an integrated process
8 Others claim that the average share of LFG collected is closer to 90 (Sullivan 2010) However because GREET pathways begin with the processing of collected LFG the share lies outside our fuel cycle system boundary and does not affect results
19
Therefore NG production efficiency in this study is defined as the energy in the produced NG divided by the sum of the energy in the LFG fed to the pre-purification step plus the process electricity for pre-purification and CO2 removal
341 Pre-Purification
The collected landfill gas must be treated to remove impurities before it enters the CO2
removal process Impurities include corrosive hydrogen compounds low concentrations (parts per million) of non-methane organic compounds (NMOCs including siloxane) and water As stated in 40 CFR Parts 72 and 75 the level of hydrogen sulfide (H2S) mdash a corrosive toxic and flammable gas with unpleasant odor mdash must be reduced to less than 5 ppm (or 03 g100 scf) for pipeline natural gas Many well-established processes (eg absorption adsorption and chemical and thermal oxidation)9 are available for H2S removal from gas fluxes (Syed et al 2006) One of the most common is an iron oxide-based sulfur scavenging process (Kohl and Nielsen 1997) in which hydrogen sulfide reacts with iron oxide to form iron sulfide while the landfill gas flows through granular iron-oxide in a bed The process is suitable for the treatment of relatively small volumes of gas For dehydration pressure swing adsorption (PSA) or refrigerated drying are widely used
The output mdash pre-purified landfill gas mdash can then be used to fuel an on-site power-generator providing electricity for CO2 removal and further conditioning steps as well as export power
342 CO2 Removal
The H2S-treated and dehydrated landfill gas is further purified by removing CO2 from the gas stream Four types of technologies are widely employed membrane separation adsorption absorption and cryogenic distillation To enhance the quality of the product fuel more than one technology may be used in series Further details are explained below
Membrane Separation
Since CO2 is more permeable than CH4 the two may be separated by selective permeation through membranes When the landfill gas contacts the membrane more CO2 than CH4 permeates although quantities depend on the partial pressure difference across the membrane As shown in Figure 11 CO2 concentration in the LFG feed affects the optimum number of membrane stages (Spillman 1995 Datta and Sen 2006) Since two-stage and three-stage membrane systems are more economical (in dollars per normal m3 of product gas) than single-stage systems a second membrane system or a secondary amine process is often used in landfill gas projects (Pomerantz and Turcotte 2004)
9 These same technologies are used in large-scale NG processing plants but with somewhat different sulfur scavenging processes
20
FIGURE 11 Gas Processing Cost (GPC) Associated with 1- 2- and 3-Stage Membranes (Datta and Sen 2006)
Membrane separation is amenable to a wide range of process stream volumes CO2
concentrations and product-gas specifications It also tends to be more environmentally friendly than amine processes Since membrane separation operates at relatively high pressure ranging from 200 to 600 psig (Air Liquide 2009 Pomerantz and Turcotte 2004) a further benefit is reduction in compression requirements for CNG production or injection into the gas grid
Adsorption
Swing adsorption separates CO2 from landfill gas by collecting CO2 on the surface of an adsorbent Parameters affecting the collection include temperature total pressure and partial pressure of the constituent gases In pressure swing adsorption (PSA) the pressure is swung (since CO2 is adsorbed more easily than CH4 under high pressure) and the CH4-rich gas that is not adsorbed flows through the vessel Once the adsorbent in the vessel is saturated adsorbed CO2 is removed by reducing the pressure to ambient A cycle of PSA adsorption and desorption is typically relatively short since common industrial practice is to use multiple vessels to maintain a constant feed flow and output gas product PSA operates at relatively high pressure the pressure of the product gas ranges from 100 to 200 psig (Sperling Hansen Assoc 2007)
Absorption
In absorption processes molecules in gas phase (eg H2S and CO2) are removed as they become liquid phase in solutions The amine process one of the most common absorption processes in the natural gas industry uses aqueous solutions of various alkanolamines to remove H2S and CO2 In a typical process a CO2- and H2S-rich gas passing upward through an absorber contacts a downward-flowing amine solution that absorbs CO2 and H2S The purified gas flows through to the top of the absorber while the amine-rich gas is collected at the bottom where it is sent to a regenerator to produce lean amine In some landfill gas recovery projects water scrubbing (ie water is the absorbent) is used in place of an amine solution
21
Cryogenic Distillation
Cryogenic distillation uses the relatively higher boiling temperature of CO2 mdash as compared with CH4 mdash to separate it from landfill gas CO2 Washreg developed by Acrion Technologies illustrates the cryogenic distillation process 10 As in the amine process dry compressed landfill gas enters the bottom of an absorber column flows upward and contacts a downward-flowing solution (in this case liquid CO2) which ldquowashesrdquo out contaminants (see Figure 12) When the contaminant-free landfill gas is cooled by refrigeration at the top of the absorber (typical gas temperature is ndash59degF) the CO2 in the gas is condensed The clean gas exits at the top of the absorber and some of the liquid CO2 can be collected for possible co-product use The rest of the CO2 flows downward as the absorbent The contaminant-free gas is clean enough to provide a hydrogen source for a fuel cell or a feedstock for chemical synthesis such as methanol However since its CO2 concentration (~27) is still higher than pipeline quality natural gas or transportation fuel further treatment or post purification (for example using membrane separation) is required (Cook et al 2005)
343 Process Efficiency
Data to develop the NG production process efficiency were obtained by literature search and direct contact with developers of a number of pilot- and commercial-scale LFG-to-NG projects whose information is publicly available These include Acrion 2009 Cook 1998 Cook 2002 Prometheus 2007 Sperling Hansen Assoc 2007 Pomerantz and Turcotte 2004 GTI 2007 and Johansson 2008 As shown in Figure 13 the energy efficiency of NG processing at these sites ranges from about 91 to 97 with larger projects tending to achieve somewhat higher efficiency Although most projects generate their own electricity for NG processing two projects do not report the amount of LFG used for on-site power generation and none report the share of co-generated electricity exported to the grid Thus all co-generated electricity is assumed to be used for NG production and NG processing efficiency is calculated from the energy content of the landfill gas used assumed liquefaction efficiency (see Section 36) and assumed generator efficiency (ranging from approximately 28 to 44) On the basis of these data and assumptions the default NG processing efficiency is calculated as 944
FIGURE 12 CO2 Washreg Process (Acrion 2009)
10 A key advantage of CO2 Washreg is that it uses liquid CO2 separated from landfill gas to absorb other impurities
22
FIGURE 13 NG Processing Efficiencies of LFG-Based Projects Producing Vehicle Fuel
344 Energy Use Accounting
Although LFG-based CNGLNG contains the same amount of energy as fossil-based CNGLNG the former is renewable (ultimately from solar energy) while the latter is not This highlights a key issue in GREET simulation of LFG-based pathways mdash namely the appropriate treatment of the energy in LFG This energy is produced from the decomposition of organic materials by methanogenic bacteria in the waste stream From the point of view of energy accounting the ldquosystemrdquo includes only the solar energy recovered from the organic materials since the losses from solar energy to organic material and from organic material to LFG are irrelevant As with other biogenic energy sources the solar energy embedded in LFG can be ignored since it would be unused if not captured Thus the LFG fuel cycle includes only the energy in the LFG (as total energy but not fossil fuel) when it is used to generate power for processing (or for addition to the grid) for compressionliquefaction and TampD and for vehicle operation However if the amount of co-generated electricity equals the amount of process electricity required (for LFG processing and compression or liquefaction) or the plant does not import or export electricity only the energy used by the genset or converted to NG needs to be counted On the other hand if the generator produces less electricity than needed for processing the remainder must be imported from the grid and upstream energy use and emissions for imported grid electricity must be included in the fuel cycle analysis Likewise if the amount of co-generated electricity exceeds process needs the excess can be sold to the grid (displacing an equivalent amount of electricity) and upstream energy and emissions (for the displaced grid electricity) must be taken as credits11
35 ON-SITE POWER GENERATION
Many landfill gas recovery projects incorporate on-site generators to produce process electricity Established technologies include internal combustion engines (ICEs) and natural gas turbines
11 For LFG-based CNGLNG pathways we assume that the genset generates the same amount of electricity as the amount of process electricity required meaning no electricity is imported or exported
23
351 Technologies
ICEs are typically spark-ignition reciprocating engines powered by the pre-purified landfill gas (or biogas) ICEs offer low initial cost easy start-up proven reliability and good part-load characteristics and heat recovery potential Emissions can be controlled by exhaust catalysts selective catalytic reduction and better control of the combustion process NREL and EPRI forecast electric efficiencies for natural gas ICEs ranging from 33 for rich-burn engines to 44 for lean-burn engines by 2010 (Goldstein et al 2003 EPRI 2004)
Combustion turbines can develop power over a wide capacity range from several kilowatts to hundreds of megawatts Microturbines small combustion turbines with outputs in the range of 30ndash200 kW are suited to lower-capacity applications like LFG recovery Microturbines (MTs) are capable of producing power at improved efficiencies by recuperating heat from the exhaust gas to the incoming air stream They also have the advantage of no gearbox or lubricating oil requirement and high engine speed (ranging from 80000 to 100000 rpm) (Dunn 2000) NREL and EPRI forecast microturbine and small gas turbine efficiencies of 29ndash40 by 2010 (Goldstein et al 2003 EPRI 2004)
352 Criteria Pollutant Emissions
Since all but one of the landfill gas projects reviewed in this study use ICEs for on-site power generation and emissions data are more generally available for LFG-fueled ICEs than for MTs ICE engines are the default technology for LFG-fueled power generation in GREET On the basis of available data their default electric efficiency (electricity from the genset divided by energy in the LFG feed to the genset) is set to 35
Since it is assumed that electricity is the only energy source used in the process (other than the LFG itself) emissions from power generation are the only emissions that need be taken into account in the fuel cycle analysis These are calculated from newly developed GREET emission factors for LFG-fueled stationary IC engines Most current projects producing pipeline-quality gas or CNGLNG for vehicle fuel utilize IC engines in the range of 1ndash2 MW that must meet point source standards for criteria pollutant emissions Since local rules are often stricter than federal standards GREET emission factors are based on the former calculated from project-level data contained in permit applications and source tests Default factors for emissions of volatile organic compounds (VOCs) carbon monoxide (CO) nitrogen oxides (NOx) and particulates of 10 micrometers or more (PM10) are calculated from these data Methane (CH4) and nitrous oxide (N2O) emissions are rarely reported in source tests since they are not regulated12 Moreover field measurements of N2O are generally below detection limits Thus GREET emission factors for unburned methane (ie CH4 slip) from the IC engine are based on the relative methane destruction efficiency of stationary IC engines as compared with the flare GREET default emission factors for carbon dioxide (CO2) and sulfur oxide (SOx) from on-site power generation are estimated as a function of genset efficiencies the carbon and sulfur content of input and output gas streams and values reported in the literature
12 Although CH4 could be calculated as the difference between total HC and NMHC the result is not accurate because the methodologies are not consistent
24
TABLE 4 Emission Factors for LFG-Fueled IC Engines LFG Flares and US Power Generation
Factor (gmmBtu) VOC CO NOx PM10 PM25 SOx CH4 N2O CO2
LFG-Fueled ICEs 627 2735 201 85 85 027 446 087 57600 LFG Flares 237 415 162 50 50 027 316 11 59200 US Average Power 34 455 187 130 70 474 38 267 207000 Generation
Since LFG is assumed to be flared unless used in the generator or converted to NG avoided emissions (from the flare) are considered credits Emission factors for VOC CO NOx and PM10 from LFG flares are used to calculate these credits (EPA 1995) As stated above CH4
emission factors are calculated from the destruction efficiency of LFG flares (9986) (SCS 2007 TRC Environmental Corporation 2008) while CO2 and SOx emission factors are calculated by using a carbon and sulfur balance approach
Table 4 summarizes the emission factors for LFG-fueled IC engines and LFG flares as compared to those for US power generation (ie the average emission factor for the mix of technologies used for electricity production) Note that upstream emissions of the US average mix are substantial (155 g VOCMMBtu 376 g NOxMMBtu 274 g PM10MMBtu 685 g PM25MMBtu and 283 g CH4MMBtu) while LFG produces no upstream emissions
36 LIQUEFACTION
For LNG production the clean gas is liquefied at the recovery site for both on-site and off-site fueling pathways Clean gas is cooled to ndash260degF and if necessary a post-purification step is used to further enhance the quality of LNG This is usually accomplished by flash evaporation of nitrogen Produced LNG is stored on-site as a cryogenic liquid in insulated storage vessels at 50ndash150 psi
Efficiency is the primary determinant of energy use and emissions associated with NG liquefaction Efficiency data for several technologies of interest to this analysis are summarized in Table 5 According to Brendeng and Hetland (2004) the propane pre-cooled mixed refrigerant (C3MR) process accounts for nearly 80 of large-scale liquefaction units and almost 90 of global capacity Although representing a smaller share of global capacity the single mixed refrigerant (SMR) and expander processes are considered good candidates for small-scale liquefaction and are already used in some LFG projects (Cook et al 2005 GTI 2007 Prometheus Energy Corp 2007) In this study SMR and expander processes are assumed to be representative of small-scale liquefaction and thus the default NG liquefaction efficiency is set to 89 which is relatively lower than the large-scale efficiency assumption (91) used elsewhere in GREET Appendix A contains a more detailed discussion of the liquefaction calculations and assumptions used in this analysis
25
TABLE 5 Plant Efficiencies of NG Liquefaction Technologies (Vink and Nagelvoort 1998)
Technology C3MRa Cascade DMRb SMRc Expander
Plant Efficiency () 907 890 905 894 882 a
b C3MR Propane pre-cooled mixed refrigerant DMR Dual mixed refrigerant
c SMR Single mixed refrigerant
37 TRANSPORTATION AND DISTRIBUTION
As mentioned earlier the produced CNGLNG can be dispensed at an on-site fuel station or transported to off-site fuel stations via pipeline (if CNG) or heavy-duty truck (if LNG) For off-site fueling GREET default assumptions are used to calculate feedstock loss and transport energy consumption but transport distance is reduced to 50 miles
371 Transportation and Distribution of CNG
Assuming that the pressure of the produced NG is high enough to be directly injected into a local distribution system (200 psig) no addition energy consumption or emissions are considered for both on-site and off-site CNG cases other than those in conjunction with dispensing into a CNG-fueled vehicle At fuel stations the produced NG is compressed to 4000 psia by electric compressors The electric compressors at an on-site station are assumed to use electricity supplied by the on-site LFG-fueled generator while those at off-site stations are powered by grid electricity Compression efficiency defined as the heating value of the compressed gas divided by the sum of energy used during NG compression and the heating value of the compressed gas is calculated from the following formula based on an adiabatic process (Wang et al 2001)
Compression Efficiency =
FD Wmin +
FDCE x EE
where
Wmin
N k M
= = = =
minimum work required for gas compression (W) number of compression stages (6 for off-site 5 for on-site fuel stations) ratio of specific heats (132 for NG) mass flow (kgs)
26
R = universal gas constant (Jkg K 518 for NG) T = temperature (K) Z = compressibility factor obtained from the Redlich-Kwong equation of state P2 = final pressure (4000 psia for fuel station) P1 = initial pressure (200 psia for on-site stations 50 psia for off-site fuel
stations)
Compression Efficiency = overall efficiency of compression FD = fuel delivered (kW) CE = work efficiency of compressors (80 for pipeline and 65 for fuel station)
and EE = engine efficiency (92ndash95 with electric motors)
372 Transportation and Distribution of LNG
As mentioned earlier LNG can be dispensed at an on-site fuel station or transported to off-site fuel stations via cryogenic tank truck Trucks are assumed to be fueled by either LFG-based LNG from the plant or petroleum diesel If LFG-based LNG is used the direct NG consumption is excluded from fossil fuel accounting but not total energy accounting since the produced LNG is a renewable fuel Also avoided emissions (from the flare) due to the LFG-based LNG use are considered credits
38 VEHICLE OPERATION
Fuel economy is essential for estimating fuel cycle results per mile traveled In this study we assume that light-duty vehicles (LDVs) operate on CNG while heavy-duty vehicles (HDVs especially refuse trucks) operate on LNG Thus results for CNG- and LNG-fueled vehicles are compared to those for conventional gasoline (CG) LDVs and diesel (CD) HDVs respectively We also assume that CG LDVs achieve the GREET default fuel economy and emissions and that CNG LDVs are as efficient as CG LDVs
On the other hand LFG-based LNG is expected to fuel buses and refuse trucks The latter application is particularly appealing since vehicles could be fueled on-site in the course of their normal duty cycle As with LDVs results for a ldquoper mile traveledrdquo metric require estimating the fuel economy of diesel- and LNG-fueled HDVs Refuse truck fuel economy is reported in only a few publications According to Chandler et al (2001) the fuel economy of diesel-fueled refuse trucks is 257 mpg Transit bus fuel economy is more readily available According to Watt (2000) Chandler et al (2000) Chandler et al (2006) and Barnitt et al (2006) current diesel-fueled transit buses are 20 more fuel efficient than CNGLNG-fueled buses However this advantage is likely to drop as manufacturers equip new diesel buses with particulate traps and other controls in order to meet stiff 2010 emissions standards Cummins-Westportrsquos new ISL G line of natural gas engines is already achieving fuel efficiencies that more closely mirror diesel fuel efficiencies (CWI 2009) For this study we assume that diesel-fueled HDVs will be 10 more fuel-efficient than LNG-fueled HDVs
27
HDV emission factors for CO PM and NOx are based on EPArsquos engine certification data for Cummins ISL G engines (EPA 2010b) converted to gmi by using conversion factors and brake specific fuel consumption (BSFC) for heavy-duty vehicles provided by ARCADIS Geraghry amp Miller Inc (2002) Since hydrocarbon emissions (including CH4 and VOC) are below detection limits in the certification data base emission factors for these pollutants are set to zero N2O emission factors are based on existing GREET defaults while SOx and CO2
emissions are estimated from carbon and sulfur balance calculations Table 6 summarizes the resulting emission factors for diesel- and LNG-fueled heavy-duty trucks
TABLE 6 Emission Factors for Diesel- and LNG-Fueled Heavy-Duty Trucks
Emissions by Pollutant (gmi)
Fuel VOC CO NOx PM10 PM25 SOx CH4 N2O CO2
DieselLNG
0 0
008 660
166 105
0007 0
0007 0
0024 0
0 0
010 009
3533 2857
28
4 RESULTS AND DISCUSSION
Total energy fossil energy criteria pollutant emissions and greenhouse gas emissions for 10 LFG-based pathways have been added to the GREET model WTW results are discussed below
41 ENERGY AND GREENHOUSE GAS EMISSION RATES
Total energy use per MMBtu of fuel consumed ldquoat the wheelrdquo is nearly flat for the four LFG-to-CNG-based pathways and roughly comparable to LNG from NA NG and petroleum diesel pathways The six LFG-to-LNG pathways are roughly comparable to each other and to the petroleum gasoline pathway CNG from NA NG has somewhat lower WTW energy use than other pathways because fossil NG processing consumes substantially less energy than either LFG-based processing or petroleum refining
Fossil energy use and GHG emissions present a very different picture Because vehicle operation uses renewable LFG-based fuel GREET results show a significant reduction in WTW fossil fuel use and GHGs for all LFG-based pathways The largest reductions are for LFG-to-CNG pathways using LFG-fueled on-site power generation With on-site vehicle fueling (ie no TampD for the produced CNG) fossil fuel use is completely eliminated
411 WTW Energy
Figure 14 compares well-to-pump (WTP) pump-to-wheels (PTW) and well-to-wheels (WTW) energy use for each LFG-based pathway with similar results for fossil NG (CNG from NA NG LNG from NA NG) gasoline from conventional petroleum and diesel from conventional petroleum Petroleum-based pathways are shown to permit comparison with cases in which the LFG-based fuel replaces gasoline in light-duty vehicles or diesel in heavy-duty vehicles Since LFG-based LNG could replace diesel in refuse haulers or transfer trucks the latter case is particularly interesting to operators of landfills or fleets of waste collection vehicles
As stated earlier WTW total energy use (the sum of WTP and PTW bars in Figure 14) depends largely on system efficiency Thus landfill gas-based CNG typically requires more total energy than fossil CNG or petroleum gasoline and LFG-based LNG requires more total energy than fossil LNG or petroleum diesel Because compression is more energy efficient than liquefaction LNG requires more total energy than CNG By contrast the choice of process fuel in NG processing or for TampD has little effect on WTW total energy use because the difference in energy efficiency is relatively small and total energy use is dominated by vehicle operation (PTW)
29
To
tal E
ner
gy
(Btu
mm
Btu
) 1400000
1200000
1000000
800000
600000
400000
200000
0
RC-1 RC-2 RC-3 RC-4 CNG CG RL-1 RL-2 RL-3 RL-4 RL-5 RL-6 LNG LSD
On-site Off-site On-site Off-site On-site Off-site LNG
Off-site Diesel
On-site Off-site LNG
Off-site Diesel
Distributed Generation Grid Electricity NA NG Distributed Generation Grid Electricity NA NG
Compressed Natural Gas Gasoline Liquefied Natural Gas Diesel
PTW
WTP
FIGURE 14 WTP PTW and WTW Energy Use for LFG-to-CNGLNG Pathways versus Fossil NG-to-CNGLNG Gasoline and Diesel Pathways
Table 7 displays WTW energy use by stage for LFG-to-CNG pathways Pathways using on-site power generation (with on-site or off-site vehicle fueling) and grid electricity are shown as are pathways for CNG from NA NG (with off-site fueling) and for petroleum gasoline Cells corresponding to subcategories are shown without shading while cells corresponding to subtotals for WTP and WTW energy are shaded gray As discussed earlier the life cycle for LFG-based fuels begins with fuel production hence there are no entries for feedstock recovery or feedstock transportation in Table 7 Fuel production and vehicle operation are the main energy-consuming stages Because production of CNG from LFG is on a much smaller scale and requires more cleanup than CNG from NA NG it uses 4ndash5 times the fuel production energy of CNG from NA NG Nonetheless production of CNG from LFG uses less energy than production of petroleum gasoline Adding its far greater energy expenditure for TampD (primarily for compression during vehicle fueling) CNG from LFG has comparable WTP and WTW energy use to petroleum gasoline (but not CNG from NA NG which it exceeds by 30ndash35)
By definition PTW (or vehicle operation) energy use has a value of 1000000 (1000000 fuel Btu per 1000000 Btu of energy use) for all pathways shown in Table 7 Since grid electricity is more energy efficient than on-site generation fuel production with grid electricity uses approximately 10 less energy
Table 8 contains a comparable breakdown of WTW energy use for LFG-to-LNG NA NG-to-LNG and petroleum diesel pathways Pathways using on-site power generation (with on-site or off-site vehicle fueling) and grid electricity are shown as are pathways using LFG-based LNG or petroleum diesel for fuel TampD Again feedstock recovery and transmission stages do not apply to LFG-based pathways fuel production is the major energy expenditure use of distributed power increases energy use and vehicle efficiencies are set to 1000000 Here however LNG from LFG uses approximately 50 more energy WTP than LNG from NA NG
30
TABLE 7 WTW Total Energy Use for LFG-to-CNG Pathways by Stage (BtuMM Btu produced)
Landfill Gas-Based Compressed Natural Gas CNG from
Electricity Source Distributed Generation US Average Generation Mix NA NG
TampD (Compression) On-Site Off-Site On-Site Off-Site Off-Site Gasoline
Feedstock Recovery 0 0 0 0 31398 42868 Feedstock Transmission 0 0 0 0 0 10660 Fuel Production 177935 169554 152132 152188 31965 190407 Fuel TampD 49819 73022 48605 73022 86287 6808 WTP 227754 242576 200737 225210 149651 250743 Vehicle Operation 1000000 1000000 1000000 1000000 1000000 1000000 WTW 1227754 1242576 1200737 1225210 1149651 1250743
TABLE 8 WTW Total Energy Use for LFG-to-LNG Pathways by Stage (BtuMM Btu produced)
Landfill Gas-Based Liquefied Natural Gas LNG from
Electricity Source Distributed Generation US Average Generation Mix NA NG
Off-Site Off-Site Off-Site Off-Site Off-Site TampD On-Site LNG Diesel On-Site LNG Diesel Diesel Diesel
Feedstock Recovery 0 0 0 0 0 0 31669 42835 Feedstock Transmission
0 0 0 0 0 0 961 10652
Fuel Production 294643 293469 293469 264590 263412 263412 142338 133918 Fuel TampD 0 6608 6137 0 6485 14104 6313 WTP 294643 300077 299607 264590 269897 189072 193718 Vehicle Operation 1000000 1000000 1000000 1000000 1000000 1000000 1000000 1000000 WTW 1294643 1300077 1299607 1264590 1269897 1269550 1189072 1193718
6137 269550
412 WTW Fossil Energy
Figure 15 compares WTP PTW and WTW fossil fuel use for each LFG-based pathway with CNG from NA NG LNG from NA NG gasoline from conventional petroleum and diesel from conventional petroleum Note that for landfill gas-based pathways vehicle operation (PTW) requires no fossil fuels since the LFG-based fuels are renewable Plus if landfill gas is the feedstock NG processing and liquefaction require little or no fossil fuel (depending on whether on-site generators or grid power are used for process needs) and only a small amount of fossil fuel is consumed during transportation and distribution depending on TampD method
Table 9 displays WTW fossil fuel use by stage for LFG-to-CNG pathways Pathways using on-site power generation (with on-site or off-site vehicle fueling) and grid electricity are shown as are pathways for CNG from NA NG and for petroleum gasoline As above PTW fossil fuel use (for vehicle operation) is assigned a value of 1000000 (1000000 Btu1000000 Btu) for the CNG-from-NA NG pathway For the petroleum gasoline pathway this value is reduced slightly to reflect the ethanol content of the gasoline fuel pool For renewable pathways fossil fuel use is zero
31
Fo
ssil
Fu
els
(Btu
mm
Btu
) 1400000
1200000
1000000
800000
600000
400000
200000
0
RC-1 RC-2 RC-3 RC-4 CNG
On-site Off-site On-site Off-site
Distributed Generation Grid Electricity NA NG
Compressed Natural Gas
PTW
WTP
CG
Gasoline
RL-1 RL-2 RL-3
On-s ite Off-site Off-s ite LNG Diesel
Distributed Generation
RL-4 RL-5 RL-6 LNG LSD
On-site Off-site Off-site LNG Diesel
Grid Electricity NA NG
Liquefied Natural Gas Diesel
FIGURE 15 WTW Fossil Fuel Use for LFG-Based Pathways versus NA NG and Petroleum Gasoline and Diesel Pathways
TABLE 9 WTW Fossil Fuel Use for LFG-to-CNG Pathways by Stage (BtuMM Btu produced)
Landfill Gas-Based Compressed Natural Gas
Electricity Source Distributed Generation US Average Generation Mix CNG from
NA NG
TampD (Compression) On-Site Off-Site On-Site Off-Site Off-Site Gasoline
Feedstock Recovery Feedstock Transmission Fuel Production Fuel TampD WTP Vehicle Operation WTW
0
0 0 0 0 0 0
0
0 0
62892 62892
0 62892
0
0 131549
42029 173577
0 173577
0
0 131597
62892 194489
0 194489
31290
0 31668 76376
139333 1000000 1139333
41363
10517 170067
6753 228700 979201
1207901
Depending on whether vehicle fueling is on-site or off-site LFG-based CNG using on-site or distributed power can consume no fossil fuel WTP or about half that consumed by CNG from NA NG On a WTW basis LFG-based CNG can consume 0ndash15 of the fossil fuel consumed by petroleum gasoline
Petroleum gasoline petroleum diesel and NA NG-to-LNG pathways consume similar amounts of fossil fuel Because of relatively higher processing efficiency CNG from NA NG uses somewhat less fossil fuel WTP than petroleum gasoline or LNG pathways
Table 10 provides comparable results for LFG-to-LNG pathways Again pathways using on-site power generation and grid electricity are shown as are pathways for LNG from NA NG and petroleum diesel and PTW fossil fuel use is assigned a value of 1000000 for all fossil
32
TABLE 10 WTW Fossil Fuel Use for LFG-to-LNG Pathways by Stage (BtuMM Btu produced)
Landfill Gas-Based Liquefied Natural Gas LNG from
Electricity Source Distributed Generation US Average Generation Mix NA NG
Off-Site Off-Site Off-Site Off-Site Off-Site TampD On-Site LNG Diesel On-Site LNG Diesel Diesel Diesel
Feedstock Recovery 0 0 0 0 0 0 31559 41332 Feedstock Transmission 0 0 0 0 0 0 950 10509 Fuel Production 0 0 0 227749 227772 227772 141306 132119 Fuel TampD 0 0 4820 0 933 4820 14077 6256 WTP 0 0 4820 227749 228705 232592 187892 190215 Vehicle Operation 0 0 0 0 0 0 1000000 1000000 WTW 0 0 4820 227749 228705 232592 1187892 1190215
pathways and zero for all renewable pathways As shown in the table if the electricity source for fuel production is grid electricity LFG-to-LNG pathways consume more fossil fuel than LFG-to-CNG pathways largely because of differences in process efficiency By contrast if the LFG pathways use on-site distributed power and vehicles using the produced fuel are refueled off-site the LFG-to-LNG pathways consume less fossil fuel than LFG-to-CNG pathways because CNG TampD (grid electricity use for NG compression by electric compressor) is more energy-intensive than LNG TampD (LFG-based LNG and diesel use for trucking) On a WTW basis LFG-based LNG can consume 0ndash19 of the fossil fuel consumed by petroleum diesel
413 WTW Greenhouse Gas Emissions
Figure 16 shows WTP PTW and WTW greenhouse gas emissions by pathway stage for LFG-based pathways as compared with petroleum gasoline or CNG (from NA NG) pathways for light-duty vehicles and petroleum diesel or LNG (from NA NG) pathways for heavy-duty vehicles Note that GHG emissions are expressed as grams carbon-dioxide equivalent (g CO2e) per unit energy produced Because of credits LFG-based pathways generate far fewer GHG emissions than petroleum gasoline or diesel pathways
As shown in Figure 16 WTW GHG emissions generally follow the same trend as WTW fossil fuel use (Figure 15) Gasoline- and diesel-fueled vehicles emit more GHGs than comparable CNG- or LNG-fueled vehicles Thus GHG emissions are substantially higher for petroleum-based pathways
Tables 11 and 13 provide detailed results for GHG emissions by pathway stage in terms of grams per million Btu while Tables 12 and 14 provide the results in terms of grams per MJ Note that GHG results shown here are substantially different from the fossil fuel results shown in Tables 9 and 10 In the GHG calculations GHGs are assumed to be captured and stored in the fuel during fuel production and released during vehicle operation Thus GHG emissions for vehicle operation (as shown in Table 11) tend to be considerably higher than the fossil fuel values shown in Table 9 the reverse is true for WTP fossil fuel use and GHG emissions
33
-80000
-60000
-40000
-20000
0
20000
40000
60000
80000
100000
RC-1 RC-2 RC-3 RC-4 CNG CG RL-1 RL-2 RL-3 RL-4 RL-5 RL-6 LNG LSD
On-site Off-site On-site Off-site On-site Off-site LNG
Off-site Diesel
On-site Off-site LNG
Off-site Diesel
Distributed Generation Grid Electricity NA NG Distributed Generation Grid Electricity NA NG
Compressed Natural Gas Gasoline Liquefied Natural Gas Diesel
GH
G E
mis
sio
ns
(g C
O2e
qm
mB
tu)
-76
-56
-36
-16
4
24
44
64
84
GH
G E
mis
sio
ns
(g C
O2eq
MJ)
PTW
WTP
WTW
FIGURE 16 WTW GHG Emissions for LFG-Based Pathways Compared with NA NG and Petroleum Gasoline and Diesel Pathways
TABLE 11 WTW GHG Emissions for LFG-to-CNG by Pathway Stage (g CO2eMM Btu produced)
Landfill Gas-Based Compressed Natural Gas CNG from
Electricity Source Distributed Generation US Average Generation Mix NA NG
TampD (Compression) On-Site Off-Site On-Site Off-Site Off-Site Gasoline
Feedstock Recovery 0 0 0 0 3758 3153 Feedstock Transmission 0 0 0 0 0 2635 Fuel Production -64988 -59119 -47328 -47551 4012 13532 Fuel TampD 3467 6460 4190 6460 9914 549 WTP -61521 -52659 -43138 -41091 17684 19869 Vehicle Operation 60484 60484 60484 60484 60484 77594 WTW -1036 7825 17346 19393 78169 97463
TABLE 12 WTW GHG Emissions for LFG-to-CNG by Pathway Stage (g CO2eMJ produced)
Landfill Gas-Based Compressed Natural Gas CNG from
Electricity Source Distributed Generation US Average Generation Mix NA NG
TampD (Compression) On-Site Off-Site On-Site Off-Site Off-Site Gasoline
Feedstock Recovery 00 00 00 00 36 30 Feedstock Transmission 00 00 00 00 00 25 Fuel Production -616 -560 -449 -451 38 128 Fuel TampD 33 61 40 61 94 05 WTP -583 -499 -409 -389 168 188 Vehicle Operation 573 573 573 573 573 735 WTW -10 74 164 184 741 924
34
TABLE 13 WTW GHG Emissions for LFG-to-LNG by Pathway Stage (g CO2eMM Btu produced)
Landfill Gas-Based Liquefied Natural Gas LNG from
Electricity Source Distributed Generation US Average Generation Mix NA NG
Off-Site Off-Site Off-Site Off-Site Off-Site TampD On-Site LNG Diesel On-Site LNG Diesel Diesel Diesel
Feedstock Recovery 0 0 0 0 0 0 3790 4706 Feedstock Transmission 0 0 0 0 0 0 250 2635 Fuel Production -57831 -61155 -61155 -37810 -41132 -41133 11727 10328 Fuel TampD 0 3331 3711 0 3413 3711 1980 506 WTP -57831 -57824 -57444 -37810 -37719 -37421 17748 18175 Vehicle Operation 60198 60198 60198 60198 60198 60198 60198 79719 WTW 2367 2374 2754 22388 22479 22777 77946 97894
TABLE 14 WTW GHG Emissions for LFG-to-LNG by Pathway Stage (g CO2eMJ produced)
Electricity Source
Landfill Gas-Based Liquefied Natural Gas
Distributed Generation US Average Generation Mix LNG from
NA NG
TampD On-Site Off-Site
LNG Off-Site Diesel On-Site
Off-Site LNG
Off-Site Diesel
Off-Site Diesel Diesel
Feedstock Recovery 00 00 00 00 00 00 36 45 Feedstock Transmission 00 00 00 00 00 00 02 25 Fuel Production -548 -580 -580 -358 -390 -390 111 98 Fuel TampD 00 32 35 00 32 35 19 05 WTP -548 -548 -544 -358 -358 -355 168 172 Vehicle Operation 571 571 571 571 571 571 571 756 WTW 22 22 26 212 213 216 739 928
42 ENERGY AND GREENHOUSE GAS EMISSIONS PER MILE TRAVELED
421 LFG-Based CNG
As shown in Figure 17 total energy use across all LFG-to-CNG pathways and for the petroleum gasoline pathway is nearly flat Total energy use is slightly higher for petroleum gasoline and slightly lower for LFG-to-CNG pathways with grid electricity Because of lower process energy use the NA NG-based CNG pathway consumes approximately 5ndash8 less energy per mile traveled than other pathways
However this relative advantage disappears when compared on the basis of either fossil fuel use or GHG emissions per mile traveled (Figures 18 and 19) Although approximately 6 better than petroleum gasoline CNG from NA NG consumes more fossil fuel and emits more GHGs than LFG-based CNG Because vehicle operation uses renewable LFG-based fuel GREET results show a reduction in WTW fossil fuel use and GHGs of 76ndash100 for LFG-based pathways as compared with fossil NA NG
35
10000
8000
6000
4000
2000
0
FIGURE 17 Energy Use for CNG from LFG or Fossil NA NG versus Petroleum Gasoline (Btumi)
RC-1 RC-2 RC-3 RC-4 CNG CG
On-site Off-s ite On-site Off-site
Distributed Generation Grid Electricity NA NG
Compressed Natural Gas Gasoline
PTW
WTP
To
tal
En
erg
y (
Btu
mi)
RC-1 RC-2 RC-3 RC-4 CNG CG
On-site Off-site On-site Off-site
Distributed Generation Grid Electricity NA NG
Compressed Natural Gas Gasoline
PTW
WTP
FIGURE 18 Fossil Fuel Use for CNG from LFG or Fossil NA NG versus Petroleum Gasoline (Btumi)
10000
Fo
ss
il F
ue
ls (
Btu
mi)
8000
6000
4000
2000
0
36
700
600
500
400
300
GH
G E
mis
sio
ns
(g C
O2eq
mi)
200
100
0
-100 RC-1 RC-2 RC-3 RC-4 CNG CG
On-site Off-s ite On-site Off-site
Distributed Generation Grid Electricity NA NG
Compressed Natural Gas Gasoline
-63
-13
38
88
138
188
238
288
338
388
438
GH
G E
mis
sio
ns
(g C
O2e
qk
m)
FIGURE 19 GHG Emissions for CNG from LFG or Fossil NA NG versus Petroleum Gasoline (g CO2emi or km)
422 LFG-Based LNG
With the exception of petroleum diesel energy-use-per-mile-traveled is relatively flat for the pathways examined As shown in Figure 20 total energy use is slightly higher for LFG-to-LNG pathways as compared with LNG from fossil NA NG Because of lower process energy use and more fuel efficient vehicle operation the petroleum diesel pathway consumes approximately 10ndash17 less energy per mile traveled than other pathways
However this relative advantage disappears when compared on the basis of either fossil fuel use or GHG emissions per mile traveled (Figures 21 and 22) Although still approximately 10 better than LNG from fossil NA NG diesel consumes far more fossil fuel than LFG-based pathways Because vehicle operation uses renewable LNG GREET results show a significant reduction in WTW fossil fuel use and GHGs for all LFG-based pathways Although LNG from fossil NA NG emits approximately 12 less GHGs than the petroleum diesel pathway (primarily due to cleaner vehicle operation) LFG-based pathways reduce GHGs by 72ndash97
37
RL-1 RL-2 RL-3 RL-4 RL-5 RL-6 LNG LSD
On-site Off-site LNG
Off-site Diesel
On-site Off-site LNG
Off-site Diesel
Distributed Generation Grid Electricity NA NG
Liquefied Natural Gas Diesel
PTW
WTP
FIGURE 20 Energy Use for LNG from LFG or Fossil NA NG versus Petroleum Diesel (Btumi)
To
tal E
ner
gy
(Btu
mi)
70000
60000
50000
40000
30000
20000
10000
0
Fo
ssil
Fu
els
(Btu
mi)
70000
60000
50000
40000
30000
20000
10000
0
PTW
WTP
RL-1 RL-2 RL-3 RL-4 RL-5 RL-6 LNG LSD
On-site Off-site Off-site On-site Off-site Off-site LNG Diesel LNG Diesel
Distributed Generation Grid Electricity NA NG
Liquefied Natural Gas Diesel
FIGURE 21 Fossil Fuel Use for LNG from LFG or Fossil NA NG versus Petroleum Diesel (Btumi)
38
GH
G E
mis
sio
ns
(g C
O2e
qm
i) 5000
4000
3000
2000
1000
0
RL-1 RL-2 RL-3 RL-4 RL-5 RL-6 LNG LSD
On-site Off-site LNG
Off-site Diesel
On-site Off-site LNG
Off-site Diesel
Distributed Generation Grid Electricity NA NG
Liquefied Natural Gas Diesel
3000
2500
2000
1500
1000
500
0
GH
G E
mis
sio
ns
(g C
O2e
qk
m)
FIGURE 22 GHG Emissions for LNG from LFG or Fossil NA NG versus Petroleum Diesel (g CO2emi or km)
43 BALANCING ENERGY EFFICIENCY WITH GREENHOUSE GAS EMISSIONS
Grid electricity is almost always more energy efficient than LFG-fueled generators since the formerrsquos fuel source is more energy dense and power plants can achieve better process integration and on-line operation at larger scale Thus LFG-based pathways are often less energy efficient than petroleum and NA NG-based pathways However because LFG-based CNG and LNG are renewable fuels total energy use is not a relevant metric for comparison with fossil fuels By definition renewable energy is not ldquoconsumedrdquo Within the timeframe of lifecycle analysis (eg 100 years) the supply of renewable energy is infinite and there is no detriment to tapping larger quantities Thus renewable energy ldquouserdquo is irrelevant and a renewable pathway is preferable to a non-renewable one on the basis of total energy use13
On the other hand we can compare the fossil fuel use and emissions of renewable and non-renewable fuel pathways because the relevant systems can be well defined and the units of analysis can be properly measured As a result although comparisons of total energy fossil energy and greenhouse gas emissions are presented above the reader is urged to focus on fossil energy and greenhouse gas emissions Those are the key comparisons between two fundamentally different types of fuel pathways
13 Among renewable pathways however it can be argued that lower energy pathways are preferable (all other things equal) since more work can be produced for a given quantity of energy thereby increasing the benefit to society (eg by increasing displacement of imported oil)
39
44 CO-PRODUCT AND RENEWABLE ENERGY CREDITS
In addition to generating excess power to the grid (ie co-product electricity) LFG-based pathways may produce elemental sulfur ash and carbon dioxide (CO2) as well as renewable energy credits14 Since ash would have been produced from the flare in the reference case (see Figure 6) it is not considered a by-product of LFG-based pathways Similarly capturing sulfur upstream (instead of at the flare) is not a net change Thus CO2 is the major potential co-product Although not a co-product per se renewable energy credits are an important side benefit since they can provide significant financial incentives to LFG fuel projects
441 Carbon Dioxide
Each year some 50 million short tons of CO2 for chemical or mechanical use are produced from US wells Production from industrial processes accounts for another 15 million tons The vast majority (35 million short tons) is used for enhanced oil recovery (EOR) mostly via pipeline from large supplies While by-product CO2 produced from LFG conversion to natural gas could serve nearby EOR needs or supplement pipeline supplies geography and scale are likely to limit its market potential
Similarly CO2 produced from LFG is unlikely to penetrate the beer or carbonated soft drink market since ample quantities of ldquofood-graderdquo CO2 are available from natural or other sources including ethanol processing So despite the ability of some LFG-to-NG processors to certify their CO2 co-product to food-grade standards the beverage market is unlikely to become a major customer
On the other hand dry ice (solid CO2) urea manufacture and pest control are promising options for LFG-based CO2 co-product Dry ice has long been the refrigerant of choice for packaging and small-lot transport of perishables that must remain frozen until use However since dry ice requires further processing a secondary deposition process would be needed at LFG sites to transform CO2 into blocks and sheets suitable for packaging A more promising market is in chemical manufacturing where CO2 has long played multiple roles as raw material reactant pressurizing agent and coolant Production of various carbonates polycarbonate resins and urea rely on CO2 as a feedstock The urea market is estimated to demand nearly 4 million tonsyr of CO2 which should expand if selective catalytic reduction of NOx in diesel engine exhaust becomes the emission control technology of choice for heavy-duty trucks
Outside California pest fumigation (especially in large-scale grain storage) may be a good logistical match for co-product CO2 Historically ethyl di-bromide (EDB) and methyl bromide (MB) were the main fumigants used in grain storage However EPA banned EDB in 1984 (as a suspected carcinogen) and ordered a phaseout of MB in 2005 (as an ozone-depleting chemical) CO2 and nitrogen are potential alternatives to MB The main advantage of CO2 is that it is toxic to insects and can tolerate up to 3 oxygen in controlled atmospheres which nitrogen cannot A disadvantage is the porosity of most storage facilities which can lose their CO2-rich
14 Since all NG produced from LFG is assumed to be used as a vehicle fuel (with either on-site or off-site fueling) GREET pathways have no NG co-product
40
fumigation atmospheres before the approximately nine days required for full effectiveness If this latter problem can be resolved CO2 application to elevator storage of spring and winter wheat could represent a market for up to 20000 tyr of CO2
Additional uses for CO2 (eg as a foam blowing agent in polyurethane and polystyrene production an aerosol propellant a cleaning agent at paper pulp mills or as a natural plant nutrient in greenhouses) hold limited promise generally circumscribed by geographic proximities and other competing compounds Because of the above-noted uncertainties and the likelihood that market success will be very site-specific co-product CO2 is not represented in the LFG-based pathways developed for this study
442 Renewable Energy Credits and Other Incentives
Thirty-five states currently require electric utilities to generate a minimum share of the power sold within their borders from renewable or alternative energy sources by a given date (Pew 2009) Called ldquoRenewable Portfolio Standardsrdquo (RPSs) most of these mandates specifically include landfill gas as an eligible energy source (Pew 2009 EPA 2009a) Although RPSs focus on replacing fossil with renewable fuels for power generation the concept is likely to be expanded to natural gas in the form of low carbon fuel standards (like those already adopted in California) or greenhouse gas allowances (like those being considered under various carbon cap and trade proposals) Already a few states (eg Montana Michigan and Kansas) frame their RPSs in terms of energy (as opposed to electricity) consumption LFG pathways to vehicle-fuel or pipeline-quality gas may qualify under these latter standards
Several states have adopted or are considering the adoption of regulations permitting utilities to buy sell or trade Renewable Energy Certificates (RECs) in order to comply with RPSs or other mandates RECs are tradable commodities that represent proof that a given amount of electricity was generated from an eligible renewable energy resource In states with a REC program ldquogreenrdquo energy providers (such as producers of LFG-based electricity that is exported to the grid or of pipeline quality gas that is used to generate renewable electricity) are credited with one REC for every 1000 kWh (1 MWh) of electricity produced A certifying agency gives each REC a unique identification number to make sure it does not get double-counted The green energy is fed into the electric grid and the accompanying REC can be sold traded or bartered on the open market The owner of the REC can then claim to have purchased renewable energy even though the energy associated with the REC is sold separately and used by another party (EPA 2009a)
Various federal incentives are available to support LFG projects These include tax credits and funding sources like the Renewable Electricity Production Tax Credit the Business Energy Investment Tax Credit and Clean Renewable Energy Bonds (authorized under Sections 45 48 and 54 respectively of the US Tax Code) Qualified Energy Conservation Bonds and the Renewable Energy Production Incentive (created in 1992 and reauthorized to extend through 2026) Other incentives include Renewable Energy Grants Energy Efficiency and Conservation Block Grants and Innovative Technology loan guarantees Historically most of these incentives have been limited to generating power from LFG and exporting it to the grid Now however a number of them have been expanded to cover facilities ldquofunctionally related and subordinate to the generation facility itselfrdquo (which could include gas cleanup compression and pipeline injection) and funding has been supplemented with appropriations from the American Recovery and Reinvestment Act (ARRA)
41
The waste-to-energy industry is poised for growth as new markets for their ldquogreen powerrdquo emerge and new funding sources provide the wherewithal to accelerate LFG-based fuel development According to David Wentworth president of Renewable Solutions Group ldquoLandfill gas to electricity projects have flourished over the past several decades primarily as a means to capture federal tax benefits but they produce limited environmental benefits when compared to high Btu applicationshellipThe next evolution is landfill gas to pipeline-quality gas projects which can be used to heat homes power natural gas vehicles and illuminate city streets all while providing financial and environmental benefitsrdquo (Pomerantz 2009)
45 CRITERIA POLLUTANT EMISSIONS
Detailed well-to-wheel estimates of criteria pollutant emissions are provided in Appendix B For criteria pollutants like carbon monoxide (CO) emissions are dominated by vehicle operation since relatively little of the pollutant is emitted from fuel production For others (eg NOx PM and SOx) emissions are pathway dependent NOx and PM emissions vary with grid electricity use because the emission factors of the US average power mix (see Table 4) are much higher than those of on-site power generators which in turn are higher than those of LFG flares WTW SOx emissions are virtually eliminated if no grid electricity is used in the pathway because all sulfur emissions are balanced with the credit from the avoided LFG flaring
42
5 CONCLUSIONS
This study characterized landfill gas (LFG) resources and the technologies to convert what until recently was considered a waste product into a renewable fuel for vehicles By using this information several LFG-based pathways were added to the GREET model Results show
bull As compared with North American natural gas (NA NG) or petroleum-based fuel LFG-based fuels require roughly the same quantity of energy for their production transport and utilization in vehicles However with LFG-based fuels much of this energy is considered renewable since it is from organic sources and is replenished naturally
bull LFG-based fuels can save significant amounts of fossil fuel The size of such savings however depends on the amount of electricity used in the pathway
bull LFG-based fuels can dramatically reduce greenhouse gas (GHG) emissions particularly if process energy is supplied by on-site power generators using renewable LFG If process energy is supplied by grid electricity reductions in GHG emissions depend on the US power generation mix
bull WTW criteria pollutant emissions depend on both the amount of electricity used and differences in emission factors between relevant pathway components and the base or reference case (eg CNGLNG versus gasolinediesel vehicles LFG flares versus IC engines LFG gensets versus the average US power generation mix)
Because of limited time and resources this study could not address several issues and concerns Chief among them are emissions of toxics and hazardous substances from landfills These substances are present in the current waste stream and we assume that they are successfully captured and destroyed in the thermal oxidizer (flare) However some argue that LFG capture rates are less than assumed destruction of NMOC and other pollutants is incomplete (contributing to additional emissions) and that some hazardous materials are not adequately sequestered within the landfill These issues are extremely important and merit a detailed examination That examination is beyond the scope of this analysis
This analysis also assumes that conventional waste management strategies will continue to be used and to produce landfill gas comprising some 45ndash50 methane and 35ndash40 CO2 (see Table 2) As noted above LFG capture is uncertain and may change with new technologies like bioreactors or source-separation coupled with anaerobic digestion of organic materials These technologies are extremely promising since they speed waste stabilization and therefore the economic recovery of product gas Beyond this however they may also increase LFG capture rates and methane concentrations in the LFG feed Although extremely important and significant these issues lie outside the system boundary and thus could not be addressed in this analysis
Finally while this study assumes a robust market for LFG-based fuel market issues are beyond the scope of this analysis Because there are many renewable sources for electricity but few for natural gas renewable natural gas may be an increasingly attractive option for entities
43
required to implement low carbon fuel standards and renewable portfolio standards However recent historically low spark spreads between natural gas and electricity prices have given way to low natural gas prices and high spark spreads As a result projects to produce pipeline quality natural gas are less viable in todayrsquos economic climate than they were a couple of years ago However the price differential between natural gas for stationary applications versus competing motor fuels remains significant
44
6 REFERENCES
Acrion Technologies Inc 2009 Acrionrsquos CO2 Wash Process for Contaminants Removal from Landfill Gas accessed Aug 2009 at httpwwwacrioncomCO2washhtm
Air Liquide 2009 Biogas Recovery System accessed Sept 2009 at httpwwwdtaairliquidecomfileotherelementpjplaquette-biogaz57164pdf
ARCADIS Geraghty amp Miller Inc 2002 ldquoUpdate Heavy-Duty Engine Emission Conversion Factors for MOBILE6 Analysis of BSFCs and Calculation of Heavy-Duty Engine Emission Conversion Factorsrdquo EPA420-R-02-005 January 2002
Barnitt R and K Chandler 2006 New York City Transit Hybrid and CNG Transit Buses Interim Evaluation Results National Renewable Energy Laboratory Report NRELTP-540-38843 November
Brendeng E and J Hetland 2004 ldquoState of the Art in Liquefaction Technologies for Natural Gas NATO Science Series Series II Mathematics Physics and Chemistry edited by J Hetland and T Gochitashvili Vol 149
Brinkman N M Wang T Weber and T Darlington 2005 Well-to-Wheels Analysis of Advanced FuelVehicle Systems mdash A North American Study of Energy Use Greenhouse Gas Emissions and Criteria Pollutant Emissions Argonne National Laboratory Argonne IL
California Air Resources Board (CARB) 2009 ARB Adopts Landfill Measure to Reduce Potent Global Warming Gas News Release California Environmental Protection Agency June 25
Chandler K P Norton and N Clark 2001 Waste Managementrsquos LNG Truck Fleet Final Results National Renewable Energy Laboratory Report NRELBR-540-29073 January
Chandler K P Norton and N Clark 2000 Dallas Area Rapid Transitrsquos (DART) LNG Bus Fleet Final Results National Renewable Energy Laboratory Report NRELBR-540-28739 November
Chandler K E Eberts and M Melendez 2006 Washington Metropolitan Area Transit Authority Compressed Natural Gas Transit Bus Evaluation National Renewable Energy Laboratory Report NRELTP-540-37626 April
Cook W W Brown L Siwajek W Sanders and I Botgros 1998 Greenhouse Gas Reduction by Recovery and Utilization of Landfill Methane and CO2 Technical and Market Feasibility Study Boului Landfill Bucharest Romania US DOE Assistant Secretary for Energy Efficiency and Renewable Energy Report DOEEE35034ndashT1 Washington DC
Cook W M Neyman L Siwajek and W Brown 2002 Landfill Gas to LNG and LCO2 2001 Annual Report Brookhaven National Laboratory Upton NY
45
Cook W W Brown L Siwajek M Neyman T Reppert and B Smackey 2005 Production of Liquid Methane Truck Fuel from Landfill Gas Final Report Brookhaven National Laboratory Upton NY
Cummins-Westport Inc (CWI) 2009 ISL G (North America) accessed Sept 2009 at httpwwwcumminswestportcomproductsislgphp
Datta AK and PK Sen 2006 ldquoOptimization of Membrane Unit for Removing Carbon Dioxide from Natural Gasrdquo Journal of Membrane Science 283(1ndash2)291ndash300
Dunn S 2000 ldquoMicropower The Next Electrical Erardquo Worldwatch Paper 151 Worldwatch Institute Washington DC
Electric Power Research Institute (EPRI) 2004 Distributed Energy Resources Emissions Survey and Technology Characterization Electricity Innovation Institute Palo Alto CA
Energy Information Administration (EIA) 2008 US Crude Oil Natural Gas and Natural Gas Liquids Reserves 2007 Annual Report accessed Aug 2009 at httpwwweiadoegov puboil_gasnatural_gasdata_publicationscrude_oil_natural_gas_reserveshistorical2007 cr2007html
EIA 2009a Annual Energy Review 2008 Report No DOEEIA-0384(2008) accessed Aug 2009 at httpwwweiadoegovemeuaercontentshtml
EIA 2009b Natural Gas Year-In-Review 2008 accessed Aug 2009 at httpwwweiadoegov puboil_gasnatural_gasfeature_articles2009ngyir2008ngyir2008html
Finn AJ GL Johnson and TR Tomlinson 1999 ldquoDevelopments in Natural Gas Liquefactionrdquo in Hydrocarbon Processing pp 47ndash59
Franklin Associates a Division of ERG Review of State Solid Waste Management Websites cited in US EPA 2008 Municipal Solid Waste in the United States Facts and Figures for 2007 EPAndash530ndashRndash08ndash010 Office of Solid Waste Washington DC
Gas Technology Institute (GTI) 2007 Liquefied Natural Gas from Landfill Gas Demonstration Grant California Integrated Waste Management Board
Goldstein L B Hedman D Knowles S Freedman R Woods and T Schweizer 2003 Gas-Fired Distributed Energy Resource Technology Characterizations National Renewable Energy Laboratory Report NRELTPndash620ndash34783 Golden CO
Godlove C 2010 Landfill Gas Successes and Challenges in an Increasingly Complex Market SWANArsquos 33rd Annual Landfill Gas Symposium San Diego March 10
Johansson N 2008 Production of Liquid Biogas LBG with Cryogenic and Conventional Upgrading Technology mdash Description of Systems and Evaluations of Energy Balances MS Thesis Lunds University Sweden
46
Kikkawa Y and I Aoki 1999 Gas to Liquid of 21st Century AIChE Spring National Meeting Houston p 48 March 14ndash18
Kikkawa Y and N Nozawa 1999 Optimizing Liquefied Natural Gas Power Chain AIChE Spring National Meeting Houston March 14ndash18
Kikkawa Y and YN Liu 2001 Zero CO2 Emission for LNG Power Chain 13th International Conference and Exhibition on Liquefied Natural Gas PS5ndash3
Kohl A and R Nielsen 1997 Gas Purification 5th ed Gulf Publishing Houston
Lear J and J Burdelski 2009 US Department of EnergyBrookhaven National Laboratory Biomethane Analysis Draft Report
Ludwig V 2009 Landfill Gas to Energy Webcast (transcript and slides) USEPA Feb 18 accessed Aug 2009 at httpwwwepagovcleanenergyenergy-programsstate-andshylocalwebcasthtmlfeb5
Persson M O Joumlnsson and A Wellinger 2006 Biogas Upgrading to Vehicle Fuel Standards and Grid Injection IEA Bioenergy Task 37 ndash Energy from Biogas and Landfill Gas accessed June 28 2010 at httpwwwiea-biogasnetDokumenteupgrading_report_finalpdf
Pew Center on Global Climate Change 2009 Renewable and Alternative Energy Portfolio Standards July 29 accessed Aug 2009 at httpwwwpewclimateorgwhat_s_being_done in_the_statesrpscfm
Pickens TB Pickens Plan undated accessed Sept 2009 at httpwwwpickensplancom theplan
Pomerantz M 2009 ldquoTapping the Trashrdquo Waste Age April 1 accessed Aug 2009 at httpwasteagecomLandfill_Managementlandfill-methane-pipeline-quality-gas-200904
Pomerantz M and L Turcotte 2004 Production of Pipeline Gas from Landfill Gas in Canada Wastecon 2004 Sept 21ndash23 Phoenix
Prometheus Energy Company 2007 Liquefied Natural Gas from Landfill Gas Demonstration Grant California Integrated Waste Management Board
Remeljej CW and AF Hoadley 2006 ldquoAn Exergy Analysis of Small-Scale Liquefied Natural Gas (LNG) Liquefaction Processesrdquo Energy 312005ndash2019
SCS Engineers 2007 Current MSW Industry Position and State of the Practice on Methane Destruction Efficiency in Flares Turbines and Engines prepared for Solid Waste Industry for Climate Solutions July
Segeler CG 1965 Gas Engineers Handbook Industrial Press
47
Sperling Hansen Associates 2007 Highland Valley Centre for Sustainable Waste Management ndash Landfill Gas Utilization Options SHAndashPRJ06014 accessed July 2009 at httpa100govbccaappsdataepichtmldeployepic_project_doc_index_263html
Spillman R 1995 ldquoEconomics of Gas Separation Membrane Processrdquo in Membrane Separations Technology Principles and Applications 3rd Edition (edited by RD Noble SA Stern) Elsevier Science
Sullivan P 2010 The Importance of Landfill Gas Capture and Utilization in the US Council for Sustainable Use of Resources and Earth Engineering Center Columbia University April accessed May 2010 at httpwwwscsengineerscomPapersSullivan_Importance_of_LFG_ Capture_and_Utilization_in_the_USpdf
Syed M G Soreanu P Falletta and M Beland 2006 ldquoRemoval of Hydrogen Sulfide from Gas Streams Using Biological Processes A Reviewrdquo Canadian Biosystems Engineering 4821ndash214
TRC Environmental Corp 2008 Emissions Testing of the Ward Hill Neck Landfill Enclosed Landfill Gas Flare and Landfill Gas Engine prepared for Covanta Haverhill Inc Windsor CT TRC project no 158673-0000-00000 July 21
US Environmental Protection Agency (EPA) 1995 Compilation of Air Pollutant Emission Factors Vol 1 Stationary Point and Area Sources APndash42 5th Edition Research Triangle Park NC
US EPA 2008 Municipal Solid Waste in the United States Facts and Figures for 2007 EPAndash 530ndashRndash08ndash010 Office of Solid Waste Washington DC
US EPA 2010a Energy Projects and Candidate Landfills as of April 2010 accessed May 2010 at httpwwwepagovlmopprojects-candidatesindexhtmlmap-area
US EPA 2010b Engine Certification Data accessed May 2010 at httpwwwepagovoms certdatahtmlargeng
US EPA 2009a Renewable Portfolio Standards An Effective Policy to Support Clean Energy Supply April accessed Aug 2009 at httpwwwepagovchpstate-policyrenewable_fshtml
US EPA Office of Air Quality 2000 Economic Impact Analysis Municipal Solid Waste Landfills EPA-452D-00-005 Sept accessed Sept 2009 at httpyosemiteepagoveeepa riansfvwANA2000-37pdf$fileA2000-37pdf
US EPA Natl Center for Environmental Economics 1996 Landfill Rules Tightened from I Fisher ldquoEPA Rules Require Curbs on Landfillsrsquo Gas Emissionsrdquo New York Times March 3 accessed Sept 2009 at httpyosemiteepagoveeepalibnwletnsf434d5673ac53b1548525 64cd007a8a0d6422179d25e7e87e852564d800092f41OpenDocument
48
University of Florida and University of Central Florida 2008 Florida Bioreactor Landfill Demonstration Project Executive Summary July 1 accessed Aug 2009 at httpwwwbioreactororg
Vink KJ and RK Nagelvoort 1998 Comparison of Baseload Liquefaction Processes in Proc 12th Intl Conference and Exhibition on Liquefied Natural Gas Perth Australia p 36 May 4ndash7
Wang M D He A Finizza T Weber M Miller D Masten G Skellenger and JP Wallace 2001 Well-to-Wheel Energy Use and Greenhouse Gas Emissions of Advanced FuelVehicle Systems mdash North American Analysis General Motors Corporation Argonne National Laboratory BP ExxonMobil Shell accessed July 2009 at httpwwwtransportationanlgov pdfsTA163pdf
Watt GM 2000 Natural Gas Vehicle Transit Bus Fleets The Current International Experience 7th Intl Conference and Exhibition on Natural Gas Vehicles (NGV 2000) Oct 17ndash19 Yokohama Japan
49
APPENDIX A SMALL-SCALE NATURAL GAS LIQUEFACTION
Liquefied natural gas (LNG) is produced by cooling natural gas (NG) to its boiling point (-260degF) at atmospheric pressure A number of different processes (or cycles) can be used the chief types being cascade mixed refrigerant and expander Schematics of the processes are presented in Figure A-1
(a) Cascade Cycle
(b) Mixed Refrigerant Cycle
(c) Expander Cycle
FIGURE A-1 Schematics of NG Liquefaction Processes
The cascade cycle generally uses a different pure refrigerant (propane ethane [or ethylene] or methane) for each of its three stages The major advantage of the cycle is its high efficiency and simplicity of design disadvantages include relatively high capital cost due to the number of refrigerant compression cycles
50
The mixed refrigerant cycle uses a single mixed refrigerant instead of multiple pure refrigerants as in the cascade cycle The refrigerant is usually a mixture of nitrogen methane ethane propane butane and pentane Since it requires only one refrigerant compression cycle its capital cost is relatively low Theoretically a single mixed refrigerant (SMR) cycle should provide sufficient refrigeration to cool NG to its boiling point at atmospheric pressure In practice however a pre-cooling step is needed since the thermo-physical properties of the mixed refrigerant and machinery reduce efficiency Thus the NG feed is usually pre-cooled by a three-stage propane refrigeration cycle (C3MR) or by a separate mixed refrigeration cycle (dual mixed refrigerant (DMR) cycle)
The expander cycle uses an expansion turbine to expand the cycle gas in a near isentropic manner at an appropriate temperature thereby reducing its temperature The expansion generates useful work that is recovered through a booster compressor A major disadvantage of this cycle is its relatively high power consumption compared to either the cascade or MR cycles An expander cycle is however best suited to smaller plants with shorter operating periods because of its relatively rapid and simple start-up and shutdown
NG liquefaction efficiency can be defined in terms of process efficiency or train efficiency depending on the system boundary Process efficiency obtained from specific power includes the power consumed by pre-cooling and liquefaction Train efficiency is the total lower heating value (LHV) of valuable products (LNG and condensate) divided by the LHV of the feed (including energy for pre-cooling liquefaction power generation and utilities) Process efficiencies are documented in many published sources Train efficiencies are less readily available Values and sources of process and trail efficiencies are summarized in Table A-1
TABLE A-1 Process and Train Efficiencies of Major NG Liquefaction Processes
C3MR Cascade DMR SMR Expander
Specific Power (kWhton LNG) Process Efficiency () Vink and Nagelvoort 1998 979 976 Kikkawa and Nozawa 1999 Brendeng and Hetland 2004
976 966
Finn et al 1999 976 979
978
979
975
975
974
973
965 Kikkawa and Liu 2001 980 Remeljej and Hoadley 2006
Average 978 974 978 975 975 969
Train Efficiency () Vink and Nagelvoort 1998 Kikkawa and Aoki 1999 Kikkawa and Liu 2001
907 90
890 905 894 882
51
According to Brendeng and Hetland (2004) nearly 80 of large-scale liquefaction units and almost 90 of global LNG-production capacity currently use C3MR However it is not at all clear that C3MR is the best option for LFG-based liquefaction Most of the sources reviewed for this effort indicate that SMR and expander cycles are good candidates for small-scale liquefaction Moreover for actual LFG-to-LNG projects two current projects (Bowerman and Altamont) use SMR while a pilot project (Burlington) used a nitrogen expander
GREETrsquos default efficiency for large-scale liquefaction is 91 On average SMR and expander cycles respectively take 14 and 40 more specific power than C3MR Assuming that C3MR represents large-scale liquefiers while SMR and expander cycles represent small-scale liquefiers and that the ratio between processing and train efficiencies remains constant we estimate the average train efficiencies of SMR and expander cycles to be 899 and 878 respectively These values compare well to the train efficiencies reported by Vink and Nagelvoort (1998) Using these data GREETrsquos small-scale liquefaction efficiency is set to 89
52
APPENDIX B CRITERIA POLLUTANTS
Estimates of well-to-wheel (WTW) well-to-pump (WTP) and pump-to-wheel (PTW) criteria pollutant emissions for landfill gas (LFG) and fossil fuel-based pathways are shown in Figures B-1 through B-5 When PTW results are negative (eg CO emissions for pathways using grid electricity or NOx emissions for pathways using on-site power generation) the sum of WTP and PTW emissions is drawn as a darker shade of rose and is shown superimposed over its two components
As shown in Figures B-1 B-2 and B-4 LFG-based pathways to CNG use in light-duty vehicles (LDVs) produce WTW CO NOx and PM25 emissions comparable to or less than those of fossil-based pathways to CNG NA NG or petroleum gasoline For heavy-duty vehicles (HDVs) WTW NOx and CO emissions of LFG-based LNG pathways are comparable to those of fossil-based pathways to NA NG or petroleum diesel Because the US generation mix is heavily weighted toward coal displacing grid electricity with on-site power generation virtually eliminates SOx emissions (except for compression at the refueling station which continues to use grid electricity) and results in major reductions in NOx and PM emissions Since most on-site generators have lower NOx PM and SOx PTW emissions are shown as a credit or negative contribution to WTW results in Figures B-1 through B-5 For LNG-fueled vehicles WTW PM10
and SOx emissions are virtually zero
1400
1210
FIGURE B-1 CO Emissions for LFG-Based Pathways Compared with NA NG and Petroleum Gasoline and Diesel Pathways
RC-1 RC-2 RC-3 RC-4 CNG CG RL-1 RL-2 RL-3 RL-4 RL-5 RL-6 LNG LSD
On-site Off-site On-site Off-site On-site Off-site LNG
Off-site Diesel
On-site Off-site LNG
Off-site Diesel
Distributed Generation Grid Electricity NA NG Distributed Generation Grid Electricity NA NG
Compressed Natural Gas Gasoline Liquefied Natural Gas Diesel
PTW
WTP
WTW
1200
1010 1000
CO
(g
mm
Btu
)
0810 800
0610 600
0410 400
200 0210
0 0010
-200 -0190
CO
(g
MJ)
80
100
0081
25
30
53
FIGURE B-2 NOx Emissions for LFG-Based Pathways Compared with NA NG and Petroleum Gasoline and Diesel Pathways
RC-1 RC-2 RC-3 RC-4 CNG CG RL-1 RL-2 RL-3 RL-4 RL-5 RL-6 LNG LSD
On-site Off-site On-site Off-site On-site Off-site LNG
Off-site Diesel
On-site Off-site LNG
Off-site Diesel
Distributed Generation Grid Electricity NA NG Distributed Generation Grid Electricity NA NG
Compressed Natural Gas Gasoline Liquefied Natural Gas Diesel
PTW
WTP
WTW
NO
x (
gm
mB
tu) 0061
60
0041 40
20 0021
0 0001
-20 -0019
10
15
20
RC-1 RC-2 RC-3 RC-4 CNG CG RL-1 RL-2 RL-3 RL-4 RL-5 RL-6 LNG LSD
On-site Off-site On-site Off-site On-site Off-site LNG
Off-site Diesel
On-site Off-site LNG
Off-site Diesel
Distributed Generation Grid Electricity NA NG Distributed Generation Grid Electricity NA NG
Compressed Natural Gas Gasoline Liquefied Natural Gas Diesel
PM
10 (
gm
mB
tu)
PTW
WTP
WTW
FIGURE B-3 PM10 Emissions for LFG-Based Pathways Compared with NA NG and Petroleum Gasoline and Diesel Pathways
0005 5
0000 0
-5 -0005
PM
10 (
gM
J)
NO
x (
gM
J)
0010
0015
0020
0025
60
54
9 P
M2
5 (
gm
mB
tu)
PTW 0007
7 WTP
WTW 0005 5
0003 3
0001 1
-1 -0001
SO
x (g
MJ)
P
M2
5 (
gM
J)
-3
-5
RC-1 RC-2 RC-3 RC-4 CNG
On-site Off-site On-site Off-site
Distributed Generation Grid Electricity NA NG
Compressed Natural Gas
CG
Gasoline
RL-1 RL-2 RL-3
On-site Off-site Off-site LNG Diesel
Distributed Generation
-0003
-0005
RL-4 RL-5 RL-6 LNG LSD
On-site Off-site Off-site LNG Diesel
Grid Electricity NA NG
Liquefied Natural Gas Diesel
FIGURE B-4 PM25 Emissions for LFG-Based Pathways Compared with NA NG and Petroleum Gasoline and Diesel Pathways
RC-1 RC-2 RC-3 RC-4 CNG CG RL-1 RL-2 RL-3 RL-4 RL-5 RL-6 LNG LSD
On-site Off-site On-site Off-site On-site Off-site LNG
Off-site Diesel
On-site Off-site LNG
Off-site Diesel
Distributed Generation Grid Electricity NA NG Distributed Generation Grid Electricity NA NG
Compressed Natural Gas Gasoline Liquefied Natural Gas Diesel
PTW
WTP
WTW 0041
0031
0021
0011
0001
SO
x (g
mm
Btu
)
50
40
30
20
10
0
-10 -0009
FIGURE B-5 SOx Emissions for LFG-Based Pathways Compared with NA NG and Petroleum Gasoline and Diesel Pathways
0051
Argonne National Laboratory is a US Department of Energy laboratory managed by UChicago Argonne LLC
Energy Systems Division Argonne National Laboratory9700 South Cass Avenue Bldg 362Argonne IL 60439-4815
wwwanlgov
- Cover
- Disclaimer
- Title Page
- Contents
- Acknowledgments
- Executive Summary
- 1 Introduction
-
- 11 Background
- 12 US Natural Gas Resources
- 13 Natural Gas as a Vehicle Fuel
- 14 Renewable Natural Gas and GHG Emissions
- 15 Fuel Cycle Analysis
- 16 Scope
-
- 2 Landfill Gas
-
- 21 Resource Base
- 22 Resource Development
- 23 Additions to the Resource Base
- 24 Landfill Gas Composition
-
- 3 Fuel Cycle Analysis of Landfill-Gas Based Pathways
-
- 31 LFG Reference Case
-
- 311 Flaring versus Venting Landfill Gas
- 312 Carbon Fate in LFG Fossil NG and Petroleum Fuel Cycles
-
- 32 Overview of LFG-to CNGLNG Fuel Cycle
- 33 Gas Collection
- 34 Natural Gas Production
-
- 341 Pre-Purification
- 342 CO2 Removal
- 343 Process Efficiency
- 344 Energy Use Accounting
-
- 35 On-Site Power Generation
-
- 351 Technologies
- 352 Criteria Pollutant Emissions
-
- 36 Liquefaction
- 37 Transportationi and Distribution
-
- 371 Transportation and Distribution of CNG
- 372 Transportation and Distribution of LNG
-
- 38 Vehicle Operation
-
- 4 Results and Discussioni
-
- 41 Energy and Greenhouse Gas Emission Rates
-
- 411 WTW Energy
- 412 WTW Fossil Energy
- 413 WTW Greenhouse Gas Emissions
-
- 42 Energy and Greenhouse Gas Emissioins per Mile Traveled
-
- 421 LFG-Based CNG
- 422 LFG-Based LNG
-
- 43 Balancing Energy Efficiency with Greenhouse Gas Emissions
- 44 Co-Product and Renewable Energy Credits
-
- 441 Carbon Dioxide
- 442 Renewable Energy Credits and Other Incentives
-
- 45 Criteria Pollutant Emissioins
-
- 5 Conclusions
- 6 References
- Appendix A Small-Scale Natural Gas Liquefaction
- Appendix B Criteria Pollutants
-