WELL LOG AND CORE-DERIVED RESERVOIR by MELANIE YBARRA ...
55
WELL LOG AND CORE-DERIVED RESERVOIR PROPERTIES OF BARNETT SHALE OF FORT WORTH BASIN by MELANIE YBARRA Presented to the Faculty of the Graduate School of The University of Texas at Arlington in Partial Fulfillment of the Requirements for the Degree of MASTER OF SCIENCE IN GEOLOGY THE UNIVERSITY OF TEXAS AT ARLINGTON December 2014
Transcript of WELL LOG AND CORE-DERIVED RESERVOIR by MELANIE YBARRA ...
WELL LOG AND CORE-DERIVED RESERVOIR
PROPERTIES OF BARNETT SHALE OF
FORT WORTH BASIN
by
MELANIE YBARRA
Presented to the Faculty of the Graduate School of
The University of Texas at Arlington in Partial Fulfillment
of the Requirements
for the Degree of
MASTER OF SCIENCE IN GEOLOGY
THE UNIVERSITY OF TEXAS AT ARLINGTON
December 2014

Copyright © by Melanie Ybarra 2014
All Rights Reserved
ii

Acknowledgements
I would like to express my gratitude to my advisor, Dr. Max Hu, for his support of
my thesis study and research. His sound judgment, advice, and knowledge has helped
guide me through this work.
I would also like to thank Daniel Ortuno and Dr. Qilong Fu from BEG for providing
me with digital well log data for the study well. Drillinginfo has provided myself and our
research team at UTA with access to their site for data gathering. Bill Knights, Gary
Paisley, and Jim Davidson with Netherland, Sewell, and Associates have helped guide
me for years, pointing me to great research, and answering my numerous questions.
Lastly, I would like to thank my family. My husband, Khoji Ybarra, has been my
rock through many years of school, work, and family. I am forever grateful.
November 30, 2014
iii
Abstract
WELL LOG AND CORE-DERIVED RESERVOIR
PROPERTIES OF BARNETT SHALE OF
FORT WORTH BASIN
Melanie Ybarra, M.S.
The University of Texas at Arlington, 2014
Supervising Professor: Qinhong Hu
Wireline tools and log analysis methods were not designed for unconventional
reservoirs. As a result, hydrocarbon assessment for shale source rock plays have
significant uncertainties. This study focuses on petrophysical interpretation uncertainty
from a single historic Barnett Shale well TP Sims #2 of Wise County, TX. The Barnett
Shale is one of the major source rock plays in the United States. The large body of
research and information from the well-drilled Barnett Shale provides a good opportunity
to understand and adjust OGIP modeling approaches from volumetric analysis to well
performance data. Several factors unique to shale source rocks such as TOC and pyrite
have been incorporated into wireline log interpretation using core-derived correlations.
Key petrophysical parameters that are estimated from well logs calibrated to core data
include: mineral volumes, porosity, net pay, and water saturation. Volumetric OGIP
calculations from a range of well log analysis results that have been calibrated to core for
TP Sims #2 are compared with EUR data. The resulting recovery factors are larger than
expected which may mean that volumetric OGIP remains deficient for resource
assessment of shale plays.
iv

Table of Contents
Acknowledgements .............................................................................................................iii
Abstract .............................................................................................................................. iv
List of Illustrations ..............................................................................................................vii
List of Tables ..................................................................................................................... viii
Chapter 1 Introduction......................................................................................................... 1
Resource Assessment Challenges of Unconventional Shale Gas
Reservoirs ....................................................................................................................... 1
Study Objective .......................................................................................................... 3
Overview of Thesis Organization ............................................................................... 4
Geologic Setting of Barnett Shale in Fort Worth Basin .................................................. 5
Structural Evolution and Stratigraphy of the Fort Worth Basin ................................... 5
Depositional Environment of Barnett Formation ........................................................ 8
Barnett-Paleozoic Total Petroleum System .................................................................... 9
Newark East Gas Field ............................................................................................... 9
Geologic Characteristics of Shale Gas Systems .......................................................... 10
Kerogen .................................................................................................................... 10
Total Organic Carbon ............................................................................................... 13
Thermal Maturity and Vitrinite Reflectance .............................................................. 14
Laboratory Adsorption .............................................................................................. 17
Natural Fractures and Maximum Stress Direction ................................................... 18
Chapter 2 Methodology ..................................................................................................... 20
Study Question ............................................................................................................. 20
Petrophysical Modeling of Barnett Shale...................................................................... 20
Mineralogy ................................................................................................................ 20
v

Porosity ..................................................................................................................... 21
Water Saturation ....................................................................................................... 22
Net Pay ..................................................................................................................... 23
Permeability .............................................................................................................. 23
Sorbed Gas Content ................................................................................................. 24
Volumetrics ................................................................................................................... 24
Area .......................................................................................................................... 24
Gas Expansion Factor .............................................................................................. 24
Well Performance ......................................................................................................... 25
Chapter 3 Results ............................................................................................................. 27
Well log and Core-Derived Properties .......................................................................... 27
Original Gas-in-Place.................................................................................................... 36
Chapter 4 Discussion ........................................................................................................ 38
Conclusions .................................................................................................................. 39
Appendix A Core Analysis Data ........................................................................................ 40
References ........................................................................................................................ 43
Biographical Information ................................................................................................... 47
vi

List of Illustrations
Figure 1-1 General structural features of Fort Worth Basin (Montgomery et al., 2005) ..... 6
Figure 1-2 Late Mississippian (325 Ma) paleogeography (Loucks and Ruppel, 2007) ...... 7
Figure 1-3 Ordovician to Pennsylvanian stratigraphy across Fort Worth Basin showing TP
Sims #2 penetration ............................................................................................................ 8
Figure 1-4 Gas petroleum systems ................................................................................... 10
Figure 1-5 Van Krevelen diagram with corresponding kerogen types and approximate
vitrinite reflectance ............................................................................................................ 13
Figure 1-6 Kerogen transformation ratio map of Barnett Shale ........................................ 16
Figure 1-7 Correlation of thermal maturity to gas flow for Barnett Shale wells................. 17
Figure 1-8 Drilling path of TP Sims #2 and nearby wells. ................................................. 19
Figure 2-1 TP Sims production history and EUR .............................................................. 26
Figure 3-1 Techlog shale volume formula......................................................................... 27
Figure 3-2 Shale volume statistics for TP Sims #2 ........................................................... 28
Figure 3-3 Gamma ray correlation to core TOC measurements ...................................... 29
Figure 3-4 Bulk density correlation to core TOC measurements ...................................... 29
Figure 3-5 Statistics of core TOC measurements and log-derived TOC estimates.......... 30
Figure 3-6 Pyrite to TOC correlation from WC Young 2 XRD data .................................. 31
Figure 3-7 Comparison of log-derived grain density to core-derived grain density .......... 32
Figure 3-8 Crossplot of log-derived and whole core porosities......................................... 33
Figure 3-9 Crossplot of log-derived and crushed core porosities ..................................... 33
Figure 3-10 Statistics of water saturation estimates from low and high side cases ......... 34
Figure 3-11 Detailed petrophysical log over Lower Barnett for TP Sims #2 ..................... 34
Figure 3-12 Hydrocarbon pore thicknesses for each porosity cutoff ................................ 36
vii

List of Tables
Table 1-1 Kerogen type, hydrogen content, and origin ..................................................... 12
Table 1-2 Properties of different kerogen types ................................................................ 12
Table 3-1 Neutron and bulk density parameters ............................................................... 28
Table 3-2 Interpreted petrophysical properties for TP Sims #2 for varying cutoffs........... 35
Table 3-3 Hydrocarbon pore volume thickness results for range of cutoffs ..................... 35
Table 3-4 OGIP, EUR, and RF estimates of Lower Barnett Shale .................................. 37
viii
Chapter 1
Introduction
Resource Assessment Challenges of Unconventional Shale Gas Reservoirs
The term unconventional reservoir refers to a reservoir that does not owe its existence to
the buoyancy of gas in water (Schmoker 2002). Shale source rock plays are unconventional
reservoirs that have become important economic resources in the past decades with the advent
and improvement of horizontal drilling and hydraulic fracturing. Since most reservoir
characterization techniques have been developed for conventional reservoirs, there can be large
uncertainties with quantifying original gas-in-place (OGIP) for unconventional reservoirs.
The two main ways to estimate OGIP are from established production history profiles and
volumetric assessment. Barring production problems, accurate estimates of recoverable gas-in-
place from volumetric analyses would closely align with the produced gas volumes (i.e. both
methods would predict similar OGIP). However, using geologic and petrophysical data for
volumetric assessment of OGIP can be difficult for shale source rocks because they contain
organic matter and pyrite that can complicate the interpretation of reservoir properties.
Production-derived estimates of OGIP can be made with well performance data and
recovery factors, and therefore avoid the use of geologic and petrophysical data. Estimates of
ultimate recovery (EUR) can be forecasted from well production profiles. If the recovery factor is
known for a reservoir, the OGIP can be estimated because the EUR to OGIP ratio is the recovery
factor. However, the EUR/RF method of deriving OGIP requires an established production history
and known recovery factor, and lacks applicability to resource assessment in early stages of
exploration. There is a need to accurately quantify and calibrate OGIP volumetric estimates for
shale reservoirs based on geologic and petrophysical data.
Previous work in resource assessment of unconventional gas fields has typically found
that volumetrically-derived recoverable gas-in-place estimates are generated from large total gas-
in-place multiplied by a low recovery factor (Schmoker 2002). Alternatively, assessment methods
that focus on well performance are empirical forecasts of OGIP (Schmoker 2002). EUR based on
1

production profiles has been found to be approximately 204 bcf/section for wells targeting Barnett
Shale of Fort Worth Basin (Jarvie et al., 2007). Total recoverable gas-in-place volumes of 26
trillion cubic feet (tcf) have been estimated by the United States Geological Survey (Pollastro et
al., 2007).
The goals of this study are to explore reservoir characteristics of Barnett Shale from well
log and core analysis, and to compare results from volumetric analysis to well performance
derived analysis of OGIP. Volumetric methods use geologic and petrophysical data to quantify
reservoir characteristics. Mineralogy, porosity water saturation, gas adsorbtion, net pay and
permeability are important factors for reservoir characterization of Barnett Shale that are
discussed in detail. Methods for calculating reservoir properties from well logs that can be
calibrated to core measurements are explored. Factors unique to shale source rock plays, such
as kerogen and ultra-low permeability, and their impact on the volumetric analysis will be
examined, as well as uncertainty associated with the reservoir characteristics of shale plays. The
research herein focuses on calculating recoverable OGIP of Barnett Shale from volumetric
assessment and comparing results to volumes from EUR analysis. The petrophysical properties
as interpreted from core study and well log interpretation are used to obtain estimates of effective
pore space, gas saturation, and net reservoir thickness. Gas property data are used to calculate
gas expansion factor. Uncertainty with porosity and reservoir cutoff criteria are used to define a
range of volumetrically derived OGIP
Key components to quantifying the amount of original gas-in-place within a reservoir are
porosity, net reservoir rock, and hydrocarbon saturation. Shales are characterized by ultra low
permeability. However, hydraulic fracturing of shale reservoirs creates a highly variable two
component permeability system. Organic rich shale plays contain varying amounts and types of
kerogen. Kerogen is decomposed solid organic matter that can often have well-connected gas-
filled pore spaces. The organic solids will have an effect on the wireline log responses and
reservoir properties. Electrical measurements of formation resistivity (used for estimating water
saturation) will be affected by rock, liquid hydrocarbon, and gas hydrocarbons, and also by solid
2
immobile hydrocarbons (kerogen). Also, nuclear tools designed for estimating porosity of the
formation will be affected by the presence of solid organic material in the formation. Quantifying
the solid organic matter and understanding the type of organic matter will affect the wireline tool
analysis, thus affecting the OGIP volumetric estimates of the shale source rock reservoir.
Typical methods designed for estimating porosity are analysis of wireline well log data
and laboratory analysis of cores. The wireline porosity of a conventional reservoir with known
lithology is a relatively simple calculation. However, the presence of organic material in a shale
source rock play fills pore space. This complicates the porosity estimation process as it affects
the wireline tool reading.
Drilling direction of lateral wells is determined by the natural fracture orientation.
Identifying the orientation of a natural fracture system within a source rock play can aid in making
better drilling direction decisions so as to maximize the connectivity and ultimate flow of
hydrocarbons to the wellbore. If a reservoir is naturally fractured, drilling orientation can exploit
the fracture system by increasing the effective net rock that will contribute to production. Wells
drilled orthogonal to the natural fracture network should have greater OGIP estimates than a
similar well at a different orientation to the fracture system.
Study Objective
A review of literature reveals a wide array of geologic factors that affect gas-in-place
estimates of unconventional shale gas reservoirs. An integrated petrophysical and geologic
modeling approach that results in meaningful volumetric estimates is lacking. The objective of this
study is to identify and quantify key factors for shale gas resource assessment in the Barnett
Shale play. Laboratory core measurements and well log data from a gas-producing Barnett Shale
well were used to calibrate a petrophysical model of key rock properties. Specific objectives are:
(1) To develop methods to predict mineralogy, TOC, porosity, and water saturation from
well log measurements that is tied to the core measurements
(2) To use well log-derived analysis to volumetrically estimates OGIP
(3) To compare results of OGIP from volumetrics to well performance estimates
3
Overview of Thesis Organization
The remainder of Chapter 1 is devoted to introducing background information, including
the geologic setting of Barnett Shale, Newark Gas Field history, and geologic characteristics of
shale source rocks. Chapter 2 contains the study’s methodology including the steps used to
calculate volumetrics from well log and core data, and performance-derived estimates of OGIP.
The results are presented in Chapter 3. Chapter 4 will conclude with discussion of the
significance of the results and future study recommendations.
4

Geologic Setting of Barnett Shale in Fort Worth Basin
Gas shales are source rocks that typically cover large areas and are often naturally
fractured. When assessing the hydrocarbon potential of these unconventional accumulations,
depositional setting, burial history, hydrocarbon generation, and structural evolution are important
to understand.
Structural Evolution and Stratigraphy of the Fort Worth Basin
The Fort Worth Basin is a shallow, north-south elongated trough covering approximately
15,000 mi2 in north-central Texas (Pollastro et al., 2007). It is one of several Paleozoic foreland
basins formed by the Ouachita thrust front (Pennsylvanian age). The Ouachita thrust front was
the result of collisional tectonics during the formation of Pangea (Pollastro et al., 2007). Other
basins in this trend include Black Warrior, Arkoma, Kerr, Val Verde, and Marfa basins (Pollastro
et al., 2007).
The basin is northward deepening and the axis trends roughly parallel to the Ouachita
front (Figure 1-1). The eastern boundary generally follows the Ouachita front. The northern
margin is fault-bounded by Pennsylvanian-age Red River and Muenster arches. These basement
uplifts are part of the northwest-striking Amarillo-Wichita uplift trend which has been interpreted to
be the result of basement faults reactivated during Ouachita compression (Pollastro et al., 2007).
To the west, the basin shallows and the boundary trends north-south along the eastern shelf of
the Permian Basin, the Bend arch, and the Concho platform. The domal Llano uplift, which
exposes Precambrian and Paleozoic rocks, bounds the basin to the south.
5

Figure 1-1 General structural features of Fort Worth Basin (Montgomery et al., 2005)
Paleogeographic reconstructions as shown in Figure 1-2 suggest that during the
Mississippian, the Fort Worth Basin area occupied a narrow inland seaway between the rapidly
approaching continents of Laurussia and Gondwana (Loucks and Ruppel, 2007). The
Mississippian Interior seaway was bounded to the west by a broad shallow-water carbonate shelf
(Chappel Shelf) and on the east by Caballos-Arkansas Island Chain. It extended along most of
the southern and southeastern margins of the Laurussian paleocontinent. The Fort Worth basin
formed as a foreland basin on the edge of the Laurussian paleocontinent.
6

Figure 1-2 Late Mississippian (325 Ma) paleogeography (Loucks and Ruppel, 2007)
Based on sediment thickness, the deepest part of the basin was to the northeast.
Approximately 12,000’ of basin fill is preserved in the northeast corner adjacent to the Muenster
arch. About 4000’-5000’ of Ordovician to Mississippian carbonates and shales are overlain by
6000’-7000’ of Pennsylvanian clastics and carbonates. In the eastern portion there is a thin layer
of Cretaceous rocks; however, no Tertiary rocks are present (Loucks and Ruppel 2007).
Present day Mississippian age Barnett Shale of Fort Worth Basin occurs in 38 counties in
north-central Texas as well as nearby basins (Jarvie et al., 2007). Age-equivalent shales are
present along the eastern flank of the Ouachita thrust (Jarvie et al., 2007). Erosion has made the
Barnett absent over the Muenster arch, a Pennsylvanian-age horst block (Loucks and Ruppel
2007).
Figure 1-3 is a generalized cross section and stratigraphic column of Fort Worth Basin.
Devonian and Permian sections are notably absent as the Mississipian Barnett Shale
7

unconformably overlies Ordovician Viola Limestone in the study area of the eastern part of the
Fort Worth basin. The Barnett Shale is conformably overlain by Pennsylvanian Marble Falls
Limestone. The Barnett Shale is therefore overlain and underlain by impermeable limestones. In
the eastern part of the basin, Forestburg limestone separates upper and lower Barnett Shale
(Loucks and Ruppel 2007). This limestone is also the thickest on the southwest side of the
Muenster arch, again indicating large accommodation space to the northeast. The depth of
Barnett Shale is approximately 6500’ - 8500’ and thickness varies from 10’ to over 1000’
(Pollastro et al., 2007).
Figure 1-3 Ordovician to Pennsylvanian stratigraphy across Fort Worth Basin showing TP Sims
#2 penetration
Depositional Environment of Barnett Formation
Barnett strata were deposited in a deep water foreland basin that had poor circulation
with the open ocean (Loucks and Ruppel, 2007). Barnett sediments clearly indicate a deposition
below the storm-wave base, as well as beneath an oxygen-minimum zone. Much of the organic
matter deposited was preserved because bottom waters were euxinic, thus making it a rich
8

source rock. The major components are clay- to silt-sized particles containing abundant pyrite
and phosphate (Hickey and Henk 2007). The main lithofacies that have been described from core
and outcrop study are laminated argillaceous mudstone, laminated siliceous lime mudstone
(marl), and skeletal, argillaceous lime packstone (Loucks and Ruppel, 2007). Sediment transport
is thought to occur via mud plumes, turbidites, and debris flows from shelf or oxygenated slope
deposits (Loucks and Ruppel, 2007). Other main lithofacies identified in core study include
organic rich black shale, fossiliferous shale, dolomite rhomb shale, dolomitic shale, phosphatic
shale, and concretionary carbonate (Hickey and Henk 2007). Extensive early microbial alteration
of abundant organic matter helped to develop these lithofacies (Hickey and Henk 2007).
Sedimentation is believed to occur consistently over an estimated 25-m.y. period.
Barnett-Paleozoic Total Petroleum System
The Barnett-Paleozoic total petroleum system (TPS) of the Fort Worth Basin refers to
thermally mature Barnett Shale that has generated large volumes of hydrocarbons contained both
within the Barnett Shale and those which have been expelled and distributed among numerous
conventional clastic- and carbonate-rock reservoirs of Paleozoic age (Pollastro 2007). The
Barnett Shale is one of the most prolific shale gas-producing formation and is also the primary
source rock for oil and gas produced from other Paleozoic reservoir rocks within the basin.
Newark East Gas Field
Barnett Shale gas wells are designated as the Newark East Gas Field by the Texas
Railroad Commission (TRC). The field was discovered in 1981 by Mitchell Energy. Initial gas
wells had low production rates but Mitchell Energy’s persistence in the Barnett Shale eventually
paid off after drilling technologies in tight reservoirs improved (Martineau 2007). The Barnett
Shale became the first shale play to be developed extensively and altered the US natural-gas
supply significantly (Browning 2013). Devon Energy acquired Mitchell Energy in 2002, and has
continued to improve drilling and completion technologies for increased production within the
Barnett Shale. Nearly 18,000 wells have been drilled as December of 2013 (Nicot et al., EST,
2014).
9

Geologic Characteristics of Shale Gas Systems
While certain geologic aspects of hydrocarbon systems are the same for both shale gas
systems and conventional reservoirs, there are several important characteristics unique to shale
gas systems. As with conventional reservoirs, deposition, maturation, and preservation must have
occurred. However, shale gas systems differ in that they are simultaneously the source, trap, and
reservoir. Figure 1-4 is a diagram highlighting key differences in various reservoir types. Geologic
factors such as mineralogy, organic richness, maturity, and gas adsorption potential are important
when describing the shale gas reservoir characteristics. Natural fracturing is often a main driver
for gas production and storage as significant quantities of gas are stored in large fracture-
connected pore spaces.
Figure 1-4 Gas petroleum systems
Kerogen
Kerogen is a mixture of organic compounds found in sedimentary rocks. It is insoluble in
normal organic solvents and has high molecular weights (Tissot and Welte, 1978). The soluble
portion of organic compounds found in organic matter is bitumen. When kerogen is preserved in
sedimentary rocks and then exposed to temperature and pressure in the oil (50-150 deg C) or
10
gas (150-200 deg C) windows, petroleum is generated from the thermal degradation of kerogen.
This process, known as thermal maturation, occurs with sedimentation and subsidence. As
thermal maturation proceeds, kerogen is subjected to diagenesis, catagenesis and finally
metagenesis (Tissot and Welte, 1978). Kerogen can be classified according to its source
material. Table 1-1 shows the various types of kerogen defined by geochemical characteristics,
and Table 1-2 shows kerogen types and their hydrocarbon source potential (PA DCNR, 2014).
Barnett Shale lies in the thermal gas-generation window and is classified as a type II kerogen
(Jarvie et al., 2004). A chemical analysis method used for classifying organic matter type is by
measuring the relative abundance of elemental carbon (C), oxygen (O), and hydrogen (H) and
plotting the H/C and O/C on a Van Krevelen diagram. A Van Krevelen diagram shows kerogen
evolution pathways for several kerogen types from diagenesis to metagenesis (Tissot and Welte,
1978). Figure 1-5 displays the kerogen evolution pathways for three main kerogen types on a Van
Krevelen plot. Common laboratory pyrolysis techniques estimate the hydrogen index from the
amount of pyrolyzable hydrocarbon, S2, divided by the total organic carbon (TOC), and the
oxygen index from the carbon dioxide produced during pyrolysis, S3, divided by TOC (Tissot and
Welte, 1978). These laboratory measurements are used to determine hydrocarbon potential.
11

.
Table 1-1 Kerogen type, hydrogen content, and origin
Table 1-2 Properties of different kerogen types
12

Figure 1-5 Van Krevelen diagram with corresponding kerogen types and approximate vitrinite
reflectance
Total Organic Carbon
Total organic carbon in the form of kerogen has historically been measured in
laboratories to assess the quality of source rocks. Estimates are obtained by heating the sample
in a furnace and combusting the carbon to carbon dioxide at 600 deg C (TAMU, 2014). The
amount of carbon liberated is related to the organic carbon content in the rock. Corrections for
carbon from inorganic minerals, mostly carbonates, are necessary to determine the organic
13
carbon content. Since the other elements associated with kerogen are excluded, the resulting
weight fraction of organic carbon is less than the weight fraction of total kerogen.
Thermal Maturity and Vitrinite Reflectance
A maceral is a component of organic material analogous to minerals of rocks. Macerals
are considered to be dehydrogenated plant fragments. Inertinite, vitrinite and liptinite are types of
macerals defined by their organic source and identified by petrographers according to their
grayness in reflected light (Tissot and Welte, 1978). In particular, vitrinite is thought to have
derived from higher plant tissues and passed to the gelification stage (Tissot and Welte, 1978). A
commonly used approach to the measurement of organic maturity is by vitrinite reflectance.
Vitrinite reflectance is used to identify the maximum paleotemperature for sediment in a basin and
is a thermal maturity indicator.
Thermal maturity is a key factor for understanding where and what type of hydrocarbons
can be found within a shale play. Vitrinite reflectance was first widely used in the coal industry as
a thermal maturity indicator, and has more recently been used as a tool to study organic matter
from kerogen. Vitrinite reflectance can be obtained either from visual methods or chemical
analysis using laboratory RockEval procedures. Visual analysis includes petrographic
microscopic examination of vitrinite from rock mounts and recordings of reflectivity of particles via
a photomultiplier (Jarvie et al., 2007). The onset of the oil window, the paleotemperature range in
which oil generation occurs, correlates to vitrinite reflectance of 0.5-0.6% and terminates at 0.85-
1.1%. The onset of gas generation correlates with 1.0-1.3% and ends at about 3.0%. RockEval is
a common source rock laboratory protocol often used to obtain thermal maturity and kerogen type
data needed to evaluate source rocks. RockEval pyrolysis methods consist of heating a small
sample (~100 mg) in an inert oven to determine free hydrocarbons, hydrogen- and oxygen-
containing compounds (CO2) that volatilized during the “cracking” of kerogen. A correlation of
maximum temperature achieved during RockEval kerogen cracking, Tmax, to vitrinite reflectance
has been found for Barnett Shale samples (Jarvie et al., 2001). This correlation is particularly
useful in gaining thermal maturity information in marine shale environments where there is a lack
14
of vitrinite macerals.The correlation below of vitrinite reflectance to Tmax is derived from Barnett
Shale samples:
Ro = 0.0180 *T max - 7.16
Mapping the thermal maturity of a shale play can aid in making drilling decisions. Gas
can flow through low permeability rock such as shales better than oil, so drilling wells that target
the formation where it has undergone paleotemperatures within the gas window often means
better flow rates. Even within the gas window, there is a trend of increasing gas flow rates with
increasing thermal maturity. Where low maturity Barnett shale is found, gas flow rates are lower
(Jarvie et al., 2007). This is thought to be caused by the lower volumes of generated gas and the
presence of residual hydrocarbon fluids that occlude the pore throats and reduce permeability.
Figure 1-6 is a map of kerogen conversion based on HI generated from an extensive Barnett
Shale core database (Jarvie et al., 2007). This map was found to correlate extremely well to
thermal maturity. The study well of this report is located in southeast portion of Wise county in the
most thermally mature part of the basin. Figure 1-7 shows the link between Barnett Shale vertical
well production and thermal maturity (Jarvie et al., 2007). The TP Sims #2 study well would be
expected to be one of the better gas producers in the field based on its thermal maturity.
15

Figure 1-6 Kerogen transformation ratio map of Barnett Shale
16
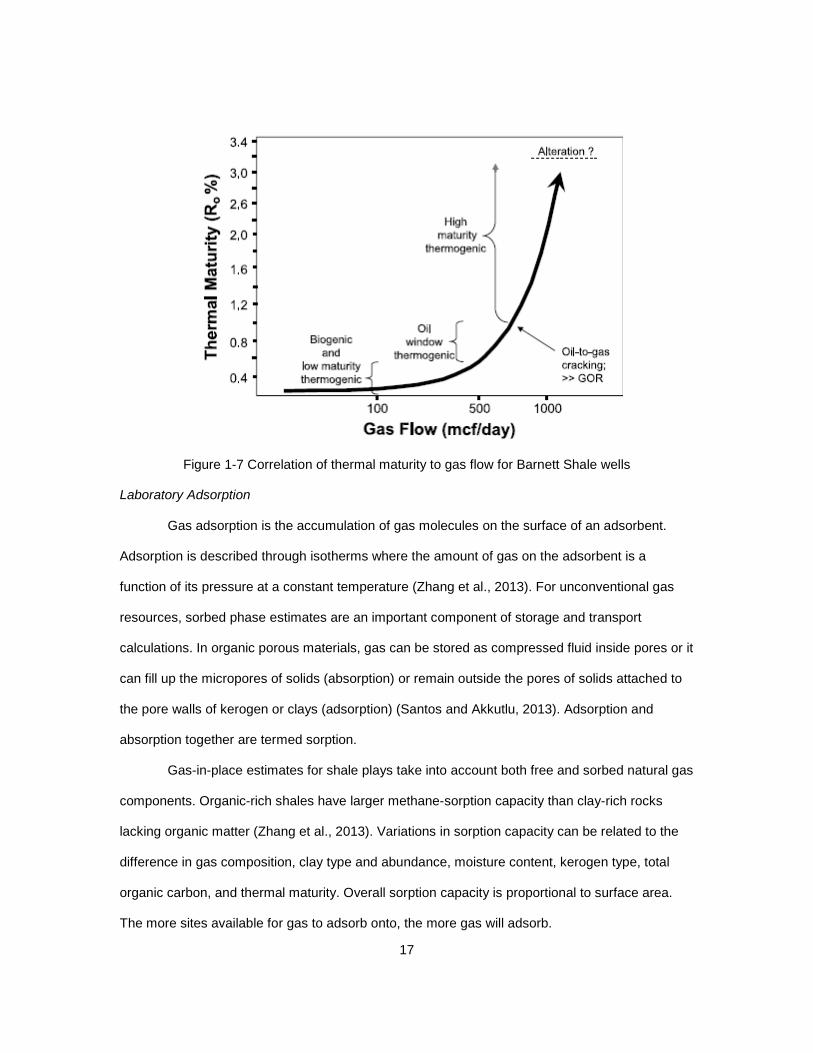
Figure 1-7 Correlation of thermal maturity to gas flow for Barnett Shale wells
Laboratory Adsorption
Gas adsorption is the accumulation of gas molecules on the surface of an adsorbent.
Adsorption is described through isotherms where the amount of gas on the adsorbent is a
function of its pressure at a constant temperature (Zhang et al., 2013). For unconventional gas
resources, sorbed phase estimates are an important component of storage and transport
calculations. In organic porous materials, gas can be stored as compressed fluid inside pores or it
can fill up the micropores of solids (absorption) or remain outside the pores of solids attached to
the pore walls of kerogen or clays (adsorption) (Santos and Akkutlu, 2013). Adsorption and
absorption together are termed sorption.
Gas-in-place estimates for shale plays take into account both free and sorbed natural gas
components. Organic-rich shales have larger methane-sorption capacity than clay-rich rocks
lacking organic matter (Zhang et al., 2013). Variations in sorption capacity can be related to the
difference in gas composition, clay type and abundance, moisture content, kerogen type, total
organic carbon, and thermal maturity. Overall sorption capacity is proportional to surface area.
The more sites available for gas to adsorb onto, the more gas will adsorb.
17

The sorbed gas volume is often quantified through the use of Langmuir isotherm. The
sorption isotherm relates the sorbed-gas storage capacity of a porous material to the pore
pressure. The most commonly used Langmuir model is a nonlinear relationship between the
amount of gas sorption by the solid matrix and the pore pressure (Santos and Akkutlu 2013):
GS = GSL*(P/P+PL)
GS is sorbed-gas storage capacity (scf/ton)
P is pore pressure (psi)
GSL is Languir volume (scf/ton)
PL is Langmuir Pressure (psi)
The Langmuir volume represents the maximum amount of sorbed gas by solids when all
available macromolecular sites and pore walls are taken by gas molecules. The Langmuir
pressure is the pore pressure at which half of that maximum storage capacity is obtained.
Langmuir volume will tend to increase with an increasing organic solid volume.
Langmuir isotherms from Lower Barnett samples for T.P. Sims #2 have been interpreted
to indicate that for the adsorption sites are saturated at 1000 psi and above (Lancaster et al.,
1992). Above 1000 psia, gas storage occurs primarily in the free porosity. Below 1000 psia, the
gas desorption therefore plays a larger role (Lancaster et al., 1992). Since Barnett Shale reservoir
pressures are approximately 3500 to 4000 psia, the reservoir has been predicted to behave
similar to a traditional reservoir with regard to reservoir pressure and production behavior and
below 1000 psi gas recovery from gas desorption will play a greater role (Lancaster et al., 1992).
Natural Fractures and Maximum Stress Direction
Past and current maximum stress directions help determine the optimal orientation for
horizontal drilling. Acting as planes of weakness, natural fractures can be reactivated during well
stimulation and enhance the production efficiency by widening the hydraulic fracture treatment
zone (Gale et al., 2007). Stress directions can be deduced from wellbore breakouts or drilling-
induced fractures on image logs. Core analysis of orientation, size and sealing properties can be
18

used to understand fracture pattern development. 3D seismic data can be used to map fault and
fracture trends. Seismic mapping of connectivity to underlying water-bearing karsts, such as the
Ellenburger formation, can help avoid drilling these areas. Once the maximum stress direction is
determined, lateral orientation perpendicular to maximum stress direction will optimize transverse
fracturing.
Two sets of natural fractures patterns have been identified for Fort Worth Basin: an older
north-south trending set and a younger west-northwest—east-southeast set (Gale et al., 2007).
Most natural fractures in Barnett Shale are sealed. The present-day maximum horizontal stress
direction of Fort Worth Basin is northeast-southwest. To maximize hydraulic fracture propagation,
most horizontal Barnett Shale wells are drilled perpendicular to the maximum stress direction in
northwest-southeast directions. Figure 1-8 shows the TP Sims #2, API 33586 and the nearby
wells from data obtained by the Texas Railroad Commission on June 4, 2014.
Figure 1-8 Drilling path of TP Sims #2 and nearby wells.
19

Chapter 2
Methodology
Study Question
The main objective of this study is to determine if well log and core-derived estimates of
petrophysical properties can be used to generate meaningful original gas-in-place volumes that
correlate with field performance in unconventional reservoirs. Moreover, key petrophysical
modeling steps when evaluating source rock plays are examined.
While there is a large amount of current research on shale source rocks, there remains a
void in the literature that links geology, engineering, and petrophysics. Past studies have shown
widely varying estimates of original gas-in-place for the Barnett Shale from 13.3 bcf/Section (GRI
1991) to 204 bcf/Section and (Jarvie et al., 2007). For this study, well performance-based
estimates of OGIP will be compared to estimates derived from rigorous petrophysical modeling.
Petrophysical Modeling of Barnett Shale
Digital well log data for Thomas P Sims #2 were imported into Schlumberger’s
petrophysical software Techlog to be used for well log-derived estimates of mineralogy, gross and
net reservoir thickness, porosity, and water saturation. Core measurements from TP Sims #2 and
other published sources were used to verify and calibrate the well log interpretation of each of
these key petrophysical properties.
Mineralogy
The first step is to identify mineral components within the reservoir. Typical mineral
constituents of shale source rocks include pyrite, quartz, calcite, dolomite and clay minerals such
as illite-smectite and kaolinite. Core-derived X-ray diffraction data provide calibration points for
mineral volume modeling. Approximate mineral volumes of major minerals present were
quantified using well log analysis techniques. Because clay-rich intervals have the lowest
permeability, and clay minerals exist in large proportion in Barnett Shale, total clay volume was
estimated. For the purposes of this study, clay volume and shale volume will be used
interchangeably. Quartz and carbonate-rich intervals typically exhibit better well fraccability and
20

performance. Their brittleness allows for hydraulically-induced fractures to remain open. Quartz
and carbonate volume estimates are collectively termed matrix. Pyrite is also commonly found in
organic-rich shale intervals because of the reducing conditions that enhance organic matter
preservation. Pyrite has the largest grain density of the minerals present in the Barnett Shale.
Pyrite density is 5 g/cc, which is double most other sedimentary minerals in the rock. When found
in large quantities, pyrite can have significant effects on the bulk density log. Often, pyrite volume
can be correlated to TOC volume (Witkowsky et al., 2012). The relative volumes of pyrite, clay,
and matrix minerals of Barnett Shale were estimated from TP Sims #2 and their respective grain
densities were then combined using a general mixing law to approximate a total rock grain
density.
Porosity
Identifying hydrocarbon-filled porosity from well logs is attainable when the constituents
of the formation and their relative abundance are known. Total porosity is estimated from the bulk
density well log and compared to neutron porosity and acoustic log porosity estimates. The
mineral volumes described above are used to calculate a total rock grain density. A general linear
mixing rule that combines the mineral volumes and their individual densities can be used to
obtain the rock grain density.
The resulting estimate of total grain density can be used in conjunction with the bulk
density log to obtain total porosity. Two total porosity estimates were obtained based on two
drilling fluid invasion assumptions. The low-side porosity estimate (PHIT_LS) is based on a fluid
density of 1 g/cc which is based on the assumption that the near well bore environment has been
invaded by drilling fluid. Alternatively, if drilling fluid has not invaded the well bore when the bulk
density is logged (because of low rock permeability), gas could be the fluid-filling the near well
bore environment. The high-side porosity is based on this alternative assumption with a gas fluid
density of 0.2 g/cc. The equation for both porosity estimates is below:
𝑃𝐻𝐼𝑇𝐿𝑆 =𝑅𝐻𝑂𝑀𝐴 − 𝑅𝐻𝑂𝐵𝑅𝐻𝑂𝑀𝐴 − 0.2
21

𝑃𝐻𝐼𝑇𝐻𝑆 =𝑅𝐻𝑂𝑀𝐴 − 𝑅𝐻𝑂𝐵𝑅𝐻𝑂𝑀𝐴 − 1
Water Saturation
Most well log-derived water saturation estimates are derived from Archie’s law which
relates conductivity of a clean, consolidated sandstone rock to its porosity and water saturation
(Archie, 1950). Archie’s law is a purely empirical formula that describes ion flow through
sandstones with varying intergranular porosity. Archie’s law is describe as follows:
𝑆𝑤 =𝑅𝑤
𝑅𝑡 ∗ Φ𝑚
1/2
Where
Sw is water saturation (decimal)
Rt is true resistivity (log-reading) (ohm.m)
Φ is porosity (v/v)
m is cementation exponent
Rw is formation water resistivity (ohm.m)
An underlying assumption for Archie’s law is that there is a continuous conductive
pathway of ion-filled formation water within the pore spaces of the rock. Rock and hydrocarbon
fluids are resistive to electric conduction, while ion-filled water is an electrical conductor. When
porosity, formation water salinity, in-situ resistivity, and rock tortuosity are known, the relative
amount of ion-filled water can be estimated and hydrocarbon saturation can be determined.
Barnett Shale has been demonstrated to be water-wet (Zhao et al., 2007). This means there is
likely a continuous pathway, but that pathway is likely more tortuous than in typical sandstone
rocks. As of yet, there is no known empirical derivation of water saturation from electric well logs
using shale source rock samples.
Variations of Archies water saturation equation for shaley sands are based on effective
porosity, which for shale samples is difficult to attain. This study focuses on total porosity, with no
attempt on estimating effective porosity. Therefore, the water saturation estimate needs to be
22

based on total porosity as well. For this study, water saturation from well logs will be estimated
with the Archie’s model since it is based on total porosity. Formation water salinity is likely salt-
saturated (Zhao et al., 2007) so the corresponding water resistivity at formation temperature, Rw,
used in the study is 0.03 ohm.m. Cementation exponent, m, is approximately 2 as evidenced by
formation factor study of mudstones (Zhao et al., 2007).
Net Pay
Gross thickness of Lower Barnett Shale formation is calculated from the top and base of
the shale interval on the logs. Net thickness is computed as the gross thickness less non-
reservoir rock thickness. Identifying non-reservoir rock in shale source rock plays is difficult
because knowing the type of rock that contains moveable gas that can contribute to production is
not entirely understood. For conventional reservoirs, cutoff criteria, often defined by core analysis
of porosity and permeability, can be used. However, typical permeability cutoffs would eliminate
all reservoir rock in unconventional reservoirs.
For this study, a range in net reservoir rock that contains moveable gas volumes will be
found by applying varying porosity cutoff criteria. Petrophysical averages were calculated using
the following porosity cutoffs: 0%, 0.1%, 1%, 2%, 4%, and 6%. Intervals with less than the
porosity cutoff are excluded from net pay.
Permeability
Permeability of shales is typically in the nano-Darcy range for the shale matrix. Higher
permeability rocks have a higher flow capacity and therefore better oil and gas flow rates.
Permeability and porosity generally have a positive correlation such that increasing porosity
means great permeability. No permeability estimates from core measurements were available for
TP Sims #2. However, permeability can also be obtained from reservoir engineering analysis of
well flow performance. Estimates of 1-2 md ft have been made from Lower Barnett Shale which
on average came out to be 0.0054 mD (Lancaster et al., 1992). This likely includes the
contribution of microcracks. The pre-fracture and post-fracture well test analyses indicated that a
single layer model was insufficient to describe the flow behavior and fracture length (Lancaster et
23

al., 1992). Barnett Shale has a complex permeability distribution and cutoffs can be used to
define units for a dual layer flow model that matches well performance data. Results have
indicated that a good match can be obtained modeling the Barnett Shale with a higher
permeability layer corresponding to an 8% porosity cutoff and 0.0025 mD, and a lower
permeability layer (5% porosity cutoff) of 0.00015 mD (Lancaster et al., 1992).
Sorbed Gas Content
Primary storage of gas within Barnett shale is both within rock matrix and kerogen pore
spaces. For shale reservoir, gas is typically partitioned between sorbed and free gas. Adsorbed
gas is estimated using Langmuir isotherms and total gas volume calculated by summing the free
and adsorbed gas content. Typical pressure and temperature data of Barnett Shale wells are
used in conjuction with published Langmuir data to calculate the amount of adsorbed gas.
Volumetrics
Volumetric estimates of OGIP can be calculated using the following formula (Craft and Hawkins):
OGIP = 43,560 A*H*Φ*(1-Sw)/Bg
Where:
A is area (acres)
H is net formation thickness (ft)
Φ is porosity (decimal)
Sw is water saturation (decimal)
Bg is gas volume factor
Area
For the purposes of this study, OGIP will be reported in bcf/section as this is a common
measure of OGIP for shale plays in the US. There are 640 acres/section and 43,560 square feet
per acre.
Gas Expansion Factor
Gas volume expansion occurs as gas is brought from subsurface temperature and
pressure conditions to surface conditions. The volumetric expansion of gas factor, Bg, is used to
24

relate the volume obtained at the surface to the volume of fluid actually occupied when it is
compressed in the reservoir (Craft and Hawkins). The gas volume expansion factor can be
estimated using the following formula:
Bg = 0.02829*(ZT/P) cu ft/SCF
Where
Bg= gas volume factor (cu ft/SCF)
Z = gas compressibility factor
P= reservoir pressure (psi)
T= reservoir temperature (deg Rankine)
The Barnett Shale is normally pressured, and formation pressure is estimated at TP Sims
#2 location to be approximately 4000 psi and the formation temperature is approximately 200
degF or 660 Rankine (Lancaster et al., 1992).
Well Performance
Over 20 years of Barnett Shale gas production data from the vertical study well has been
obtained from DrillingInfo. The production data was fit using hyperbolic decline as shown in
Figure 2-1. Production data ranges from April 1991 through September 2014 and cumulative gas
production for this wellbore is 2.55 bcf. Spikes in production correspond to restimulation efforts
(Jarvie et al., 2007). The EUR estimates from decline curve analysis are approximately 2.75 bcf.
This estimate of EUR will be used for determining recovery factor for the range of volumetric
OGIP.
25

Figure 2-1 TP Sims production history and EUR
26

Chapter 3
Results
Well log and Core-Derived Properties
Clay volume estimates were derived using neutron and density logs of TP Sims #2
through the implementation of industry standard equation in Figure 3-1. Shale parameters
displayed in Table 3-1 were selected such that average log-derived estimates of clay volume are
consistent with published average clay volume from XRD. Figure 3-2 shows the statistics of the
log-derived average clay volume. The arithmetically averaged clay volume over the Lower Barnett
Shale interval is 36%. This is in agreement with reported XRD clay volumes of Lower Barnett
Shale of 34% (Lancaster et al., 1992).
Figure 3-1 Techlog shale volume formula
27

Table 3-1 Neutron and bulk density parameters
Name Abbreviation Unit Description Value Neutron porosity NPHI v/v Neutron porosity log reading in
zone of interest NPHI
Bulk density RHOB g/cm3 Bulk density log reading in zone of interest RHOB
Neutron Porosity Matrix NPHIMA v/v Neutron porosity log reading in
100% matrix rock 0.00 Neutron
Porosity Shale NPHISH v/v Neutron porosity log reading in 100% shale 0.40
Neutron Porosity Fluid NPHIFL v/v Neutron porosity log reading in
100% water 1.00 Bulk Density
Matrix RHOBMA g/cm3 Bulk density log reading in 100% matrix rock 2.68
Bulk Density Shale RHOBSH g/cm3 Bulk density log reading in 100%
shale 2.45 Bulk Density
Fluid RHOFL g/cm3 Bulk density log reading in 100% water 1.00
Figure 3-2 Shale volume statistics for TP Sims #2
Core TOC measurements were correlated to gamma ray (GR) and bulk density (RHOB)
logs. Both of these log-derived estimates of TOC returned similar averages. The GR-TOC
estimates were selected to use for further modeling purposes. Figure 3-3 shows the GR to TOC
correlation and Figure 3-4 shows the RHOB to TOC correlation. Statistics of both well log-derived
28
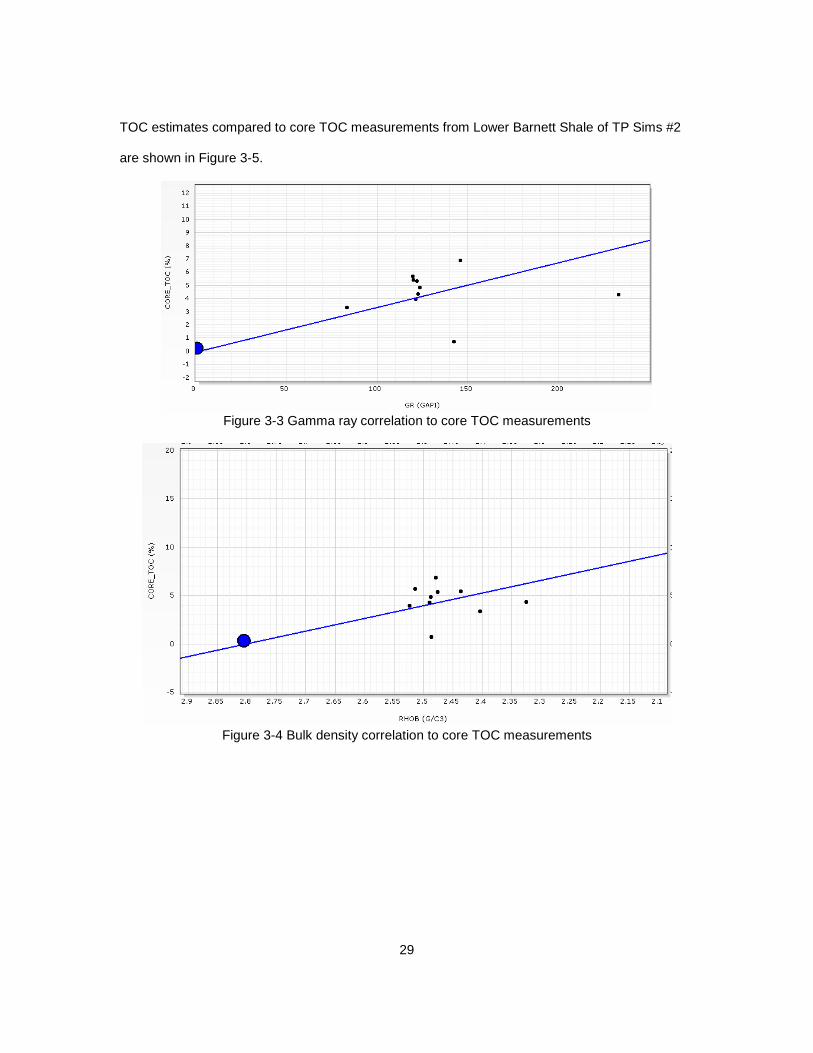
TOC estimates compared to core TOC measurements from Lower Barnett Shale of TP Sims #2
are shown in Figure 3-5.
Figure 3-3 Gamma ray correlation to core TOC measurements
Figure 3-4 Bulk density correlation to core TOC measurements
29
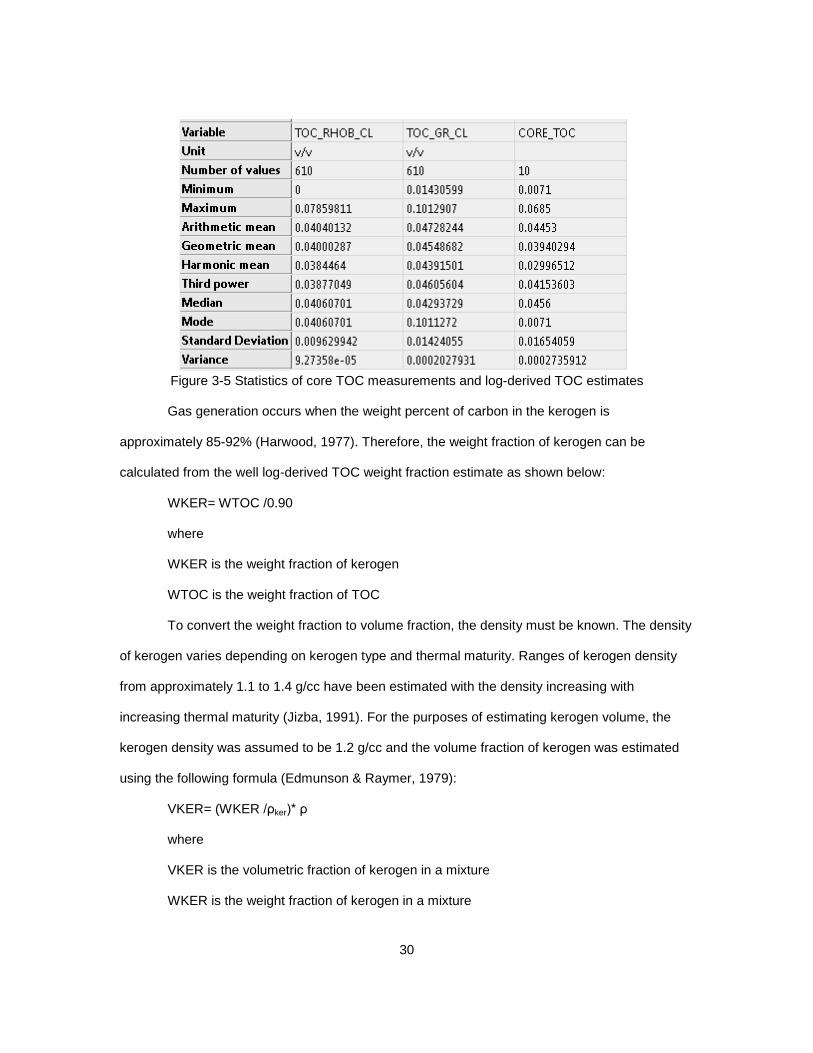
Figure 3-5 Statistics of core TOC measurements and log-derived TOC estimates
Gas generation occurs when the weight percent of carbon in the kerogen is
approximately 85-92% (Harwood, 1977). Therefore, the weight fraction of kerogen can be
calculated from the well log-derived TOC weight fraction estimate as shown below:
WKER= WTOC /0.90
where
WKER is the weight fraction of kerogen
WTOC is the weight fraction of TOC
To convert the weight fraction to volume fraction, the density must be known. The density
of kerogen varies depending on kerogen type and thermal maturity. Ranges of kerogen density
from approximately 1.1 to 1.4 g/cc have been estimated with the density increasing with
increasing thermal maturity (Jizba, 1991). For the purposes of estimating kerogen volume, the
kerogen density was assumed to be 1.2 g/cc and the volume fraction of kerogen was estimated
using the following formula (Edmunson & Raymer, 1979):
VKER= (WKER /ρker)* ρ
where
VKER is the volumetric fraction of kerogen in a mixture
WKER is the weight fraction of kerogen in a mixture
30

ρker is the density of kerogen, g/cc
ρ is the bulk density of the mixture (RHOB well log), g/cc
Published XRD and TOC data for W.C. Young No. 2 well in Wise County was used for
building a correlation of pyrite to TOC (Jarvie et al., 2005). This correlation, shown in Figure 3-6,
was used for making estimates of pyrite in the TP Sims #2 well log interpretation. The log-derived
TOC estimates were used to generate the pyrite estimate for each half foot sample over the
Lower Barnett shale for TP Sims #2. The pyrite weight fraction (WPYR) was converted to pyrite
volume fraction (VPYR) using the same relationship previously described for kerogen. The
resulting pyrite volume was limited to values between 0 and 1.
VPYR = WPYR*RHOB/5
Figure 3-6 Pyrite to TOC correlation from WC Young 2 XRD data
After volumes of pyrite, shale, and TOC were computed, the remaining volume is
predominantly quartz and carbonate grains. A grain density of 2.67 g/cc was assumed for this
remaining mineral volume. Matrix density, (RHOMA), is used to define density of the entire rock
31

matrix composed of all minerals and organic content. The following equation is a linear mixing law
that was used to calculate rock matrix density (RHOMA):
RHOMA = VSH_ND*2.8 + (1-VSH_ND-VPYR-VKER)*2.67+VKER*1.2 + VPYR*5
Well log-derived matrix densities were in agreement with the whole core grain density
measurements (Figure 3-7).
Figure 3-7 Comparison of log-derived grain density to core-derived grain density
Both the high side and low side well-log derived porosity estimates were within range of
the core-derived porosity measurements. A crossplot of both high-side (black) and low-side (blue)
well-log derived porosity versus whole core porosity is shown Figure 3-8. Figure 3-9 shows the
same comparison of high-side (black) and low-side (blue) log-derived porosity to whole core
porosity. The high and low well log-derived porosities differed by approximately 2 percent.
32
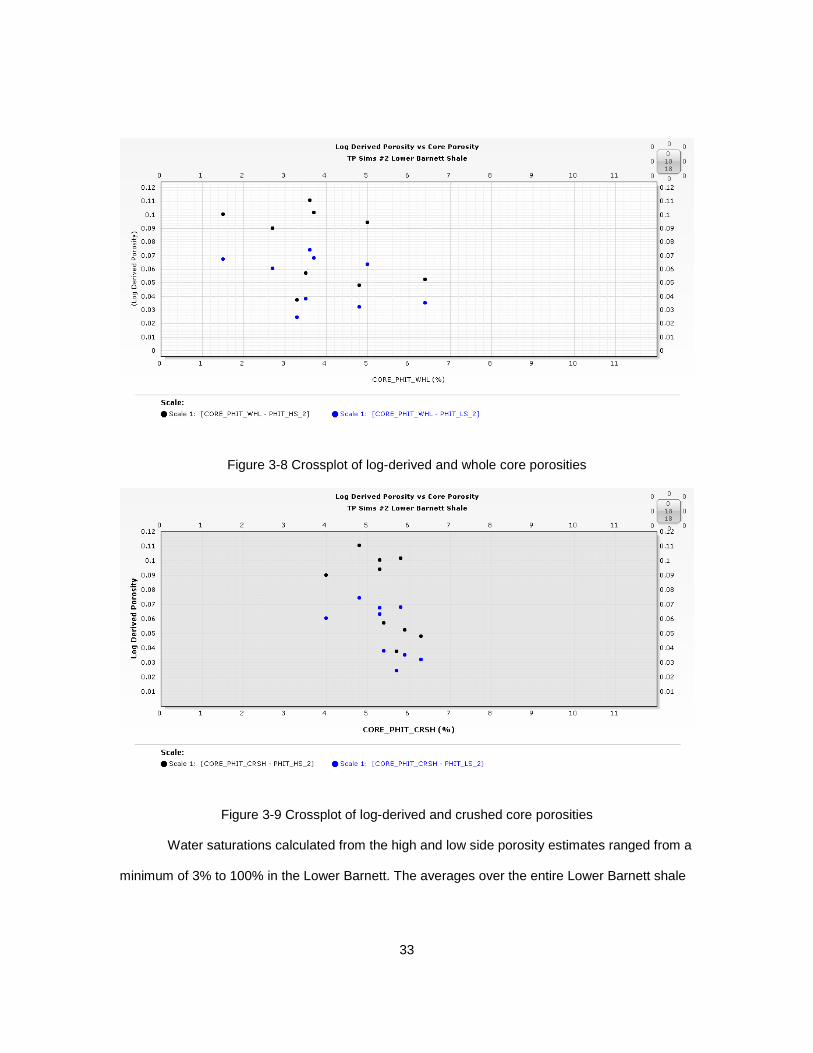
Figure 3-8 Crossplot of log-derived and whole core porosities
Figure 3-9 Crossplot of log-derived and crushed core porosities
Water saturations calculated from the high and low side porosity estimates ranged from a
minimum of 3% to 100% in the Lower Barnett. The averages over the entire Lower Barnett shale
33

are displayed in Figure 3-10. The low side average water saturation is approximately 37% and
the high side estimate average is 27%.
Figure 3-10 Statistics of water saturation estimates from low and high side cases
The detailed petrophysical well log display of TP Sims #2 showing the interpreted well log
results and core measurements is shown below in Figure 3-11.
Figure 3-11 Detailed petrophysical log over Lower Barnett for TP Sims #2
34

Table 3-2 displays the high and low side petrophysical averages over the Lower Barnett
interval with the range of cutoff criteria applied. Net pay for the various porosity cutoffs range from
as low as 120 feet to 305 feet. Average porosity range from 5 to 10% and water saturations range
from 14 to 28%.
Table 3-2 Interpreted petrophysical properties for TP Sims #2 for varying cutoffs
Hydrocarbon pore thicknesses were calculated for each cutoff sensitivity. Table 3-3
shows the results for each cutoff case and Figure 3-12 shows a histogram of the results.
Hydrocarbon pore volume thickness (HPVH) was calculated as follows:
HPVH = Porosity*(1-Water Saturation)*Net Pay
Table 3-3 Hydrocarbon pore volume thickness results for range of cutoffs
Average AverageGross Average Average Water Average Average Water
Top Base Interval Net Pay Vshale Porosity Saturation Net Pay Vshale Porosity SaturationCutoff Criteria (ft) (ft) (ft) (ft) (dec) (dec) (dec) (ft) (dec) (dec) (dec)
None 7569 7874 305 305 0.36 0.05 0.24 305 0.36 0.07 0.14
Phit > 0.001 7569 7874 305 293 0.35 0.06 0.28 293 0.35 0.08 0.19
Phit > 0.01 7569 7874 305 287 0.35 0.06 0.28 289 0.35 0.08 0.19
Phit > 0.02 7569 7874 305 276 0.34 0.06 0.27 286 0.35 0.08 0.19
Phit > 0.04 7569 7874 305 211 0.31 0.07 0.24 257 0.34 0.09 0.18
Phit > 0.06 7569 7874 305 120 0.25 0.08 0.20 211 0.31 0.10 0.16
Lower Barnett ShalePetrophysical Sensitivity Results of TP Sims #2 Well Log Interpretation
Low Side High Side
Average AverageGross Average Water Average Water
Top Base Interval Net Pay Porosity Saturation HPVH Net Pay Porosity Saturation HPVHCutoff Criteria (ft) (ft) (ft) (ft) (dec) (dec) (ft) (ft) (dec) (dec) (ft)
None 7569 7874 305 305 0.05 0.24 11.64 305 0.07 0.14 19.39
Phit > 0.001 7569 7874 305 293 0.06 0.28 11.64 293 0.08 0.19 19.27
Phit > 0.01 7569 7874 305 287 0.06 0.28 11.62 289 0.08 0.19 19.50
Phit > 0.02 7569 7874 305 276 0.06 0.27 11.43 286 0.08 0.19 19.32
Phit > 0.04 7569 7874 305 211 0.07 0.24 10.48 257 0.09 0.18 18.87
Phit > 0.06 7569 7874 305 120 0.08 0.20 7.29 211 0.10 0.16 17.23
Hydrocarbon Pore Volume Thickness of TP Sims #2 Lower Barnett Shale
Low Side High Side
35
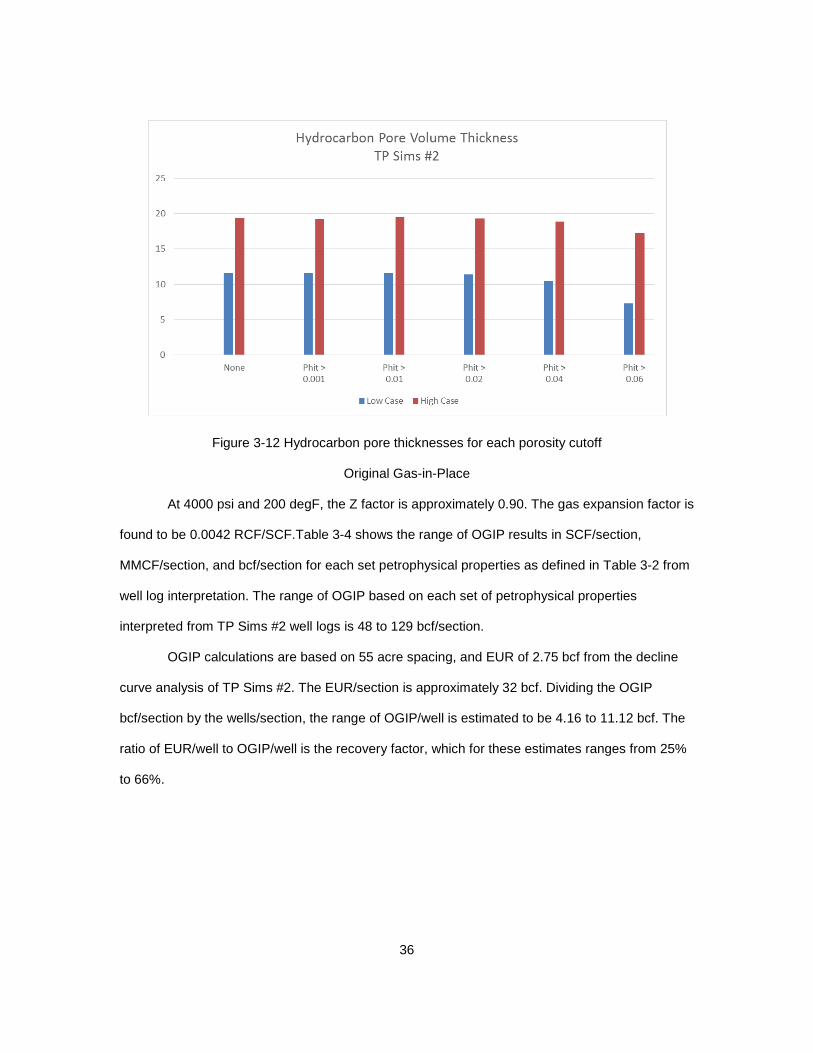
Figure 3-12 Hydrocarbon pore thicknesses for each porosity cutoff
Original Gas-in-Place
At 4000 psi and 200 degF, the Z factor is approximately 0.90. The gas expansion factor is
found to be 0.0042 RCF/SCF.Table 3-4 shows the range of OGIP results in SCF/section,
MMCF/section, and bcf/section for each set petrophysical properties as defined in Table 3-2 from
well log interpretation. The range of OGIP based on each set of petrophysical properties
interpreted from TP Sims #2 well logs is 48 to 129 bcf/section.
OGIP calculations are based on 55 acre spacing, and EUR of 2.75 bcf from the decline
curve analysis of TP Sims #2. The EUR/section is approximately 32 bcf. Dividing the OGIP
bcf/section by the wells/section, the range of OGIP/well is estimated to be 4.16 to 11.12 bcf. The
ratio of EUR/well to OGIP/well is the recovery factor, which for these estimates ranges from 25%
to 66%.
36

Table 3-4 OGIP, EUR, and RF estimates of Lower Barnett Shale
None Phit > 0.001 Phit > 0.01 Phit > 0.02 Phit > 0.04 Phit > 0.06 None Phit > 0.001 Phit > 0.01 Phit > 0.02 Phit > 0.04 Phit > 0.06Rock Properties Porosity 5% 6% 6% 6% 7% 8% 7% 8% 8% 8% 9% 10%
Water Saturation 24% 28% 28% 27% 24% 20% 14% 19% 19% 19% 18% 16%Avg Thickness (ft) 305 293 287 275.5 211 119.5 305 293 289 286 257 211Bulk Net Volume (Ac-ft) 195,200 187,520 183,680 176,320 135,040 76,480 195,200 187,520 184,960 183,040 164,480 135,040
OGIP OGIP (MMCF/Sec) 77,215 77,210 77,111 75,864 69,534 48,396 128,657 127,884 129,412 128,226 125,223 114,360OGIP (BCF/Sec) 77 77 77 76 70 48 129 128 129 128 125 114
TP Sims #2 EUR (BCF/well) 2.75
Acre Spacing 55.0Wells /Section 11.6EUR/Section 32.0OGIP (BCF/Well) 6.64 6.64 6.63 6.52 5.98 4.16 11.06 10.99 11.12 11.02 10.76 9.83
Reovery Factor EUR/OGIP 41% 41% 41% 42% 46% 66% 25% 25% 25% 25% 26% 28%
Volumetric Estimates from Analysis of TP Sims #2Low Side Results High Side Results
37

Chapter 4
Discussion
Mineral volumes, porosity, gross thickness, net thickness and water saturation of the
Lower Barnett Shale were determined from well log interpretation of TP Sims #2 well of Wise
County, TX. Typical industry standard log interpretation procedures were modified to account for
shale source rock constituents including pyrite, TOC, and kerogen. The well log interpretation
modeling work was calibrated to available core measurements of TOC, clay, and pyrite volume
and porosity.
As is typical for shale plays, TOC correlated favorably to bulk density and to natural
gamma radiation logs. Also, a positive correlation between the amount of pyrite and TOC worked
well for obtaining pyrite volumes once the TOC estimate had been obtained from well logs.
However, since these correlations are derived from limited core data, they should be reexamined
as additional XRD measurements are made available. This method of using well logs to estimate
TOC and pyrite can easily be applied to other marine shale source rocks where core data is
available.
The results from the well log interpretation were used to generate a range of OGIP
estimates. The range of OGIP was defined by variation of two parameters: cutoff criteria and the
near-borehole fluid assumption for porosity calculations. The well log interpretation results
indicate OGIP ranges from 49 to 129 bcf/section. These estimates are lower than estimates of
OGIP from EUR (based on production profiles) that were found to be range from 151 to 291
bcf/section (Jarvie et al., 2007).
Typical EURs for Barnett Shale wells range from 1.75 to 3 bcf. The TP Sims #2 well is a
vertical well in a better producing part of the field. Assuming 2.75 bcf as the EUR for this well, and
55 acre well spacing, recovery factors ranged from 25% to 66%. These recovery factors are
higher than expected for shale source rock plays. Recovery factors for Barnett Shale wells are in
the 8-12% range (Jarvie et al., 2007).
38

Conclusions
Poorer quality reservoir rocks typically have lower recovery factors. This is because less
hydrocarbon can be produced from lower permeability reservoirs and remains trapped in the
formation. The high recovery factors obtained from the results of this study suggests that the well
log interpretation has not accounted for all of the OGIP for the Barnett Shale or that the well is
connecting to a larger volume of rock than what is assumed in this study.
Hydraulic fracturing may affect the drainage area to a larger extent than what is modeled
in this study. Additional work, potentially with microseismic data, can help identify the
approximate drainage areas of hydraulically fractured Barnett Shale wells.
Methane gas has been shown to have the ability to adsorb onto organic matter and
Langmuir adsorption curves can be used to approximate adsorbed gas content. The study here
assumed that the wireline logs will be able to account for all gas (adsorbed and free). However,
large amounts of adsorbed gas may affect the resistivity response and obstruct the continuous
electrical conductive pathway necessary for the water saturation estimate to be accurate.
This study shows that there can be good agreement with log-derived and core-derived
mineralogy and porosity. However, there still remains large uncertainty in the water saturation
estimates from well log analysis. In particular, there is a lack of resistivity-based water saturation
models designed specifically for shales. This remains a void for the oil and gas industry that has
yet to be filled. Further research in this area will likely need to focus on correlating core-derived
measurements of water saturation to resistivity-based estimates. Because shale source rock
reservoirs have ultra-low permeability, laboratory Dean Stark apparatus may not be able to
provide reliable measurements of water saturation. Research using high pressure capillary
pressure techniques may be useful for gathering data to build an empirical resistivity-based
model of water saturation.
39

Appendix A
Core Analysis Data
40

W. C. Young Core Data Wise County, TX
Depth Total Clay Quartz K Feldspar Plagioclase Calcite Dolomite Pyrite Apatite TOC
6090.5 16 10 0 0 55 17 2 0 6920 35 44 1 2 4 7 4 3 4.84
6936 43 30 1 2 2 3 6 13 6944 4 13 0 1 54 3 11 14 6953.5 37 40 0 3 4 1 7 8 6964 4 10 0 3 78 2 3 0 6973 38 37 2 6 3 2 5 7 6985 42 38 1 3 2 3 8 3 7001 23 32 0 4 30 4 4 3 7006 37 34 1 6 10 6 2 4 7007 0 4 0 2 71 1 21 1 7014 31 42 1 4 7 7 6 2 7022.5 20 33 0 5 3 0 10 29 7026 48 33 2 6 0 1 8 2 7030.5 7 4 1 4 5 70 9 0 7033 48 36 4 5 0 1 4 2 4.42
7045 37 40 2 4 2 8 5 2 7061.6 41 42 2 3 3 3 5 1 7065 45 40 1 4 0 2 6 2 7075 37 43 1 4 3 3 6 3 7081 18 17 0 4 2 55 4 0 1.88
7086 54 31 1 4 0 0 7 3 5.16
7095 46 34 0 4 0 5 9 2 7108 32 31 3 4 2 20 6 2 5.78
7118 51 28 5 6 0 0 7 3 7126 37 47 2 4 0 1 5 4 6.53
7135 48 33 3 5 0 3 7 1 7141 45 34 1 3 3 4 6 4 7150 50 34 2 4 0 0 8 2 7156.5 21 23 1 2 42 3 4 4
41

TP Sims #2 Core Data Wise County, TX
Whole Core
Crushed Core Depth
Porosity
Grain Density
Porosity
Grain Density
Depth
TOC
ft
%
g/cc
%
g/cc
ft
% 7,656
3.5
2.56
5.4
2.62
7640
4.33
7,676
5.0
2.58
5.3
2.59
7670
3.92 7,680
3.7
2.50
5.8
2.56
7675
4.79
7,690
4.8
2.55
6.3
2.59
7682
5.40 7,701
6.4
2.68
5.9
2.66
7694
5.66
7,716
3.6
2.61
4.8
2.64
7711
3.30 7,724
3.3
2.52
5.7
2.58
7721
4.26
7,738
2.7
2.62
4.0
2.66
7733
6.85 7,740
1.5
2.51
5.3
2.62
7743
0.71
7755
5.31
42

References
Archie, Gustave Erdman. 1950. "Introduction to Petrophysics of Reservoir Rocks." AAPG
Bulletin 34 (5): 943-961.
Browning, John, Svetlana Ikonnikova, Gurcan Gulen, and Scott Tinker. 2013. "Barnett
Shale Production Outlook." . doi:10.2118/165585-PA.
Craft, B., C. and M. F. Hawkins. 1959. Applied Petroleum Reservoir Engineering.
Englewood Cliffs, New Jersey: Prentice-Hall, Inc.
Edmundson, H. and Raymer, L.L. 1979. “Radioactive logging parameters for common
minerals”. Log Analyst 20, 38-47.
Gale, Julia, Robert M. Reed, and Jon Holder. 2007. "Natural Fractures in the Barnett
Shale and their Importance for Hydraulic Fracture Treatments." AAPG Bulletin 91
(4): 603-622.
Gas Research Institute. May 1991. Formation Evaluation Technology for Production
Enhancement: Log, Core, and Geochemical Analyses in Barnett Shale, Mitchell
Energy Corp., Thomas P. Sims no. 2, Wise County, Texas. Chicago, Illinois: Gas
Research Institute.
Harwood, R. J. 1977. "Oil and Gas Generation by Laboratory Pyrolysis of
Kerogen." AAPG Bulletin 61 (12): 2081-2102.
Hickey, James J. and Bo Henk. April 2007. "Lithofacies Summary of the Mississippian
Barnett Shale, Mitchell 2 T.P. Sims Well, Wise County, Texas." AAPG Bulletin 91
(4): 437-443.
Jarvie, D. M., B. L. Claxton, F. Henk, and J. T. Breyer, 2001, Oil and shale gas from the
Barnett Shale, Fort Worth Basin, Texas: AAPG Annual Meeting Program, v. 10,
p. A100.
43

Jarvie, D. M., Ronald J. Jill, and Richard M. Pollastro. 2005. “Assessment of the Gas
Potential and Yields from Shales: the Barnett Shale Model”, in Cardott, B.J. (ed.),
Unconventional energy resources in the southern Midcontinent, 2004
symposium: Oklahoma Geological Survey Circular 110: 37-50.
Jarvie, Daniel M., Ronald J. Hill, Tim E. Ruble, and Richard M. Pollastro. April 2007.
"Unconventional Shale-Gas Systems; the Mississippian Barnett Shale of North-
Central Texas as One Model for Thermogenic Shale-Gas Assessment " (in
Special Issue; Barnett Shale ) AAPG Bulletin 91: 475-499.
Jarvie, D. M. “Unconventional Shale Resource Plays: Shale-Gas and Shale-Oil
Opportunities.” Presentation at the Fort Worth Business Press Meeting, Fort
Worth, TX, June 19, 2008.
Jizba, Diane Linda. 1991. Mechanical and acoustical properties of sandstones and
shales. Thesis (Ph. D.)--Stanford University, 1991.
Lancaster, D. E., S. F. McKetta, R. E. Hill, F. K. Guidry, and J. E. Jochen. 1992.
"Reservoir Evaluation, Completion Techniques, and Recent Results from Barnett
Shael Development in the Fort Worth Basin." SPE Annual Technical Conference
and Exhibition, Washington, D.C, Society of Petroleum Engineers, 4-7 October.
Loucks, Robert G. and Stephen C. Ruppel. 2007. "Mississippian Barnett Shale:
Lithofacies and Depositional Setting of a Deep-Water Shale-Gas Succession in
the Fort Worth Basin, Texas." AAPG Bulletin 91: 579-601.
Martineau, David. 2007. "History of the Newark East Field and the Barnett Shale as a
Gas Reservoir." AAPG Bulletin 91: 399-405.
Miskimins, Jennifer. 2009. "The Importance of Geophysical and Petrophysical Data
Integration for the Hydraulic Fracturing of Unconventional Reservoirs." (in
Unconventional Resources and CO2 Monitoring) Leading Edge 28: 844-849.
44
Montgomery, S. L., D. M. Jarvie, K. A. Bowker, and R. M. Pollastro, 2005. “Mississippian
Barnett Shale, Fort Worth basin, north-central Texas: Gas-shale play with multi-
trillion cubic foot potential” AAPG Bulletin 89: 155-175.
Nicot, J. P., B. R. Scanlon, R. C. Reedy, and R. A. Costley. 2014. "Source and Fate of
Hydraulic Fracturing Water in the Barnett Shale: A Historical
Perspective." Environmental Science & Technology 48 (4): 2464-2471.
doi:10.1021/es404050r [doi].
Pennslyvania Department of Conservation and Natural Resources. "Quality of Organic
Matter.", accessed
11/5,2014,http://dcnr.state.pa.us/topogeo/econresource/oilandgas/marcellus/sour
cerock_index/sourcerock_quality/index.htm.
Pollastro, Richard M. April 2007. "Total Petroleum System Assessment of Undiscovered
Resources in the Giant Barnett Shale Continuous (Unconventional) Gas
Accumulation, Fort Worth Basin, Texas." (in Special Issue; Barnett Shale) AAPG
Bulletin 91: 551-578.
Pollastro, Richard M., Daniel M. Jarvie, Ronald J. Hill, and Craig W. Adams. 2007.
"Geologic Framework of the Mississippian Barnett Shale, Barnett-Paleozoic Total
Petroleum System, Bend arch–Fort Worth Basin, Texas." AAPG Bulletin 91: 405-
436.
Santos Rueda, Jose Manuel and I. Y. Akkutlu. 2012. Laboratory Measurement of
Sorption Isotherm Under Confining Stress with Pore Volume Effects Society of
Petroleum Engineers. doi:10.2118/162595-MS.
Schmoker, James. 2002. "Resource-assessment perspectives for unconventional gas
Systems." AAPG Bulletin 86: 1993-1999.
45

Slatt, Roger, Prerna Singh, Gariel Borges, Roderick Perez, Romina Portas, Julieta
Vallejo, Mike Ammerman, and William Coffey. 2009. "Reservoir Characterization
of Unconventional Gas Shales: Example from the Barnett Shale, Texas, U.S.A."
AAPG Annual Convention, San Antonio, TX, Search and Discovery, April 20-23,
2008.
Texas A&M Ocean Drilling Program. "Rock Eval Pyrolysis.", accessed 11/5,2014,
http://www-odp.tamu.edu/publications/tnotes/tn30/tn30_11.htm.
Tissot, B. P. and D. H. Welte. 1978. Petroleum Formation and Occurrence
A New Approach to Oil and Gas Exploration. Germany: Springer-Verlag.
Witkowsky, Jim, James Glaford, John Quirein, and Jerome Truax. 2012. "Predicting
Pyrite and Total Organic Carbon from Well Logs for Enhancing Reservoir
Interpretation." Lexington, Kentucky, USA, SPE, October 3-5.
Zhang, Tonwei, Geoffrey E. Ellis, Stephen C. Ruppel, Kitty Milliken, Mike Lewan, and
Xun Sun. 2013. Effect of Organic Matter Properties, Clay Mineral Type and
Thermal Maturity on Gas Adsorption in Organic-Rich Shale Systems Society of
Petroleum Engineers. doi:10.1190/URTEC2013-205.
Zhao, Hank, Natalie B. Givens, and Brad Curtis. April 2007. "Thermal Maturity of the
Barnett Shale Determined from Well-Log Analysis." AAPG Bulletin 91: 535-549.
46

Biographical Information
Melanie Ybarra received her Bachelors of Science degree in mathematics with
chemistry minor from University of Houston. She began her career as a petrophysical
analyst at Netherland, Sewell, and Associates of Dallas, TX in 2005 with a team of
petrophysicists working closely with petroleum engineers and geologists. She entered the
petroleum geology program at University of Texas at Arlington in the fall of 2011. Her
current interests include formation evaluation and reservoir characterization.
47