Well Installation, Single-Well Testing, and Particle … · Well Installation, Single-Well Testing,...
27
Well Installation, Single-Well Testing, and Particle-Size Analysis for Selected Sites in and near the Lost Creek Designated Ground Water Basin, North-Central Colorado, 2003–2004 By Jennifer A. Beck, Suzanne S. Paschke, and L. Rick Arnold Prepared in cooperation with the Colorado Water Conservation Board Open-File Report 2011–1024 U.S. Department of the Interior U.S. Geological Survey
Transcript of Well Installation, Single-Well Testing, and Particle … · Well Installation, Single-Well Testing,...
Well Installation, Single-Well Testing, and Particle-Size Analysis for Selected Sites in and near the Lost Creek Designated Ground Water Basin, North-Central Colorado, 2003–2004
By Jennifer A. Beck, Suzanne S. Paschke, and L. Rick Arnold
Prepared in cooperation with the Colorado Water Conservation Board
Open-File Report 2011–1024
U.S. Department of the Interior U.S. Geological Survey

ii
U.S. Department of the Interior KEN SALAZAR, Secretary
U.S. Geological Survey Marcia K. McNutt, Director
U.S. Geological Survey, Reston, Virginia: 2011
For product and ordering information: World Wide Web: http://www.usgs.gov/pubprod Telephone: 1-888-ASK-USGS
For more information on the USGS—the Federal source for science about the Earth, its natural and living resources, natural hazards, and the environment: World Wide Web: http://www.usgs.gov Telephone: 1-888-ASK-USGS
Suggested citation: Beck, J.A., Paschke, S.S., and Arnold, L.R., 2011, Well installation, single-well testing, and particle-size analysis for selected sites in and near the Lost Creek Designated Ground Water Basin, north-central Colorado, 2003–2004: U.S. Geological Survey Open-File Report 2011–1024, 23 p.
Any use of trade, product, or firm names is for descriptive purposes only and does not imply endorsement by the U.S. Government.
Although this report is in the public domain, permission must be secured from the individual copyright owners to reproduce any copyrighted material contained within this report.

iii
Contents Abstract ................................................................................................................................................................... 1 Introduction .............................................................................................................................................................. 2 Methods ................................................................................................................................................................... 5 Well Installation ....................................................................................................................................................... 9 Single-Well Testing ................................................................................................................................................ 10 Particle-Size Analysis ............................................................................................................................................ 14 Summary ............................................................................................................................................................... 17 References Cited ................................................................................................................................................... 19 Appendix 1. Well permits, records of well completion, and geologic logs .............................................................. 21 Appendix 2. Single-well test data and analyses ..................................................................................................... 22 Appendix 3. Particle-size analysis data ................................................................................................................. 23
Figures 1. Map showing locations of selected wells in and near the Lost Creek Designated Ground Water Basin,
north-central Colorado ................................................................................................................................ 3 2. Particle-size distribution by aquifer material for selected wells in and near the Lost Creek Designated
Ground Water Basin, north-central Colorado ............................................................................................ 16 3. Relation of median hydraulic-conductivity values to calculated d50 (particle size at which 50 percent
of the sample is larger or smaller than specified value) by aquifer material for selected wells in and near the Lost Creek Designated Ground Water Basin, north-central Colorado ................................. 17
Tables 1. Site information for selected wells in and near the Lost Creek Designated Ground Water Basin,
north-central Colorado ................................................................................................................................5 2. Single-well test and particle-size analysis information for selected wells in and near the Lost Creek
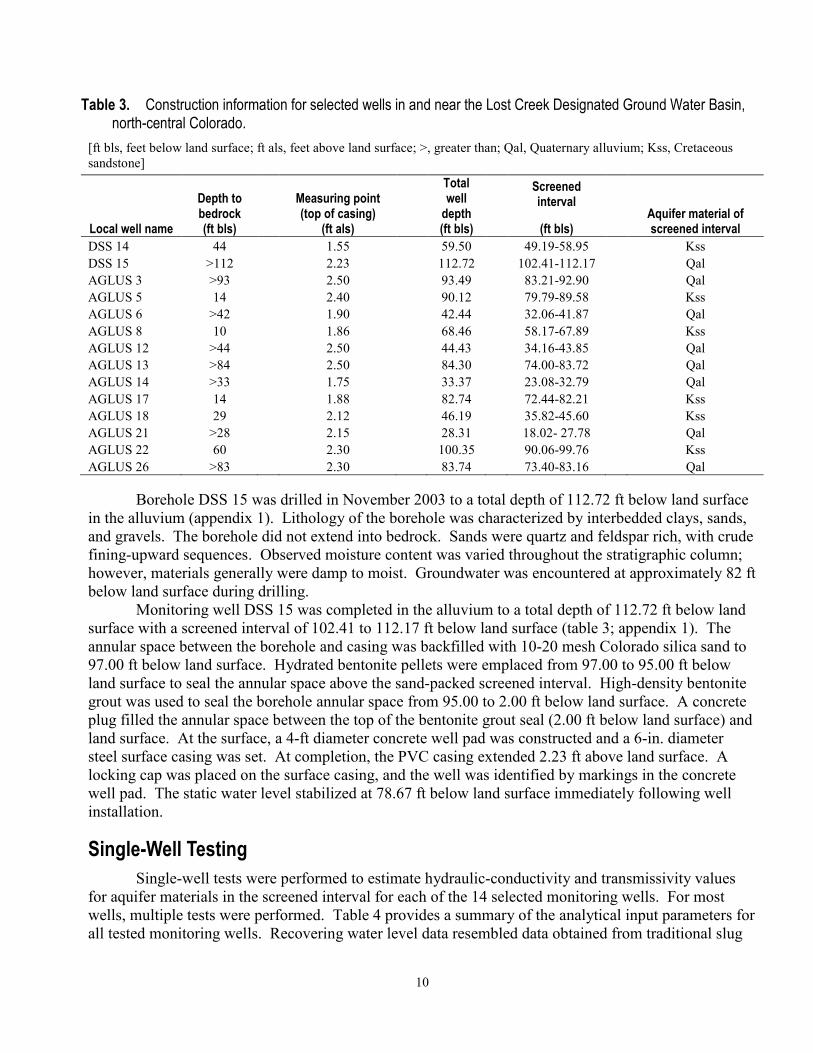
Designated Ground Water Basin, north-central Colorado. .......................................................................... 7 3. Construction information for selected wells in and near the Lost Creek Designated Ground Water Basin,
north-central Colorado .............................................................................................................................. 10 4. Summary of input parameters for single-well tests analyses for selected wells in and near the Lost Creek
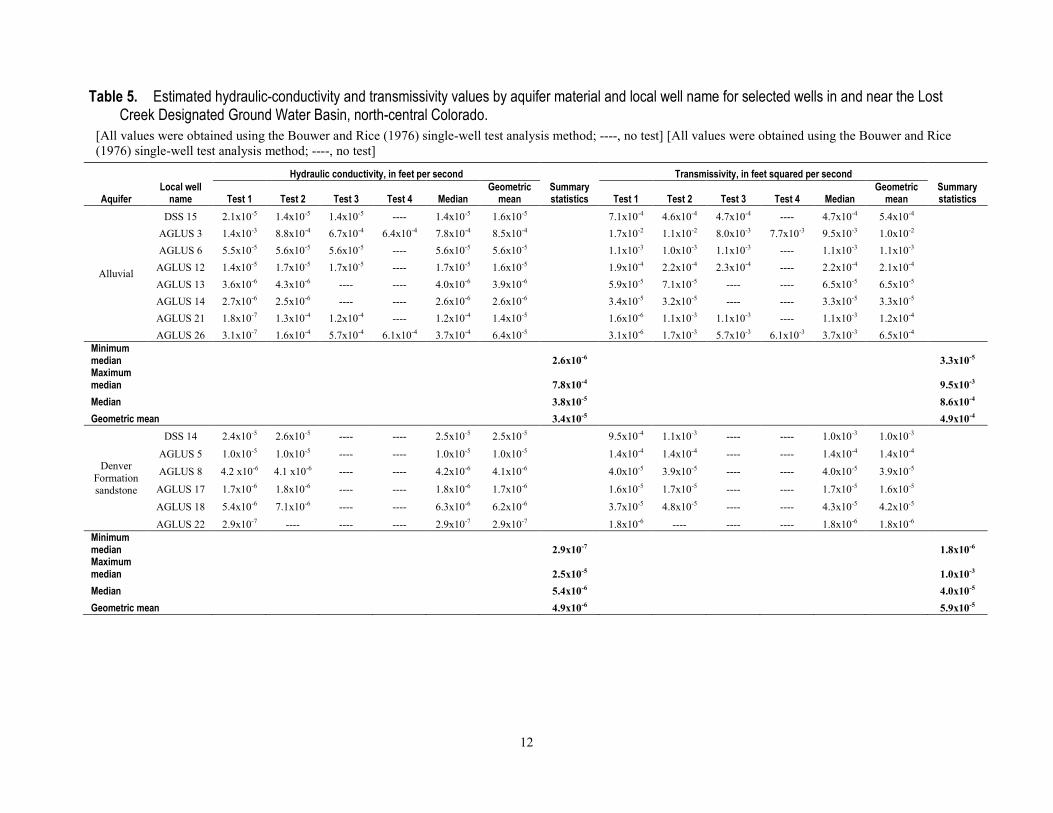
Designated Ground Water Basin, north-central Colorado ......................................................................... 11 5. Estimated hydraulic-conductivity and transmissivity values by aquifer material and local well name for
selected wells in and near the Lost Creek Designated Ground Water Basin, north-central Colorado....... 12 6. Distribution of sediment particle sizes in samples from screened intervals of selected wells in and near
the Lost Creek Designated Ground Water Basin, north-central Colorado ................................................ 15

iv
Conversion Factors Inch/Pound to SI
Multiply By To obtain
Length
inch (in.) 2.54 centimeter (cm)
inch (in.) 25.4 millimeter (mm)
foot (ft) 0.3048 meter (m)
Volume gallon (gal) 3.785 liter (L)
gallon (gal) 0.003785 cubic meter (m3)
gallon (gal) 3.785 cubic decimeter (dm3)
Flow rate foot per second (ft/s) 0.3048 meter per second (m/s)
Pressure pound per square inch (lb/in2) 6.895 kilopascal (kPa)
Hydraulic conductivity* foot per second (ft/s) 0.3048 meter per second (m/s)
foot per second (ft/s) 86,000 foot per day (ft/d)
Transmissivity* foot squared per second (ft2/s) 0.09290 meter squared per second (m2/s)
foot squared per second (ft2/s) 0.09290 foot squared per day (ft2/d)
Vertical coordinate information is referenced to the National Geodetic Vertical Datum of 1929 (NGVD29). Horizontal coordinate information is referenced to the Universal Transverse Mercator (UTM), Zone 13, North American Datum of 1983 (NAD83). Altitude, as used in this report, refers to distance above the vertical datum. *Hydraulic conductivity: Hydraulic conductivity can be expressed as cubic foot per second per square foot [(ft3/s)/ft2]. In this report, foot per second (ft/s), is used for convenience. *Transmissivity: Transmissivity can be expressed as cubic foot per second per square foot multiplied by aquifer thickness, in feet [(ft3/s)/ft2]ft. In this report, foot squared per second (ft2/s), is used for convenience.

1
Well Installation, Single-Well Testing, and Particle-Size Analysis for Selected Sites in and near the Lost Creek Designated Ground Water Basin, North-Central Colorado, 2003–2004
By Jennifer A. Beck, Suzanne S. Paschke, and L. Rick Arnold
Abstract This report describes results from a groundwater data-collection program completed in 2003-
2004 by the U.S. Geological Survey in support of the South Platte Decision Support System and in cooperation with the Colorado Water Conservation Board. Two monitoring wells were installed adjacent to existing water-table monitoring wells. These wells were installed as well pairs with existing wells to characterize the hydraulic properties of the alluvial aquifer and shallow Denver Formation sandstone aquifer in and near the Lost Creek Designated Ground Water Basin. Single-well tests were performed in the 2 newly installed wells and 12 selected existing monitoring wells. Sediment particle size was analyzed for samples collected from the screened interval depths of each of the 14 wells.
Hydraulic-conductivity and transmissivity values were calculated after the completion of single-well tests on each of the selected wells. Recovering water-level data from the single-well tests were analyzed using the Bouwer and Rice method because test data most closely resembled those obtained from traditional slug tests. Results from the single-well test analyses for the alluvial aquifer indicate a median hydraulic-conductivity value of 3.8 x 10⁻⁵ feet per second and geometric mean hydraulic-conductivity value of 3.4 x 10⁻⁵ feet per second. Median and geometric mean transmissivity values in the alluvial aquifer were 8.6 x 10⁻⁴ feet squared per second and 4.9 x 10⁻⁴ feet squared per second, respectively. Single-well test results for the shallow Denver Formation sandstone aquifer indicate a median hydraulic-conductivity value of 5.4 x 10⁻⁶ feet per second and geometric mean value of 4.9 x 10⁻⁶ feet per second. Median and geometric mean transmissivity values for the shallow Denver Formation sandstone aquifer were 4.0 x 10⁻⁵ feet squared per second and 5.9 x 10⁻⁵ feet squared per second, respectively. Hydraulic-conductivity values for the alluvial aquifer in and near the Lost Creek Designated Ground Water Basin generally were greater than hydraulic-conductivity values for the Denver Formation sandstone aquifer and less than hydraulic-conductivity values for the alluvial aquifer along the main stem of the South Platte River Basin reported by previous studies.
Particle sizes were analyzed for a total of 14 samples of material representative of the screened interval in each of the 14 wells tested in this study. Of the 14 samples collected, 8 samples represent the alluvial aquifer and 6 samples represent the Denver Formation sandstone aquifer in and near the Lost Creek Designated Ground Water Basin. The sampled alluvial aquifer material generally contained a greater percentage of large particles (larger than 0.5 mm) than the sampled sandstone aquifer material. Alternatively, the sampled sandstone aquifer material generally contained a greater percentage of fine particles (smaller than 0.5 mm) than the sampled alluvial aquifer material consistent with the finding that the alluvial aquifer is more conductive than the sandstone aquifer in the vicinity of the Lost Creek Designated Ground Water Basin.

2
Introduction The Lost Creek Designated Ground Water Basin is an alluvial aquifer located northeast of
Denver in Adams and Arapahoe Counties and near Lost Creek, a tributary of the South Platte River (Nelson and others, 1967; fig. 1). Alluvial and bedrock aquifers are important sources of water for irrigation, public supply, and domestic water use in this area along the South Platte River and its tributaries in north-central Colorado (Paschke and others, in press). The hydrogeology of the area is characterized by saturated Quaternary alluvial deposits of the South Platte River and its tributaries that overlie Upper Cretaceous- to Tertiary-age bedrock sandstone aquifers and claystone confining units of the Denver Formation (Robson, 1989). The alluvial deposits generally are composed of sand and gravel with interbedded clay and range from less than 10 ft to more than 100 ft in thickness (Hurr and others, 1972; Robson, 1996). The Quaternary deposits form a productive unconfined alluvial aquifer where saturated, primarily along present-day stream channels (Hunt, 1954; Smith and others, 1964; Hurr and others, 1972). Confined groundwater conditions generally exist in bedrock sandstones where they are overlain by claystone layers, but unconfined (water-table) groundwater conditions can occur in shallow bedrock sandstones where they crop out at land surface or occur directly beneath alluvial deposits (Robson, 1989; Paschke and others, in press).

3
Figure 1. Map showing locations of selected wells in and near the Lost Creek Designated Ground Water Basin, north-central Colorado.

4
In order to provide access to information related to water-management issues in the South Platte River basin, the Colorado Water Conservation Board (CWCB) developed a hydrologic information system named the South Platte Decision Support System (SPDSS; http://co.water.usgs.gov/projects/AZ600/index.html, accessed on December 13, 2010). Activities in support of the SPDSS included well installation and single-well testing in the alluvial and shallow Denver Formation sandstone aquifers along the South Platte River and its tributaries to obtain additional hydrogeologic information. In 2003, as part of the U.S. Geological Survey (USGS) National Water-Quality Assessment (NAWQA) program in the South Platte River basin, the USGS installed 31 water-table monitoring wells as part of an agricultural land-use study (AGLUS). The NAWQA monitoring wells are completed at the water table in the alluvial and shallow Denver Formation sandstone aquifers in and near the Lost Creek Designated Ground Water Basin, an area where hydrogeologic data were needed for the SPDSS. In 2003-2004, the USGS, in cooperation with the CWCB, conducted a study in and near the Lost Creek Designated Ground Water Basin to install two deep monitoring wells paired with existing AGLUS water-table monitoring wells, perform single-well tests on selected wells from the AGLUS, and analyze particle sizes of geologic material collected from the well boreholes. Data and results presented in this report contribute to characterization of properties for the alluvial and shallow Denver Formation sandstone aquifers in and near the Lost Creek Designated Ground Water Basin, north-central Colorado.
The purpose of this report is to describe the installation, single-well testing, and particle-size analysis for selected wells in and near the Lost Creek Designated Ground Water Basin in north-central Colorado. These activities were conducted by the USGS, in cooperation with the CWCB, in 2003-2004 to provide hydrogeologic information needed for the SPDSS for alluvial and shallow Denver Formation sandstone aquifers in the area. Specific activities included
(1) installation of 2 deep monitoring wells paired with existing AGLUS water-table monitoring wells;
(2) single-well testing of the 2 newly installed monitoring wells and 12 selected AGLUS wells; and
(3) particle-size analysis of core samples from the 2 newly installed monitoring wells and 12 selected AGLUS well boreholes.
Each of the wells is designated by a USGS site identification number, generally corresponding to the longitude and latitude of the well location, and a local well name. The local well names of the 2 newly installed wells are DSS 14 and DSS 15, which were paired with alluvial wells AGLUS 21 and AGLUS 3, respectively, and the local well names of the 12 AGLUS wells are AGLUS 3, AGLUS 5, AGLUS 6, AGLUS 8, AGLUS 12, AGLUS 13, AGLUS 14, AGLUS 17, AGLUS 18, AGLUS 21, AGLUS 22, and AGLUS 26. General information for each of the wells is shown in table 1.

5
Table 1. Site information for selected wells in and near the Lost Creek Designated Ground Water Basin, north-central Colorado.
[Horizontal datum provided in Universal Transverse Mercator (UTM), Zone 13, North American Datum of 1983 (NAD83); Vertical datum provided in National Geodetic Vertical Datum of 1929 (NGVD29); USGS, U.S. Geological Survey; DMS, Degrees Minutes Seconds; ft, feet; °, degrees; ', minutes; ", seconds; Kss, Cretaceous sandstone; Qal, Quaternary alluvium]
USGS site identification
number Local well
name Latitude (DMS)
Longitude (DMS)
Land surface altitude
(ft above NGVD29)
Aquifer material of screened
interval 394838104310002
DSS 14
39° 48' 38.50"
104° 31' 00.90"
5,375 Kss
395259104253401 DSS 15 39° 52' 59.60" 104° 25' 34.00" 5,192 Qal 395300104253301
AGLUS 3
39° 53' 00.40"
104° 25' 33.90"
5,196 Qal
395450104402701
AGLUS 5
39° 54' 50.80"
104° 40' 27.82"
5,318 Kss 395909104350401
AGLUS 6
39° 59' 09.73"
104° 35' 04.44"
5,088 Qal
395211104351601
AGLUS 8
39° 52' 11.54"
104° 35' 16.78"
5,325 Kss 394539104305901
AGLUS 12
39° 45' 39.29"
104° 30' 59.54"
5,528 Qal
394731104260001
AGLUS 13
39° 47' 31.75"
104° 26' 00.38"
5,409 Qal 394947104335201
AGLUS 14
39° 49' 47.60"
104° 33' 52.90"
5,390 Qal
395540104353601
AGLUS 17
39° 55' 40.26"
104° 35' 36.64"
5,227 Kss 395352104302801
AGLUS 18
39° 53' 52.30"
104° 30' 28.60"
5,208 Kss
394838104310001
AGLUS 21
39° 48' 38.60"
104° 31' 00.70"
5,712 Qal 394339104313601
AGLUS 22
39° 43' 39.53"
104° 31' 36.81"
5,635 Kss
394956104274101
AGLUS 26
39° 49' 56.80"
104° 27' 41.80"
5,315 Qal
Methods Wells DSS 14 and DSS 15 and the 12 selected AGLUS wells were drilled with a USGS truck-
mounted, hollow-stem-auger drilling rig, and completed using 2-in. diameter, schedule 40, threaded flush-joint (TFJ) polyvinyl chloride (PVC) casing and well screen in accordance with USGS protocols (Lapham and others, 1995) and State of Colorado well-drilling rules (http://water.state.co.us/groundwater/groundwater.asp, accessed on March 8, 2010). Borehole annular space was backfilled with 10-20 mesh silica sand to approximately 2 ft above the top of the screened interval. An estimated 2-ft thickness of hydrated 0.25-in. diameter bentonite pellets was emplaced to seal the screened interval above the sand filter pack, and a high-density bentonite grout sealed the borehole annular space from the top of the bentonite pellets to near ground surface. Each monitoring well was protected by a 6-in. diameter steel surface casing cut in a 5-ft length with a locking cap and set in a 4-ft diameter concrete well pad. Core samples for particle-size analysis were collected in 5-ft intervals using a split core barrel. General site information for all 14 wells is presented in table 1.
Development of the 2 newly installed DSS wells and the 12 selected AGLUS wells followed USGS protocols (Lapham and others, 1995) to establish hydraulic connection with the water-bearing zone after formation disturbances from drilling. The removal of fine-grained sediments from the screened interval was accomplished using a portable Waterra Hydrolift II electric inertial pump actuator. The Waterra Hydrolift II is a 110-volt pump that generates an approximate 4-in. stroke up to 200 cycles per minute (www.waterra.com, accessed on September 16, 2009). The pump was mounted and secured on the 6-in. diameter steel surface casing. Three-quarter-in. diameter high-density polyethylene

6
(HDPE) tubing with a foot valve and surge block was used with the Waterra Hydrolift II pump to effectively flush each well.
The minimum volume of water removed during well development was approximately five times the capacity represented by one well-casing volume. The minimum volume to be removed from a well during development is represented by the equation (U.S. Geological Survey, 2006):
V = 5 ∙ (0.0408 HD2) (1)
where
V is volume, in gallons; H is height of water column, in feet; and D is inside diameter of well casing, in inches.
During well development, several water-quality properties were monitored onsite until measured values stabilized. Measured properties included specific conductance, dissolved oxygen, pH, temperature, and turbidity. Turbidity measurements were considered ideal at values of less than 5 nephelometric turbidity units (NTU). Well development typically took approximately 2 to 4 hours at pumping rates of less than 1 gallon per minute (gpm) to achieve both the minimum volume requirements and stable values for measured water-quality properties, including turbidity values of less than 5 NTU. As a result, the volume of water removed from each well during development often exceeded the minimum requirements. If turbidity measurements were still greater than 5 NTU after a 4-hour time period and all other water-quality property values had stabilized, a Grundfos submersible pump was used to complete well development with less disturbance to the formation surrounding the well screen. Purge volumes, property measurements, groundwater clarity, and odor were reported on waterproof field forms and archived in station field folders.
Static water-level measurements were recorded for each of the 2 newly constructed wells and the 12 selected AGLUS wells prior to the single-well tests. Water levels were measured using a Solinst Model 101 electric water-level indicator. Depth to water was documented to the nearest hundredth of a foot below the measuring point, which was the top of the PVC casing, and to the nearest hundredth of a foot below land surface by subtracting the difference in height between the top of the PVC casing and land surface from the depth to water below the measuring point. Land surface altitude at each well was determined using a hand-held global positioning system (GPS) unit calibrated to the National Geodetic Vertical Datum of 1929 (NGVD29) with an accuracy of + 10 feet. Water-level data collected by the USGS as part of this study are available through the USGS National Water Information System (NWIS) by using the site identification numbers listed in table 1 as search criteria (http://waterdata.usgs.gov/nwis, accessed April 6, 2010).
Single-well tests were performed on the 2 newly installed DSS wells and the 12 selected AGLUS wells to estimate hydraulic-conductivity and transmissivity values for aquifer materials in the screened interval in each of the wells (table 2). Selection of existing USGS monitoring wells was based on attaining spatial and well-depth distribution in order to obtain a representative dataset from the testing program in the Lost Creek Designated Ground Water Basin. Tests were carried out using a Grundfos submersible pump and water levels were measured using an Insitu MiniTROLL Model SSP-100 pressure transducer with a pressure rating to 30 pounds per square in. (lb/in2, www.in-situ.com, accessed on September 16, 2009) approximately every 0.5 second. Accuracy of the 30-lb/in2 MiniTROLL is 0.1 percent full scale, which is approximately equivalent to 0.07 ft of hydraulic head (http://www.ierents.com/Manuals/miniTroll.pdf, accessed on March 10, 2010). Testing protocols

7
involved the relatively rapid dewatering of the well for up to 5 minutes of pumping until the water level was below the pump intake. Water-level recovery data were recorded through time until water levels stabilized within approximately 5 percent of the pretest level. Stabilization guidelines were adopted from Butler (1998).
Table 2. Single-well test and particle-size analysis information for selected wells in and near the Lost Creek Designated Ground Water Basin, north-central Colorado.
[ft bls, feet below land surface]
Local well name Number of
single-well tests
Single-well test date Particle sample collection date
Particle sample interval (ft bls)
DSS 14
2
03/02/04
11/03/03
50.5 - 51.5 DSS 15 3 03/31/04 11/05/03 90.5 - 91.0 AGLUS 3
4
03/31/04
03/02/03
83.5 - 83.7
AGLUS 5
2
02/25/04
01/08/03
72.8 - 73.2 AGLUS 6
3
04/20/04
01/09/03
28.5 - 29.5
AGLUS 8
2
02/27/04
01/15/03
59.7 - 60.3 AGLUS 12
3
03/02/04
03/07/03
29.8 - 30.5
AGLUS 13
2
04/20/04
03/10/03
60.6 - 61.3 AGLUS 14
2
02/27/04
01/17/03
25.8 - 26.5
AGLUS 17
2
02/25/04
01/11/03
79.4 - 80.0 AGLUS 18
2
02/27/04
01/12/03
41.3 - 42.0
AGLUS 21
3
03/30/04
02/27/03
18.5 - 18.8 AGLUS 22
1
02/23/04
02/19/03
95.8 - 96.4
AGLUS 26
4
03/30/04
01/19/03
74.5 - 75.5
Recovery data from the single-well tests resembled traditional slug-test data and therefore were analyzed using conventional methods developed for porous media by Bouwer and Rice (1976) and Bouwer (1989a; 1989b) rather than the methods developed for single-well pumping tests by Cooper and Jacob (1946). Data obtained from the single-well tests were used to estimate hydraulic-conductivity and transmissivity values by evaluating the removal of water from the wellbore and the resulting rate of change in hydraulic head. Input parameters for the single-well test analysis included saturated thickness, screen length, wellbore radius, well-casing radius, total well-penetration depth, and initial water-level displacement.
The single-well tests were analyzed according to the procedures developed by Bouwer and Rice (1976) for partially or fully penetrating wells, as applicable. The Bouwer and Rice (1976) method is applicable to the single-well testing program for this study, provided the following basic assumptions are met (Kruseman and de Ridder, 1990; Dawson and Istok, 1991):
• The aquifer is unconfined and incompressible; • The aquifer is homogeneous, horizontally isotropic, and of uniform thickness over the area
influenced by the test; • The aquifer is bounded below by a confining unit; • Prior to the test, the water table is nearly horizontal over the area that will be influenced by
the test; • Groundwater flow can be described by Darcy’s law (laminar groundwater flow);
8
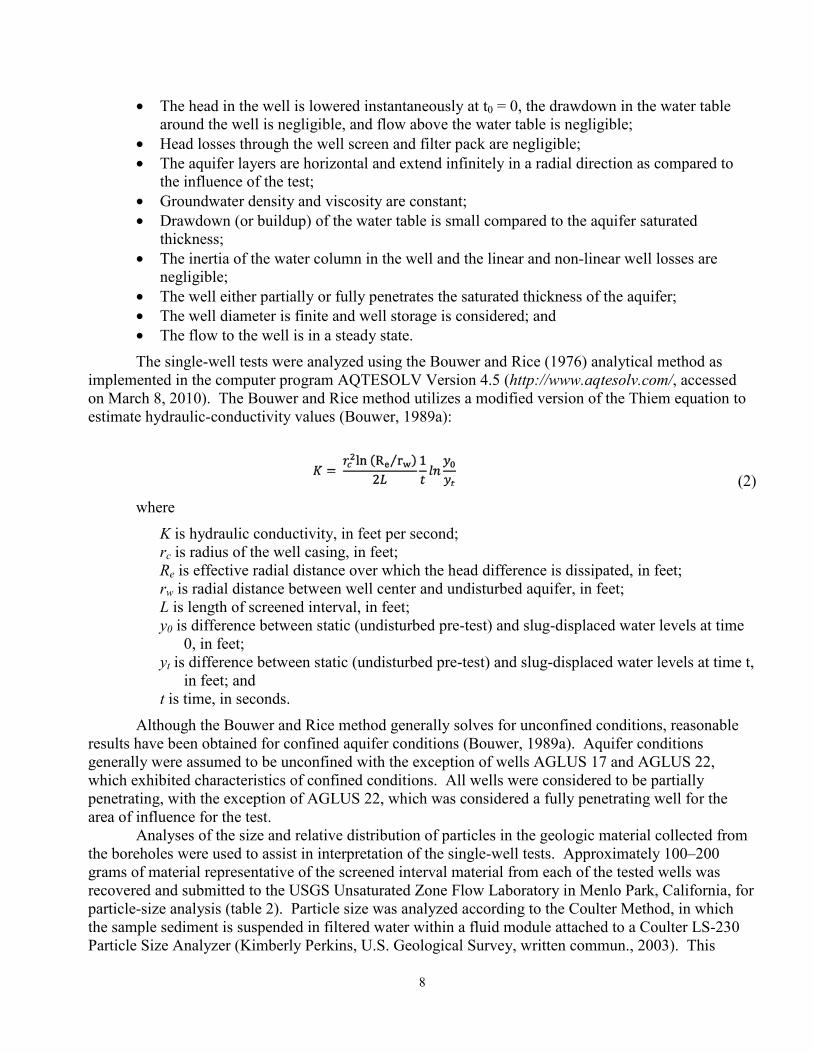
• The head in the well is lowered instantaneously at t0 = 0, the drawdown in the water table around the well is negligible, and flow above the water table is negligible;
• Head losses through the well screen and filter pack are negligible; • The aquifer layers are horizontal and extend infinitely in a radial direction as compared to
the influence of the test; • Groundwater density and viscosity are constant; • Drawdown (or buildup) of the water table is small compared to the aquifer saturated
thickness; • The inertia of the water column in the well and the linear and non-linear well losses are
negligible; • The well either partially or fully penetrates the saturated thickness of the aquifer; • The well diameter is finite and well storage is considered; and • The flow to the well is in a steady state. The single-well tests were analyzed using the Bouwer and Rice (1976) analytical method as
implemented in the computer program AQTESOLV Version 4.5 (http://www.aqtesolv.com/, accessed on March 8, 2010). The Bouwer and Rice method utilizes a modified version of the Thiem equation to estimate hydraulic-conductivity values (Bouwer, 1989a):
(2)
where
K is hydraulic conductivity, in feet per second; rc is radius of the well casing, in feet; Re is effective radial distance over which the head difference is dissipated, in feet; rw is radial distance between well center and undisturbed aquifer, in feet; L is length of screened interval, in feet; y0 is difference between static (undisturbed pre-test) and slug-displaced water levels at time
0, in feet; yt is difference between static (undisturbed pre-test) and slug-displaced water levels at time t,
in feet; and t is time, in seconds.
Although the Bouwer and Rice method generally solves for unconfined conditions, reasonable results have been obtained for confined aquifer conditions (Bouwer, 1989a). Aquifer conditions generally were assumed to be unconfined with the exception of wells AGLUS 17 and AGLUS 22, which exhibited characteristics of confined conditions. All wells were considered to be partially penetrating, with the exception of AGLUS 22, which was considered a fully penetrating well for the area of influence for the test.
Analyses of the size and relative distribution of particles in the geologic material collected from the boreholes were used to assist in interpretation of the single-well tests. Approximately 100–200 grams of material representative of the screened interval material from each of the tested wells was recovered and submitted to the USGS Unsaturated Zone Flow Laboratory in Menlo Park, California, for particle-size analysis (table 2). Particle size was analyzed according to the Coulter Method, in which the sample sediment is suspended in filtered water within a fluid module attached to a Coulter LS-230 Particle Size Analyzer (Kimberly Perkins, U.S. Geological Survey, written commun., 2003). This

9
instrument utilizes a laser diffraction technique to record the optical properties of the sediment surfaces and classify particle size. As light passes through the suspended-sediment mixture, it scatters in characteristic patterns and is recorded by the detectors. From the patterns recorded by the detectors, a mathematical model is used to derive particle-size distribution (Kimberly Perkins, U.S. Geological Survey, written commun., 2003). This method was used for particle sizes in the range from 4.0 x 10⁻⁶ millimeters (mm, fine clay) to 2.0 mm (coarse gravel). All particles greater than 2.0 mm were removed through sieve processing and later were incorporated into the size-distribution results (Kimberly Perkins, U.S. Geological Survey, written commun., 2003). Results from the particle-size analysis were compared to particle-size criteria from the U.S. Department of Agriculture (USDA) textural soil classification (http://www.wsi.nrcs.usda.gov/products/W2Q/H&H/Training/trng_ser.html, accessed on April 2, 2010). Methods used for particle-size comparisons are provided in Appendix 3.
Well Installation Borehole DSS 14 was drilled in November 2003 through the alluvium and into bedrock (a
Denver Formation sandstone) to a total depth of 59.50 ft below land surface (appendix 1). Lithology of the borehole was characterized by interbedded clays, sands, and gravels to approximately 44 ft below land surface at the contact between the alluvial and bedrock material. The Denver Formation at this location was characterized by medium-grained, well-sorted quartz sandstone with weathered organic claystone interbeds. Observed moisture content varied throughout the stratigraphic column. However, materials generally were damp to moist with the exception of the Denver Formation organic claystones, which were dry. Groundwater was encountered at approximately 20 ft below land surface during drilling.
Monitoring well DSS 14 was completed in Denver Formation sandstone to a total depth of 59.50 ft below land surface with a screened interval of 49.19 to 58.95 ft below land surface (table 3). The annular space between the borehole and casing was backfilled with 10-20 mesh Colorado silica sand to 44.50 ft below land surface. Hydrated bentonite pellets were emplaced from 44.50 to 40.40 ft below land surface to seal the annular space above the sand-packed screened interval. High-density bentonite grout was used to seal the borehole annular space from 40.40 to 3.00 ft below land surface. A concrete plug filled the annular space between the top of the bentonite grout seal (3.00 ft below land surface) and land surface. At the surface, a 4-ft diameter concrete well pad was constructed and a 6-in. diameter steel surface casing was set. At completion, the PVC casing extended 1.55 ft above land surface. A locking cap was placed on the surface casing, and the well was identified by markings in the concrete well pad. The static water level stabilized at 18.63 ft below land surface immediately following well installation. Well-permitting documents and completion logs for all of the tested wells, including DSS 14, are provided in appendix 1, and well construction information for all of the tested wells is summarized in table 3.
10
Table 3. Construction information for selected wells in and near the Lost Creek Designated Ground Water Basin, north-central Colorado.
[ft bls, feet below land surface; ft als, feet above land surface; >, greater than; Qal, Quaternary alluvium; Kss, Cretaceous sandstone]
Local well name
Depth to bedrock (ft bls)
Measuring point (top of casing)
(ft als)
Total well
depth (ft bls)
Screened interval
Aquifer material of screened interval (ft bls)
DSS 14 44
1.55
59.50
49.19-58.95
Kss DSS 15 >112 2.23 112.72 102.41-112.17 Qal AGLUS 3 >93
2.50
93.49
83.21-92.90
Qal
AGLUS 5 14
2.40
90.12
79.79-89.58
Kss AGLUS 6 >42
1.90
42.44
32.06-41.87
Qal
AGLUS 8 10
1.86
68.46
58.17-67.89
Kss AGLUS 12 >44
2.50
44.43
34.16-43.85
Qal
AGLUS 13 >84
2.50
84.30
74.00-83.72
Qal AGLUS 14 >33
1.75
33.37
23.08-32.79
Qal
AGLUS 17 14
1.88
82.74
72.44-82.21
Kss AGLUS 18 29
2.12
46.19
35.82-45.60
Kss
AGLUS 21 >28
2.15
28.31
18.02- 27.78
Qal AGLUS 22 60
2.30
100.35
90.06-99.76
Kss
AGLUS 26 >83
2.30
83.74
73.40-83.16
Qal
Borehole DSS 15 was drilled in November 2003 to a total depth of 112.72 ft below land surface in the alluvium (appendix 1). Lithology of the borehole was characterized by interbedded clays, sands, and gravels. The borehole did not extend into bedrock. Sands were quartz and feldspar rich, with crude fining-upward sequences. Observed moisture content was varied throughout the stratigraphic column; however, materials generally were damp to moist. Groundwater was encountered at approximately 82 ft below land surface during drilling.
Monitoring well DSS 15 was completed in the alluvium to a total depth of 112.72 ft below land surface with a screened interval of 102.41 to 112.17 ft below land surface (table 3; appendix 1). The annular space between the borehole and casing was backfilled with 10-20 mesh Colorado silica sand to 97.00 ft below land surface. Hydrated bentonite pellets were emplaced from 97.00 to 95.00 ft below land surface to seal the annular space above the sand-packed screened interval. High-density bentonite grout was used to seal the borehole annular space from 95.00 to 2.00 ft below land surface. A concrete plug filled the annular space between the top of the bentonite grout seal (2.00 ft below land surface) and land surface. At the surface, a 4-ft diameter concrete well pad was constructed and a 6-in. diameter steel surface casing was set. At completion, the PVC casing extended 2.23 ft above land surface. A locking cap was placed on the surface casing, and the well was identified by markings in the concrete well pad. The static water level stabilized at 78.67 ft below land surface immediately following well installation.
Single-Well Testing Single-well tests were performed to estimate hydraulic-conductivity and transmissivity values
for aquifer materials in the screened interval for each of the 14 selected monitoring wells. For most wells, multiple tests were performed. Table 4 provides a summary of the analytical input parameters for all tested monitoring wells. Recovering water level data resembled data obtained from traditional slug

11
tests and were analyzed according to the Bouwer and Rice (1976) analytical method. Single-well test data and results are provided in appendix 2. Table 5 provides a summary of the estimated hydraulic-conductivity and transmissivity values for each well obtained from single and multiple tests, according to the Bouwer and Rice (1976) analytical method.
Table 4. Summary of input parameters for single-well tests analyses for selected wells in and near the Lost Creek Designated Ground Water Basin, north-central Colorado.
[wellbore radius for all tested wells is 0.375 feet; well-casing radius for all tested wells is 0.083 feet; vertical anisotropy for all analyses equal to 0.1; ft, feet]
Height of water column
Local well name Aquifer model
Number of tests performed and
analyzed Saturated thickness
Above top of screened interval
Above bottom of screened interval
(ft) (ft) (ft) DSS 14 unconfined 2 40.2 30.4 40.2 DSS 15 unconfined 3 33.5 23.8 33.5 AGLUS 3 unconfined 4 12.0 2.3 12.0 AGLUS 5 unconfined 2 13.6 3.8 13.6 AGLUS 6 unconfined 3 19.3 9.5 19.3 AGLUS 8 unconfined 2 9.6 0.0 9.6 AGLUS 12 unconfined 3 13.4 3.7 13.4 AGLUS 13 unconfined 2 16.5 6.8 16.5 AGLUS 14 unconfined 2 12.9 3.2 12.9 AGLUS 17 confined 2 9.2 6.7 16.5 AGLUS 18 unconfined 2 6.8 0.0 6.8 AGLUS 21 unconfined 3 8.8 0.0 8.8 AGLUS 22 confined 1 6.3 ----1 ----1 AGLUS 26 unconfined 4 10.1 0.3 10.1
1AGLUS 22 analyzed as a fully penetrating well.
12
Table 5. Estimated hydraulic-conductivity and transmissivity values by aquifer material and local well name for selected wells in and near the Lost Creek Designated Ground Water Basin, north-central Colorado.
[All values were obtained using the Bouwer and Rice (1976) single-well test analysis method; ----, no test] [All values were obtained using the Bouwer and Rice (1976) single-well test analysis method; ----, no test]
Aquifer Local well
name
Hydraulic conductivity, in feet per second Summary statistics
Transmissivity, in feet squared per second Summary statistics Test 1 Test 2 Test 3 Test 4 Median
Geometric mean Test 1 Test 2 Test 3 Test 4 Median
Geometric mean
Alluvial
DSS 15 2.1x10⁻⁵ 1.4x10⁻⁵ 1.4x10⁻⁵ ---- 1.4x10⁻⁵ 1.6x10⁻⁵
7.1x10⁻⁴ 4.6x10⁻⁴ 4.7x10⁻⁴ ---- 4.7x10⁻⁴ 5.4x10⁻⁴ AGLUS 3 1.4x10⁻³ 8.8x10⁻⁴ 6.7x10⁻⁴ 6.4x10⁻⁴ 7.8x10⁻⁴ 8.5x10⁻⁴
1.7x10⁻² 1.1x10⁻² 8.0x10⁻³ 7.7x10⁻³ 9.5x10⁻³ 1.0x10⁻²
AGLUS 6 5.5x10⁻⁵ 5.6x10⁻⁵ 5.6x10⁻⁵ ---- 5.6x10⁻⁵ 5.6x10⁻⁵
1.1x10⁻³ 1.0x10⁻³ 1.1x10⁻³ ---- 1.1x10⁻³ 1.1x10⁻³ AGLUS 12 1.4x10⁻⁵ 1.7x10⁻⁵ 1.7x10⁻⁵ ---- 1.7x10⁻⁵ 1.6x10⁻⁵
1.9x10⁻⁴ 2.2x10⁻⁴ 2.3x10⁻⁴ ---- 2.2x10⁻⁴ 2.1x10⁻⁴
AGLUS 13 3.6x10⁻⁶ 4.3x10⁻⁶ ---- ---- 4.0x10⁻⁶ 3.9x10⁻⁶
5.9x10⁻⁵ 7.1x10⁻⁵ ---- ---- 6.5x10⁻⁵ 6.5x10⁻⁵ AGLUS 14 2.7x10⁻⁶ 2.5x10⁻⁶ ---- ---- 2.6x10⁻⁶ 2.6x10⁻⁶
3.4x10⁻⁵ 3.2x10⁻⁵ ---- ---- 3.3x10⁻⁵ 3.3x10⁻⁵
AGLUS 21 1.8x10⁻⁷ 1.3x10⁻⁴ 1.2x10⁻⁴ ---- 1.2x10⁻⁴ 1.4x10⁻⁵
1.6x10⁻⁶ 1.1x10⁻³ 1.1x10⁻³ ---- 1.1x10⁻³ 1.2x10⁻⁴ AGLUS 26 3.1x10⁻⁷ 1.6x10⁻⁴ 5.7x10⁻⁴ 6.1x10⁻⁴ 3.7x10⁻⁴ 6.4x10⁻⁵
3.1x10⁻⁶ 1.7x10⁻³ 5.7x10⁻³ 6.1x10⁻³ 3.7x10⁻³ 6.5x10⁻⁴
Minimum median
2.6x10⁻⁶
3.3x10⁻⁵
Maximum median
7.8x10⁻⁴
9.5x10⁻³
Median
3.8x10⁻⁵
8.6x10⁻⁴ Geometric mean 3.4x10⁻⁵ 4.9x10⁻⁴
Denver Formation sandstone
DSS 14 2.4x10⁻⁵ 2.6x10⁻⁵ ---- ---- 2.5x10⁻⁵ 2.5x10⁻⁵ 9.5x10⁻⁴ 1.1x10⁻³ ---- ---- 1.0x10⁻³ 1.0x10⁻³
AGLUS 5 1.0x10⁻⁵ 1.0x10⁻⁵ ---- ---- 1.0x10⁻⁵ 1.0x10⁻⁵
1.4x10⁻⁴ 1.4x10⁻⁴ ---- ---- 1.4x10⁻⁴ 1.4x10⁻⁴ AGLUS 8 4.2 x10⁻⁶ 4.1 x10⁻⁶ ---- ---- 4.2x10⁻⁶ 4.1x10⁻⁶
4.0x10⁻⁵ 3.9x10⁻⁵ ---- ---- 4.0x10⁻⁵ 3.9x10⁻⁵
AGLUS 17 1.7x10⁻⁶ 1.8x10⁻⁶ ---- ---- 1.8x10⁻⁶ 1.7x10⁻⁶
1.6x10⁻⁵ 1.7x10⁻⁵ ---- ---- 1.7x10⁻⁵ 1.6x10⁻⁵ AGLUS 18 5.4x10⁻⁶ 7.1x10⁻⁶ ---- ---- 6.3x10⁻⁶ 6.2x10⁻⁶
3.7x10⁻⁵ 4.8x10⁻⁵ ---- ---- 4.3x10⁻⁵ 4.2x10⁻⁵
AGLUS 22 2.9x10⁻⁷ ---- ---- ---- 2.9x10⁻⁷ 2.9x10⁻⁷
1.8x10⁻⁶ ---- ---- ---- 1.8x10⁻⁶ 1.8x10⁻⁶ Minimum
median
2.9x10⁻⁷
1.8x10⁻⁶ Maximum median
2.5x10⁻⁵
1.0x10⁻³
Median
5.4x10⁻⁶
4.0x10⁻⁵ Geometric mean 4.9x10⁻⁶ 5.9x10⁻⁵

13
The median hydraulic-conductivity value for the alluvial aquifer in and near the Lost Creek Designated Ground Water Basin was 3.8 x 10⁻⁵ feet per second (ft/s), and the geometric mean hydraulic-conductivity value for the alluvial aquifer was 3.4 x 10⁻⁵ ft/s (table 5). Median hydraulic-conductivity values from two or more tests at individual wells completed in the alluvial aquifer ranged from 2.6 x 10⁻⁶ ft/s at AGLUS 14 to 7.8 x 10⁻⁴ ft/s at AGLUS 3. Geometric mean hydraulic-conductivity values from two or more tests at individual wells ranged from 2.6 x 10⁻⁶ ft/s at AGLUS 14 to 8.5 x 10⁻⁴ ft/s at AGLUS 3.
The median transmissivity value for the alluvial aquifer in and near the Lost Creek Designated Ground Water Basin was 8.6 x 10⁻⁴ feet squared per second (ft2/s), and the geometric mean transmissivity value for the alluvial aquifer was 4.9 x 10⁻⁴ ft2/s. Median transmissivity values obtained from two or more tests at individual wells completed in the alluvial aquifer ranged from 3.3 x 10⁻⁵ to 9.5 x 10⁻³ ft2/s. Geometric mean transmissivity values from two or more tests at individual wells ranged from 3.3 x 10⁻⁵ to 1.0 x 10⁻² ft2/s.
The median hydraulic-conductivity value for the Denver Formation sandstone aquifer in and near the Lost Creek Designated Ground Water Basin was 5.4 x 10⁻⁶ ft/s, and the geometric mean hydraulic-conductivity value for the Denver Formation sandstone aquifer was 4.9 x 10⁻⁶ ft/s (table 5). Median hydraulic-conductivity values from two or more tests at individual wells completed in the Denver Formation sandstone aquifer ranged from 2.9 x 10⁻⁷ ft/s at AGLUS 22 to 2.5 x 10⁻⁵ ft/s at DSS 14. Geometric mean hydraulic-conductivity values from two or more tests at individual wells ranged from 2.9 x 10⁻⁷ ft/s at AGLUS 22 to 2.5 x 10⁻⁵ ft/s at DSS 14.
The median transmissivity value for the Denver Formation sandstone aquifer in and near the Lost Creek Designated Ground Water Basin was 4.0 x 10⁻⁵ ft2/s, and the geometric mean transmissivity value for the Denver Formation sandstone aquifer was 5.9 x 10⁻⁵ ft2/s. Median transmissivity values obtained from two or more tests at individual wells completed in the Denver Formation sandstone aquifer ranged from 1.8 x 10⁻⁶ to 1.0 x 10⁻³ ft2/s. Geometric mean transmissivity values from two or more tests at individual wells ranged from 1.8 x 10⁻⁶ to 1.0 x 10⁻³ ft2/s.
Hydraulic-conductivity values obtained for the alluvial and Denver Formation sandstone aquifers in and near the Lost Creek Designated Ground Water Basin are consistent with results presented in Robson (1989) and the conceptual understanding of regional hydrogeology. For the alluvial aquifer, median hydraulic-conductivity values observed during this study ranged from 2.6 x 10⁻⁶ to 7.8 x 10⁻⁴ ft/s, which are about one order of magnitude greater than median hydraulic-conductivity values observed by this study for the Denver Formation sandstone aquifer (2.9 x 10⁻⁷ to 2.5 x 10⁻⁵ ft/s; table 5) and about two to three orders of magnitude less than the range of hydraulic-conductivity values for the alluvial aquifer along the main stem of the South Platte River reported in Robson (1989) studies (1.2 x 10⁻³ to 2.3 x 10⁻² ft/s). These results indicate that the unconsolidated alluvial aquifer sediments are more conductive than the semi-consolidated Denver Formation sandstone aquifer materials, although there were an insufficient number of tests from this study to establish a statistically significant difference between the alluvial aquifer and the Denver Formation sandstone aquifer hydraulic-conductivity values. The results also support the conceptual understanding that the most conductive parts of the alluvial aquifer in the South Platte River Basin occur along the main stem of the river with less conductive sediments occurring along the tributaries. Alluvial deposits along the main channel of the South Platte River are derived from the Rocky Mountain Front Range such that they tend to exhibit coarser particle sizes and greater hydraulic-conductivity than alluvial deposits in tributaries, which are derived from sedimentary rocks of the Denver Basin (Paschke and others, in press). For the Denver Formation sandstone aquifer, the range

14
of median hydraulic-conductivity values observed during this study is within the range of hydraulic-conductivity values derived from pumping tests for the Denver Formation sandstones for the entire Denver Basin (3.5 x 10⁻⁷ to 2.8 x 10⁻⁴ ft/s; Paschke and others, in press).
Particle-Size Analysis Particle sizes were determined for 14 samples of material representative of the screened interval
in each of the 14 wells tested in this study. Complete particle-size analysis results are provided in appendix 3, and the results are summarized in table 6. Of the 14 samples collected, 8 samples represent the alluvial aquifer and 6 samples represent the Denver Formation sandstone aquifer in and near the Lost Creek Designated Ground Water Basin. Figure 2 presents the particle-size distribution by aquifer material (alluvium and Denver Formation sandstone) as a cumulative percentage of particles being smaller than a given sieve size. The wide variability in particle-size distribution of the alluvium and the relatively narrow particle-size distribution of the Denver Formation sandstone is illustrated in figure 2. The sampled alluvium generally contained a greater percentage of large particles (larger than 0.5 mm) than the sampled Denver Formation sandstone. Alternatively, the sampled Denver Formation sandstone generally contained a greater percentage of fine particles (smaller than 0.5 mm) than the sampled alluvium consistent with the finding that the alluvial aquifer is more conductive than the Denver Formation sandstone aquifer in the vicinity of the Lost Creek Designated Ground Water Basin.

15
Table 6. Distribution of sediment particle sizes in samples from screened intervals of selected wells in and near the Lost Creek Designated Ground Water Basin, north-central Colorado.
[particle-size criteria from the textural soil classification established by the U.S. Department of Agriculture (http://www.wsi.nrcs.usda.gov/products/W2Q/H&H/Training/trng_ser.html, accessed on April 2, 2010); d50, the grain size at which 50 percent of the sample is larger (or smaller); mm, millimeter; <, less than; >, greater than; percentage totals may not equal 100 due to rounding]
Percentage of sample in indicated particle-size classification
Local well name
d50 Clay Silt Very fine
sand Fine sand Medium sand Coarse sand
Very coarse sand Gravel Aquifer
material (mm) (<0.002 mm) (0.002-0.05 mm) (0.05-0.1 mm) (0.1-0.25 mm) (0.25-0.5 mm) (0.5-1 mm) (1-2 mm) (>2 mm)
Alluvium
DSS 15 0.003
26 72 0 0 0 0 0 0 AGLUS 3 2.0
1 3 1 2 6 17 44 26
AGLUS 6 0.2
6 19 8 23 31 8 0 5 AGLUS 12 0.9
1 6 1 3 10 24 38 16
AGLUS 13 0.9
1 7 3 7 13 21 32 16 AGLUS 14 0.1
3 35 6 34 19 2 0 0
AGLUS 21 0.5
1 10 3 10 23 32 20 1 AGLUS 26 2.0
0 2 0 1 6 21 44 25
Denver Formation sandstone
DSS 14 0.2
2 21 5 13 44 14 0 0 AGLUS 5 0.05
10 66 21 2 0 0 0 0
AGLUS 8 0.2
2 12 4 31 49 3 0 0 AGLUS 17 0.1
3 18 7 44 26 2 0 0
AGLUS 18 0.2
1 13 6 12 50 18 0 1 AGLUS 22 0.1
4 30 14 45 6 0 0 0

16
Figure 2. Particle-size distribution by aquifer material for selected wells in and near the Lost Creek Designated Ground Water Basin, north-central Colorado.
Particle-size distribution varied between samples collected from the screened intervals of
alluvial aquifer wells. Material obtained from DSS 15 is classified as very fine grained, with 100 percent of the particles characterized as silt or clay. Silts and fine-to medium-grained sands comprise the majority of material obtained from the screened intervals of wells AGLUS 6 and AGLUS 14. Approximately 76 percent of the material collected from AGLUS 21 consisted of particles greater than 0.25 mm in size, and 32 percent of the particles were classified as coarse sand (0.5 – 1 mm). Particle-size analysis results for AGLUS 12 and AGLUS 13 indicated a particle distribution of approximately 23 percent coarse sand (0.5 – 1 mm), 35 percent very coarse sand (1 – 2 mm), and 16 percent gravel (greater than 2 mm). Screened-interval material collected from wells AGLUS 3 and AGLUS 26 contained the greatest percentage of coarse-grained materials, with more than 25 percent gravel (greater than 2 mm) and less than 8 percent fine-grained material (less than 0.25 mm).
Samples collected from the screened intervals of Denver Formation sandstone aquifer wells were composed predominantly of fine- to medium-grained sands, accounting for as much as 80 percent of the material. Screened-interval material from Denver Formation sandstone aquifer well AGLUS 5 was the only sample classified as very fine-grained, with 97 percent of the sample having particle size of less than 0.1 mm.
The variability observed in the particle-size analysis results for alluvial and Denver Formation sandstone aquifer material from the Lost Creek Designated Ground Water Basin is consistent with the variability observed in the hydraulic-conductivity values obtained from the single-well tests. For each

17
sample, a value for the effective-particle-size diameter was calculated. These values correspond to the particle size at which 50 percent of the sample is larger (or smaller) and are represented by the term d50 (Alyamani and Sen, 1993). Figure 3 presents the d50 values and corresponding median hydraulic conductivity for each sample by aquifer material. Median hydraulic-conductivity values for the alluvial aquifer material (alluvium) range broadly from 2.6 x 10⁻⁶ ft/s to 7.8 x 10⁻⁴ ft/s and correspond to a wide range of d50 values. In general, greater d50 values correspond to greater hydraulic-conductivity values as observed in figure 3. Median hydraulic-conductivity values for the Denver Formation sandstone aquifer material ranged from 2.9 x 10⁻⁷ ft/s to 2.5 x 10⁻⁵ ft/s and correspond to d50 values that are smaller in magnitude and range than those for the alluvial aquifer.
Figure 3. Relation of median hydraulic-conductivity values to calculated d50 (particle size at which 50 percent of the sample is larger or smaller than specified value) by aquifer material for selected wells in and near the Lost Creek Designated Ground Water Basin, north-central Colorado.
Summary The U.S. Geological Survey, in cooperation with the Colorado Water Conservation Board,
carried out a data-collection program in 2003–2004 in support of the South Platte Decision Support System. Data-collection activities included the installation of 2 deep monitoring wells as well pairs with existing monitoring wells and single-well testing of the 2 newly installed wells and 12 selected agricultural land-use wells in the alluvial and shallow Denver Formation sandstone aquifers in and near the Lost Creek Designated Ground Water Basin. Core samples collected from the screened interval of each of the selected wells were analyzed for particle size. Because recovering water level data resembled those obtained from traditional slug tests, hydraulic-conductivity and transmissivity values
18
were calculated from the single-well tests according to the analytical procedures developed by Bouwer and Rice and compared with particle-size analysis results.
Single-well testing and analyses for the alluvial aquifer indicated a median hydraulic-conductivity value of 3.8 x 10⁻⁵ feet per second and geometric mean hydraulic-conductivity value of 3.4 x 10⁻⁵ feet per second. Median and geometric mean transmissivity values in the alluvial aquifer were 8.6 x 10⁻⁴ feet squared per second and 4.9 x 10⁻⁴ feet squared per second, respectively. Single-well testing and analysis from the shallow Denver Formation sandstone aquifer indicated a median hydraulic-conductivity value of 5.4 x 10⁻⁶ feet per second and geometric mean value of 4.9 x 10⁻⁶ feet per second. Median and geometric mean transmissivity values for the shallow Denver Formation sandstone aquifer were 4.0 x 10⁻⁵ feet squared per second and 5.9 x 10⁻⁵ feet squared per second, respectively.
Hydraulic-conductivity values obtained for the alluvial and Denver Formation sandstone aquifers in and near the Lost Creek Designated Ground Water Basin are consistent with results from previous studies and the conceptual understanding of regional hydrogeology. For the alluvial aquifer, median hydraulic-conductivity values observed by this study are about one order of magnitude greater than median hydraulic-conductivity values observed for the Denver Formation sandstone aquifer and about two to three orders of magnitude less than the range of hydraulic-conductivity values for the alluvial aquifer along the main stem of the South Platte River reported by previous studies. For the Denver Formation sandstone aquifer, the range of median hydraulic-conductivity values observed by this study is within the range of hydraulic-conductivity values derived from pumping tests for the Denver Formation sandstone aquifer for the entire Denver Basin.
Particle sizes were analyzed for a total of 14 samples of material representative of the screened interval in each of the 14 wells tested in this study. Of the 14 samples collected, 8 samples represent the alluvial aquifer and 6 samples represent the Denver Formation sandstone aquifer in and near the Lost Creek Designated Ground Water Basin. The variability observed in the particle-size analysis results for alluvial and Denver Formation sandstone aquifer material is consistent with the variability observed in the hydraulic-conductivity values obtained from the single-well tests. The sampled alluvial aquifer material generally contained a greater percentage of large particles (larger than 0.5 mm) than the sampled Denver Formation sandstone aquifer material. Alternatively, the sampled Denver Formation sandstone aquifer material generally contained a greater percentage of fine particles (smaller than 0.5 mm) than the sampled alluvial aquifer material consistent with the finding that the alluvial aquifer is more conductive than the Denver Formation sandstone aquifer in the vicinity of the Lost Creek Designated Ground Water Basin.

19
References Cited Alyamani, M.S., and Sen, Z., 1993, Determination of hydraulic conductivity from complete grain-size
distribution curves: Ground Water, v. 31, no. 4, p. 551-575.
Bouwer, H., and Rice, R.C., 1976, A slug test method for determining hydraulic conductivity of unconfined aquifers with completely or partially penetrating wells: Water Resources Research, v. 12, no. 3, p. 423-428.
Bouwer, H., 1989a, The Bouwer and Rice slug test--an update: Ground Water, v. 27, no. 3, p. 304-309.
Bouwer, H., 1989b, Discussion of "The Bouwer and Rice slug test-an update": Ground Water, v. 27, no. 5, p. 715.
Butler, J.J., Jr., 1998, The design, performance, and analysis of slug tests: Boca Raton, Lewis Publishers, 252 p.
Cooper, H.H., and Jacob, C.E., 1946, A generalized graphical method for evaluating formation constants and summarizing well field history. Transactions – American Geophysical Union, 27, p.526-534.
Dawson, K.J., and Istok, J.D., 1991, Aquifer testing- Design and analysis of pumping and slug tests: Chelsea, Mich., Lewis Publishers, 344 p.
Hunt, C.B., 1954, Pleistocene and Recent deposits in the Denver area, Colorado: U.S. Geological Survey Bulletin 996–C, p. 91–139.
Hurr, R.T., and Schneider, P.A., Jr., and others, 1972, Hydrogeologic characteristics of the valley-fill aquifer in the Brighton reach of the South Platte River valley, Colorado: U.S. Geological Survey Open-File Report, unnumbered.
Kruseman, G.P., and de Ridder, N.A., 1990, Analysis and evaluation of pumping test data, (2d ed.), Wagenigen, Netherlands, ILRI publication 47, 377 p.
Lapham, W.W., Wilde, F.D., and Koterba, M.T., 1995, Ground-water data-collection protocols and procedures for the National Water-Quality Assessment program – Selection, installation, and documentation of wells, and collection of related data: U.S. Geological Survey Open-File Report 95-398, 76 p.
Lewis, L.E., 1996, Designated basin: Colorado Division of Water Resources spatial dataset available on the Web, accessed October 7, 2010, at http://water.state.co.us/pubs/gis.asp.
Nelson, Haley, Patterson, & Quirk, Inc., 1967, Ground-water resources of the Lost Creek drainage basin, Weld, Adams, and Arapahoe Counties, Colorado: Prepared for the Colorado Groundwater Commission by Nelson, Haley, Patterson, & Quirk, Inc., Consulting Engineers and Geologists, June 1967.
Paschke, S.S., Banta, E.R., Webbers, Ank, and Capesius, J.P., in press, Introduction, conceptual model, hydrogeologic framework, and predevelopment groundwater availability of the Denver Basin Aquifer System, Colorado, Chapter A: U.S. Geological Survey Professional Paper 1770-A.
Robson, S.G., 1989, Alluvial and bedrock aquifers of the Denver Basin – Eastern Colorado’s dual ground-water resource: U.S. Geological Survey Water-Supply Paper 2302, 40 p.

20
Robson, S.G., 1996, Geohydrology of the shallow aquifers in the Denver metropolitan area, Colorado: U.S. Geological Survey Hydraulic Investigations Atlas HA-736, scale 1:50,000, 5 sheets.
Schupbach, S.A., and Lewis, L.E., 1996, CDSS lakes Division 1: Colorado’s Decision Support Systems spatial dataset available on the Web, accessed October 7, 2010, at http://cdss.state.co.us/DNN/GIS/tabid/67/Default.aspx.
Smith, R.O., Schneider, P.A., Jr., and Petri, L.R., 1964, Ground-water resources of the South Platte River basin in western Adams and southwestern Weld Counties, Colorado: U.S. Geological Survey Water-Supply Paper 1658, 132 p.
U.S. Geological Survey, 2006, Collection of water samples (ver. 2.0): U.S. Geological Survey Techniques of Water-Resources Investigations, book 9, chap. A.4, accessed October 7, 2010, at http://pubs.water.usgs.gov/twri9A4/.

Appendix 1 – Well permits, records of well completion, and geologic logs

Appendix 2 – Single-well test data and analyses
Appendix 3 – Particle-size analysis data