Well Field Optimization Project Database Management System ...
69
Well Field Optimization Project Database Management System (DMS) User’s Manual Stanislaus and Tuolumne Rivers Groundwater Basin Association Prepared By: GEI Consultants, Bookman-Edmonston Division Project No: 054030
Transcript of Well Field Optimization Project Database Management System ...
Well Field Optimization ProjectDatabase Management System (DMS)
User’s ManualStanislaus and Tuolumne Rivers Groundwater Basin Association
Prepared By:GEI Consultants, Bookman-Edmonston Division
Project No: 054030
Stanislaus and Tuolumne Rivers Groundwater Basin Association
Well Field Optimization (WFO) User’s Manual Version 1.0
Date: June 29, 2007 Project No: 054030
W E L L F I E L D O P T I M I Z A T I O N P R O J E C T
Table of Contents
1 Overview 1 1.1 Data Management System 1 1.2 Decision Support System 1 1.3 Well Production Scenarios 2
2 Purpose of Manual 3 Who? 3 What? 3 Where? 3 When? 3 Why? 4 How? 4
3 Minimum Requirements 5 3.1 Software 5 3.2 Skills/Knowledge 5 3.3 Memory & Storage 5 3.4 Installation 5
Network Installation (recommended) 5 Local Installation (only recommended for test period) 6 Shortcut 6
3.5 Access/Protection 6
4 Getting Started 7 4.1 Getting Started 7
Opening the WFO 7 Tool Selection Menu 8
5 Guide to Using DMS 9 5.1 Introduction 9
Main Menu 10 5.2 Data Review 12
Well Selection (in Main Menu) 12 Select Type of Data to Review 13 Well Production Report 14 Water Level Report 16 Water Quality Report 18 Specifications Report 20 Report Options Menu 22 Comparison Menu 24
5.3 Data Entry 28 Well Production Data Input 28
i
W E L L F I E L D O P T I M I Z A T I O N P R O J E C T
ii
Water Level Data Input 29 Water Level Data Input 30 Water Quality Data Input 32 Create New Well 34 Pump Test Data Input 37
5.4 Data Update 40 Lateral Reaches 40 Well Run Log 42 Ditch Tender Areas 43
5.5 Quality Assurance/Quality Control (QA/QC) 44 Data Flow 44 User Responsibility 44 Built-in QA/QC Functionality 45 Post-Data Entry Review 45
6 Guide to Using the DSS 47 6.1 Introduction 47 6.2 Using the DSS 48
Interactive Well Selection Map 48 Decision Support System Menu 48 Available Wells 52
7 Guide to Using the WPS 56 7.1 Introduction 56 7.2 Using the WPS 57
WPS Form 57
8 Abbreviations & Acronyms 62
9 References (for more Information) 63
Appendices Appendix A – Table of Database Parameters
W E L L F I E L D O P T I M I Z A T I O N P R O J E C T
1 Overview
The Well Field Optimization (WFO) application is a Microsoft® (MS) Access database that contains two custom tools—the Data Management System (DMS), and the Decision Support System (DSS), which combine to assist the user with data storage, retrieval, and analysis. This manual was prepared to assist the users in the operation of the Data Management System, the Decision Support System, and the well production scenario programs.
1.1 Data Management System The Data Management System (DMS) is a custom interface for entering well data into a database, viewing data, and generating reports. The DMS interacts with the Decision Support System (DSS), supplying well data used in the DSS decision algorithm and logging well operation status as orders are placed.
Well data collected through monitoring or maintenance activities is entered directly into the DMS. This data may include water quality parameters, static and pumping water levels, and production data. Parameters that remain static over time, such as well location and ID, are included in the Specifications table.
The DMS interface allows the user to generate tabular and graphical reports for a particular well or group of wells for a specified time period. The Comparison menu is a powerful graphical tool that allows for simultaneous viewing of three time series plots of monitoring data at a single well. For example, the user may view water level, production, and total dissolved solids (TDS) over a single time period; or the user may choose to view a single parameter at three different time periods. Additional graphics are included under the Maintenance menu, which plots well efficiency parameters.
The DMS was designed with input from the Stanislaus & Tuolumne River Groundwater Basin Association (Association) as one of four components of the Well Field Optimization project. Together with the DSS, WPS, and system-wide well evaluations, the DMS will serve the Association’s need to effectively manage and optimize well field operations.
1.2 Decision Support System The Decision Support System (DSS) is a custom tool within Microsoft® (MS) Access for optimizing the operation of wells. The DSS interacts with the Database Management System (DMS), retrieving well data from the DMS and updating well operation status as orders are placed.
1

W E L L F I E L D O P T I M I Z A T I O N P R O J E C T
The main function of the DSS is to automate the decision process for system operators in selecting wells to meet deliveries. The DSS optimizes well selection based on criteria input by the operator, including location, time of delivery, flow rate, efficiency, and water quality (optional). DSS output includes a list of available wells that meet the selection criteria, well information on upstream wells that did not meet request criteria, and expected lateral conditions. The user can select from among the eligible wells to satisfy the order.
The DSS was designed with input from the Association as one of four components of the Well Field Optimization project. Together with the DMS, WPS, and system-wide well evaluations, the DSS will serve the Association’s need to effectively manage and optimize well field operations.
In addition, the DSS will eventually link to a SCADA system, which will allow for real-time, remote operation of the system.
1.3 Well Production Scenarios Well Production Scenarios (WPS) is a custom tool within the Field Optimization Microsoft® (MS) Access database. The WPS interacts with the Database Management System (DMS), using data stored to assist the user in creating production scenarios.
The main function of the WPS is to create production scenarios (for the purpose of water production planning) ranging from the entire district to specific wells for a specified volume of water. The WPS uses data from the DMS, such as laterals, ditch tender areas, well power consumption, and water quality, to assist in running scenarios.
The WPS was designed with input from the Associations as one of four components of the Well Field Optimization project. Together with the DMS, DSS, and system-wide well evaluations, the WPS will serve the Association’s need to effectively manage and optimize well field operations.
2

W E L L F I E L D O P T I M I Z A T I O N P R O J E C T
2 Purpose of Manual
The purpose of this manual is to supply users of the Well Field Optimization (WFO) application with a guide for using the DMS for data entry and report generation, and DSS for well management and optimization.
Who? The WFO was created for water resources managers, system operators, and technicians in the Stanislaus & Tuolumne River Groundwater Basin Association (Association). The project was funded by a grant from the Department of Water Resources Local Groundwater Assistance Program to Modesto Irrigation District (MID) on behalf of the Association. The grant funded the development of optimization tools, including the DMS and DSS, for the management zones covered by MID and Oakdale Irrigation District (OID). Eventually, the WFO can be expanded to include all management zones within the Basin.
The WFO was developed by GEI Consultants, Inc., Bookman-Edmonston Division Naser Bateni, Project Manager GEI Consultants, Inc., Bookman-Edmonston Division 10860 Gold Center Drive, Suite 350 Rancho Cordova, CA 95670 916.631.4500
What? The database and custom user interface for data entry and analysis were developed within the Microsoft® Access database program, using code written in MS Visual Basic 6.0. Data stored in the database includes past and current well operational and maintenance information. A complete list of data parameters is included in Appendix A.
Where? The WFO is housed and updated by the districts on a local network server. It is envisioned that eventually the WFO will be web-based allowing users to access, view, and update the database through the internet.
When? This manual is for WFO Version 1.0, April 2007.
3

W E L L F I E L D O P T I M I Z A T I O N P R O J E C T
Why? To satisfy goals of the Association, as stated in the Integrated Regional Groundwater Management Plan (IRGMP), including managing and optimizing the groundwater and surface water resources of the Basin.
How? The following sections of this manual provide instructions on how to use the WFO. Starting with the next section, Minimum Requirements, read the manual straight through to the end. If you come across a term you are not familiar with, refer to Section 8, Abbreviations and Acronyms. If you still cannot find the answer to your question in this manual, one of the references in Section 8 may have the answer. See “Who?” above for developer contact information.
4

W E L L F I E L D O P T I M I Z A T I O N P R O J E C T
3 Minimum Requirements
3.1 Software The minimum software package required is Microsoft® Office Access 2003 SP1.
3.2 Skills/Knowledge General computer knowledge, including familiarity with Windows Operating Systems (e.g., Windows XP) and windows interfaces (e.g., the File menu that is common to MS programs, including MS Word), is necessary to run the program.
The graphical user interface is designed to be user-friendly, so that no prior knowledge of MS Access is required to enter data or generate reports. However, technical support is not available for the program, so it is necessary to have someone competent with MS Access on staff.
DMS data entry should always be overseen by someone very familiar with the data collected, including the method of data collection and the collection sites. See Section 5.5, “QA/QC,” for more information.
DSS operation should only be performed by someone with experience and knowledge of the system’s operation (e.g., Ditch Tenders and District Engineers/Managers).
3.3 Memory & Storage The minimum memory and storage is determined by two factors. First, the system must be able to install the MS Access database program. Second, the user’s system must have 20MB of storage available for the application to be installed. The storage size for the application will grow depending on the amount of data input.
3.4 Installation
Network Installation (recommended)
To install the WFO on a network for use by multiple users, first copy the file “WFO1_0.mdb” on the CD to a location on your local hard drive, for example C:\WFO. Open WFO1_0.mdb in MS Access and go to Window->Unhide and select the database. Make the database window active and go to Tools->Database Utilities->Database Splitter. Save the tables (database back-end) on the network where all users can access the file. Send the user interface (front-end) to each person who will use the program. This will allow multiple users to input and retrieve data.
5
W E L L F I E L D O P T I M I Z A T I O N P R O J E C T
6
Local Installation (only recommended for test period)
Copy the file “WFO1_0.mdb” on the CD to a location on your local hard drive, for example C:\WFO. The WFO will not run properly directly from the CD.
Shortcut
If the user would like a shortcut for easier accessibility, they can right click on the front-end mdb file and drag and drop to the location where they would like the shortcut, such as the desktop. A menu will appear and the user should choose “Create Shortcuts Here.”
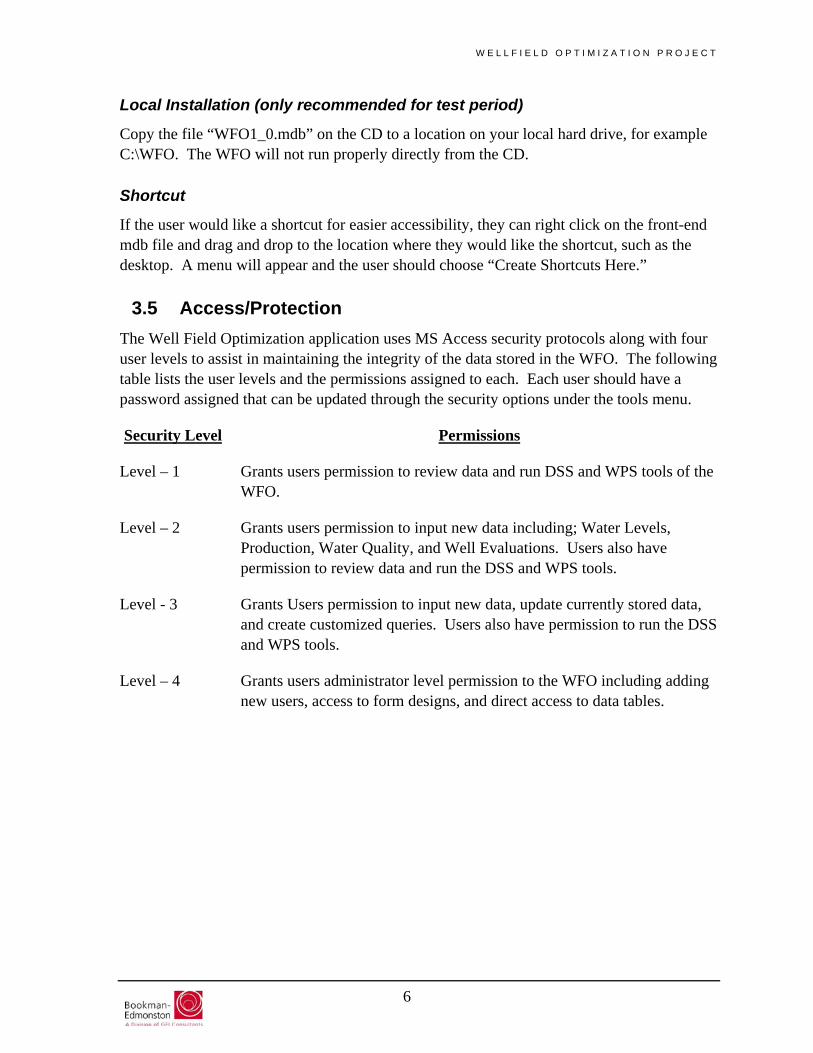
3.5 Access/Protection The Well Field Optimization application uses MS Access security protocols along with four user levels to assist in maintaining the integrity of the data stored in the WFO. The following table lists the user levels and the permissions assigned to each. Each user should have a password assigned that can be updated through the security options under the tools menu.
Security Level Permissions
Level – 1 Grants users permission to review data and run DSS and WPS tools of the WFO.
Level – 2 Grants users permission to input new data including; Water Levels, Production, Water Quality, and Well Evaluations. Users also have permission to review data and run the DSS and WPS tools.
Level - 3 Grants Users permission to input new data, update currently stored data, and create customized queries. Users also have permission to run the DSS and WPS tools.
Level – 4 Grants users administrator level permission to the WFO including adding new users, access to form designs, and direct access to data tables.
W E L L F I E L D O P T I M I Z A T I O N P R O J E C T
4 Getting Started
4.1 Getting Started See Section 3.4, Installation, for installation instructions.
Opening the WFO
Navigate to and open the file “WFO1_0.mdb” on your hard drive. Alternatively, open MS Office Access, select File -> Open, and navigate to “WFO1_0.mdb.”
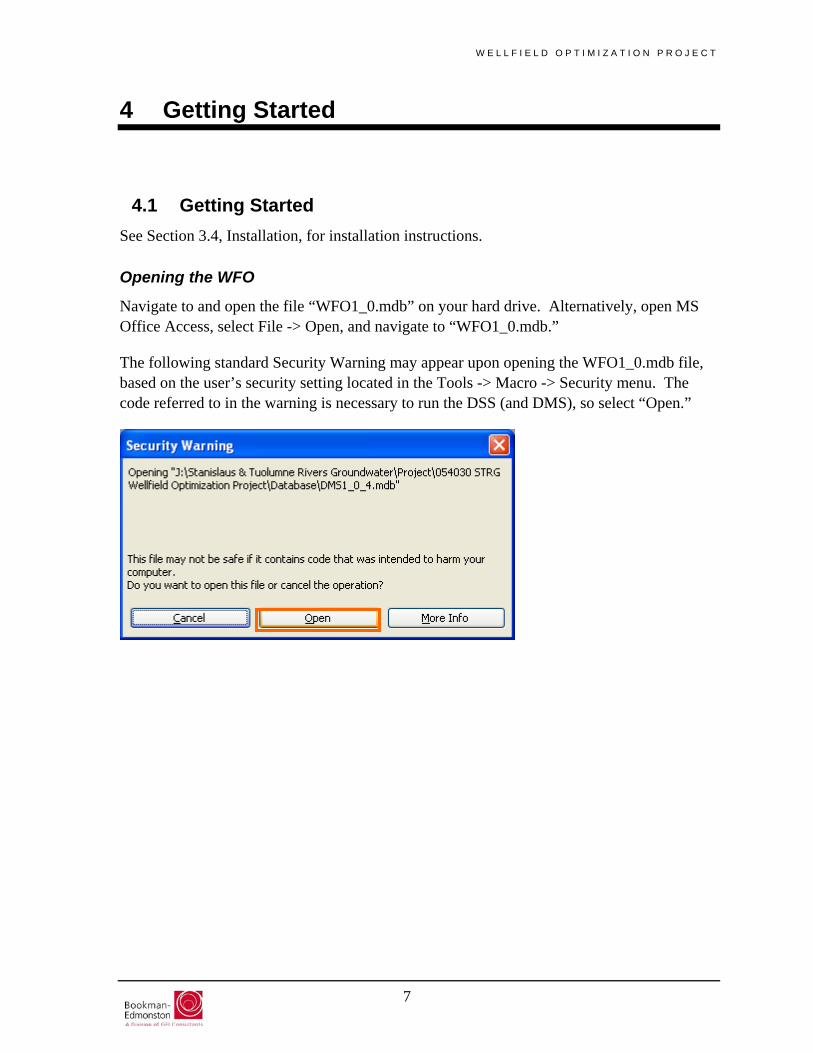
The following standard Security Warning may appear upon opening the WFO1_0.mdb file, based on the user’s security setting located in the Tools -> Macro -> Security menu. The code referred to in the warning is necessary to run the DSS (and DMS), so select “Open.”
7
W E L L F I E L D O P T I M I Z A T I O N P R O J E C T
Tool Selection Menu
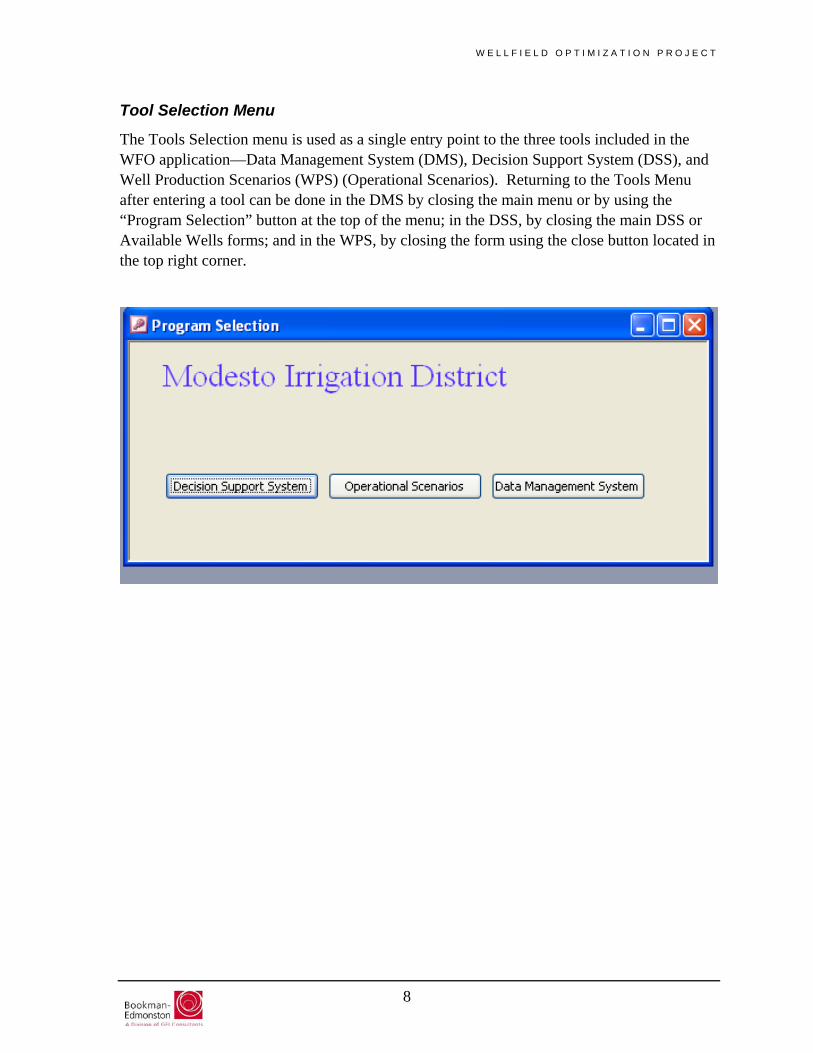
The Tools Selection menu is used as a single entry point to the three tools included in the WFO application—Data Management System (DMS), Decision Support System (DSS), and Well Production Scenarios (WPS) (Operational Scenarios). Returning to the Tools Menu after entering a tool can be done in the DMS by closing the main menu or by using the “Program Selection” button at the top of the menu; in the DSS, by closing the main DSS or Available Wells forms; and in the WPS, by closing the form using the close button located in the top right corner.
8
W E L L F I E L D O P T I M I Z A T I O N P R O J E C T
5 Guide to Using DMS
Before beginning make sure that you have permission and are qualified to use the DMS. See Section 5.5, “QA/QC,” for details.
5.1 Introduction The DMS is a custom user interface constructed within the MS Access environment using MS Access VBA code. The user interface displays data filtered by a number of parameters including well selection, time periods, and data types (Production, Water Levels, etc). Parameters are selected by the user.
To begin reviewing well data for your district, continue to the “Data Review” section. To begin entering data, begin with the “Data Entry” section. The sections are presented in a step-by-step manner, with screen captures for each new menu or screen and detailed instructions for working through each menu’s options. Note: Microsoft product screen shots are reprinted with permission from Microsoft Corporation.
With the exception of Well Selection (under Data Review), all of the sub-menus under Data Review and Data Entry are independent, so you can skip around in this manual depending on your interests (e.g., go directly to the discussion on Water Quality after reading the Well Selection discussion).
9
W E L L F I E L D O P T I M I Z A T I O N P R O J E C T
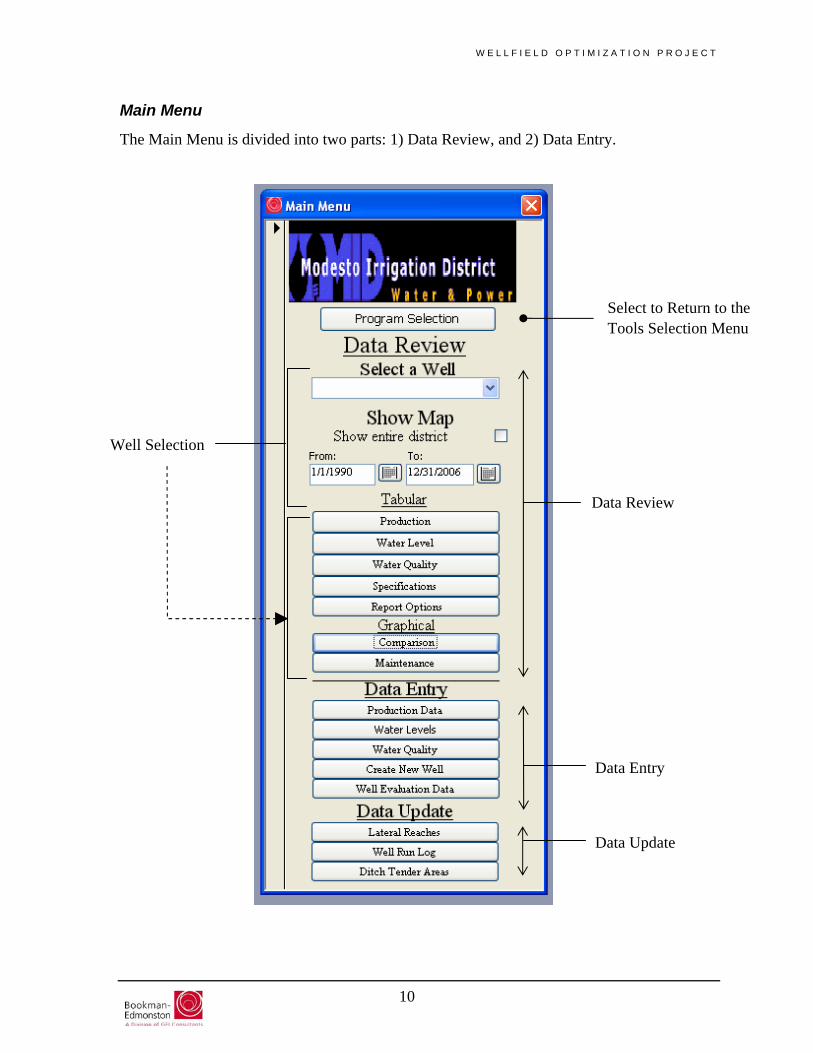
Main Menu
The Main Menu is divided into two parts: 1) Data Review, and 2) Data Entry.
Well Selection
Data Review
Select to Return to the Tools Selection Menu
Data Entry
Data Update
10
W E L L F I E L D O P T I M I Z A T I O N P R O J E C T
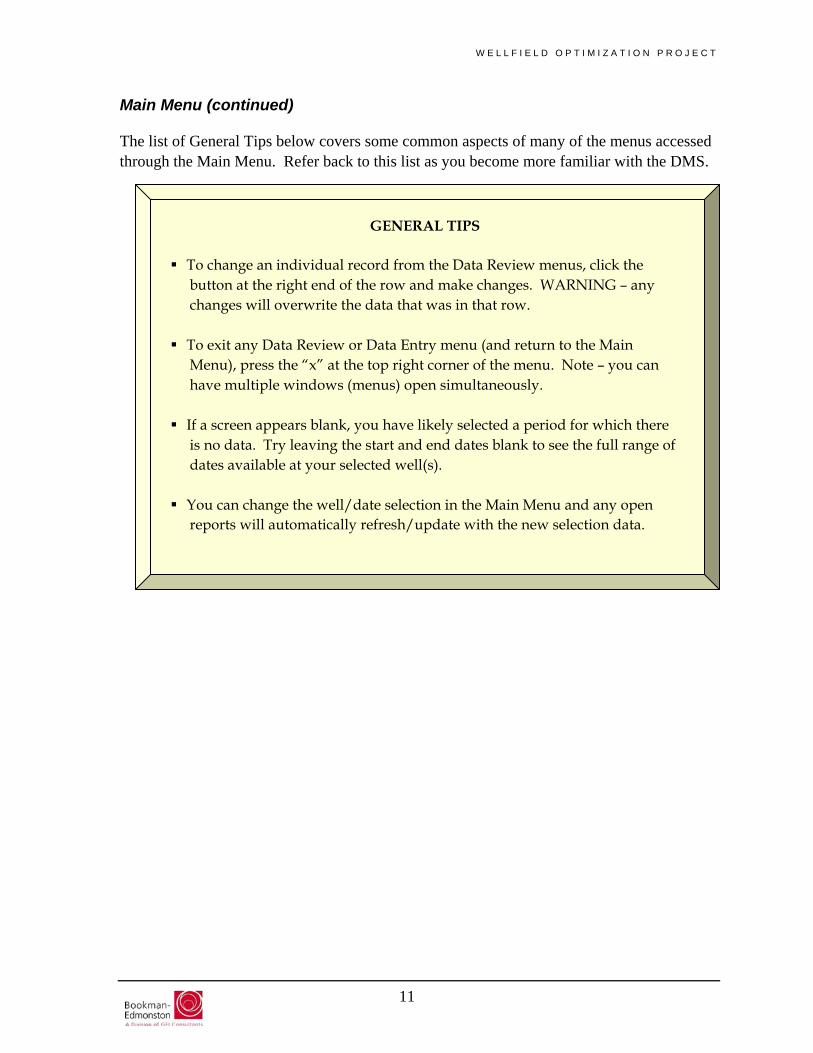
Main Menu (continued)
The list of General Tips below covers some common aspects of many of the menus accessed through the Main Menu. Refer back to this list as you become more familiar with the DMS.
You can change the well/date selection in the Main Menu and any open reports will automatically refresh/update with the new selection data.
If a screen appears blank, you have likely selected a period for which there is no data. Try leaving the start and end dates blank to see the full range of dates available at your selected well(s).
To exit any Data Review or Data Entry menu (and return to the Main Menu), press the “x” at the top right corner of the menu. Note – you can have multiple windows (menus) open simultaneously.
GENERAL TIPS
To change an individual record from the Data Review menus, click the button at the right end of the row and make changes. WARNING – any changes will overwrite the data that was in that row.
11
W E L L F I E L D O P T I M I Z A T I O N P R O J E C T
5.2 Data Review Data Review includes viewing, saving, and printing tabular and graphical data reports.
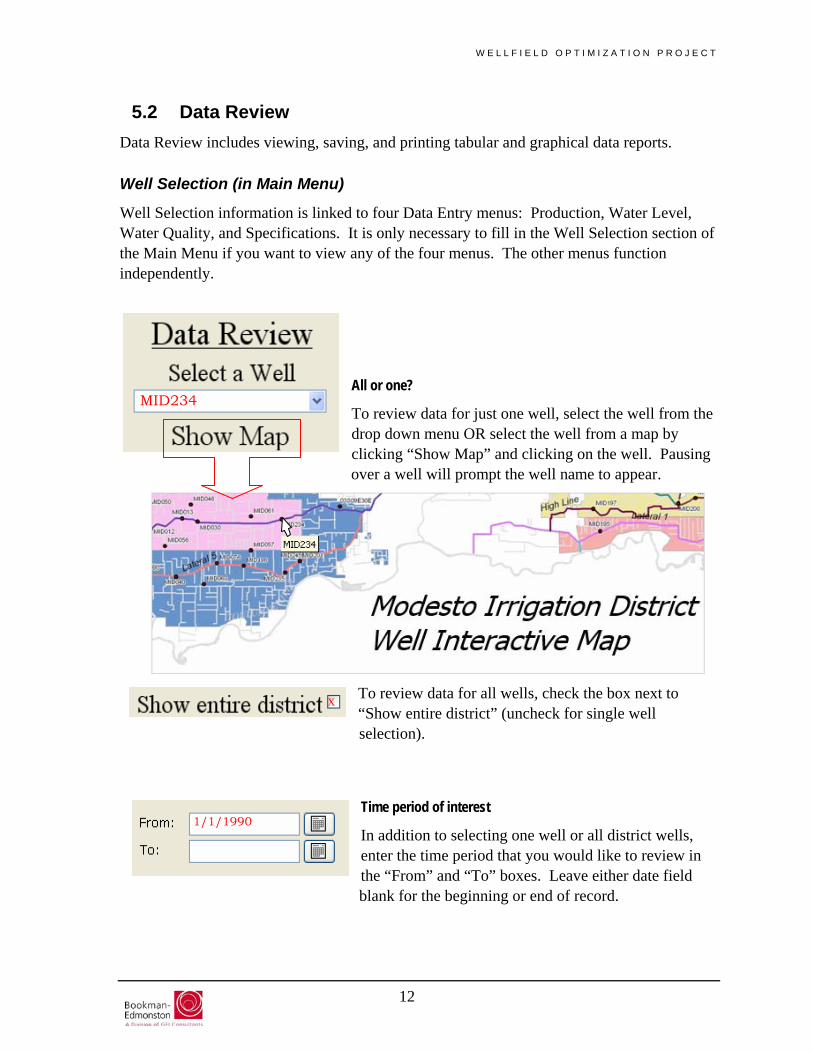
Well Selection (in Main Menu)
Well Selection information is linked to four Data Entry menus: Production, Water Level, Water Quality, and Specifications. It is only necessary to fill in the Well Selection section of the Main Menu if you want to view any of the four menus. The other menus function independently.
All or one? MID234
To review data for just one well, select the well from the drop down menu OR select the well from a map by clicking “Show Map” and clicking on the well. Pausing over a well will prompt the well name to appear.
To review data for all wells, check the box next to “Show entire district” (uncheck for single well selection).
X
Time period of interest 1/1/1990
In addition to selecting one well or all district wells, enter the time period that you would like to review in the “From” and “To” boxes. Leave either date field blank for the beginning or end of record.
12
W E L L F I E L D O P T I M I Z A T I O N P R O J E C T
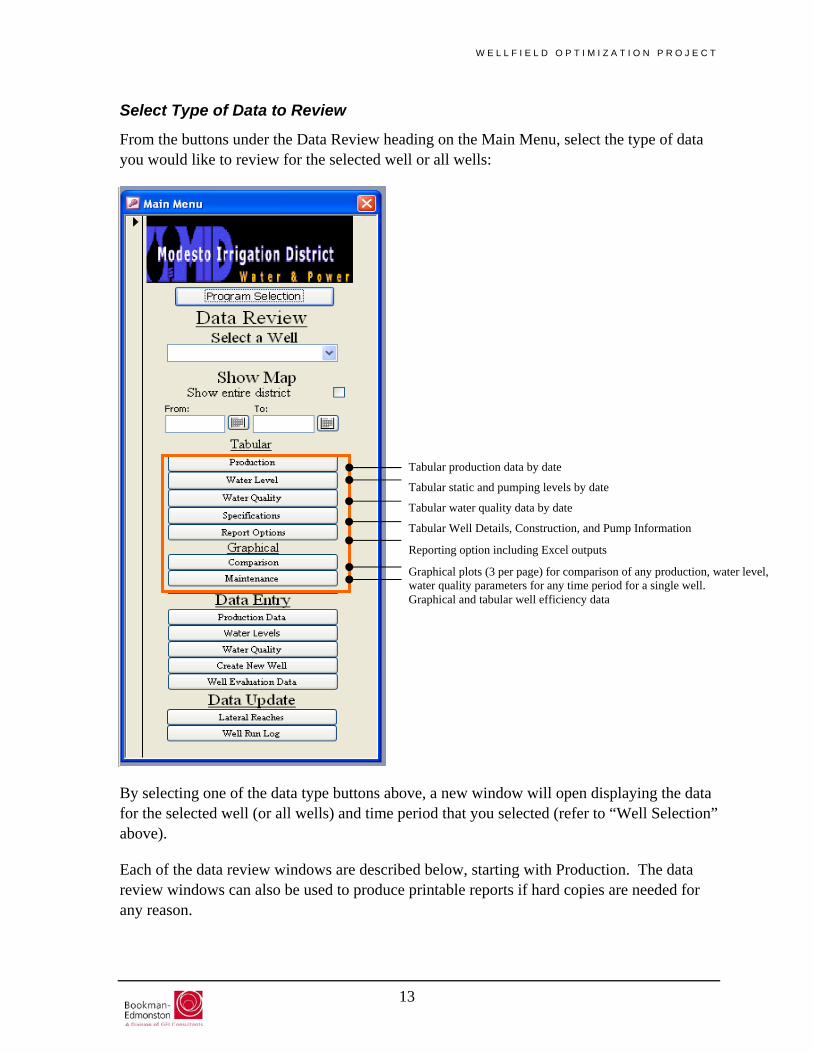
Select Type of Data to Review
From the buttons under the Data Review heading on the Main Menu, select the type of data you would like to review for the selected well or all wells:
Tabular production data by date
Tabular static and pumping levels by date
Tabular water quality data by date
Tabular Well Details, Construction, and Pump Information
Reporting option including Excel outputs
Graphical plots (3 per page) for comparison of any production, water level, water quality parameters for any time period for a single well. Graphical and tabular well efficiency data
By selecting one of the data type buttons above, a new window will open displaying the data for the selected well (or all wells) and time period that you selected (refer to “Well Selection” above).
Each of the data review windows are described below, starting with Production. The data review windows can also be used to produce printable reports if hard copies are needed for any reason.
13

W E L L F I E L D O P T I M I Z A T I O N P R O J E C T
14
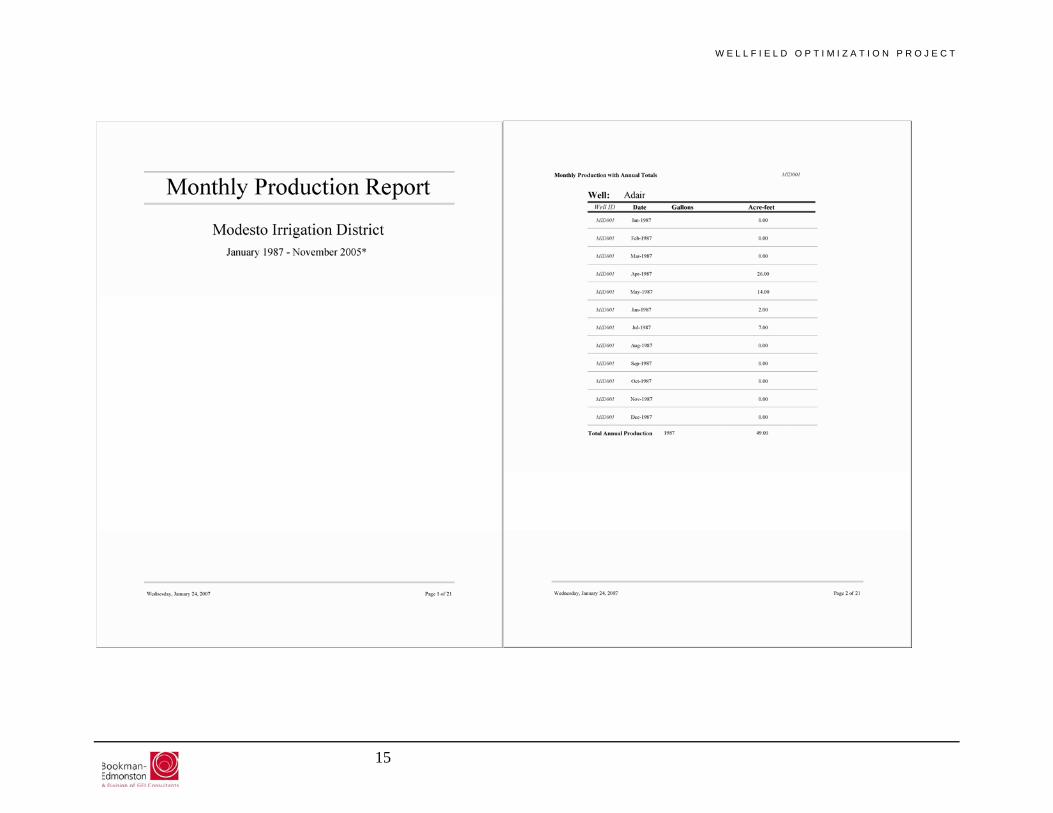
Well Production Report
When the “Production” button is selected on the Main Menu, the Well Production report window opens, as shown below.
Save to File
Arrow/line will take you to the last record.
Well production data, in acre-feet or gallons, is displayed in a scrollable table for the well(s) and time period selected in the main menu. Review the data on-screen by scrolling through individual records on the bottom of the screen or with the scrollbar. Note that one record is one row, and clicking on the arrow/line ( ) will take you to the last record in the report. This is useful to check that the report contains all of the data you want.
Reporting options in the Well Production window include “Save to File” and “Print” in the upper right-hand corner of the window. “Save to File” saves the selected production records in one of eight formats, including text or MS Excel. “Print” opens a Print Preview window displaying the document, which you can then print to your printer or file through File -> Print (Ctrl+P). Note that for readability, printed and saved reports include additional title and header information. An example Well Production Report is shown below.
W E L L F I E L D O P T I M I Z A T I O N P R O J E C T
15

W E L L F I E L D O P T I M I Z A T I O N P R O J E C T
Water Level Report
When “Water Level” is clicked on the Main Menu, the Water Level window opens, as shown below.
Well static and pumping water level data is displayed in a scrollable table for the well(s) and time period selected. You can review the data on-screen by scrolling through individual records on the bottom of the screen or with the scrollbar. Note that one record is one row, and if you click the arrow/line ( ), it will take you to the last record in the report. This is useful to check that the report contains all of the data you want.
Reporting options in the Well Level window include “Save to File” and “Print” in the upper right hand-corner of the window. “Save to File” saves the selected production records in one of eight formats, including text or MS Excel. “Print” opens a Print Preview window displaying the document, which you can then print to your printer or file through File -> Print (Ctrl+P). Note that for readability, printed and saved reports include additional title and header information. An example report layout is shown below.
16

W E L L F I E L D O P T I M I Z A T I O N P R O J E C T
17
W E L L F I E L D O P T I M I Z A T I O N P R O J E C T
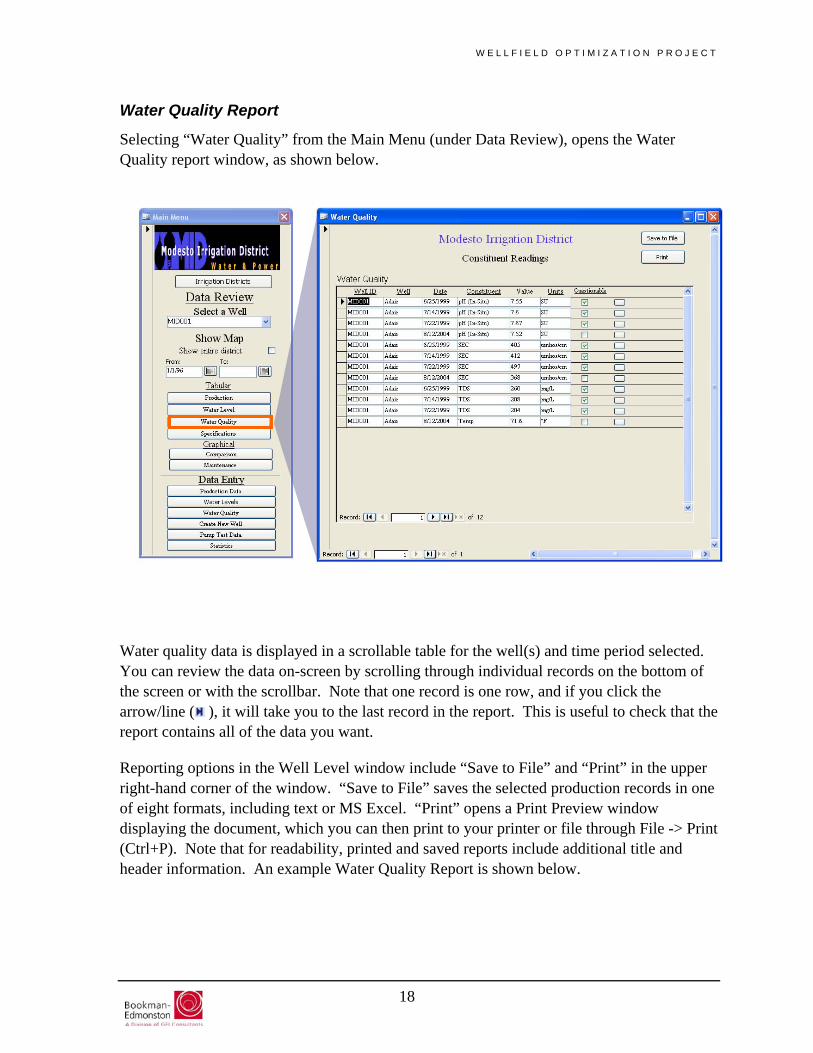
Water Quality Report
Selecting “Water Quality” from the Main Menu (under Data Review), opens the Water Quality report window, as shown below.
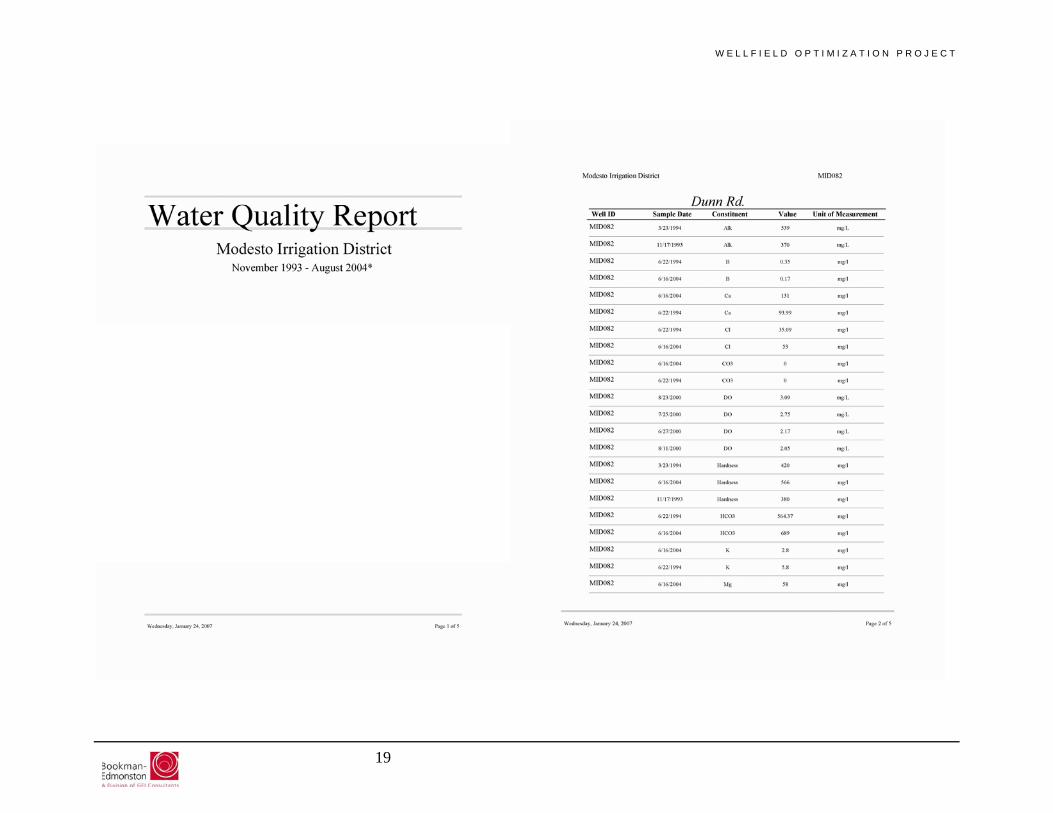
Water quality data is displayed in a scrollable table for the well(s) and time period selected. You can review the data on-screen by scrolling through individual records on the bottom of the screen or with the scrollbar. Note that one record is one row, and if you click the arrow/line ( ), it will take you to the last record in the report. This is useful to check that the report contains all of the data you want.
Reporting options in the Well Level window include “Save to File” and “Print” in the upper right-hand corner of the window. “Save to File” saves the selected production records in one of eight formats, including text or MS Excel. “Print” opens a Print Preview window displaying the document, which you can then print to your printer or file through File -> Print (Ctrl+P). Note that for readability, printed and saved reports include additional title and header information. An example Water Quality Report is shown below.
18
W E L L F I E L D O P T I M I Z A T I O N P R O J E C T
19
W E L L F I E L D O P T I M I Z A T I O N P R O J E C T
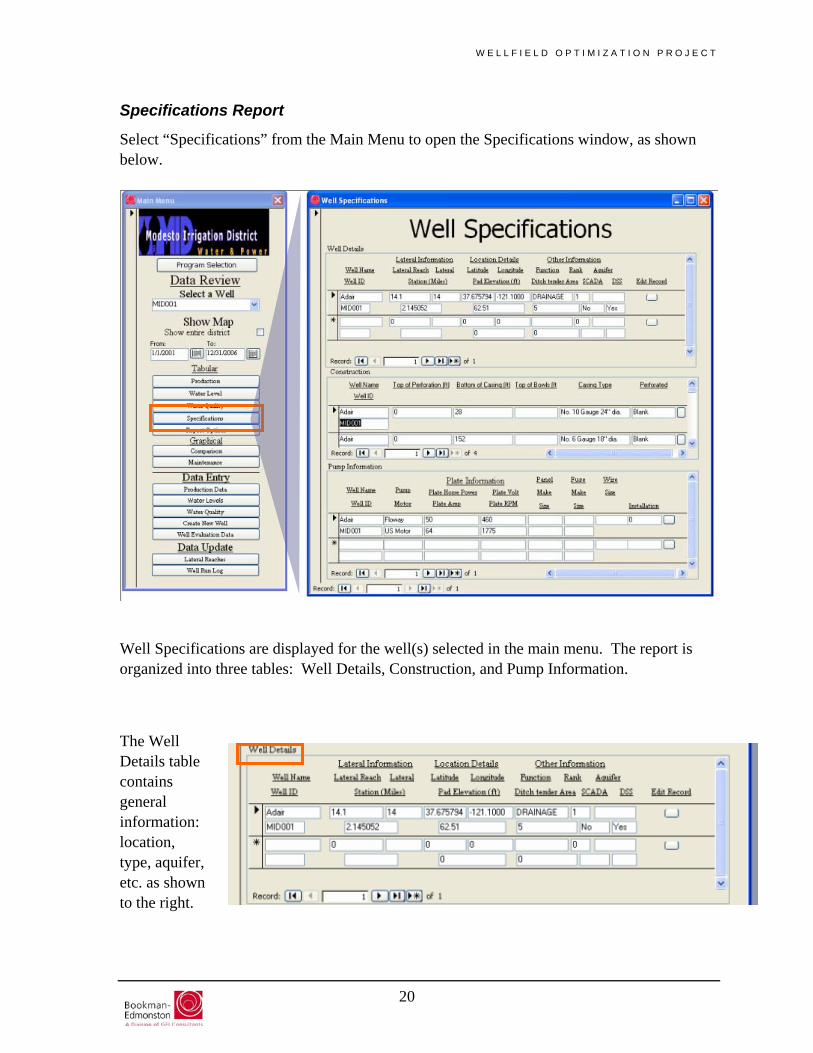
Specifications Report
Select “Specifications” from the Main Menu to open the Specifications window, as shown below.
Well Specifications are displayed for the well(s) selected in the main menu. The report is organized into three tables: Well Details, Construction, and Pump Information.
The Well Details table contains general information: location, type, aquifer, etc. as shown to the right.
20

W E L L F I E L D O P T I M I Z A T I O N P R O J E C T
Specifications Report (continued)
The Construction Table includes well elevation and casing information as shown to the right. The Pump Information Table includes pump and motor information as shown to the right. Review the data on-screen by scrolling through individual records using the arrows at the bottom of each table or with the scrollbars. Note that one record is one row, and if you click the arrow/line ( ), it will take you to the last record in the report.
21
W E L L F I E L D O P T I M I Z A T I O N P R O J E C T
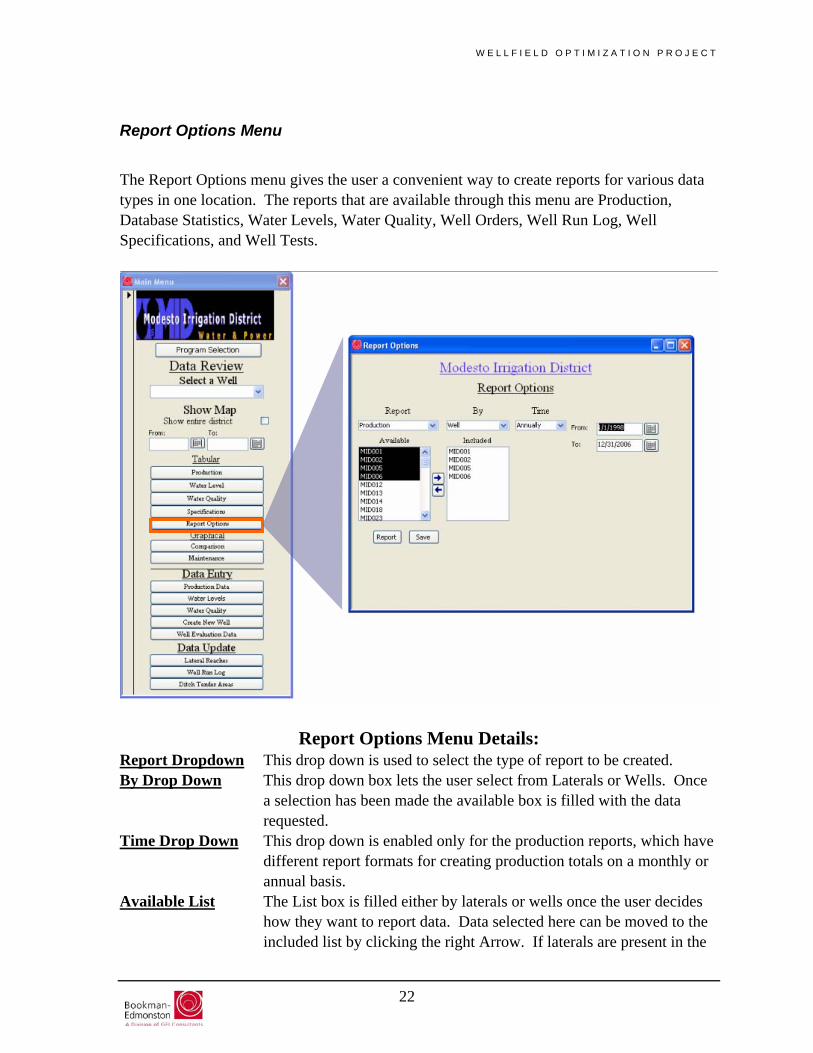
Report Options Menu
The Report Options menu gives the user a convenient way to create reports for various data types in one location. The reports that are available through this menu are Production, Database Statistics, Water Levels, Water Quality, Well Orders, Well Run Log, Well Specifications, and Well Tests.
Report Options Menu Details: Report Dropdown This drop down is used to select the type of report to be created. By Drop Down This drop down box lets the user select from Laterals or Wells. Once
a selection has been made the available box is filled with the data requested.
Time Drop Down This drop down is enabled only for the production reports, which have different report formats for creating production totals on a monthly or annual basis.
Available List The List box is filled either by laterals or wells once the user decides how they want to report data. Data selected here can be moved to the included list by clicking the right Arrow. If laterals are present in the
22

W E L L F I E L D O P T I M I Z A T I O N P R O J E C T
Available box and chosen, the wells assigned to that lateral fill the Included box.
Included List This list contains the wells that will be included on the report selected. Wells can be added or removed from this box at any time by using the arrows located to its left. The left arrow is used to remove the selected wells from the Included list. The right arrow is used to add the selected wells in the Available list to the Included list.
From Box This box is used to contain a start date for the data displayed in the report. If a start date is not chosen, the report will collect any data that applies in the DMS.
To Box This box is used to input an end date for the data displayed in the report. If an end date is not chosen, the end date will default to the current date.
Report Button This button creates a MS Access formatted report. Save Button This button creates a MS Excel spreadsheet containing the requested
data. This option is available for Production, Water Level, and Water Quality Reports.
Constituent List The constituent list is enabled only when the Water Quality report type is chosen.
Water Level Drop Down The Water Level drop down is enabled only when the Water Level
report type is chosen. Pumping (ft-btoc) or Static (ft-btoc) can be chosen from the Water Level drop down.
23
W E L L F I E L D O P T I M I Z A T I O N P R O J E C T
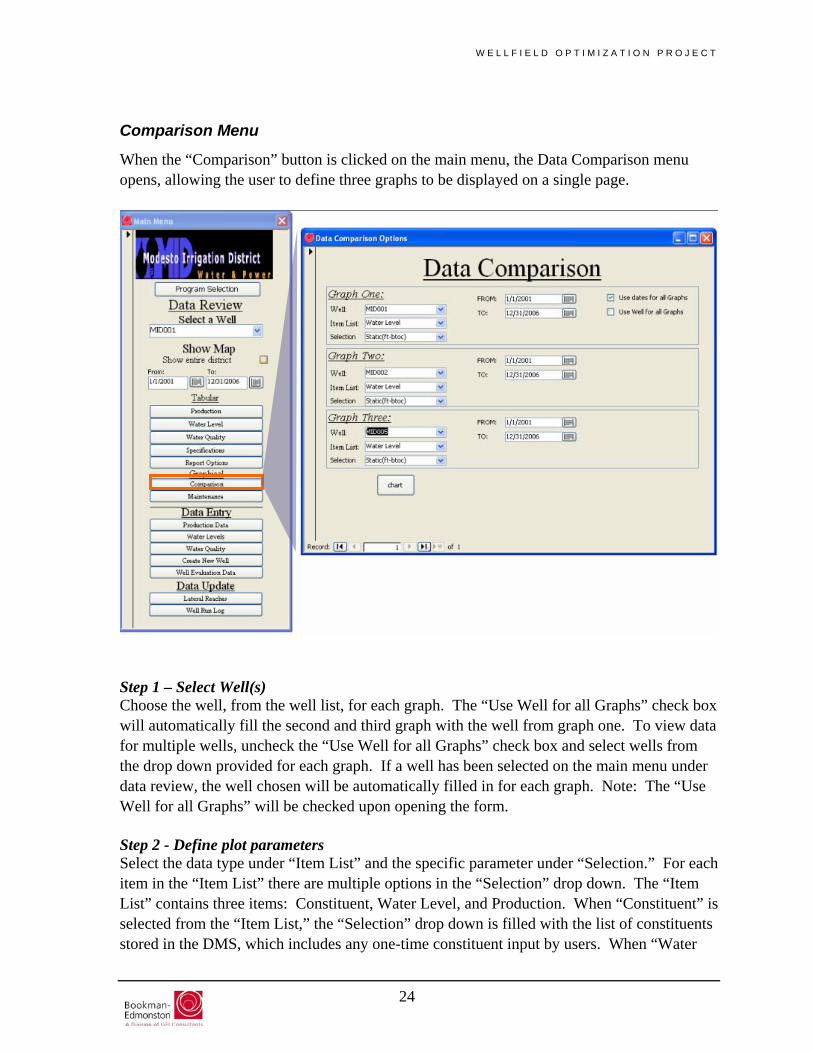
Comparison Menu
When the “Comparison” button is clicked on the main menu, the Data Comparison menu opens, allowing the user to define three graphs to be displayed on a single page.
Step 1 – Select Well(s) Choose the well, from the well list, for each graph. The “Use Well for all Graphs” check box will automatically fill the second and third graph with the well from graph one. To view data for multiple wells, uncheck the “Use Well for all Graphs” check box and select wells from the drop down provided for each graph. If a well has been selected on the main menu under data review, the well chosen will be automatically filled in for each graph. Note: The “Use Well for all Graphs” will be checked upon opening the form. Step 2 - Define plot parameters Select the data type under “Item List” and the specific parameter under “Selection.” For each item in the “Item List” there are multiple options in the “Selection” drop down. The “Item List” contains three items: Constituent, Water Level, and Production. When “Constituent” is selected from the “Item List,” the “Selection” drop down is filled with the list of constituents stored in the DMS, which includes any one-time constituent input by users. When “Water
24

W E L L F I E L D O P T I M I Z A T I O N P R O J E C T
Level” is chosen, there are two selections for the user: “Pumping (ft-btoc)” and “Static (ft-btoc).” When “Production” is chosen, the selection option for the user is “Volume (Acre-feet).” Step 3 - Define time period
Single Time Period Comparison By default, the From and To dates are automatically filled with the dates from the main menu and the “Use dates for all Graphs” box is checked. To select a different time period for all graphs, change the From and To dates for only Graph One.
Multiple Time Periods Comparison To select different time periods for each graph, uncheck the “Use dates for all Graphs” box, then change the dates independently for the three Graphs. Step 4 - Plot! Click the “chart” button to plot. A new window will open displaying the three charts:
25

W E L L F I E L D O P T I M I Z A T I O N P R O J E C T
To view the same graphs for another well, return to the Data Comparison menu by either closing the chart window or by clicking the Next Well/Previous Well buttons at the top of the plot. The next and previous well buttons will not be available for the user when data is displayed for multiple wells. Print the chart from this screen by selecting “Print.” Note: Clicking the print button automatically prints to your default printer; to print to a different printer, do not click “Print,” and instead go to File -> Print (Ctrl+P)). “No Data” will appear in the chart area if there is no data for the selection criteria.
26

W E L L F I E L D O P T I M I Z A T I O N P R O J E C T
Maintenance Report
Select “Maintenance” from the Main Menu to open the Well Efficiency report window, as shown below. Well Efficiency data, including flow, static and pumping water levels, and efficiency, are displayed in graphical and tabular format for a single well and time period selected from the main menu.
To view a different well, either select a different well from the Main Menu or click the Next Well/Previous Well buttons at the top of the plot.
To view a different time period, select a different time period from the main menu. To automatically print to your default printer, click the “Print” button. To print to a different printer, do not click “Print,” and go instead to File -> Print (Ctrl+P). The printed version looks the same as the on-screen version, except the Previous Well, Print, and Next Well buttons are hidden.
27
W E L L F I E L D O P T I M I Z A T I O N P R O J E C T
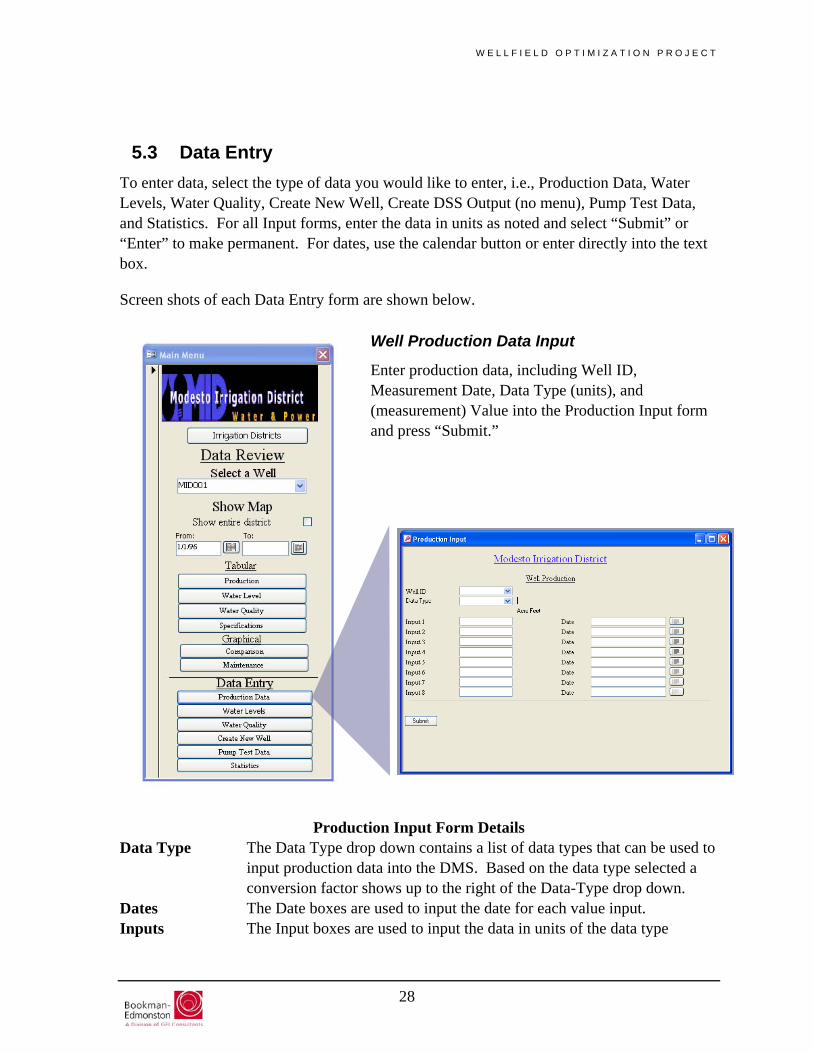
5.3 Data Entry To enter data, select the type of data you would like to enter, i.e., Production Data, Water Levels, Water Quality, Create New Well, Create DSS Output (no menu), Pump Test Data, and Statistics. For all Input forms, enter the data in units as noted and select “Submit” or “Enter” to make permanent. For dates, use the calendar button or enter directly into the text box.
Screen shots of each Data Entry form are shown below.
Well Production Data Input
Enter production data, including Well ID, Measurement Date, Data Type (units), and (measurement) Value into the Production Input form and press “Submit.”
Production Input Form Details Data Type The Data Type drop down contains a list of data types that can be used to
input production data into the DMS. Based on the data type selected a conversion factor shows up to the right of the Data-Type drop down.
Dates The Date boxes are used to input the date for each value input. Inputs The Input boxes are used to input the data in units of the data type
28

W E L L F I E L D O P T I M I Z A T I O N P R O J E C T
selected. Well The Well drop down contains the list of available wells for inputting
production data. If a well is not included in this list, check the well active status in Well Specifications
29

W E L L F I E L D O P T I M I Z A T I O N P R O J E C T
Water Level Data Input
Enter water level data, including Well, Measurement Date, and Current data for either Static and/or Operational Water Levels. When a well and Measurement Date are input, the Previous Level fields will automatically populate with the correct value. After entering the Current Level(s), the Difference will automatically calculate. Press “Submit” to save your entry.
Water Levels Input Form Details
Current Level The Current Level boxes are used to input the new measurements.
Difference The Difference boxes will automatically fill with the difference between the previous and current measurements.
Estimated The Estimated checkbox is used to mark the measurements as estimated if needed.
Measurement Date The Measurement Date box is used to input the date the water levels were measured. The date format should be MM/DD/YYYY. Using the calendar will automatically fill the
30

W E L L F I E L D O P T I M I Z A T I O N P R O J E C T
Measured Date box. Previous Levels The Previous Levels boxes will automatically fill with the most
current Static and Operational water levels stored in the DMS, once a well has been chosen from the list.
Submit The Submit button is used to store the new measurements into the DMS.
Well Drop Down The Well drop down contains the list of available wells for inputting production data. If a well is not included in this list, check the well active status in Well Specifications.
31
W E L L F I E L D O P T I M I Z A T I O N P R O J E C T
32
Water Quality Data Input
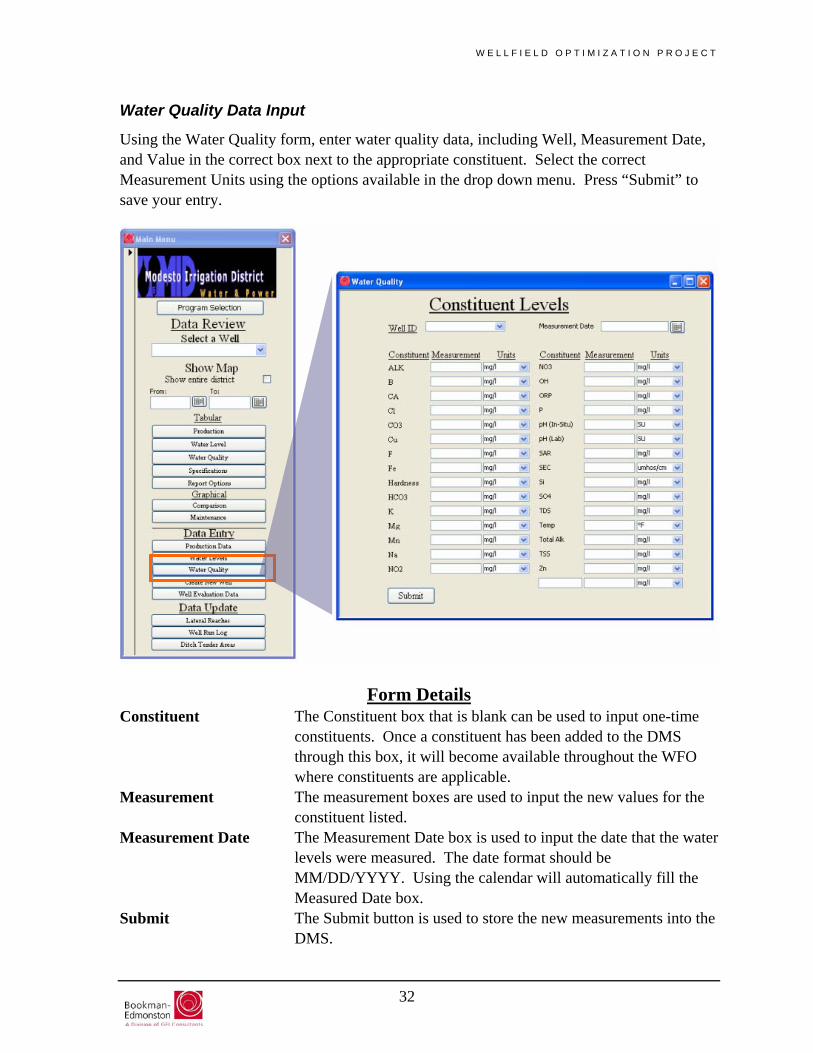
Using the Water Quality form, enter water quality data, including Well, Measurement Date, and Value in the correct box next to the appropriate constituent. Select the correct Measurement Units using the options available in the drop down menu. Press “Submit” to save your entry.
Form Details
Constituent The Constituent box that is blank can be used to input one-time constituents. Once a constituent has been added to the DMS through this box, it will become available throughout the WFO where constituents are applicable.
Measurement The measurement boxes are used to input the new values for the constituent listed.
Measurement Date The Measurement Date box is used to input the date that the water levels were measured. The date format should be MM/DD/YYYY. Using the calendar will automatically fill the Measured Date box.
Submit The Submit button is used to store the new measurements into the DMS.
W E L L F I E L D O P T I M I Z A T I O N P R O J E C T
Units The Units drop down can be used to set the units for a particular constituent. The units are set for known constituent when the form opens.
Well Well drop down lists the wells available in the DMS.
33

W E L L F I E L D O P T I M I Z A T I O N P R O J E C T
34
Create New Well
Enter New Well specifications in the Create New Well form. Include as much specification data as is available for the new well. Press “Enter” to submit New Well data. Well specification data can be updated or filled in at any time by going into the well specification data review form.
Form Details
Aquifer The drop down lists the different aquifer types recognized by the DMS.
Bottom of Casing (ft) The Bottom of Casing (ft) box is used to input a depth value in units of feet into the DMS.
Casing Type The Casing Type box is used to input casing information into the DMS. The data entered must be 50 characters or less.
Ditch Tender Area The drop down lists the names of Ditch Tender Areas currently stored in the DMS.
Fuse Make The Fuse Make box is used to input a fuse make. Fuse Size The Fuse Size box is used to input a fuse size. Installation Date The Installation Date box is used to input the initial installation of

W E L L F I E L D O P T I M I Z A T I O N P R O J E C T
the pump. Data must be entered in the MM/DD/YYYY date format.
Lateral Reach The drop down lists the lateral reaches currently stored in the DMS.
Latitude The Latitude box is used to input the Latitude value of the well location into the DMS.
Longitude The Longitude box is used to input the longitude value of the well location into the DMS.
Meter No. The Meter No. box is used to input the ID number of the meter at the pump. This field can be a mix of letters and numbers and special characters. The data entered must be 50 characters or less.
Motor Make The Motor Make box is used to input the motor type into the DMS. The data entered must be 50 characters or less.
Operator The drop down lists available agencies to choose from. Panel Make The Panel Make box is used to input information about the panel.
The data entered must be 50 characters or less. Panel Size The Panel Size box is used to input a panel size. The data entered
must be 50 characters or less. Perforated The Perforated box is used to input information regarding the
perforation type into the DMS. The data entered in this field must 50 characters or less.
Plate Amp The Plate Amp box is used to input the listed amperage of the pump.
Plate HP The Plate HP box is used to input the listed horsepower of the pump.
Plate RPM The Plate RPM box is used to input the listed RPM value for the pump.
Plate Volts The Plate Volts box is used to input the listed voltage of the pump.
Pump Make The Pump Make box is used to input the Pump type into the DMS. The data entered must be 50 characters or less.
Station Along Lateral The Station Along Lateral box is used to input the location of the well along the lateral. The value input should be in units of miles.
Submit The Submit button is used to store the new measurements into the DMS.
Top of Bowls (ft) The Top of Bowls (ft) box is used to input a depth value in units of feet into the DMS.
Top of Perforation (ft) The Top of Perforation (ft) box is used to input a depth value in units of feet into the DMS.
Well Function The drop down lists the different well functions recognized by the DMS.
35

W E L L F I E L D O P T I M I Z A T I O N P R O J E C T
Well ID The Well ID box is used to input a six-character well ID where the first three characters are the agency followed by three numbers (Example: MID001). The well ID is used by the DMS to identify the well and must be unique for each well input.
Well Maintenance Level The drop down lists rankings for well maintenance.
Well Name The Well Name is used to input a descriptive name of the well. The name must be 50 characters or less.
Wire Size The Wire Size box is used to input a wire size. The data entered must be 50 characters or less.
36
W E L L F I E L D O P T I M I Z A T I O N P R O J E C T
37
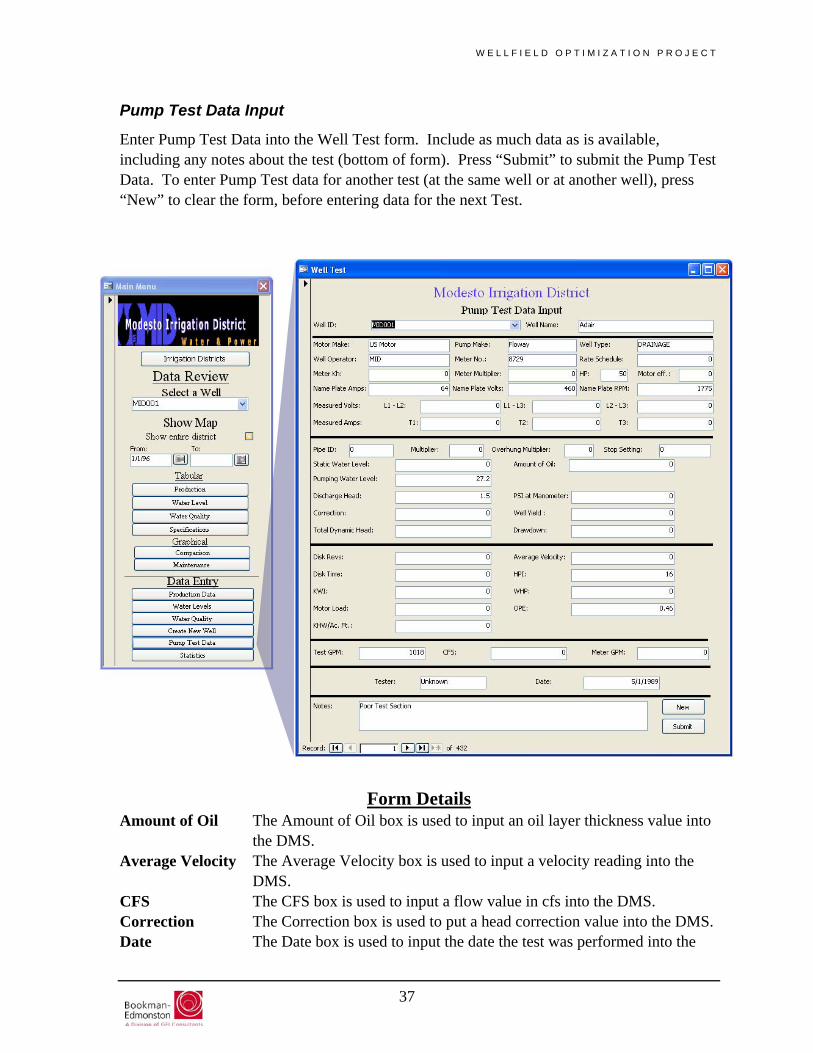
Pump Test Data Input
Enter Pump Test Data into the Well Test form. Include as much data as is available, including any notes about the test (bottom of form). Press “Submit” to submit the Pump Test Data. To enter Pump Test data for another test (at the same well or at another well), press “New” to clear the form, before entering data for the next Test.
Form Details
Amount of Oil The Amount of Oil box is used to input an oil layer thickness value into the DMS.
Average Velocity The Average Velocity box is used to input a velocity reading into the DMS.
CFS The CFS box is used to input a flow value in cfs into the DMS. Correction The Correction box is used to put a head correction value into the DMS. Date The Date box is used to input the date the test was performed into the

W E L L F I E L D O P T I M I Z A T I O N P R O J E C T
DMS. The date format is MM/DD/YYYY. Discharge Head The Discharge Head box is used to input a Discharge Head Value into
the DMS. Disk Revs The Disk Revs box is used to input the number of disk revolutions into
the DMS. Disk Time The Disk Time box is used to input a disk time into the DMS. Drawdown The Drawdown box is used to input a drawdown value into the DMS. HP Automatically populates with the plate horsepower from the Pump
information portion of the well specifications. HPI The HPI box is used to input a horsepower value into the DMS. KWH/Ac. Ft. The KWH/Ac. Ft. box is used to input a kilo-watt-hour per acre-foot
production, or power consumption value into the DMS. KWI The KWI box is used to input a Kilo-Watts Input value into the DMS. Measured Amps Three boxes used to input Amperage values. Meaured Volts Three boxes used to input Voltage values. Meter GPM The Meter GPM box is used to input flow Meter reading into the DMS. Meter Kh The Meter Kh box is used to input a Meter Kh reading into the DMS. Meter Multiplier The Meter Multiplier box is used to input a meter multiplier into the
DMS. Meter Number The Meter Number box is used to input a meter number into the DMS. Motor Eff. The Motor Eff. Box is used to input an efficiency value at the time of
the test. Motor Load The Motor Load box is used to input a motor load into the DMS. Motor Make Automatically populates with the motor make from the pump
information under the well specifications. Multiplier The Multiplier box is used to input a multiplier into the DMS. Name Plate Amps
Automatically populates with the plate amps from the Pump information portion of well specifications.
Name Plate RPM
Automatically populates with the plate RPM from the Pump information portion of well specifications.
Name Plate Volts Automatically populates with the plate volts from the Pump information portion of well specifications.
Notes The Notes box is used to input alternate information from a well evaluation. This field must be less than 255 characters.
OPE The OPE box is used to input an operating efficiency value into the DMS.
Overhung Multiplier
The Overhung Multiplier box is used to input an Overhung Multiplier into the DMS.
Pipe ID The Pipe ID box is used to input a pipe size into the DMS. PSI at
Manometer The PSI at Manometer box is used to input a pressure value into the DMS.
Pump Make Automatically populates with the pump make from the pump
38

W E L L F I E L D O P T I M I Z A T I O N P R O J E C T
information under the well specifications. Pumping Water
Level The Pumping Water Level box is used to input a Water Level into the DMS.
Rate Schedule The Rate Schedule box is used to input a rate schedule into the DMS. Static Water
Level The Static Water Level box is used to input a water level into the DMS. Stop Setting The Stop Setting box is used to input a stop setting into the DMS. Submit The Submit button is used to store the new measurements into the DMS. Test GPM The Test GPM box is used to input a flow value in gpm into the DMS. Tester The Tester box is used to input the agency that performed the test into
the DMS. Total Dynamic Head
The Total Dynamic Head box is used to input a total dynamic head value into the DMS.
Well ID The drop down list contains valid well ID for data storage. Well Name Automatically populates with the name of the well associated to the well
ID. Well Operator Automatically populates with the district that operates the well. Well Type Automatically populates with the well type from the well specifications. Well Yield The Well Yield box is used to input a gallons/ft value into the DMS. WHP The WHP box is used to input a working horsepower value into the
DMS.
39
W E L L F I E L D O P T I M I Z A T I O N P R O J E C T
40
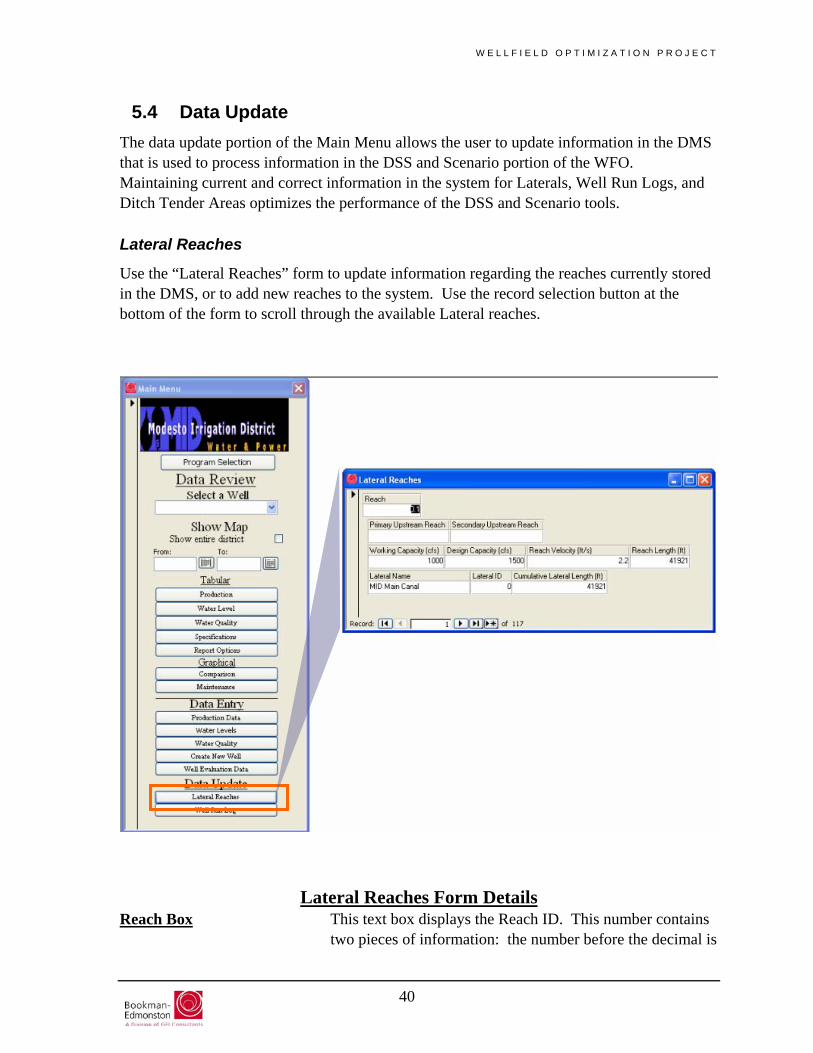
5.4 Data Update The data update portion of the Main Menu allows the user to update information in the DMS that is used to process information in the DSS and Scenario portion of the WFO. Maintaining current and correct information in the system for Laterals, Well Run Logs, and Ditch Tender Areas optimizes the performance of the DSS and Scenario tools.
Lateral Reaches
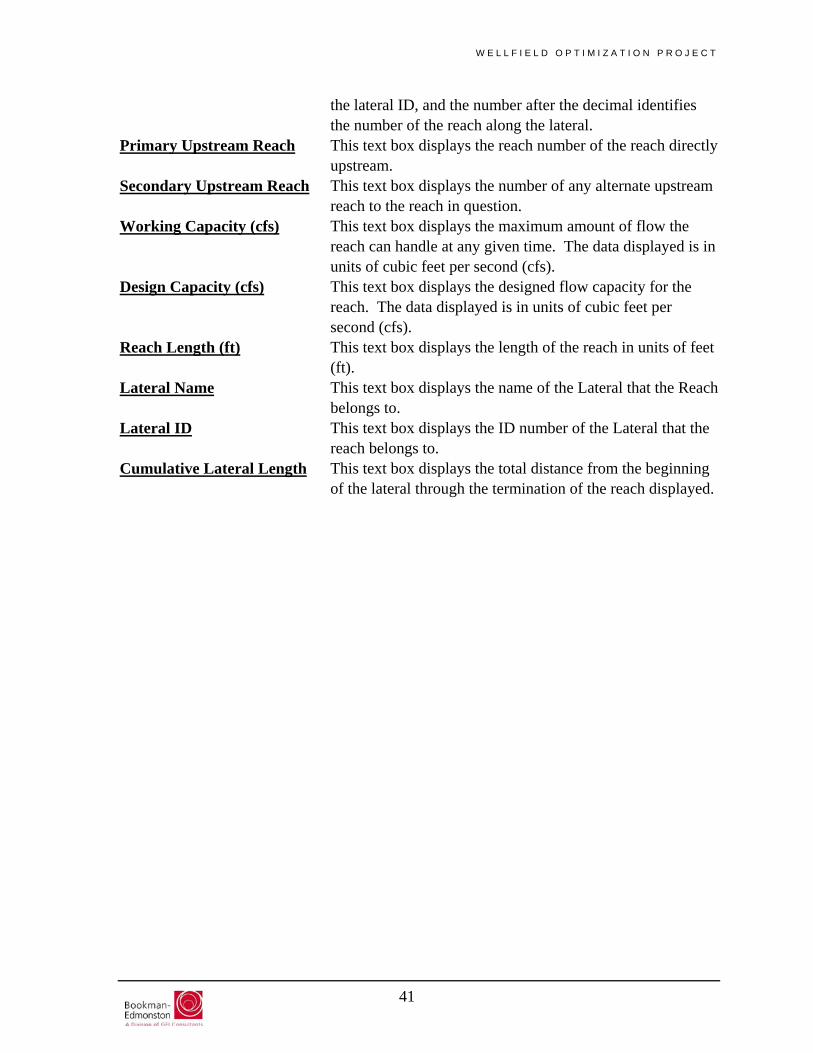
Use the “Lateral Reaches” form to update information regarding the reaches currently stored in the DMS, or to add new reaches to the system. Use the record selection button at the bottom of the form to scroll through the available Lateral reaches.
Lateral Reaches Form Details
Reach Box This text box displays the Reach ID. This number contains two pieces of information: the number before the decimal is
W E L L F I E L D O P T I M I Z A T I O N P R O J E C T
41
the lateral ID, and the number after the decimal identifies the number of the reach along the lateral.
Primary Upstream Reach This text box displays the reach number of the reach directly upstream.
Secondary Upstream Reach This text box displays the number of any alternate upstream reach to the reach in question.
Working Capacity (cfs) This text box displays the maximum amount of flow the reach can handle at any given time. The data displayed is in units of cubic feet per second (cfs).
Design Capacity (cfs) This text box displays the designed flow capacity for the reach. The data displayed is in units of cubic feet per second (cfs).
Reach Length (ft) This text box displays the length of the reach in units of feet (ft).
Lateral Name This text box displays the name of the Lateral that the Reach belongs to.
Lateral ID This text box displays the ID number of the Lateral that the reach belongs to.
Cumulative Lateral Length This text box displays the total distance from the beginning of the lateral through the termination of the reach displayed.

W E L L F I E L D O P T I M I Z A T I O N P R O J E C T
42
Well Run Log
The “Well Run Log” form should be used in the case that an order was submitted in the DSS, and the entire order or a portion of an order was not satisfied. Any well that was not run in conjunction with the order placed should be removed from the “Well Run Log.”
Run Log Form Details
Flow (cfs) This text box shows the flow value of the well displayed in cfs. Order Number This text box shows the order number that record belongs to. Pump Start This text box shows the date and time that the well should be turned on. Pump Stop This text box shows the date and time that the well should be turned off. Well This text box displays the well for the record displayed.

W E L L F I E L D O P T I M I Z A T I O N P R O J E C T
43
Ditch Tender Areas
Ditch Tender Areas are used to further separate wells generally based on well location. In order to assign a well to a Ditch Tender Area, the Ditch Tender Area must first be added to the DMS through the Ditch Tender Area form. These areas can be used to run well production scenarios. These will be discussed in Section 7 of this manual.
Ditch Tender Areas Form Components
Area This text box show the ID number of the Ditch Tender Area displayed. Name This text box shows the Name of the Ditch Tender Area displayed.

W E L L F I E L D O P T I M I Z A T I O N P R O J E C T
5.5 Quality Assurance/Quality Control (QA/QC) The Quality Assurance/Quality Control (QA/QC) procedure for Data Entry is straightforward, but its importance cannot be overemphasized. The guidelines in this section are not meant to be exhaustive or to preempt commonsense. The goal is to ensure high-quality, complete data stored in the DMS that can be accessed for present and future management decisions. The quality of management decisions based on data stored in the DMS is directly related to the quality of the data; in other words, “garbage in, garbage out.” Data Flow
Raw data gathered through field monitoring and testing for entry into the DMS will be in a variety of formats. Before entering any raw data into the database, it is recommended that a qualified person performs a preliminary review of the data. Raw data that has not been identified as being questionable or erroneous in the preliminary review will be hand-entered into the DMS using the Data Entry menus (e.g. Production, Water Level, Water Quality, etc.). Data Entry menus have some built-in QA functionality, as discussed in the next section, “Built-in QA/QC Functionality.” After being entered into the DMS, a qualified person will complete a final review of the data within the DMS. The reviewer is preferably a different person from the person who entered the data (for a “second pair of eyes”). This final review process is described below under “Post-Data Entry Review.” User Responsibility
The District is responsible for assuring the quality and security of data stored in the DMS. At a minimum, responsible parties within the district will include:
A Database Manager to be responsible for regular backup and correct “versioning” of the database, security (who has access), and other relevant database management and maintenance activities.
A Project Manager to be responsible for assuring a high quality of data entered into database by ensuring that all data entered into the DMS undergoes thorough review.
44

W E L L F I E L D O P T I M I Z A T I O N P R O J E C T
Built-in QA/QC Functionality
The DMS was constructed using some built-in MS Access QA/QC functionality including drop-down menus and validation rules.
Drop-down or “pull-down” menus are linked to a database table with valid values for that field. Drop-downs are used extensively in the DMS to aid in Data Entry and to help ensure consistency. For example, the drop-down menu for Well in the Water Level Input menu contains all existing Well IDs. This limits potential errors from typos and inconsistent spelling.
Previous value comparison is performed upon entry of a current value. When inputting data into the water level or production data entry forms, the previous value fills automatically. A difference is calculated once a current value is entered. The user should take care to ensure that the resulting difference is a “reasonable” value, and check the field data should any question arise.
Validation rules are internal rules that test whether an entered value is within an acceptable range. These can catch incorrect readings, errors, and/or typos by warning the user that their data is outside of the acceptable range. Validation rules have not been set up yet in the DMS, but are being considered for an added level of QA/QC.
Post-Data Entry Review
Data entered into the DMS can be reviewed through the Data Review menus by a qualified person, as follows:
Tabular review:
o Random checks. A random selection of at least 10% of the data entered against the raw data may be sufficient in combination with graphical checks described below. If the amount of data entered is manageable, however, a full review of all entered data is preferable.
45
W E L L F I E L D O P T I M I Z A T I O N P R O J E C T
o Full tabular review. A full tabular review entails comparison of each new data entry with the corresponding raw data by an independent party (someone other than the data entry person).
o The Database Statistics table can also be used as an annual check of the total number of records in each data category (Production, Water Level and Water Quality) and to ensure maximum/minimum values for each well agrees with expectation.
Graphical check:
o Plotting data is one of the fastest and easiest ways to spot “outliers” and inconsistencies in data. Compare newly entered data with prior records at the same well, or at nearby wells using the “Comparison” menu.
Each reviewed record should be initialed by the reviewer. It is planned to add a field for entering reviewer initials into the DMS. This has not yet been implemented.
46
W E L L F I E L D O P T I M I Z A T I O N P R O J E C T
6 Guide to Using the DSS
Before beginning, make sure that you have permission and are qualified to use the DSS.
6.1 Introduction The DSS is an interactive software program constructed within the MS Access environment using MS Access VBA code. The DSS user interface requires user input of well selection criteria and outputs a list of eligible wells that satisfy well selection criteria based on the DSS algorithm.
The sections are presented in a step-by-step manner, with screen captures for each new menu or screen and detailed instructions for working through each menu’s options. Note: Microsoft product screen shots are reprinted with permission from Microsoft Corporation.
47

W E L L F I E L D O P T I M I Z A T I O N P R O J E C T
6.2 Using the DSS
Interactive Well Selection Map
After selecting the DSS tool from the tools menu the system map will be displayed. Use this map to choose a delivery point for the water request by selecting either the most downstream well that can serve the delivery point needed or selecting the end of a lateral. TIP: Pausing over a well with the mouse will cause the well name to appear in larger font.
MID043
Decision Support System Menu
After selecting a well from the interactive map, the Decision Support System menu will open, prompting the input of order information. General Order Information
The DSS menu is automatically populated with the Order Date (today’s date), Selected Well (previously selected from the interactive map), Well Lateral , and Order Number. To confine the search of wells to only the current lateral, the water operator can check the Lateral only
48
W E L L F I E L D O P T I M I Z A T I O N P R O J E C T
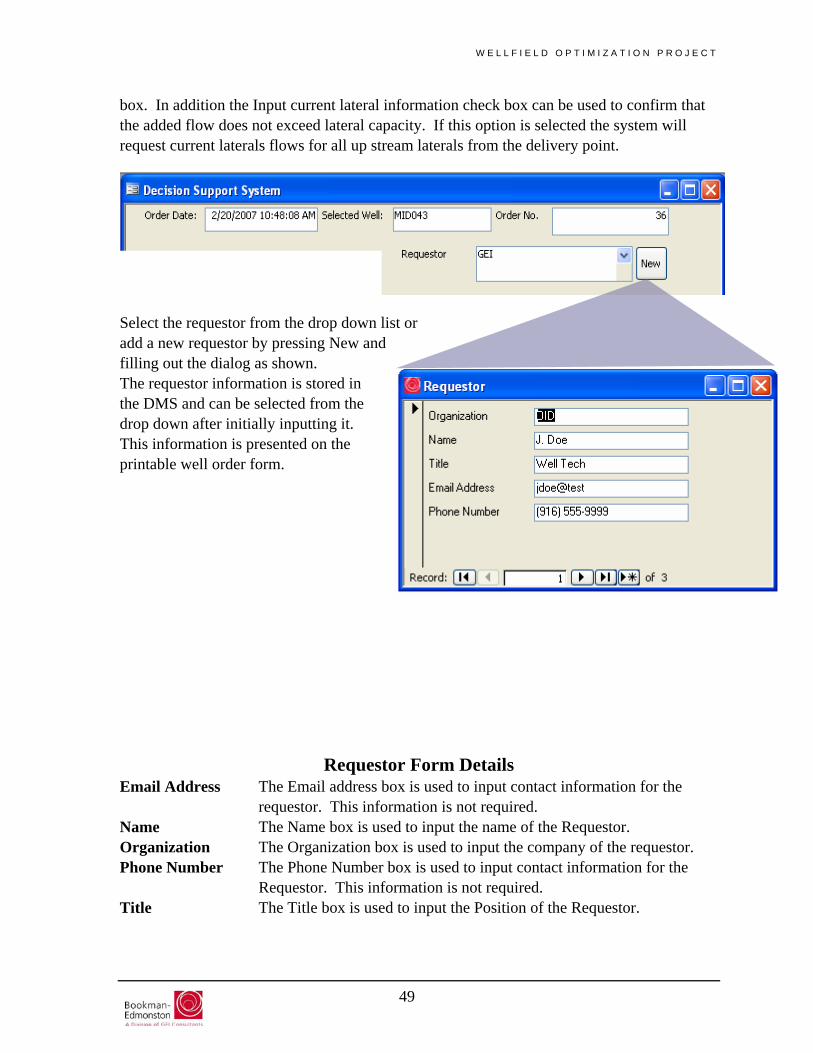
box. In addition the Input current lateral information check box can be used to confirm that the added flow does not exceed lateral capacity. If this option is selected the system will request current laterals flows for all up stream laterals from the delivery point.
Select the requestor from the drop down list or add a new requestor by pressing New and filling out the dialog as shown. The requestor information is stored in the DMS and can be selected from the drop down after initially inputting it. This information is presented on the printable well order form.
Requestor Form Details Email Address The Email address box is used to input contact information for the
requestor. This information is not required. Name The Name box is used to input the name of the Requestor. Organization The Organization box is used to input the company of the requestor. Phone Number The Phone Number box is used to input contact information for the
Requestor. This information is not required. Title The Title box is used to input the Position of the Requestor.
49
W E L L F I E L D O P T I M I Z A T I O N P R O J E C T
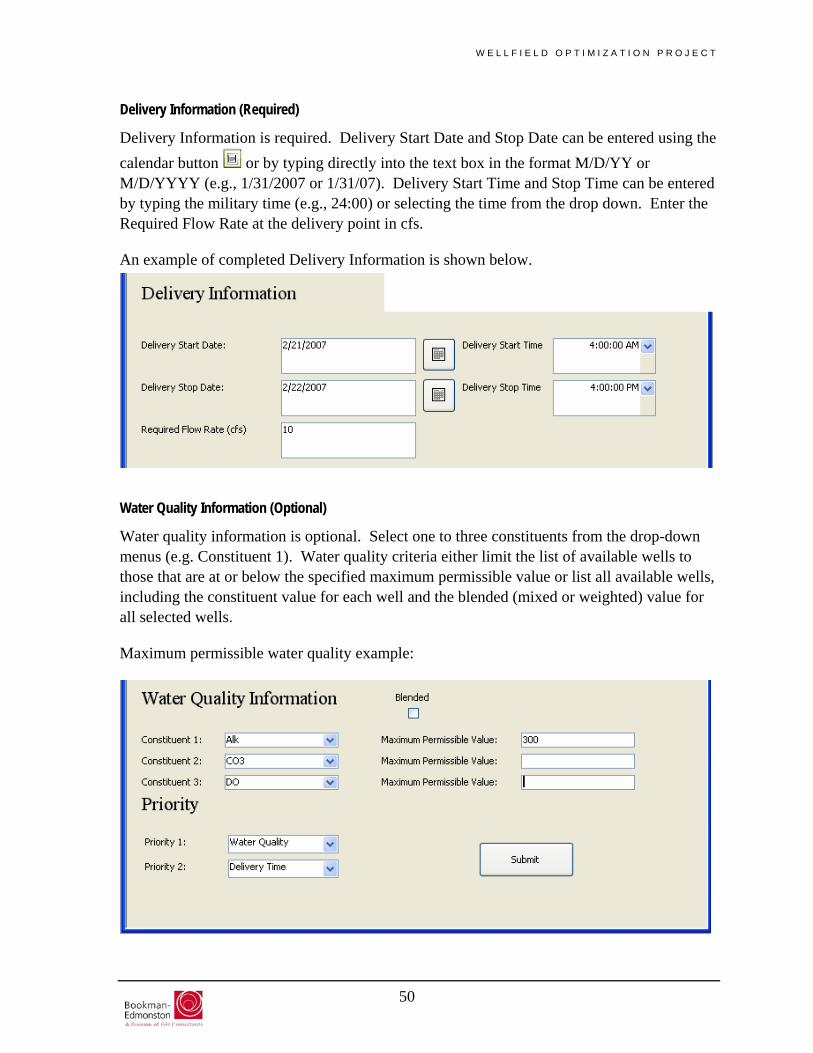
Delivery Information (Required)
Delivery Information is required. Delivery Start Date and Stop Date can be entered using the calendar button or by typing directly into the text box in the format M/D/YY or M/D/YYYY (e.g., 1/31/2007 or 1/31/07). Delivery Start Time and Stop Time can be entered by typing the military time (e.g., 24:00) or selecting the time from the drop down. Enter the Required Flow Rate at the delivery point in cfs.
An example of completed Delivery Information is shown below.
Water Quality Information (Optional)
Water quality information is optional. Select one to three constituents from the drop-down menus (e.g. Constituent 1). Water quality criteria either limit the list of available wells to those that are at or below the specified maximum permissible value or list all available wells, including the constituent value for each well and the blended (mixed or weighted) value for all selected wells.
Maximum permissible water quality example:
50

W E L L F I E L D O P T I M I Z A T I O N P R O J E C T
Blended water quality example:
Order Submittal
After pressing Submit, the DSS algorithm (see Appendix A) computes based on the order criteria supplied. If no wells meet the criteria, the following message will display. After selecting “ok” the system returns to the DSS page.
Alternately if there are wells available but they do not meet the flow requested, the following message will appear. Selecting “Yes” will return you to the Decision Support System menu. Selecting “No” will return you to the list of wells that are available, whether or not the order can be filled.
51

W E L L F I E L D O P T I M I Z A T I O N P R O J E C T
Available Wells
The Available Wells menu looks like the example below. All wells that meet the selection criteria specified in the Decision Support System menu are listed. Wells are listed in order from lowest to highest power consumption (KWH/Ac-Ft).
DSS Available Form Details Available Flow The Available Flow label shows the total amount of flow that
can be selected. Available Wells The Available Wells list shows the wells, and their details,
that can be chosen to fulfill an order. Details The Details list box shows a more specific reason for the
DSS removal of the well. Selecting a well in the Unavailable Upstream Wells list box will fill this box with the proper information.
DSS Main The DSS Main button will return the user to the Main DSS page to make changes to the input parameters, if needed.
Mix The Mix labels display a weighted average of constituent values for the selected wells, if constituents were chosen.
Reach Lateral Details The Reach Lateral list box contains the information input by the user for the current or expected flow levels of the upstream laterals.
Requested Flow The Requested Flow label displays the flow requested by the
52

W E L L F I E L D O P T I M I Z A T I O N P R O J E C T
user. Selected Flow The Selected Flow label shows the amount of flow the user
has selected. This value is updated anytime a user selects or deselects a well.
Submit The Submit button is used to create the order and input order data into the DMS.
Unavailable Upstream Wells
The Unavailable Upstream Wells list box shows the wells that were removed by the DSS algorithm. The data shown in the box includes the Well ID, Well Name, and a general description of why the well was removed.
View Map The View Map button will open the system map to give the user the ability to view locations of selected wells.
53
W E L L F I E L D O P T I M I Z A T I O N P R O J E C T
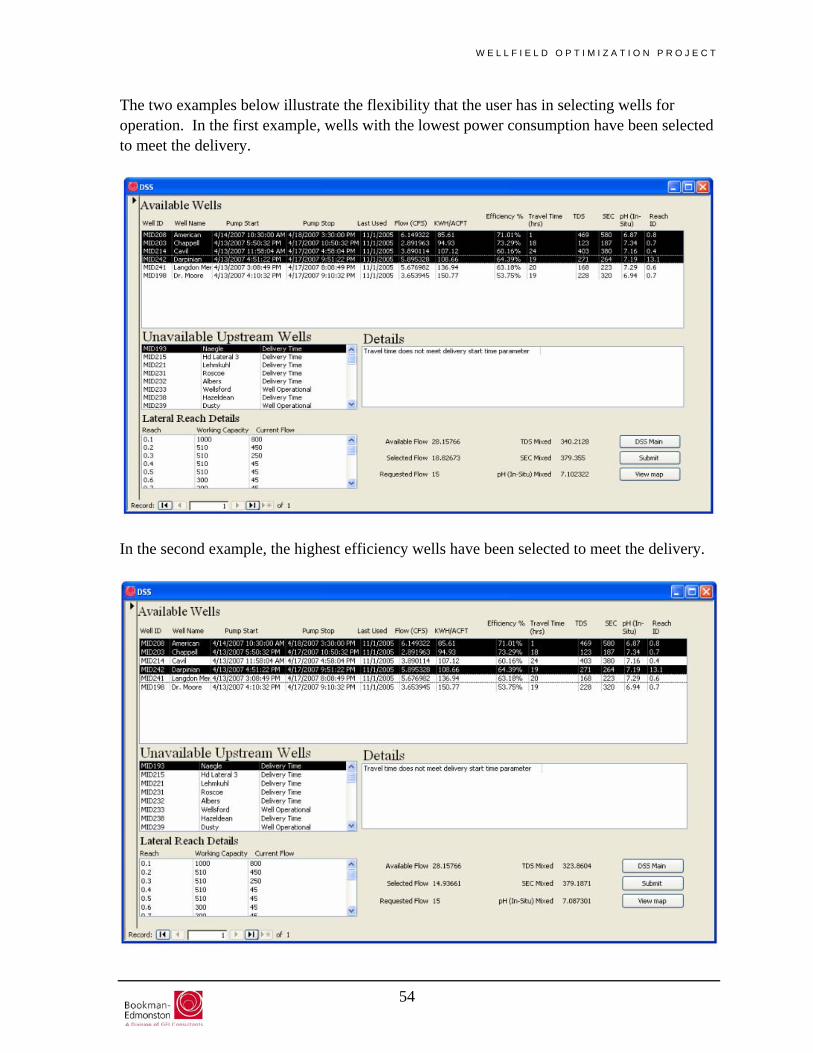
The two examples below illustrate the flexibility that the user has in selecting wells for operation. In the first example, wells with the lowest power consumption have been selected to meet the delivery.
In the second example, the highest efficiency wells have been selected to meet the delivery.
54
W E L L F I E L D O P T I M I Z A T I O N P R O J E C T
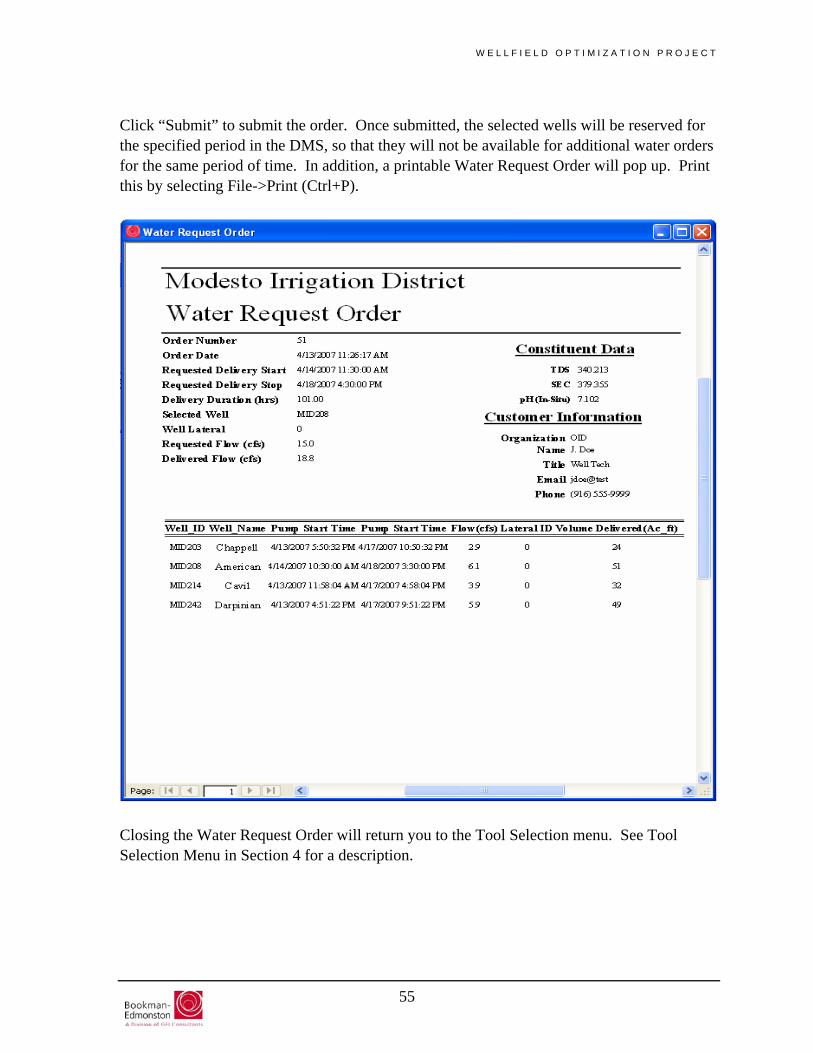
Click “Submit” to submit the order. Once submitted, the selected wells will be reserved for the specified period in the DMS, so that they will not be available for additional water orders for the same period of time. In addition, a printable Water Request Order will pop up. Print this by selecting File->Print (Ctrl+P).
Closing the Water Request Order will return you to the Tool Selection menu. See Tool Selection Menu in Section 4 for a description.
55
W E L L F I E L D O P T I M I Z A T I O N P R O J E C T
7 Guide to Using the WPS
Before beginning make sure that you have permission and are qualified to use the WPS.
7.1 Introduction The WPS is an interactive software program constructed within the MS Access environment using MS Access VBA code. The WPS user interface requires user input of well selection criteria and outputs a list of suggested wells to fulfill the scenario parameters.
The sections are presented in a step-by-step manner, with screen captures for each new menu or screen and detailed instructions for working through each menu’s options. Note: Microsoft product screen shots are reprinted with permission from Microsoft Corporation.
56
W E L L F I E L D O P T I M I Z A T I O N P R O J E C T
7.2 Using the WPS
WPS Form
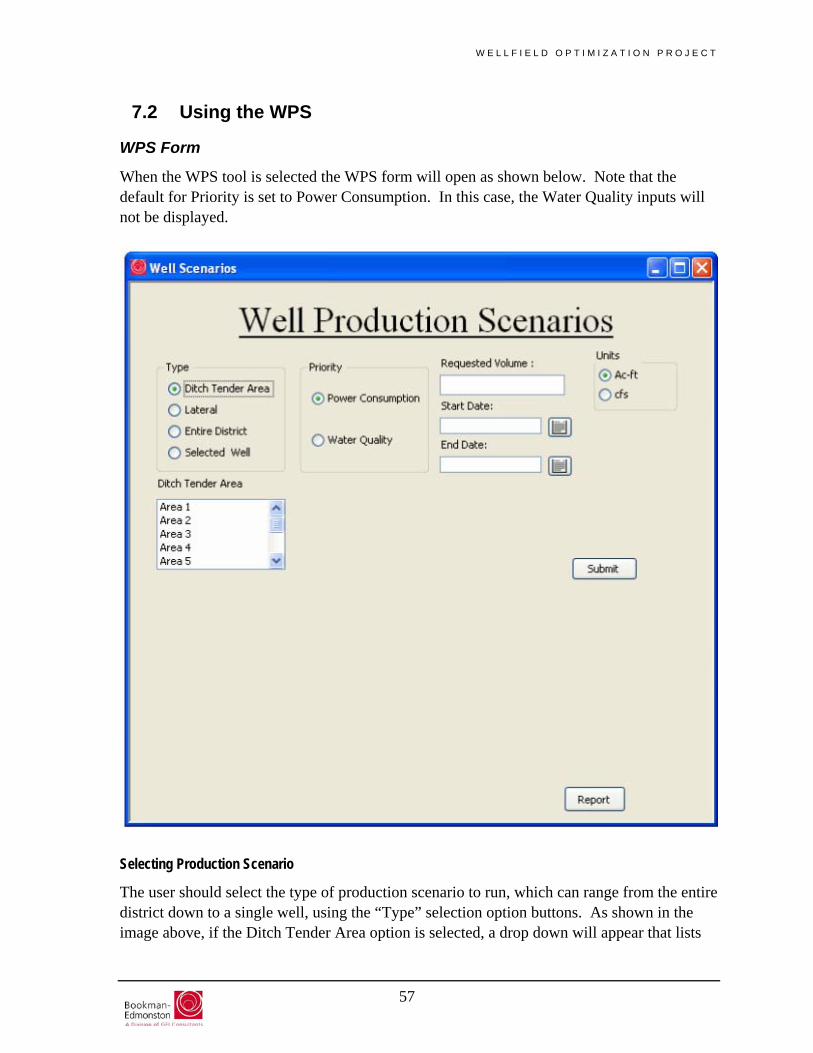
When the WPS tool is selected the WPS form will open as shown below. Note that the default for Priority is set to Power Consumption. In this case, the Water Quality inputs will not be displayed.
Selecting Production Scenario
The user should select the type of production scenario to run, which can range from the entire district down to a single well, using the “Type” selection option buttons. As shown in the image above, if the Ditch Tender Area option is selected, a drop down will appear that lists
57
W E L L F I E L D O P T I M I Z A T I O N P R O J E C T
Areas from the DMS. If the Lateral or Selected Well types are chosen, a drop down will appear for those situations as well. Selecting Priority
The next decision for the user is whether to include constituent limits in the scenario. The constituent input will appear when the Water Quality priority option is chosen. The user can then input a maximum value for up to three constituents that each well must meet. If the Power Consumption option is chosen, all wells will be available for the scenario regardless of water quality. Volume Request
The user can input a water request in terms of Acre-feet or cfs by entering a value in the requested volume box, then choosing the proper units for the value entered in the units area. Time Period
The user should input the date range for the scenario. Water Quality
If the water quality priority is chosen, the user can input maximum permissive values for up to three constituents. Each well evaluated for the scenario must pass these criteria before being added to the suggested wells. Run Scenario
Once all data has been selected and input into the form, the user can click the Submit button to run the scenario. Once the scenario has run, a list of suggested wells will appear on the form.
58

W E L L F I E L D O P T I M I Z A T I O N P R O J E C T
59

W E L L F I E L D O P T I M I Z A T I O N P R O J E C T
Printable Report
After the scenario is complete, the report button will produce a printable report listing all data from the scenario. An example report is shown below.
60
W E L L F I E L D O P T I M I Z A T I O N P R O J E C T
61
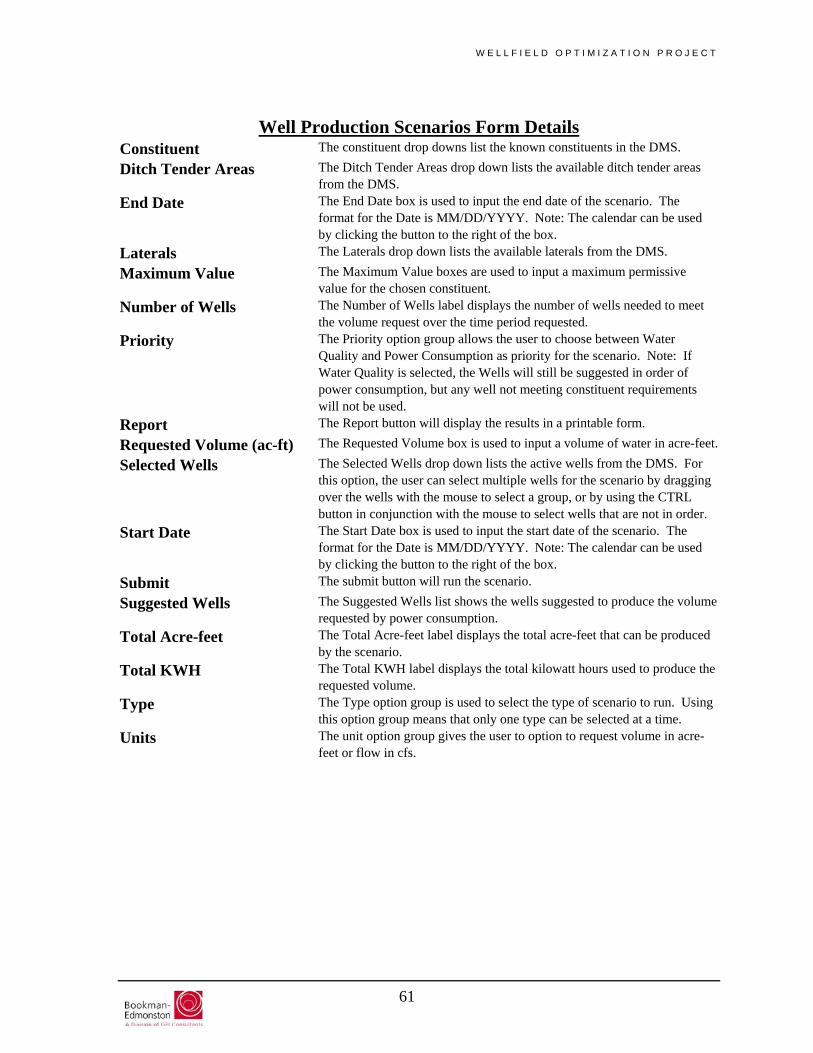
Well Production Scenarios Form Details
Constituent The constituent drop downs list the known constituents in the DMS.
Ditch Tender Areas The Ditch Tender Areas drop down lists the available ditch tender areas from the DMS.
End Date The End Date box is used to input the end date of the scenario. The format for the Date is MM/DD/YYYY. Note: The calendar can be used by clicking the button to the right of the box.
Laterals The Laterals drop down lists the available laterals from the DMS.
Maximum Value The Maximum Value boxes are used to input a maximum permissive value for the chosen constituent.
Number of Wells The Number of Wells label displays the number of wells needed to meet the volume request over the time period requested.
Priority The Priority option group allows the user to choose between Water Quality and Power Consumption as priority for the scenario. Note: If Water Quality is selected, the Wells will still be suggested in order of power consumption, but any well not meeting constituent requirements will not be used.
Report The Report button will display the results in a printable form.
Requested Volume (ac-ft) The Requested Volume box is used to input a volume of water in acre-feet.
Selected Wells The Selected Wells drop down lists the active wells from the DMS. For this option, the user can select multiple wells for the scenario by dragging over the wells with the mouse to select a group, or by using the CTRL button in conjunction with the mouse to select wells that are not in order.
Start Date The Start Date box is used to input the start date of the scenario. The format for the Date is MM/DD/YYYY. Note: The calendar can be used by clicking the button to the right of the box.
Submit The submit button will run the scenario.
Suggested Wells The Suggested Wells list shows the wells suggested to produce the volume requested by power consumption.
Total Acre-feet The Total Acre-feet label displays the total acre-feet that can be produced by the scenario.
Total KWH The Total KWH label displays the total kilowatt hours used to produce the requested volume.
Type The Type option group is used to select the type of scenario to run. Using this option group means that only one type can be selected at a time.
Units The unit option group gives the user to option to request volume in acre-feet or flow in cfs.
W E L L F I E L D O P T I M I Z A T I O N P R O J E C T
8 Abbreviations & Acronyms
Access Microsoft Office Access 2003 (database program)
Association Stanislaus and Tuolumne Rivers Groundwater Basin Association
Basin Stanislaus and Tuolumne Rivers Groundwater Basin
cfs cubic feet per second
District MID or OID
DMS Data Management System
DSS Decision Support System
DSS Decision Support System
ft feet
GUI Graphical User Interface
hp horsepower
IRGMP Integrated Regional Groundwater Management Plan
KWH/Ac-Ft kilo-watt-hour per acre-foot
KWI kilo-watt input
MID Modesto Irrigation District
MS Microsoft
OID Oakdale Irrigation District
OPE operating efficiency
QA/QC Quality Assurance-Quality Control
TDS Total Dissolved Solids
VBA Visual Basic for Applications
WFO Well Field Optimization
WHP working horsepower
WPS Well Production Scenarios
62

W E L L F I E L D O P T I M I Z A T I O N P R O J E C T
9 References (for more Information)
Microsoft Office Access User’s Manual
Well Field Optimization Report
DSS User’s Manual
Well Evaluation Reports for MID/OID
IRGMP
63
W E L L F I E L D O P T I M I Z A T I O N P R O J E C T
Appendix A – Table of Database Parameters
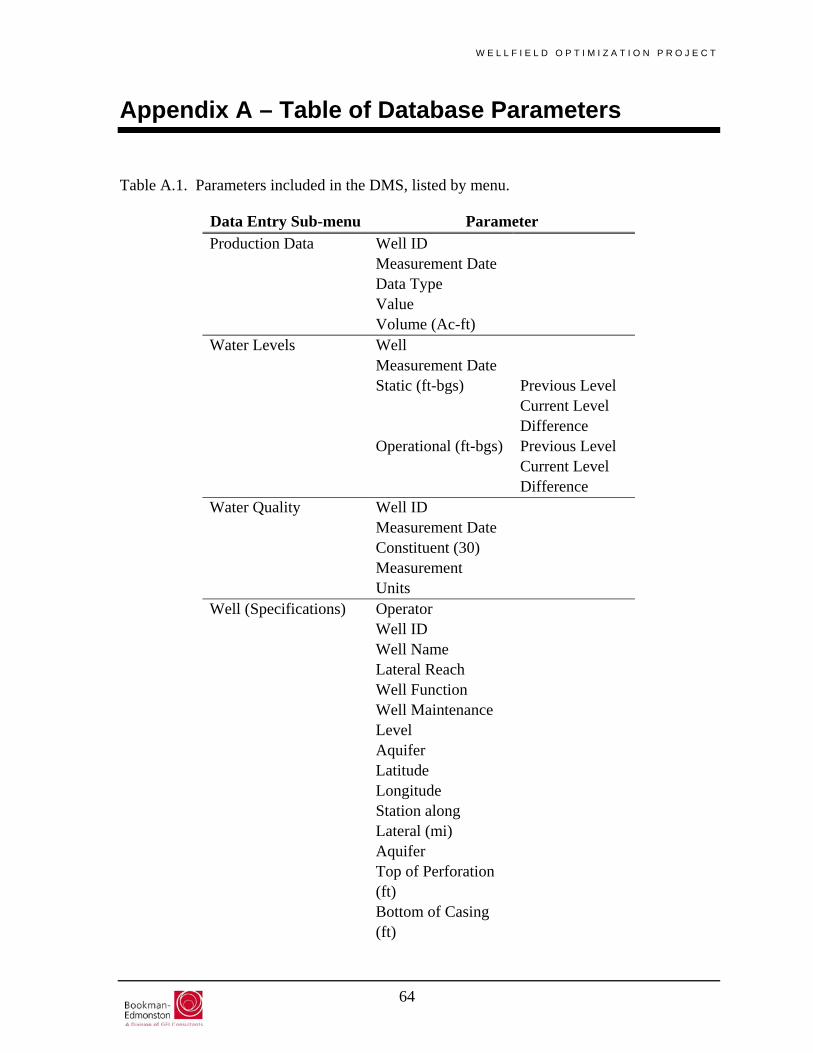
Table A.1. Parameters included in the DMS, listed by menu.
Data Entry Sub-menu Parameter Production Data Well ID Measurement Date Data Type Value Volume (Ac-ft) Water Levels Well Measurement Date Static (ft-bgs) Previous Level Current Level Difference Operational (ft-bgs) Previous Level Current Level Difference Water Quality Well ID Measurement Date Constituent (30) Measurement Units Well (Specifications) Operator
Well ID
Well Name Lateral Reach Well Function Well Maintenance
Level
Aquifer Latitude Longitude Station along
Lateral (mi)
Aquifer Top of Perforation
(ft)
Bottom of Casing (ft)
64
W E L L F I E L D O P T I M I Z A T I O N P R O J E C T
65
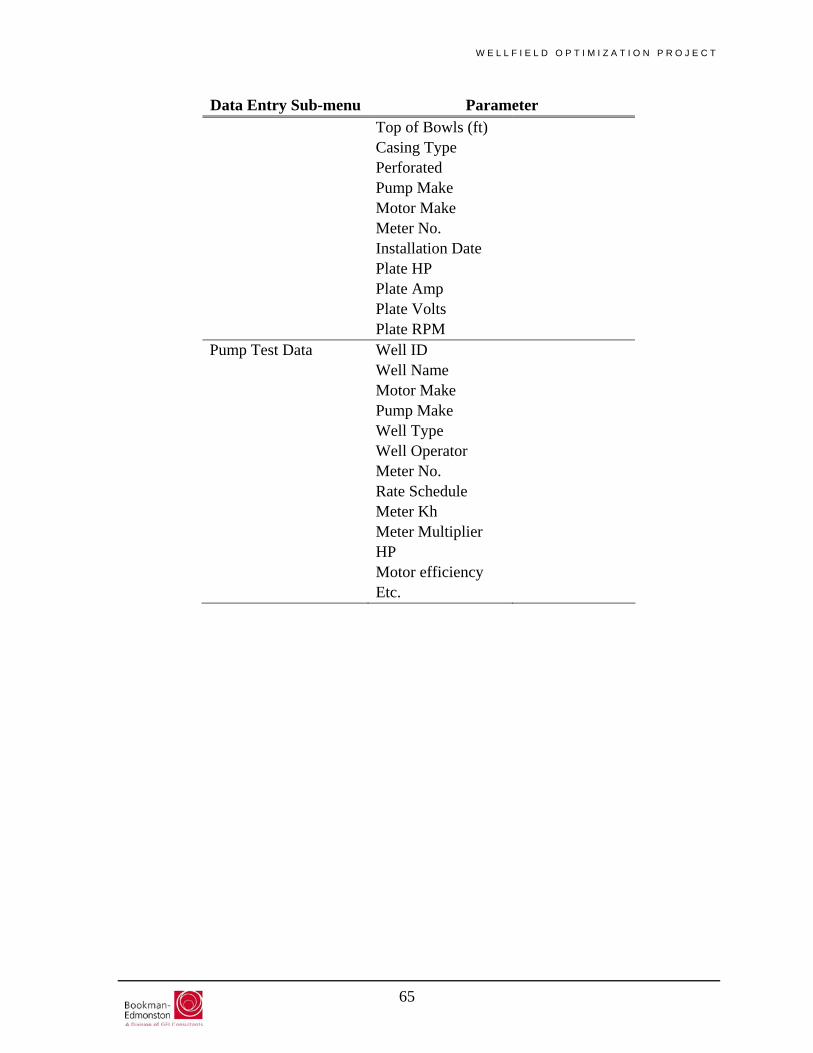
Data Entry Sub-menu Parameter Top of Bowls (ft) Casing Type Perforated Pump Make Motor Make Meter No. Installation Date Plate HP Plate Amp Plate Volts Plate RPM Pump Test Data Well ID Well Name Motor Make Pump Make Well Type Well Operator Meter No. Rate Schedule Meter Kh Meter Multiplier HP Motor efficiency Etc.