WELCOME TO WPA Insurance Panel - Western Pallet … / IsPollution Surety Surplus NoLines Guaranteed...
40
WELCOME TO WPA Insurance Panel January 20, 2014
Transcript of WELCOME TO WPA Insurance Panel - Western Pallet … / IsPollution Surety Surplus NoLines Guaranteed...

WELCOME TO WPA
Insurance Panel
January 20, 2014

MICHAEL OSKOUIAN, CRM, CIC, LUTCF – BIO
Michael is a Vice President within the Willis North America Practice and is located in
Seattle. He specializes in identifying risks and providing valuable solutions within the
areas of Property and Casualty. As a Certified Risk Manager and an Entrepreneur he
understands the business risks owners face every day and has the solutions to mitigate
those risks. Prior to joining Willis, Michael owned an insurance agency in Seattle for
eighteen years (18) employing a staff of 20.
Michael Oskouian, CRM, CIC, LUTCF
(425) 260-4030 Cell
(206) 386-7474 Direct
(206) 386-7400 Office
505 5th Ave S
Suite 200
Seattle, WA 98104
Email: [email protected]

Willis is a Risk Advisor: 100% Transparent
Client Broker Insurer
Client Advisor Broker Insurer

bigger
ANALYTIC/MODELING TOOLS

ANALYTIC/MODELING TOOLS

ANALYTIC/MODELING TOOLS

ANALYTIC/MODELING TOOLS

WHAT UNDERWRITERS REQUIRE
IN A SUBMISSION
Description of Operations
Program Specifications
Value Summaries
Loss History
Policy Form
Engineering

Casualty Expertise Portals
Casualty Communities linking Experts and Evolution
Employee Health and Safety Product Liability
Casualty
General and Auto Liability
Catastrophic & Excess Risks
Collateral and Risk Finance

Casualty Expert Teams
Building Communities of the Best Brokers to build Best Practices and Coverage Specifications
We have assembled 6 Expert Working Groups:
Workers Comp
Auto Liability
General Liability
Product Liability
Umbrella and Excess Liability
Collateral and Risk Finance Teams are comprised of National, Regional and Local Experts with technical expertise in an industry, risk, state or coverage.

National Casualty Practice
Unlocking the Power of Connection
Casualty Expert Team Members are easy to spot by
the Blue Ribbon Banner highlighting their Avatar!

Great Advocates Deliver Value
Cost Reduction in Casualty Costs can deliver more Cash, Capital
and/or Earnings
Casualty Savings drop to the Bottom Line
I have yet to meet a CFO or Treasurer or Risk Manager that feels
their Capital is best deployed in their Risk Management Program.
I have met CFOs and Treasurers that have perceived economic
value in new structures, additional limits or better coverage
Communicate value in a common economic value

Building the Best Team
Willis Service Plan – Best Practices Time Table
Client Name
Client Name ABC Company
Renewal Date 8/1/2014 Today's Date 1/6/2014
Client Coverage Lines / Industry
Workers Compensation
Automobile Liability
General Liability
Property
Construction
Healthcare
Executive Risks
Environmental / Pollution
Surety
Surplus Lines
Guaranteed Cost
Premium Financing
Loss Data
Is WC a part of this placement?
Is AL a part of this placement?
Is GL a part of this placement?
Is Property a part of this placement?
Is Construction a part of this placement?
Is Healthcare a part of this placement?
Is Executive Risks a part of this placement?
Is Environmental / Pollution a part of this placement?
Is Surety a part of this placement?
Does this placement involve SL?
Is this placement a guaranteed cost?
Is Premium Financing an interest?
Does client have credible loss data?
Yes
Yes
Yes
Yes
No
No
No
No
No
No
No
No
Yes
Team Role Assignment
Client ABC Company
Client Advocate Pam
Client Manager Mike
Senior Client Manager Karen
Assistant Client Manager Mary
Placement Specialists / Marketing Steve
Industry Marketing Specialists Rob
Risk Consultant (Claims Specialists) Lori
Loss Control Specialists Jim

Consistently delivering a Great Casualty Program
Best Practices – Casualty Service Plan
ABC Company Willis Service Plan (WSP)
Best Practices Timetable
Action Task Target Date
1. Client Advocacy Report [Annual Review / Stewardship Report] 11/4/2013 - 270
2. Client Service Evaluation [Client Survey]
3. Delivery of the Client Engagement Guide
4. Conduct Analytics Meetings with Incumbent Market [Actuarial / Credit / Underwriting]
5. Needs Analysis / Risk Assessment / Identification Review
6. Prepare for Renewal Strategy Meeting
7. Conduct Team Renewal Strategy Meeting
8. Conduct Client Renewal Strategy Meeting
9. Prepare Submission - Gather and Review Underwriting Data - Losses, Exposures, Coverage Specs & Financials
10. Send Submission to Client and Market(s)
11. Meet with Market(s) to Provide Quotes
12. Analyze Quotation Proposals
13. Prepare Renewal Proposal
14. Present Renewal Proposal to Client
15. Bind Renewals
16. Invoicing
17. Policy Administration - Certs / ID Cards / Posting Notices / UM UIM Forms
18. Renewal Incepts
19. Receive and Review Renewal Policies
20. Deliver Policies to Client
21. Obtain Client Feedback
Note: Blue italic if Action Task should have been completed by today's date.
12/4/2013 - 240
2/2/2014 - 180
2/2/2014 - 180
T 3/14/2014 - 140
I 3/14/2014 - 140
M 3/24/2014 - 130
E 4/3/2014 - 120
5/3/2014 - 90
L 5/3/2014 - 90
I 5/18/2014 - 75
N 6/2/2014 - 60
E 6/12/2014 - 50
6/22/2014 - 40
7/2/2014 - 30
7/12/2014 - 20
7/17/2014 - 15
8/1/2014 0
8/31/2014 30
9/15/2014 45
9/15/2014 45

Consistently delivering a Great Casualty Program
Delivering the Value
> Present Client Advocacy Report - review and meet with Client - obtain BOR's if necessary 11/04/13 Overdue task Pam
> Document discussions with Client 11/04/13 Overdue task Pam
2. 240 Days Prior - Client Service Evaluation [Client Survey] > Client Service Evaluation [Client Survey] 12/04/13 Overdue task Pam
> Formal evaluation of the overall quality and delivery of broking and risk management services using the electronic client survey
and open discussions
12/04/13
Overdue task
Pam
> Discussion about areas or activities currently not covered by the insurance program 12/04/13 Overdue task Pam
> Advise Client about Survey 12/04/13 Overdue task Pam
> Provide and review Client Survey results with the client team 12/04/13 Overdue task Pam
> Prepare and send "Thank You" letter to Client 12/04/13 Overdue task Pam
> Schedule and conduct Client Survey meeting to review the results 12/04/13 Overdue task Pam
> Document discussions with Client 12/04/13 Overdue task Pam
> Conduct Broker Claim Review - (Strategic Outcomes Practice delivers Claim, Risk Control, Safety and Data Analytic consulting services) 12/04/13 Overdue task Mike / Lori
- Evaluate claim reserves - Reserve to present known outcome 12/04/13 Overdue task Mike / Lori
- Audit claim activity 12/04/13 Overdue task Mike / Lori
- Resolution of pending claims 12/04/13 Overdue task Mike / Lori
- Identify subrogation potential 12/04/13 Overdue task Mike / Lori
- Adherence to action plan for claim resolution / closure 12/04/13 Overdue task Mike / Lori
- Evaluate claims servicing account instructions 12/04/13 Overdue task Mike / Lori
- Identify adjuster service issues 12/04/13 Overdue task Mike / Lori
- Evaluate Managed Care and Bill Re-pricing activity 12/04/13 Overdue task Mike / Lori
> Document claim review discussions with Client, Carrier and Client Team 12/04/13 Overdue task Mike / Lori
> Workers' Compensation Experience Modification review 12/04/13 Overdue task Mike / Lori
3. 180 Days Prior - Delivery of the Client Engagement Guide (CEG) > Create Master Marketing File (required for documentation) 02/02/14 Pam
> Prepare Placing File Checklist (PFC) to document compliance requirements and place copy in file (and WPC) 02/02/14 Pam
> Prepare Client Relationship Information Pack (Client Engagement Guide) 02/02/14 Pam
> Present and discuss the following key documents which define the way we work together to the Client: 02/02/14 Pam
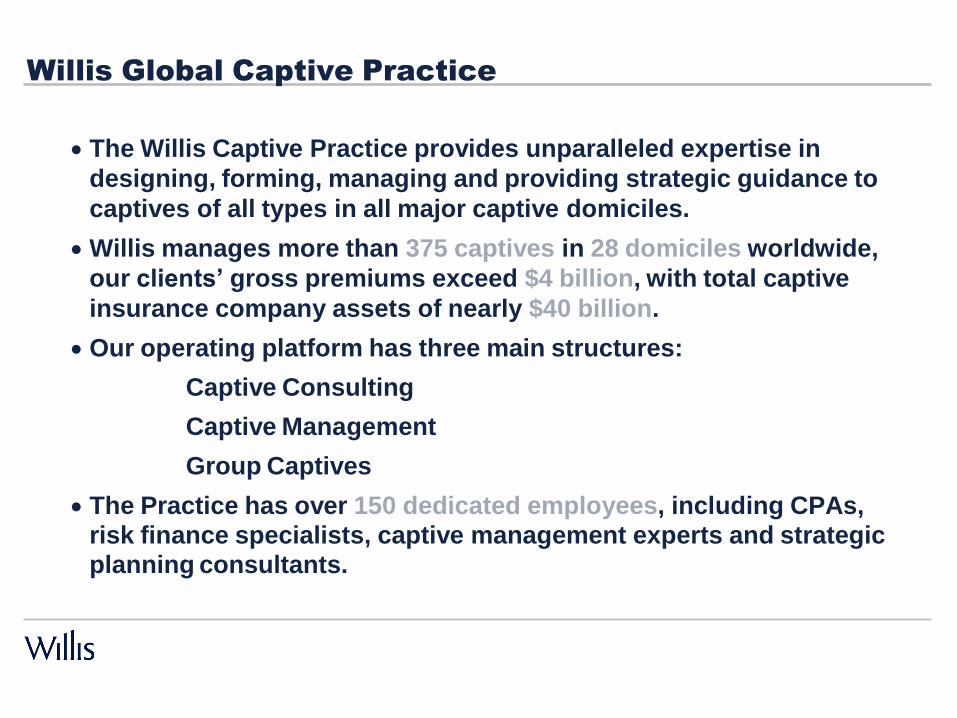
Willis Global Captive Practice
The Willis Captive Practice provides unparalleled expertise in
designing, forming, managing and providing strategic guidance to
captives of all types in all major captive domiciles.
Willis manages more than 375 captives in 28 domiciles worldwide,
our clients’ gross premiums exceed $4 billion, with total captive
insurance company assets of nearly $40 billion.
Our operating platform has three main structures:
Captive Consulting
Captive Management
Group Captives
The Practice has over 150 dedicated employees, including CPAs, risk finance specialists, captive management experts and strategic planning consultants.

The Americas
Les Boughner
Executive VP & MD of the Willis Captive Management Practice
Group Captives
Randy Boomgarden
Alembic
Craig Ream
Construction Solutions
Consulting/Sales
Sean Rider – New York
Richard W. Wright – New Jersey
Anne Marie Towle - Chicago
Kathleen Waslov – Employee Benefits
Bruce Whitmore - Healthcare
Willis Management
(Bermuda), Ltd.
Oliver Heyliger
Willis Management
(Cayman), Ltd.
Barbados
Stephen Gray
Willis Management
(Vermont), Ltd.
New York, South
Carolina, Tennessee
David Guerino
Willis Management
(Hawaii)
Arizona, Nevada,
Utah
Jason Palmer

Willis Captive Practice
Captive Consulting
New Captive Feasibility
Strategic Consulting for Mature Captives
Captive Management
Liaison with Actuaries, Regulators, Auditors
Ongoing servicing
Preparation of captive financials
Ongoing filing maintenance
Shareholder Board of Directors meeting
Group Captives

Willis Captive Consulting Practice
Strategic Consulting for Mature Captives
Our various efforts classed as “strategic consulting for mature captives” aim at assessing and maximizing how an organization achieves value from an existing captive vehicle. As organizations change and regulatory, domicile, tax, and risk tolerance regimes morph over time, the efficacy of captives and their utilization opportunities also change. Our services are focused on helping captive owners determine the optimal use, structure, and/or winding down of a captive.
Periodic brainstorming with key members of the captive owner’s management group and other service partners to consider risk retention levels and alternatives, additional lines of coverage, what-if scenarios, domicile issues, etc.
Interpretation and analysis of actuarial, financial, and other captive data; Attendance and participation at captive board meetings; Keeping the captive’s leadership current with captive industry, domicile, tax and accounting changes
and assessing the impact of these changes; Providing an independent voice in vendor assessment and assisting in RFP processes as needed; Evaluating risk areas where the captive’s participation would enhance protection and reduce cost-of-
risk; Evaluation of the ongoing efficacy of a captive, and management of the outcomes of that analysis.

Lines of Business
TRADITIONAL EXPANDED EMERGING
Workers’ Compensation
Auto Liability
General Liability
Professional and Products
Liability
Director and Officer Liability
Employment Practices
Liability
Environmental Liability
Product or Service
Extended Warranty
Property and Business
Interruption
EE Benefits
Terrorism (TRIA)
Shipping Coverage
Title and Private Mortgage
Insurance
Equipment Maintenance
Construction Exposures
Trade Credit Risk
Cyber-Risk
Managed Care Errors and
Omissions
Self-Insured Medical
Stop-Loss (non-
ERISA)
Reputation/Brand/Loss
of Income Risks
Intellectual Property
(patent, trademark,
copyright)
Product Recall
Coverage
Medicare “Fraud and
Abuse” Insurance
Lease Residual Value
Risk
Punitive Damages
Coverage

Types of Captive Utilization
Retained Risk
Finance
Risk Transfer
Rate Arbitrage
Access to
Capacity
Entrepreneurial
Utilizations
Infrastructure for
providing
transparency,
validation, and
rationalization of
retained risk
positions
Enhancing risk
management
efforts
Accelerating tax
treatment of
deductible
liabilities
Reinsurance
market cost of risk
transfer is less
than commercial
retail cost of risk
transfer
Better use of
capital to retain
risk than transfer it
Managing total
cost of risk
Federal programs
(TRIA)
Reinsurance
capacity, which
may not be
otherwise
accessible in
commercial retail
market (trade
credit risk, +10 yr
pollutions risks)
Franchisee
programs
Consumer facing
insurance
programs
(warranty, service
contract, point of
sale insurances,
etc)
Affiliate business
(vendors, VAPs,
distributors, etc)
Agency captives
3rd party business

831b / Microcaptives
• Underwriting income for the captive is tax free.
• Can be utilized as a wealth transfer and estate planning vehicle
for private companies.
• Willis will only become involved with Microcaptives when there is a
sustainable business plan.

831b / Microcaptives
Under the provisions of the United States Tax Code
§831(b), a tax election may be available to U.S. Property
and Casualty ("P&C") Insurers (Small Insurance
Companies) with written premiums less than $1.2 million
dollars. If properly structured, the insurance company is
taxed on net investment income only and not on
underwriting income. Non-taxed underwriting income, if any
will accrue to the captive’s surplus and dividends and may
be eligible for the dividends received deduction when
distributed to the corporate shareholder(s) or parent, and
dividends distributed to an individual owner are taxed at the
capital gains rate

The aim is to put our clients in a superior
information position

Resilience example: ERM Maturity Model
Framework Element Immature Basic Mature Advanced World-Class
Risk Identification
No formal process for
identification of risks
Annual risk
identification exercise
for key projects and
sites
Key corporate risks
identified with limited
interaction among
groups
Business risks
frequently identified
with assessment of
likelihood, impact and
mitigating actions;
cross-group work
All major risks regularly
identified. Robust
process also surfaces
new and emerging
risks
Risk Assessment and Prioritization
No formal process for
assessment of risks
Limited analysis to
assess and provide
insight. Major business
risks discussed at
Business Unit level
Prioritization of key
risks across the group
with detailed
quantification of
selected risks
Prioritization based on
aggregation of all
business risks across
the group; risk
tolerance known and
included in assessment
Prioritization of
aggregated risks
across group with
classification by key
underlying risk drivers
and company-killer
scenarios
Risk Mitigation and Financing Options
Little or no systematic
development and
comparison of options;
external risk reporting
requirements
sometimes not met
Methodologies for risk
categories identified
and used inconsistently;
compliance mentality
Options compared
within business units
using consistent
methods but done
within functions
primarily
Company-wide
comparison of options,
but within functions
(finance, operations,
insurance, construction,
etc)
Options compared
across company and
across functions in
single language of risk
and decisions made
accordingly
Risk Strategy and Action Plans
Risk Implementation
No action plan for risk
management and
finance exists
Little or no follow-
through on option
recommendations;
poor results in key risk
management metrics
One or more action
plans exists within one
or more functions and
one or more business
units
Some key risks are
managed resulting in
fewer surprises; but
little or no preparation
for major risk response
Functions each have
an independent action
plan with limited or no
communication with
other functions;
business units may
have action plans
Functions implement
their action plans well
and business units
track progress of these
functional plans
Action plans completed
annually within
functions and business
units in consistent
manner
Top management
tracks business unit
and function progress
and oversees
implementation
Board has ‘owners’ of
key ‘black swan’
scenarios and is
continuously engaged
in assessing action
plans, all of which are
in single risk language
Board receives
updates on actions
regularly, participates
in simulation exercises
and guides
management

IMP
LE
ME
NTA
TIO
N
RIS
K S
TR
AT
EG
Y
How Willis GSCG Thinks About Risk
Client Risk Landscape
Risk Insight Steps Solution Choices
6. Retain
- Balance Sheet
- Captive
1. 2. 3. 4. 5. 7. Transfer Understand Client and
Define Risk Tolerance
Identify Priority
Model Loss Frequency
Calculate CCoRSM
- To Insurers - To Capital
Industry Dynamics
Exposures and Risks
and Severity Markets
8. Mitigate
Data gathering, preparation and provision
9. Avoid
Risk financing options Risk management options

Earthquake Loss OEP Curve 8
)
($mn 7
ss o L 6
ed l el 5 d o M 4
3
2 Policy Programme Activation Exhaustion
1
-
- 200 400 600 800 1,000
Return Period (yrs)
$ M
illio
ns
Mo
de
lle
d L
os
s (
$m
n)
Proprietary Tools and Processes
FIASM (Financial Impact Analysis)
Measures an organizations risk tolerance based on pre-determined ranges
of variability in key financial metrics
5
CCoRSM (Comprehensive Cost of Risk) Identifies technically optimal risk financing program structure for a given risk
4
$0.20 $0.40
3 $1.00 $0.50 $0.10
$1.00
2 $2.20 $4.00
$2.70
1 $2.00
and quantifies volatility of retained risk $1.00
0
-1
-$0.30
No Insurance Large Deductible Small Deductible Guaranteed Cost
Expected Retained Losses Exp Premium Cost of Volatility Program Value
PRISMSM (Privacy Risk Insurance Strategy Model)
Quantifies privacy risk data and identifies optimal insurance program
structure WISDOMSM (Willis Integrated Solutions Directors & Officers Model)
Quantifies D&O risk, identifies optimal insurance structure
Natural Catastrophe Analysis Modeling and managing natural catastrophe (nat. cat) risk
Earthquake Loss OEP Curve
8
7
6
5
4
3
2 Policy Activation
1
Programme
Exhaustion
-
- 200 400 600 800 1,000
Return Period (yrs)

FIA
Financial Impact Analysis
Establish the “surprise” negative
deviations in key financial metrics that a
company is able to sustain in a given year
Model the company's financials to
demonstrate the impact of increasing
levels of retained downside risks on these
metrics
Incorporate the output into a risk financing
strategy that achieves lowest cost of risk
within the acceptable range of tolerance
$ M
illi
on
s
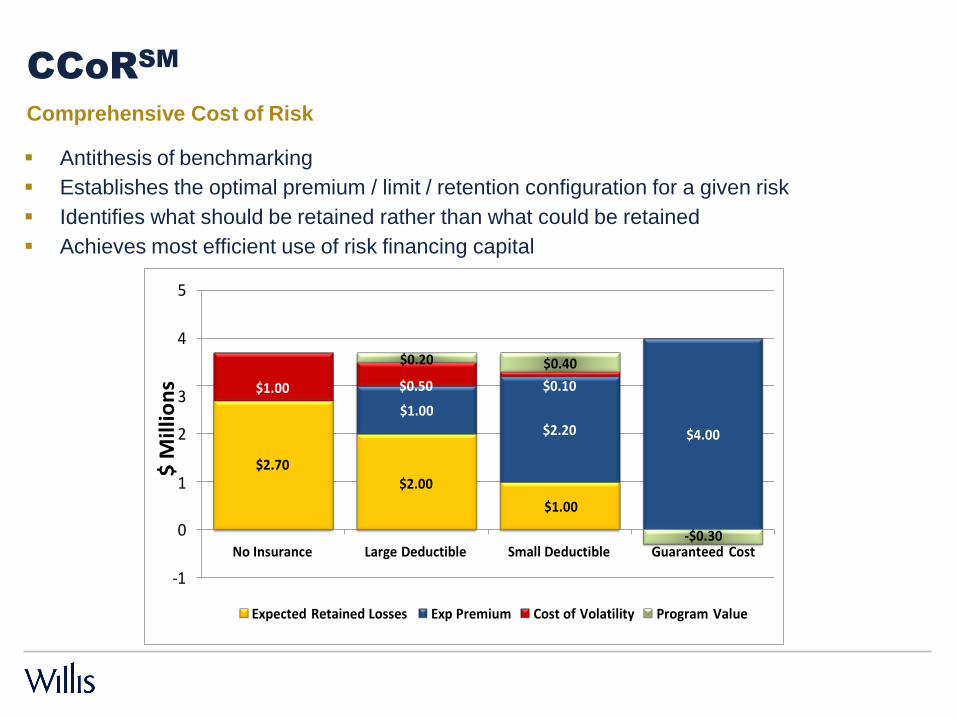
CCoRSM
Comprehensive Cost of Risk
Antithesis of benchmarking
Establishes the optimal premium / limit / retention configuration for a given risk
Identifies what should be retained rather than what could be retained
Achieves most efficient use of risk financing capital
5
4 $0.20 $0.40
3 $1.00 $0.50 $0.10
$1.00
2 $2.20 $4.00
$2.70 1 $2.00
$1.00
0
-$0.30
No Insurance Large Deductible Small Deductible Guaranteed Cost
-1
Expected Retained Losses Exp Premium Cost of Volatility Program Value

Pro
bab
ilit
y (
%)
CCoRSM
100%
90%
80%
70%
60%
After risk financing
(Including Prem)
Before risk financing
50%
40%
30%
Risk Volatility
20%
10% Risk Volatility
0%
Expected Loss
2.7 3.2
4.2
Impact ($MM)
12.7

Value of Various Privacy Breach Insurance Structures
(Safety Level = 99.9% )
3,000,000 33,481
2,500,000 358,606 512,596
500,000 2,000,000
1,400,000
1,744,727 750,000
1,500,000 1,260,518
1,245,083 1,000,000 936,118 721,090
389,377
500,000 976,881 617,918 522,893 567,036 559,116
0
No Insurance 25M/25M xs 2M 50M/35M xs 2M 100M/50M xs 5M 175M/175M xs 10M
Expected Retained Losses Cost of Volatility Premium Value "Break-Even" Premium
CU
MU
LA
TIV
E P
RO
BA
BIL
ITY
(C
ON
FID
EN
CE
LE
VE
Cu
mu
lati
ve
Pro
bab
ilit
y
PRISMSM
Privacy Risk Insurance Strategy Model
Analytic model used to quantify privacy risk
Accesses a proprietary database of thousands of
privacy risks
0.25
0.20
0.15
100%
90%
80%
70%
60%
Probability Distribution of Total Records Affected
(Actual Total Records Affected vs Selected Distribution)
Adjusts industry data relative to client-specific
risks and controls
Applies Monte Carlo simulation to generate
several thousand hypothetical loss years
Utilizes CCoRSM to determine the optimal
privacy insurance program structure
0.10
0.05
0.00
2006 2007 2008 2009 2010 2011
Historical Breach Frequency Projected Breach Frequency
50%
40%
30%
20%
10%
0%
1 10 100 1,000 10,000 100,000 1,000,000 10,000,000 100,000,000
Total Records Affected (Logarithmic Scale)
Actual Total Records Affected Selected Severity Distribution
UNINSURED LOSS PROBABILITY DISTRIBUTIONS
100.0%
95.0%
90.0%
85.0%
80.0%
75.0%
70.0%
65.0%
60.0%
55.0%
50.0%
$100 $1,000 $10,000 $100,000 $1,000,000 $10,000,000 $100,000,000
AGGREGATE ANNUAL LOSSES
Discovery, Notification, Response Regulatory Fines All Other Insurable Costs Total

WISDOMSM
Willis Integrated Solutions Directors & Officers Model
Analytic tool used to quantify D&O risks for
public companies
Generates a frequency distribution based
on industry, market cap, and a robust
proprietary database of historic D&O
losses
Generates a severity distribution using the
proprietary database of historic D&O
losses
Combines frequency and severity
distributions, simulating thousands of
hypothetical loss years using Monte Carlo
Simulation
Utilizes CCoRSM to determine the optimal
D&O insurance program structure

Earthquake Loss OEP Curve 8
)
($mn 7
ss o L 6
ed l el 5 d o
M 4
3
2 Policy Programme Activation Exhaustion
1
-
- 200 400 600 800 1,000
Return Period (yrs)
Mo
dell
ed
Lo
ss
($m
n)
Natural Catastrophe Analysis
Strategic CAT review
High level review and mapping of a client’s natural hazard
exposures on a regional or global basis.
CAT Modeling
Use of natural catastrophe models to quantify a client’s portfolio
Earthquake Loss OEP Curve
8
7
6
5
losses at an aggregate level and compare against their current
retention levels and CAT limits in their insurance program
4
3
2 Policy Activation
1
-
Programme
Exhaustion
- 200 400 600 800 1,000
Return Period (yrs)
CAT Risk Engineering
On-site risk engineering surveys for individual facilities that are
identified as having high levels of localized property damage and
business interruption exposures. Provision of cost-effective
improvement measures to reduce the exposure.

1 2 3
LossPIQSM
Overview
Prospective Identification & Quantification
Quantifies low frequency / high severity risks where loss data is scare or non-existent
Identifies most plausible future loss scenarios
Willis develops a loss model for each risk and populates it with risk impact types and cost
drivers
Expert client team disassembles each major scenario into 3 sub-scenarios and then by
consensus assigns impact and likelihood parameters
Model aggregates data and generates an overall loss distributions curve of the risk
Synthesize most
plausible future
scenarios
Transition qualitative
into quantitative
measurement
Integrate with historical
and public domain data,
run simulations

DENIAL OF ACCESS COSTS
Notification Recovery Site Invocation Alternative Accommodations
# of Locations % of Events
This Would Occur
# Days
Low
# Days
High
% of Events
This Would Occur
# of Alt
Sites
# Years
Rental
% of Events
This Would Occur
Scenario Subscenario Description/Comments Likelihood Low High
DOA - Natural Event Anticipated UK Southern Severe Snow DOA - Natural Event Mid Range London Flood DOA - Natural Event Worst Case Pandemic Affecting >30%
DOA - Man Made Event Anticipated Building evacuation DOA - Man Made Event Mid Range Terrorist non-CBNR attack DOA - Man Made Event Worst Case Terrorist CBNR attack
Information Security Breach Anticipated Unauthorized access Information Security Breach Mid Range Data leakage Information Security Breach Worst Case Malicious cyber attack
Infrastructure Failure Anticipated Power/cooling outage Infrastructure Failure Mid Range Data corruption Infrastructure Failure Worst Case Multiple data center losses Inadequate Planning Anticipated Included in other scenarios Inadequate Planning Mid Range Included in other scenarios Inadequate Planning Worst Case Included in other scenarios
Third Party/Vendor Error Anticipated Virus Third Party/Vendor Error Mid Range Connectivity/network outage Third Party/Vendor Error Worst Case SBSA domain security outage
Regulatory Censure Anticipated Greater regulatory oversight/fines Regulatory Censure Mid Range Conditions on license/fines>$10M Regulatory Censure Worst Case Loss or suspension of license/removal of senior mgt
DOA - Political/Social Unrest Anticipated Industrial action DOA - Political/Social Unrest Mid Range Large scale civil unrest DOA - Political/Social Unrest Worst Case Civil war in South Africa
Anticipated Mid Range Worst Case
LossPIQSM
Risk Register
XYZ BANK
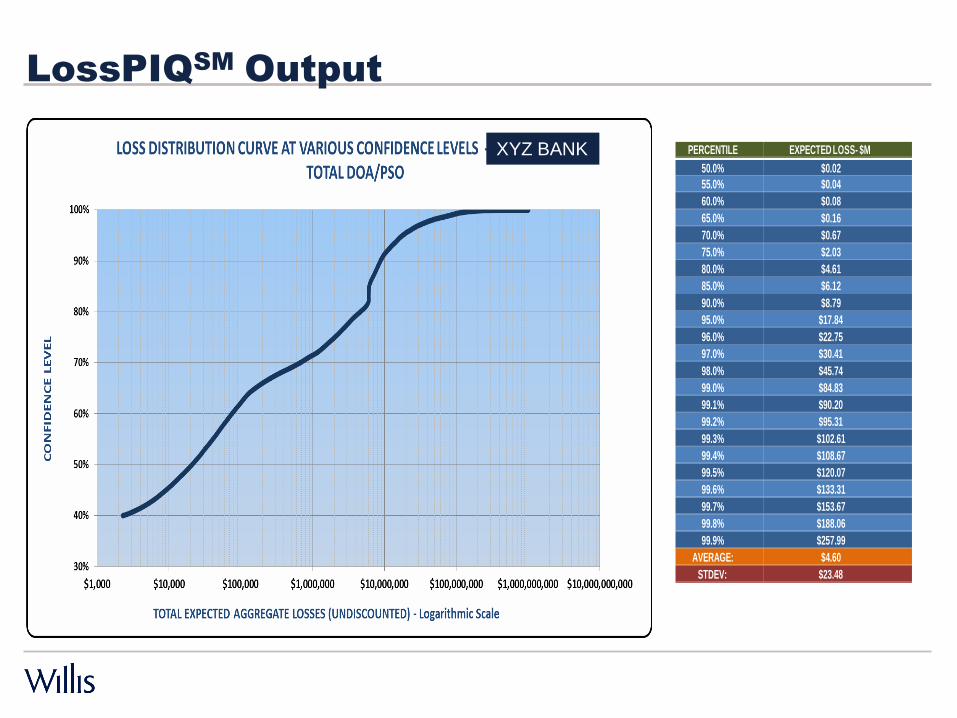
PERCENTILE EXPECTED LOSS- $M
50.0% $0.02
55.0% $0.04
60.0% $0.08
65.0% $0.16
70.0% $0.67
75.0% $2.03
80.0% $4.61
85.0% $6.12
90.0% $8.79
95.0% $17.84
96.0% $22.75
97.0% $30.41
98.0% $45.74
99.0% $84.83
99.1% $90.20
99.2% $95.31
99.3% $102.61
99.4% $108.67
99.5% $120.07
99.6% $133.31
99.7% $153.67
99.8% $188.06
99.9% $257.99
AVERAGE: $4.60
STDEV: $23.48
LossPIQSM
Output
XYZ BANK

RAPIDSM
Risk Assessment Probability & Impact Diagnostic
FEATURES
Consensus driven process to identify, assess, and communicate enterprise risk
Can be used across an enterprise or on a surgical basis
Comprehensive, accelerated, and cost effective
Fully articulates and prioritizes the major risks to achieving business objectives
Surfaces emerging and unforeseen risks
Generates high impact, real time graphics
Built-in module for Improvement Planning

Risk Optimizer
Combines CCoRSM and FIA
CCoRSM establishes optimal structure by line of coverage
FIA establishes corporate risk tolerance level
Probability of collective retentions breaching tolerance is determined
Individual retentions are adjusted to accommodate overall tolerance and risk appetite
Analytics are periodically recalculated to accommodate changes in both risks and
financials
Program structure is adjusted as necessary to maintain the lowest cost within the risk
tolerance level

Pro
b.
of
Ex
ce
ed
ing
$50M
Ab
ove
Exp
ecte
d C
ost
Risk Optimizer
Risk Optimizer
(Expected Cost vs Probability of Exceeding $50M Risk Tolerance,
Excluding No Insurance)
1.90%
1.85%
1.80%
Current
1.75%
1.70%
1.65%
1.60%
13622
(12622)
13612 (12612)
13412
(12412)
13411
33412
33411
(32411)
36.0 36.5 37.0 37.5 38.0 38.5 39.0 39.5 40.0
Millions
Expected Cost (Premium + Discounted Expected Retained Losses)

We are honored to be part of
Western Pallet Association.
THANK YOU