Welcome to the Centre for Biostatistics...
56
Welcome to the Centre for Biostatistics Showcase Weds 3rd May 2017
-
Upload
vuongkhuong -
Category
Documents
-
view
216 -
download
0
Transcript of Welcome to the Centre for Biostatistics...
Welcome to the Centre for Biostatistics Showcase
Weds 3rd May 2017
Biostatistics Collaboration Unit
(BCU)
Andy Vail, Centre Lead for Biostatistics
Four of ten cats were tabbies
What is estimate (‘best guess’) of population proportion?
Answer: 40% = 4/10
Or: 33% = 3/9?
Or: It depends!
Biostatistics Collaboration
Seek input from Senior Biostatistician
Expertise in design, analysis and interpretation
Co-applicant or Named Collaborator as appropriate
Include costs for Biostatistics RA/RF if required
Time-consuming activity
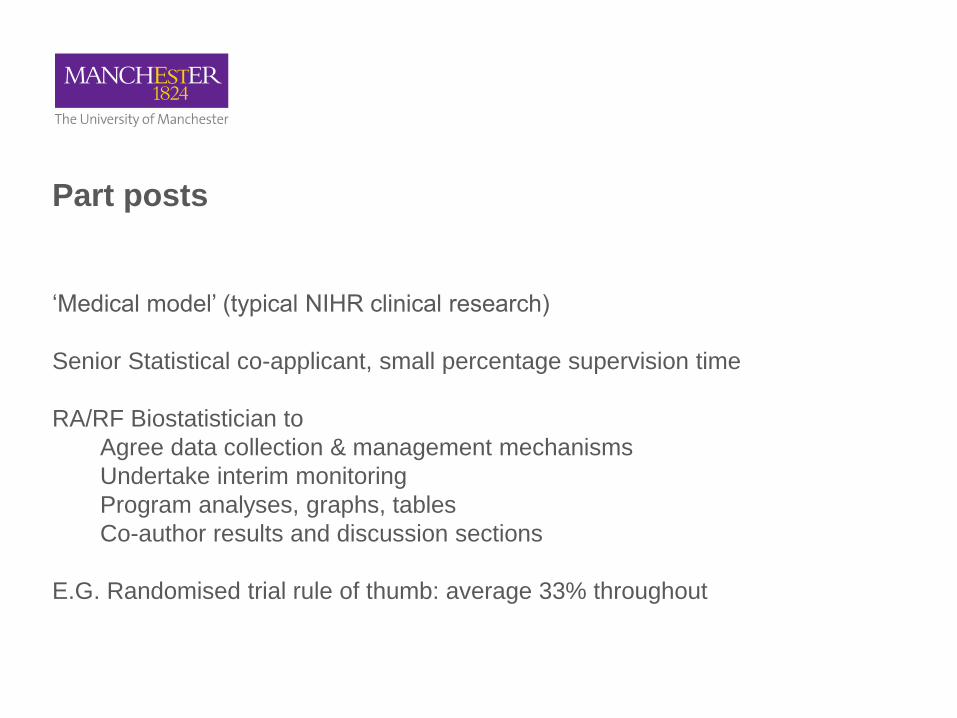
Part posts
‘Medical model’ (typical NIHR clinical research)
Senior Statistical co-applicant, small percentage supervision time
RA/RF Biostatistician to
Agree data collection & management mechanisms
Undertake interim monitoring
Program analyses, graphs, tables
Co-author results and discussion sections
E.G. Randomised trial rule of thumb: average 33% throughout
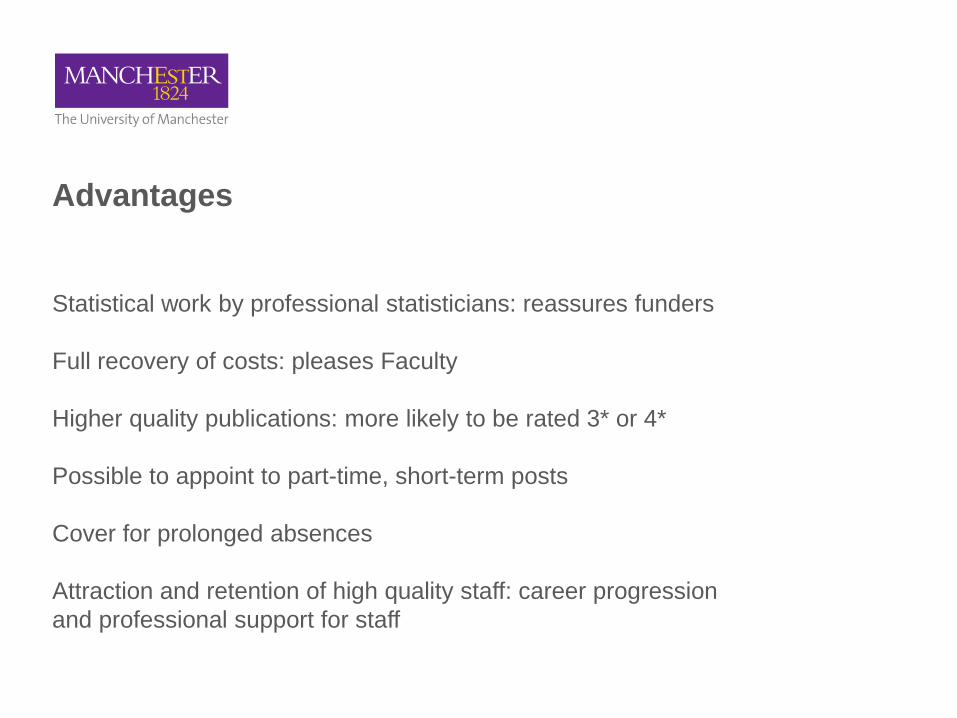
Advantages
Statistical work by professional statisticians: reassures funders
Full recovery of costs: pleases Faculty
Higher quality publications: more likely to be rated 3* or 4*
Possible to appoint to part-time, short-term posts
Cover for prolonged absences
Attraction and retention of high quality staff: career progression
and professional support for staff

Contacts
http://research.bmh.manchester.ac.uk/biostatistics/collaborationunit
Wendy Lamb, Biostatistics Administrator: 0161 275 5764
Links
http://www.rds-nw.nihr.ac.uk Research Design Service
http://www.mahsc-ctu.co.uk Clinical Trials Unit
Biostatistics collaborations with the Centre for Primary Care
David Reeves
Centre for Biostatistics Showcase, May 2017
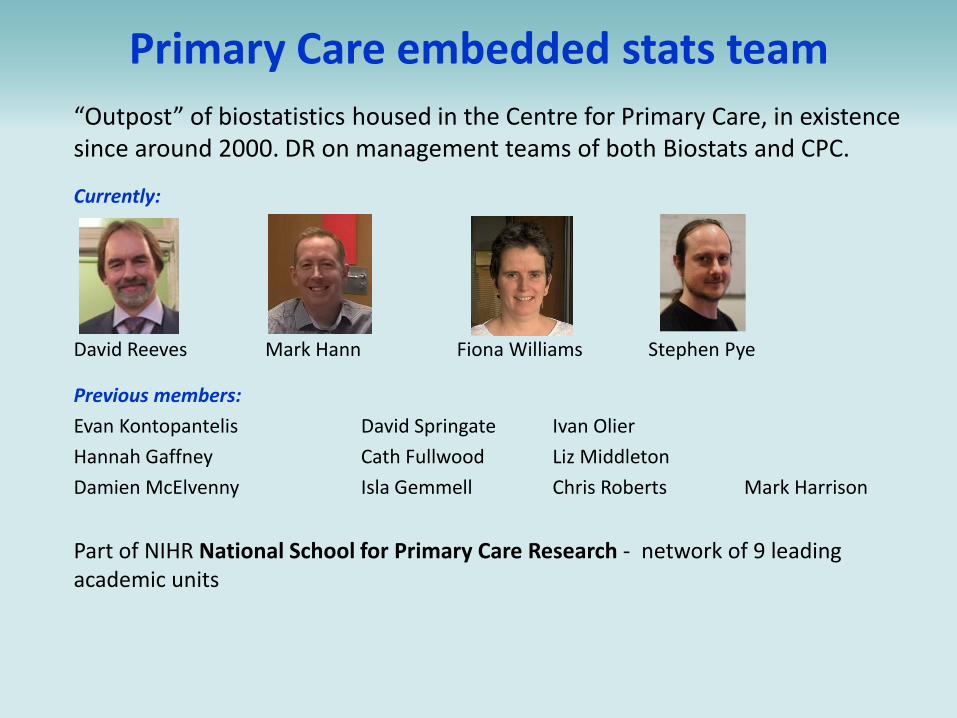
Primary Care embedded stats team
Currently:
David Reeves Mark Hann Fiona Williams Stephen Pye
Previous members:
Evan Kontopantelis David Springate Ivan Olier
Hannah Gaffney Cath Fullwood Liz Middleton
Damien McElvenny Isla Gemmell Chris Roberts Mark Harrison
Part of NIHR National School for Primary Care Research - network of 9 leading academic units
“Outpost” of biostatistics housed in the Centre for Primary Care, in existence since around 2000. DR on management teams of both Biostats and CPC.
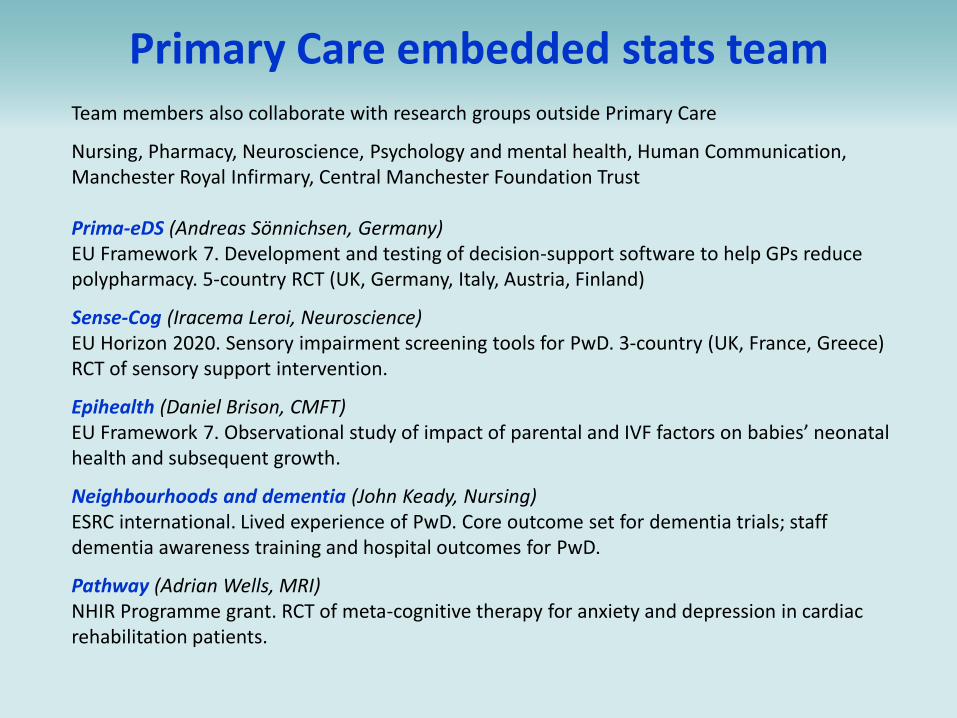
Primary Care embedded stats team Team members also collaborate with research groups outside Primary Care
Nursing, Pharmacy, Neuroscience, Psychology and mental health, Human Communication, Manchester Royal Infirmary, Central Manchester Foundation Trust Prima-eDS (Andreas Sönnichsen, Germany) EU Framework 7. Development and testing of decision-support software to help GPs reduce polypharmacy. 5-country RCT (UK, Germany, Italy, Austria, Finland)
Sense-Cog (Iracema Leroi, Neuroscience) EU Horizon 2020. Sensory impairment screening tools for PwD. 3-country (UK, France, Greece) RCT of sensory support intervention.
Epihealth (Daniel Brison, CMFT) EU Framework 7. Observational study of impact of parental and IVF factors on babies’ neonatal health and subsequent growth.
Neighbourhoods and dementia (John Keady, Nursing) ESRC international. Lived experience of PwD. Core outcome set for dementia trials; staff dementia awareness training and hospital outcomes for PwD.
Pathway (Adrian Wells, MRI) NHIR Programme grant. RCT of meta-cognitive therapy for anxiety and depression in cardiac rehabilitation patients.
Major themes of Primary Care research
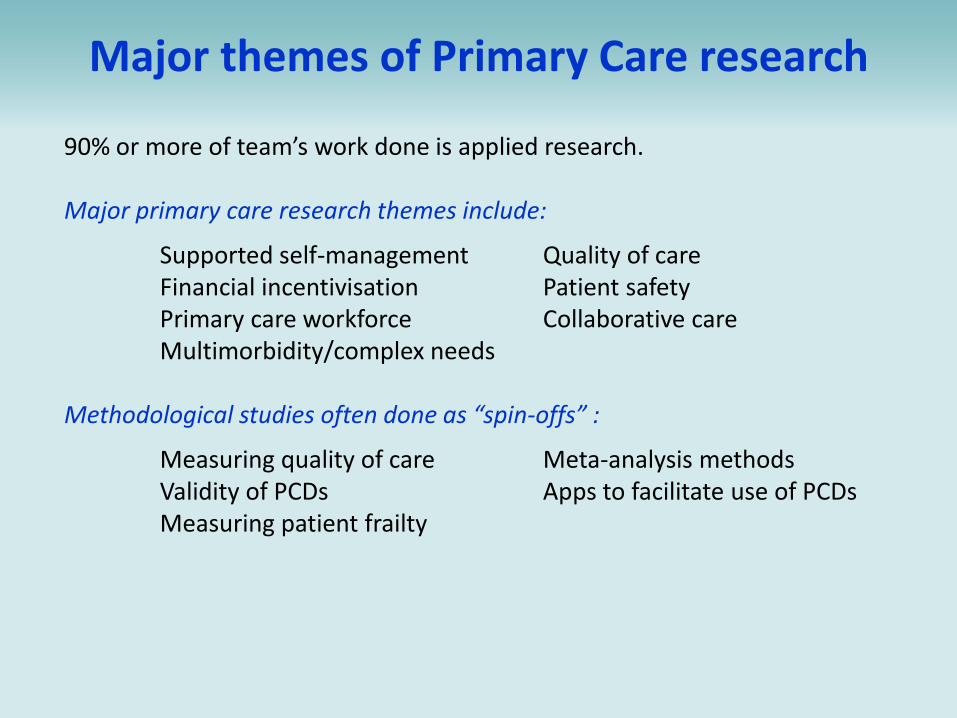
90% or more of team’s work done is applied research. Major primary care research themes include:
Supported self-management Quality of care Financial incentivisation Patient safety Primary care workforce Collaborative care Multimorbidity/complex needs Methodological studies often done as “spin-offs” :
Measuring quality of care Meta-analysis methods Validity of PCDs Apps to facilitate use of PCDs Measuring patient frailty
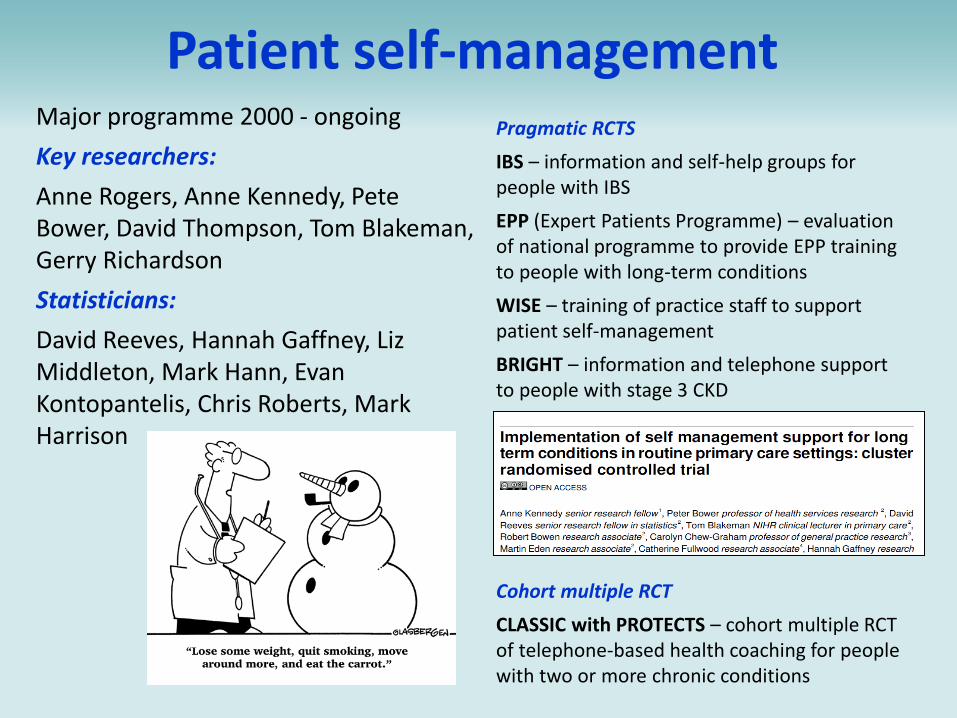
Patient self-management Major programme 2000 - ongoing
Key researchers:
Anne Rogers, Anne Kennedy, Pete Bower, David Thompson, Tom Blakeman, Gerry Richardson
Statisticians:
David Reeves, Hannah Gaffney, Liz Middleton, Mark Hann, Evan Kontopantelis, Chris Roberts, Mark Harrison
Pragmatic RCTS
IBS – information and self-help groups for people with IBS
EPP (Expert Patients Programme) – evaluation of national programme to provide EPP training to people with long-term conditions
WISE – training of practice staff to support patient self-management
BRIGHT – information and telephone support to people with stage 3 CKD
Cohort multiple RCT
CLASSIC with PROTECTS – cohort multiple RCT of telephone-based health coaching for people with two or more chronic conditions
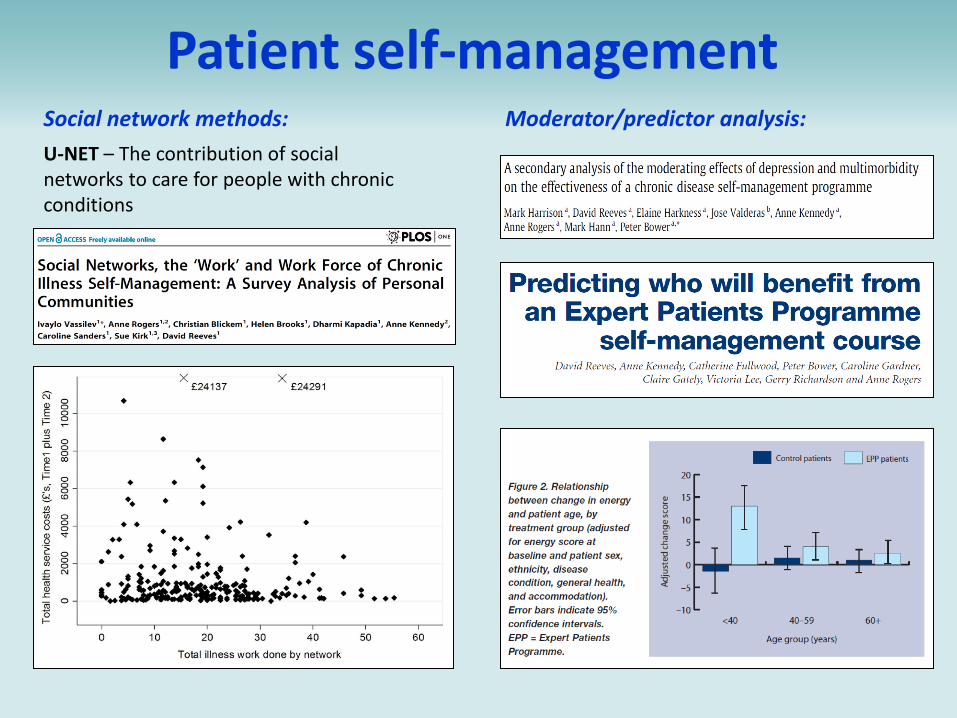
Patient self-management Social network methods:
U-NET – The contribution of social networks to care for people with chronic conditions
Moderator/predictor analysis:

Quality and incentivisation of Care Evaluating QOF using national data for ~8,000 practices
Researchers and statisticians:
Martin Roland, Stephen Campbell, Tim Doran, David Reeves, Evan Kontopantelis, Cath Fullwood, David Springate
Indicator development and roll-out
GAP and QUIP – projects to develop and pilot PC quality indicators
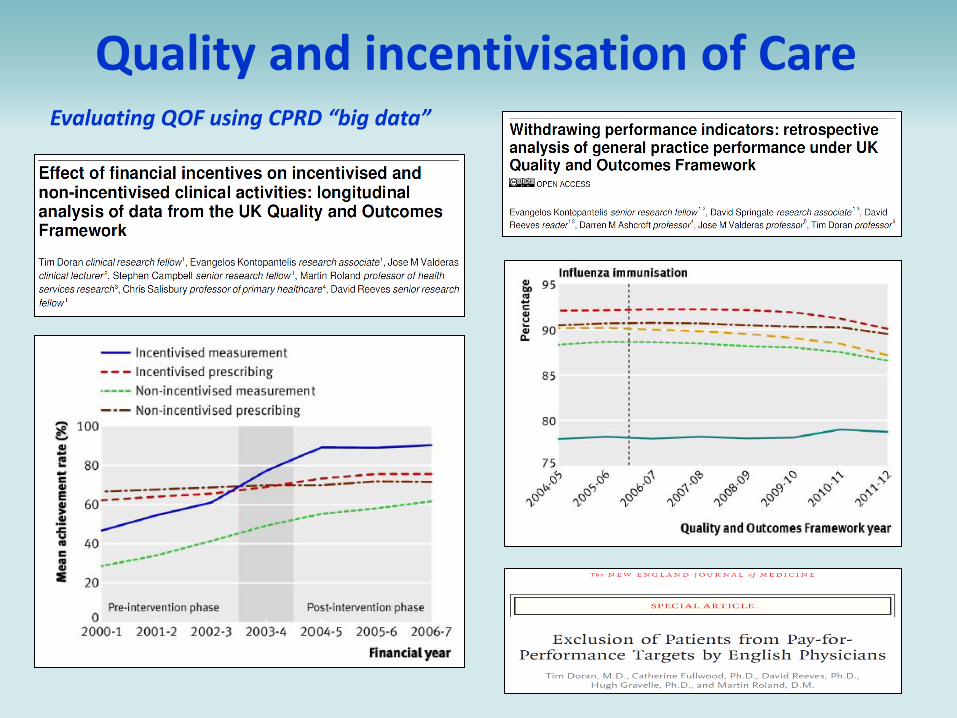
Quality and incentivisation of Care Evaluating QOF using CPRD “big data”
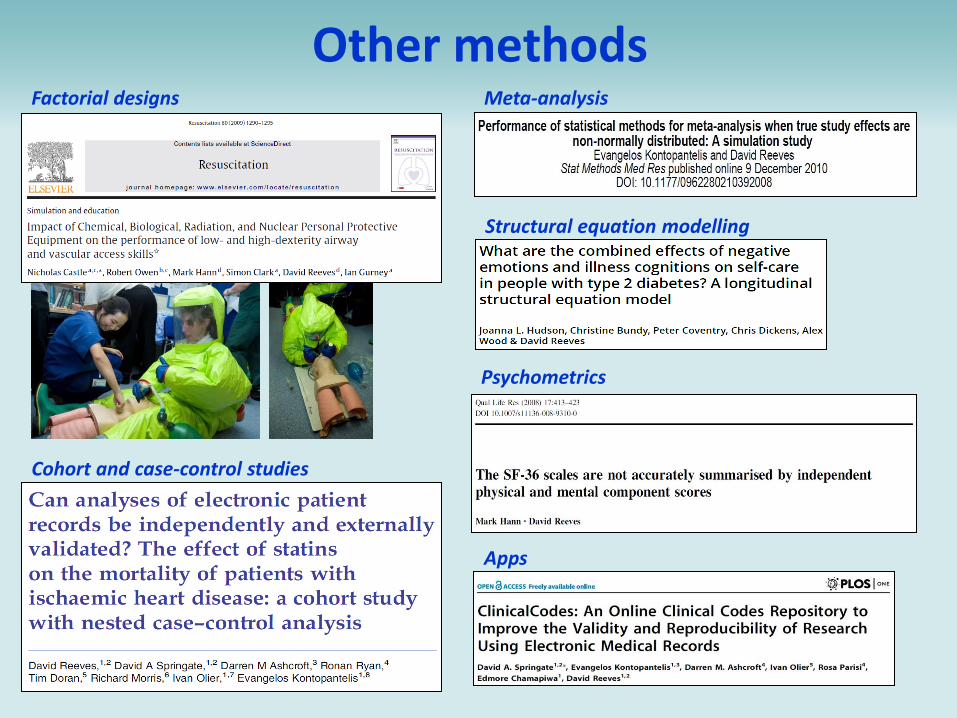
Other methods Meta-analysis Factorial designs
Cohort and case-control studies
Apps
Psychometrics
Structural equation modelling
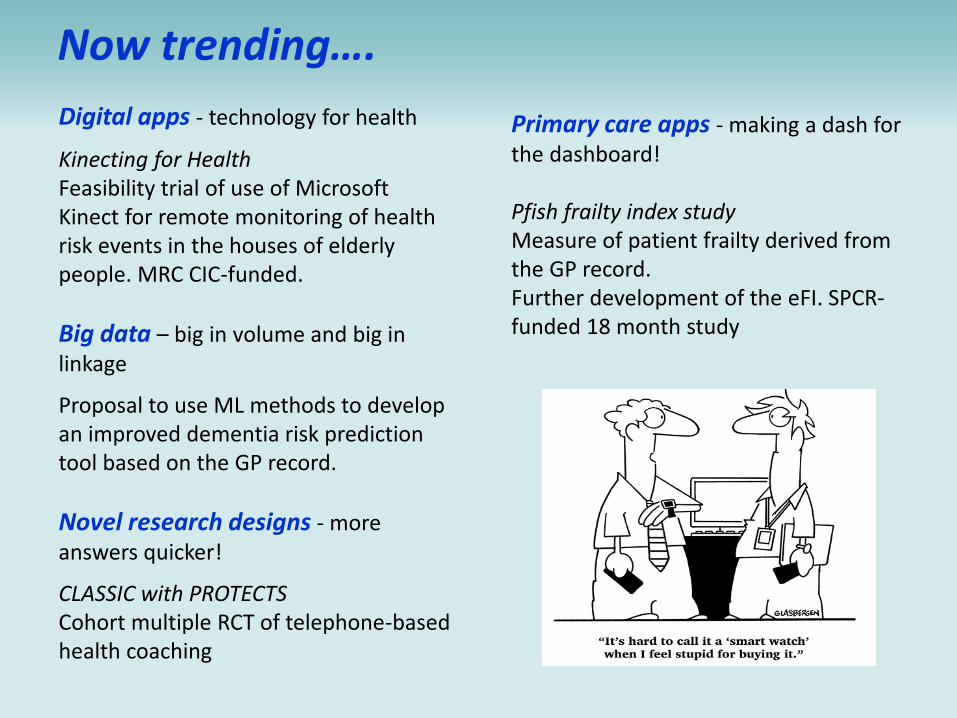
Now trending….
Digital apps - technology for health
Kinecting for Health Feasibility trial of use of Microsoft Kinect for remote monitoring of health risk events in the houses of elderly people. MRC CIC-funded.
Big data – big in volume and big in linkage
Proposal to use ML methods to develop an improved dementia risk prediction tool based on the GP record.
Novel research designs - more answers quicker!
CLASSIC with PROTECTS Cohort multiple RCT of telephone-based health coaching
Primary care apps - making a dash for the dashboard! Pfish frailty index study Measure of patient frailty derived from the GP record. Further development of the eFI. SPCR-funded 18 month study
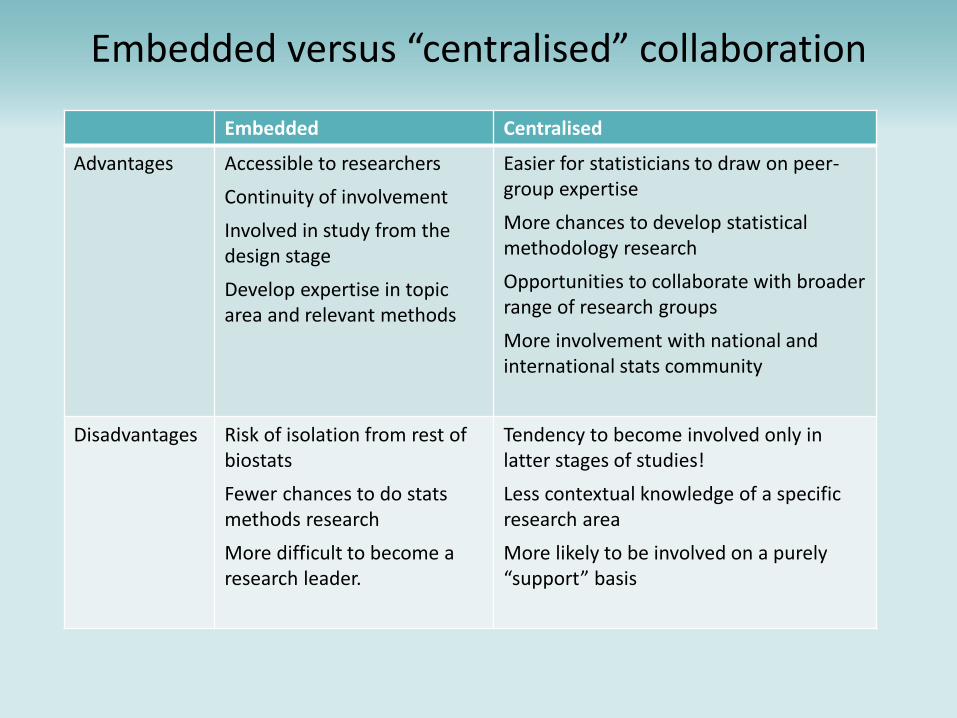
Embedded versus “centralised” collaboration
Embedded Centralised
Advantages Accessible to researchers
Continuity of involvement
Involved in study from the design stage
Develop expertise in topic area and relevant methods
Easier for statisticians to draw on peer-group expertise
More chances to develop statistical methodology research
Opportunities to collaborate with broader range of research groups
More involvement with national and international stats community
Disadvantages Risk of isolation from rest of biostats
Fewer chances to do stats methods research
More difficult to become a research leader.
Tendency to become involved only in latter stages of studies!
Less contextual knowledge of a specific research area
More likely to be involved on a purely “support” basis


MRC North West Hub for Trials
Methodology Research
Dr Matthias Pierce, Research Fellow
Centre for Biostatistics Showcase, Weds 3rd May
The Trials Network
• The MRC-funded Hub provides a network of researchers addressing methodological
priorities established by stakeholders
– CTU’s, industry, charities and government bodies.
• ‘Improve health by improving trials’
– Improve trials by improving their: efficiency, validity, scope and robustness
• The Network funds specific projects, PhD’s, workshops and training events.
– 5 Hubs placed across the UK.
– Nine-working groups targeting areas of interest
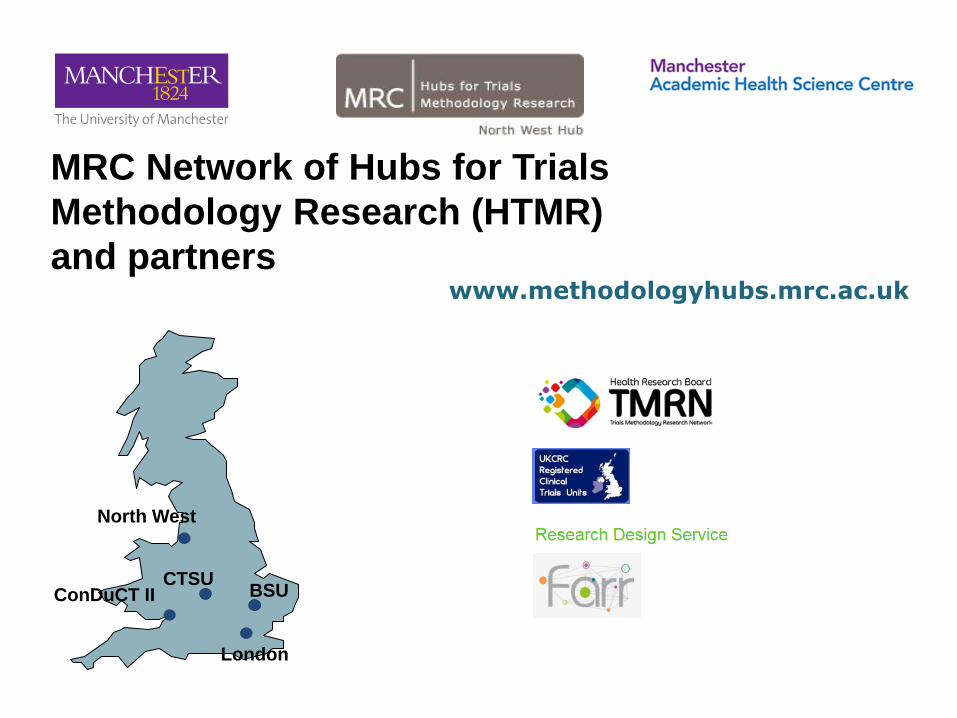
North West
CTSU BSU
London
MRC Network of Hubs for Trials
Methodology Research (HTMR)
and partners
ConDuCT II
www.methodologyhubs.mrc.ac.uk

The North West Hub
• Spread across Liverpool, Lancaster, Manchester and Bangor
• Themes covered:
– Theme 1: early phase trial design and analysis
– Theme 2: later phase trial design and analysis
– Theme 3: patient perspectives
– Theme 4: stratified medicine
– Cross-cutting clinical and health economics theme
Stratified medicine theme
• Stratified medicine: can we move beyond ‘ one size fits all’ or ‘trial and error’
approaches to medicine?
• Psoriasis: understanding determinants of response to biologic therapies
• Schizophrenia: predicting those are unresponsive to dopamine-targeting drugs
• Can biomarkers (proteomics, genomics, patient characteristics etc.) identify
subgroups with different treatment responses?
• What trial designs are there to assess the validity of biomarkers and how can we
choose between them? http://www.bigted.org/
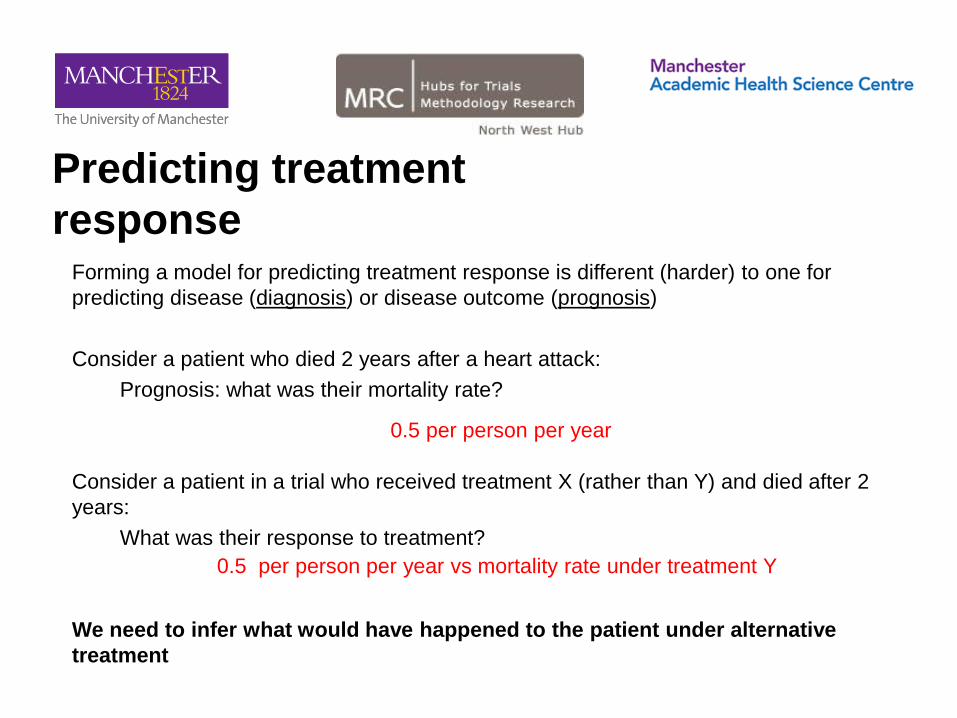
Predicting treatment
response Forming a model for predicting treatment response is different (harder) to one for
predicting disease (diagnosis) or disease outcome (prognosis)
Consider a patient who died 2 years after a heart attack:
Prognosis: what was their mortality rate?
Consider a patient in a trial who received treatment X (rather than Y) and died after 2
years:
What was their response to treatment?
We need to infer what would have happened to the patient under alternative
treatment
0.5 per person per year
0.5 per person per year vs mortality rate under treatment Y

Personalised treatment
recommendations
• A PTR is an algorithm that recommends treatment A over B for patients with particular
biomarker values
• For example, prescribe statins: >45 years old AND CVD risk >10% over 10 years
• Using trial data:
– How to identify the best PTR using multiple biomarkers?
– How to evaluate a personalised treatment recommendation, over an alternative
policy where everybody receives the same treatment?
ptr.ado
• Find out more at Centre for Biostatistics seminar 12th June!

NIHR Research Design Service Design Service
Sarah Rhodes
Frontline Adviser/Case Manager

Research Design Service
• The Research Design Service (RDS) provides
free advice on research design to researchers
who are developing proposals for national, peer-
reviewed funding competitions for applied health
or social care research.
Statistics input to RDS
Greater Manchester
• 2 Senior Methods Leads (Andy Vail, David
Reeves)
• 3 Advisers (Mark Hann, Sarah Rhodes, TBC)
• Expertise in Clinical Biostatistics, Community
Biostatistics and Systematic Reviews
Caseload of an RDS Statistician:
• Formulating research question
• Study Design
• Choosing outcome measures
• Planning statistical analysis
• Identifying statistical collaborators (BCU)
• Training events

Case Management
• Appropriate funding streams
• Putting together team
• How to write a good application
• Critical review
• Managing support from other advisers
• Clinical Trials Unit involvement
• Public involvement
• RDS outreach
• Funding panel observations
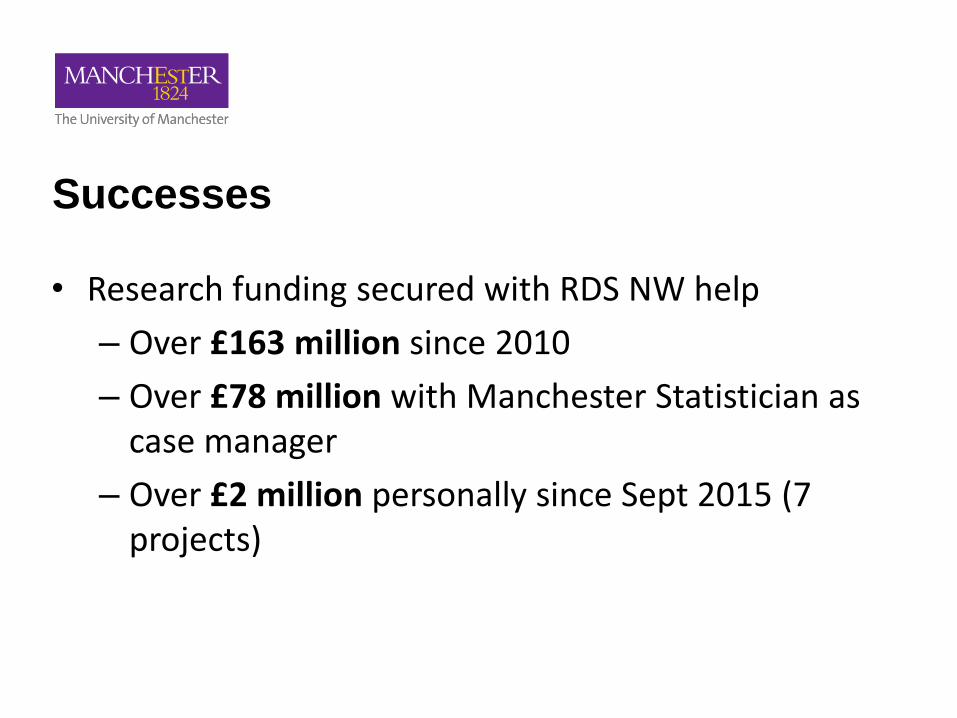
Successes
• Research funding secured with RDS NW help
– Over £163 million since 2010
– Over £78 million with Manchester Statistician as case manager
– Over £2 million personally since Sept 2015 (7 projects)
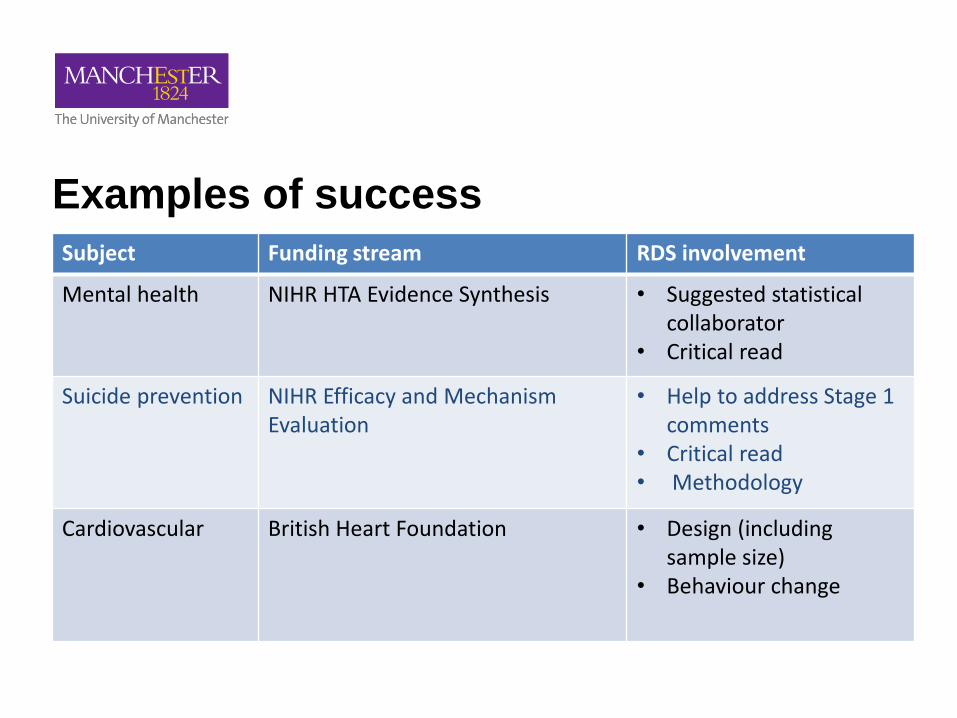
Examples of success
Subject Funding stream RDS involvement
Mental health NIHR HTA Evidence Synthesis • Suggested statistical collaborator
• Critical read
Suicide prevention NIHR Efficacy and Mechanism Evaluation
• Help to address Stage 1 comments
• Critical read • Methodology
Cardiovascular British Heart Foundation • Design (including sample size)
• Behaviour change
Collaborations
• RDS statisticians work with CTU, CLAHRC,
Biostatistics Collaboration Unit and often have
multiple roles
• Sometimes it is appropriate for RDS adviser to
become a collaborator
• Personally awaiting decisions on RfPB
(Renwick), HTA (Yorke) and HS and DR
(Cotterill)
Other Collaborations

PhD Aim: Develop statistical
methodology for the analysis
of observational data for
personalised/stratified
medicine
Antonia Marsden. Centre for Biostatistics Showcase 2017
Funder: NIHR Manchester Musculoskeletal Biomedical
Research Unit
Supervisors: Prof Richard Emsley, Prof Graham Dunn & Prof
Will Dixon
PhD overview
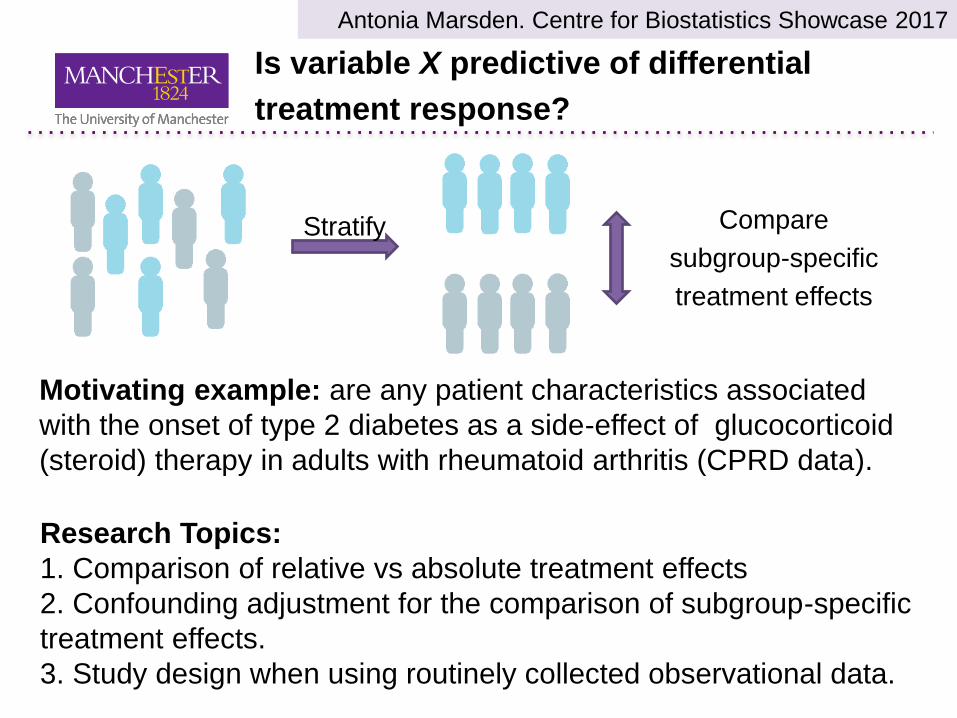
Is variable X predictive of differential
treatment response?
Antonia Marsden. Centre for Biostatistics Showcase 2017 Antonia Marsden. Centre for Biostatistics Showcase 2017
Compare
subgroup-specific
treatment effects
Stratify
Motivating example: are any patient characteristics associated
with the onset of type 2 diabetes as a side-effect of glucocorticoid
(steroid) therapy in adults with rheumatoid arthritis (CPRD data).
Research Topics:
1. Comparison of relative vs absolute treatment effects
2. Confounding adjustment for the comparison of subgroup-specific
treatment effects.
3. Study design when using routinely collected observational data.
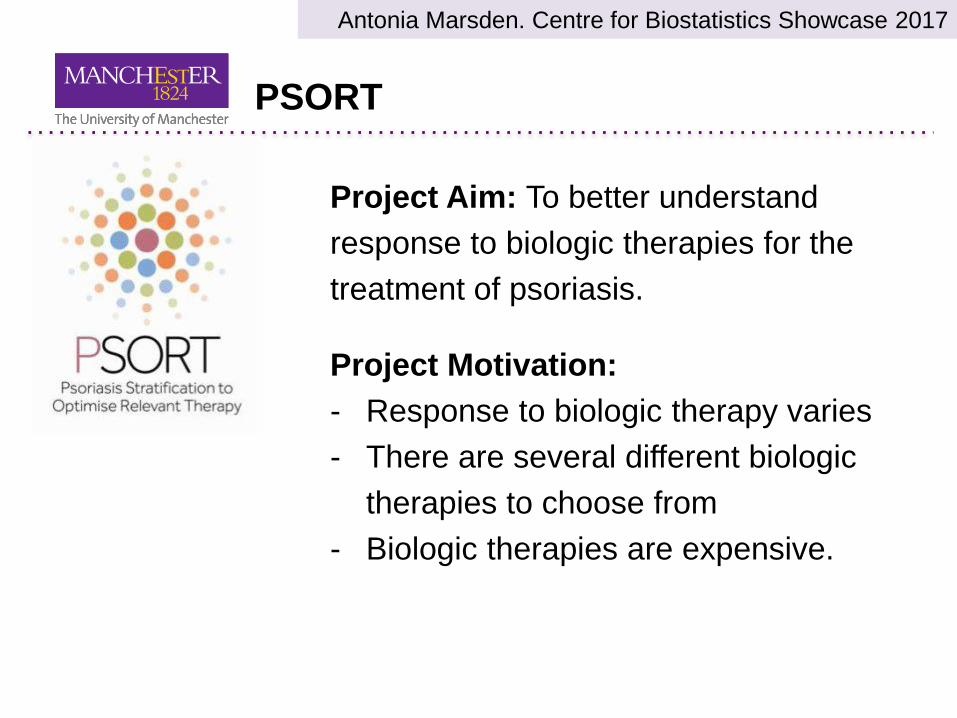
PSORT
Antonia Marsden. Centre for Biostatistics Showcase 2017 Antonia Marsden. Centre for Biostatistics Showcase 2017
Project Aim: To better understand
response to biologic therapies for the
treatment of psoriasis.
Project Motivation:
- Response to biologic therapy varies
- There are several different biologic
therapies to choose from
- Biologic therapies are expensive.
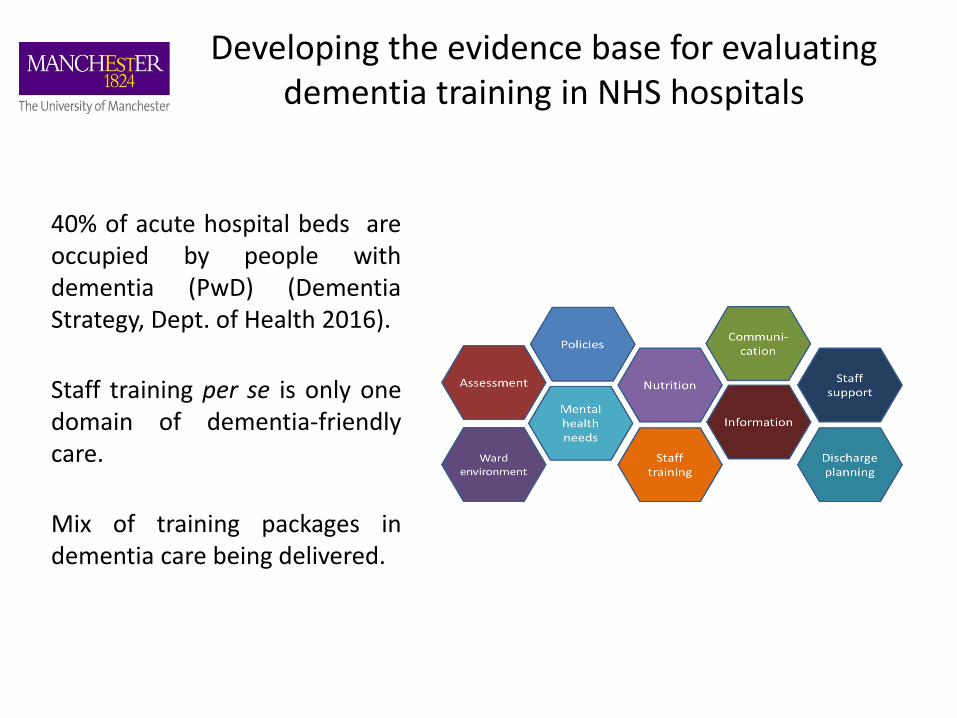
Developing the evidence base for evaluating dementia training in NHS hospitals
40% of acute hospital beds are occupied by people with dementia (PwD) (Dementia Strategy, Dept. of Health 2016).
Staff training per se is only one domain of dementia-friendly care.
Mix of training packages in dementia care being delivered.
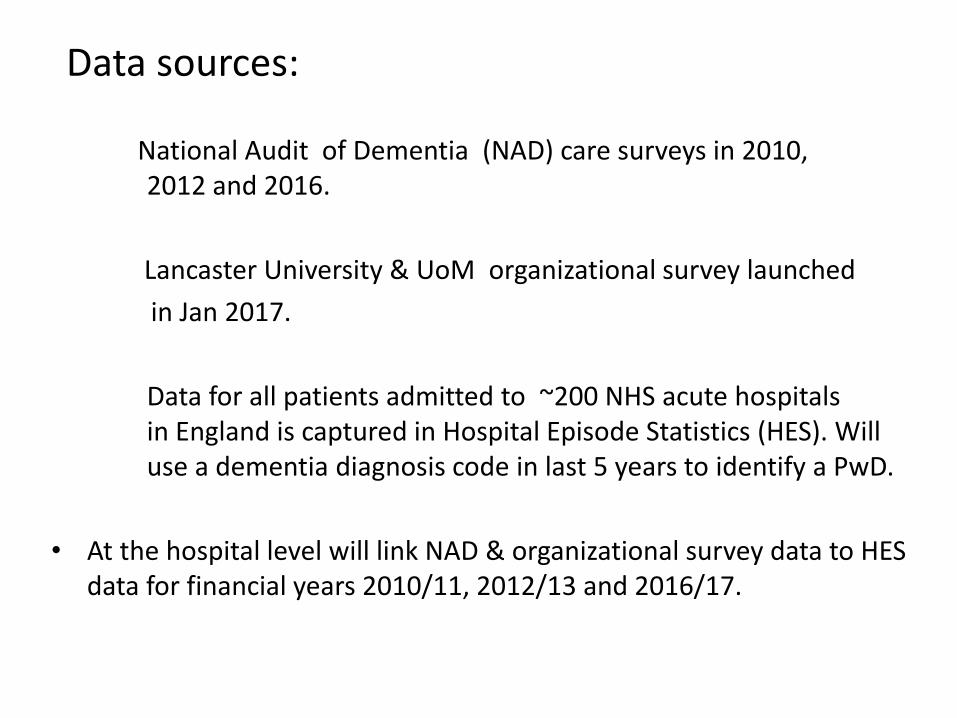
Data sources:
National Audit of Dementia (NAD) care surveys in 2010, 2012 and 2016.
Lancaster University & UoM organizational survey launched
in Jan 2017.
Data for all patients admitted to ~200 NHS acute hospitals in England is captured in Hospital Episode Statistics (HES). Will use a dementia diagnosis code in last 5 years to identify a PwD.
• At the hospital level will link NAD & organizational survey data to HES data for financial years 2010/11, 2012/13 and 2016/17.
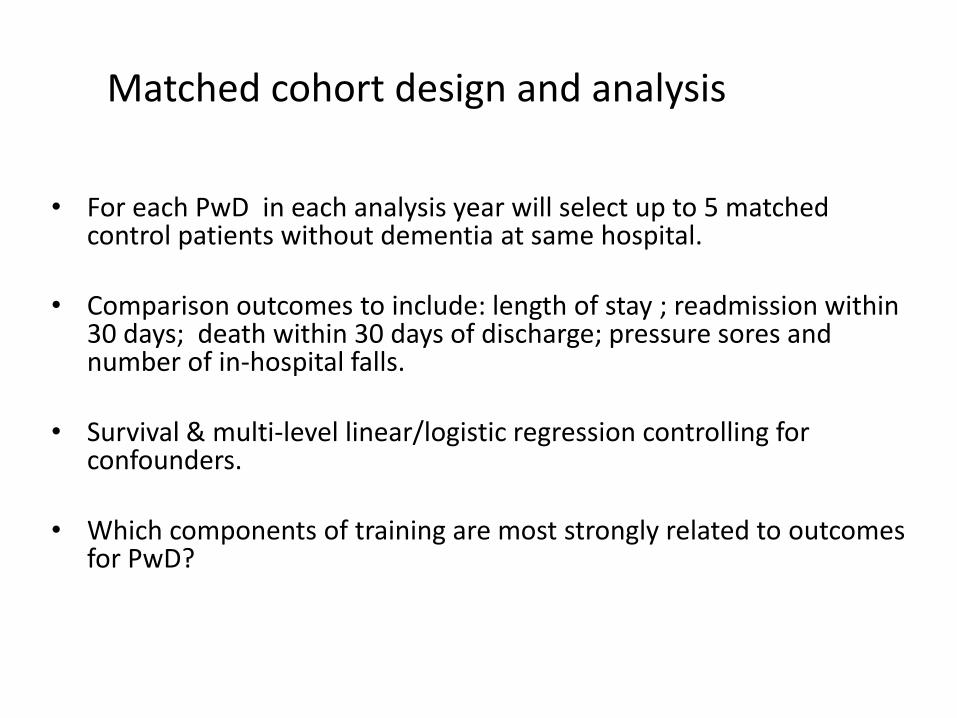
Matched cohort design and analysis
• For each PwD in each analysis year will select up to 5 matched
control patients without dementia at same hospital. • Comparison outcomes to include: length of stay ; readmission within
30 days; death within 30 days of discharge; pressure sores and number of in-hospital falls.
• Survival & multi-level linear/logistic regression controlling for
confounders. • Which components of training are most strongly related to outcomes
for PwD?

Stephen Pye
The Patient Frailty Informing Stratified Health Care (Pfish) study
Clinical Practice Research Datalink (CPRD)
• Previously known as General Practice Research Database (GPRD)
• Anonymised electronic GP health records
• Around 700 GP practices
• Over 15 million patients
• Representative of UK population
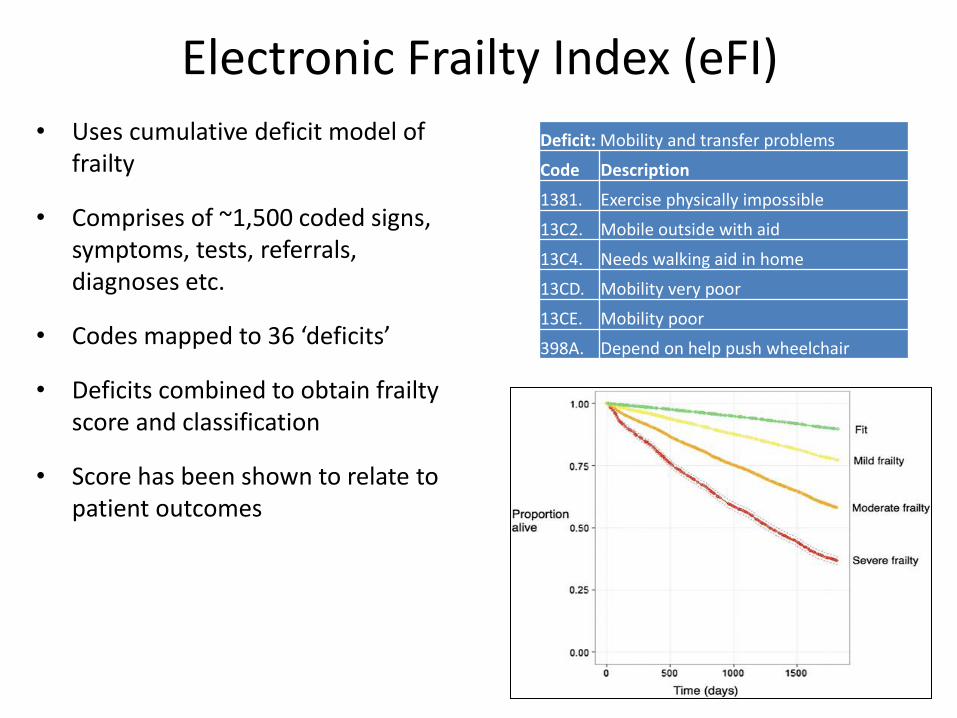
Electronic Frailty Index (eFI) • Uses cumulative deficit model of
frailty
• Comprises of ~1,500 coded signs, symptoms, tests, referrals, diagnoses etc.
• Codes mapped to 36 ‘deficits’
• Deficits combined to obtain frailty score and classification
• Score has been shown to relate to patient outcomes
Deficit: Mobility and transfer problems
Code Description
1381. Exercise physically impossible
13C2. Mobile outside with aid
13C4. Needs walking aid in home
13CD. Mobility very poor
13CE. Mobility poor
398A. Depend on help push wheelchair

Aims of Pfish
0
0.12
0.24
0.36
0.48
0.6
70 72 74 76 78 80
Frai
lty
sub
-do
mai
n s
core
s
Age (years)
Physical
Cognitive
Social
2. Multidimensional frailty – map deficits to sub-domains and test with factor analysis
3. Investigate epidemiology of frailty and individual patient trajectories
1. Refine measure – extra deficits (55), remove “odd” codes, allow signs to resolve
Sub-domains of the FI-CGA
eFI deficits Cognitive Mood Communication Mobility Balance Bowel Bladder Nutrition ADLs Social Comorbidity
Activity limitation
Anaemia and haematinic deficiency
Arthritis
Atrial fibrillation
Cerebrovascular disease
Chronic kidney disease
Diabetes
Dizziness
Dyspnoea
Falls
X
X X
X X X
X
X
X
X