Welcome to the 2014 Annual Results Conference€¦ · (noise, vibration, harshness) •...
30
Winterthur, March 5, 2015 Welcome to the 2014 Annual Results Conference
Transcript of Welcome to the 2014 Annual Results Conference€¦ · (noise, vibration, harshness) •...

Winterthur, March 5, 2015
Welcome to the 2014 Annual Results Conference

Agenda
1. Review of business year 2014 Martin Hirzel, CEO
2. Financial results 2014Martin Zwyssig, CFO
3. Outlook 2015Martin Hirzel, CEO

32014 Annual Results . March 5, 2015
Highlights 2014
Sales Financials Strategy
• Sales growth of 1.9% in local currencies
• Organic growth in three out of four Business Groups (BG)
• Loss of sales from the former Italian subsidiaryand devaluation of variouscurrencies impacted salesin Swiss francs
• EBITDA margin hit new record high with 10.3%
• EBIT margin increased to 6.9%
• Net profit multiplied
• RONA exceeded 20% mark
• Raised dividend payoutproposed
• Focus on profitable growth confirmed
• Selective acceptance of orders, successfully completed capacity adjustments and optimized structural costs led to new profitability level of BG Europe
• Favorable refinancing

42014 Annual Results . March 5, 2015
Strategic PrioritiesFocus on core competencies is key to success
Pursueconsolidationopportunities
Focus onacoustic & thermal
management solutions in automotive
Grow profitablyand generate free
cash flow
Practiceoperationalexcellence Leverage
technologicalleadership
Focus onlong-term
partnerships withglobal customers
High performance culture

52014 Annual Results . March 5, 2015
Focus on acoustics and thermal managementSolutions for future requirements
• Predevelopment studies with new innovation Hybrid-Acoustics led to corresponding order from European SUV manufacturer and Korean OEM in Europe
• Record in sales of measurement systemswhich are in use by OEMs and automobile suppliers worldwide
• Launch of new simulation software to predict and optimize vehicles’ NVH performance (noise, vibration, harshness)
• Introduction of engine encapsulation concept and RUS at first “AutoneumInnovation Days” for Chinese OEMs
Acoustics measurement
Alpha Cabin ll

62014 Annual Results . March 5, 2015
Grow profitablyBalanced customer base on global scale
Share in net sales 2014
• Existing broad global customer portfolio maintained
• Customer base comprising all majorOEMs worldwide
41%46%
7%6%
BG North AmericaBG Europe
BG SAMEABG
Asia
• First time higher sales in North America than in Europe
• Share of BG Asia increased to 7% of group net sales

72014 Annual Results . March 5, 2015
Focus on global customersExpansion of customer portfolio
• Set-up of Autoneum Korea to further develop partnerships with Korean OEMs on global production platforms
• New serial orders from two large Chinese OEMs
• Supply of British and US customers in China
• Follow-up orders for volume models of European OEMs secure capacity utilization in Europe
• Customer satisfaction reflected in numerous customer awards by international OEMs
GM Supplier Quality Excellence Award 2014 for Bloomsburg (USA) and London (Canada) plant
PSA Peugeot Citroën “Best plant” Award for Katowice (Poland) plant

82014 Annual Results . March 5, 2015
to be applied for:
• engineencapsulation
• engine top cover
• oil slump
Leverage technological leadershipInnovative technologies secure market leadership
• Innovation pipeline is well-filled with around 35 projects
• Product portfolio broadenedwith multifunctionalheatshields made of RIMIC
� protection against heat andnoise
• Market entry of eco-friendlyDi-Light technology forneedlepunch carpets
Interior Floor Engine BayUnderbody Body Treatment
Di-Light RUS+ Theta-FiberCell Autyl
Nero-AcousticsRIMICClean-Tuft
92014 Annual Results . March 5, 2015
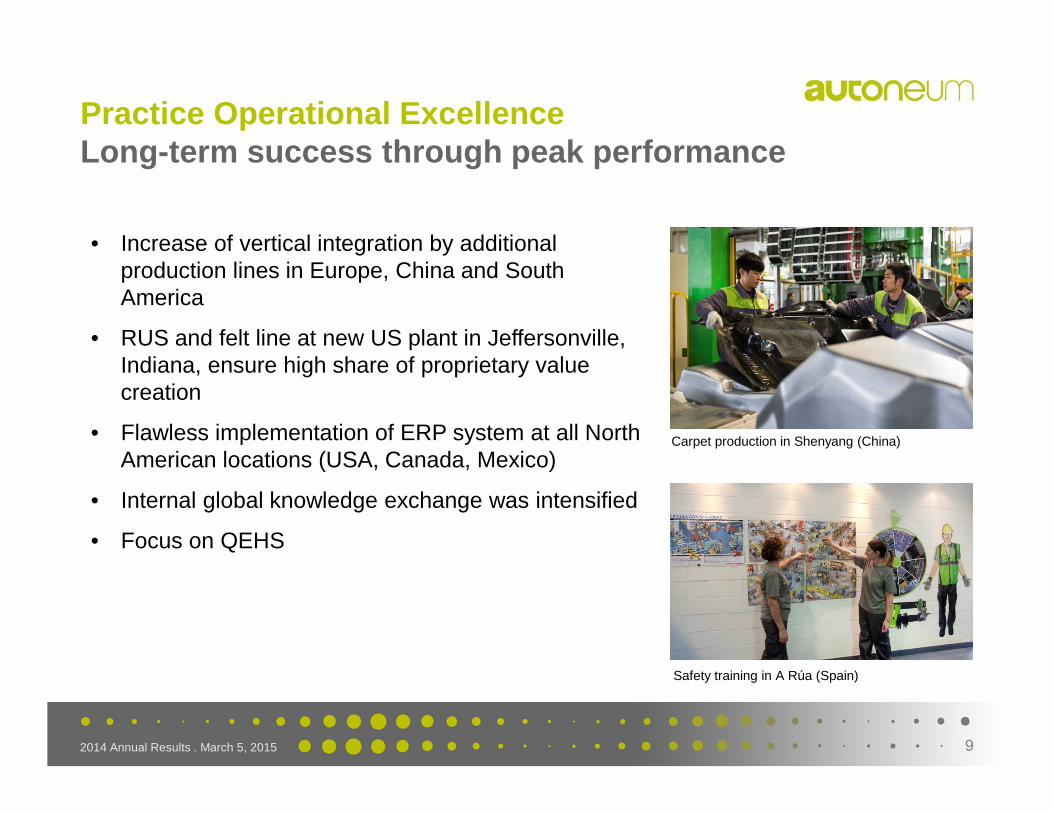
Practice Operational ExcellenceLong-term success through peak performance
• Increase of vertical integration by additional production lines in Europe, China and South America
• RUS and felt line at new US plant in Jeffersonville, Indiana, ensure high share of proprietary valuecreation
• Flawless implementation of ERP system at all North American locations (USA, Canada, Mexico)
• Internal global knowledge exchange was intensified
• Focus on QEHS
Carpet production in Shenyang (China)
Safety training in A Rúa (Spain)

102014 Annual Results . March 5, 2015
High Performance CultureAssuming social responsibility
• Launch of internal “Social Engagement Award” as first global CSR activity:
� financial support of development project “Casa Guatemala Children’s Village”
• First Global Employee Satisfaction Survey carried out in 2014:
� general satisfaction of employees confirms focus on company culture based on corporate values
� survey serves as basis for activeemployee dialogue

Agenda
1. Review of business year 2014 Martin Hirzel, CEO
2. Financial results 2014Martin Zwyssig, CFO
3. Outlook 2015Martin Hirzel, CEO

122014 Annual Results . March 5, 2015
Net profitNet profit multiplied
CHF million 2014 2013
Net sales 1’954.7 2’053.3
Earnings before interest and taxes (EBIT) 135.1 79.2
Financial result -15.0 -14.7
Taxes -17.3 -28.3
Net profit 102.8 36.2
Net profit attributable to AUTN 78.9 14.5
Net profit attributable to NCI 23.9 21.7
Earnings per share (EPS) in CHF 17.03 3.12
132014 Annual Results . March 5, 2015
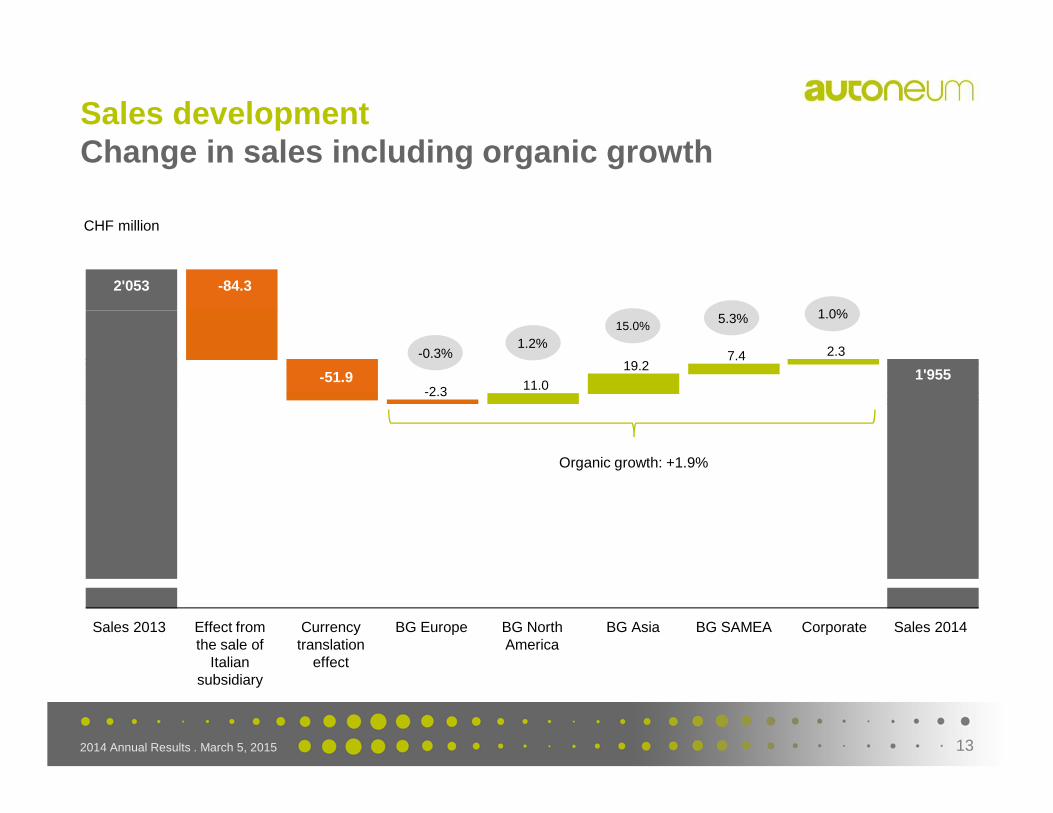
Sales developmentChange in sales including organic growth
Organic growth: +1.9%
CHF million
Sales 2013 Effect from the sale of
Italian subsidiary
Currency translation
effect
BG Europe BG North America
BG Asia BG SAMEA Corporate Sales 2014
-0.3%1.2%
15.0%5.3% 1.0%
1'955-51.9
-84.3
-2.3
2'053
11.0
2.37.419.2

142014 Annual Results . March 5, 2015
Operating result (EBIT)EBIT margin hit a new record high
• EBIT margin improved to 6.9% of net sales
• All BGs with positive EBIT
• Enhancement of capacity utilization at plants in Europe due to successfully implemented capacity adjustments
• Expansion of vertical integration through in-house production of basic materials
• Higher production volumes in Asia2011 2012 2013 2014
Margin6.9%
CHF million
135.1117.4
34.9
77.3
Margin4.0%
Margin2.1%
Margin5.7%

152014 Annual Results . March 5, 2015
EBITDAEBITDA margin exceeded 10% mark
EBITDA 2013
EBITDA 2014• EBITDA raised by 17.3 to
201.6 million CHF
• EBITDA margin (10.3%) atnew record high
• BG Europe exceeded an important financial mid-term target with an EBITDA margin of 8.3%
Autoneum Group BG Europe BG North America BG SAMEABG Asia
CHF million
Margin10.3%
201.6184.3
67.4
46.9
100.1107.2
27.022.46.3 4.8
Margin8.3%
Margin11.3%
Margin18.6%
Margin3.9%

162014 Annual Results . March 5, 2015
TaxesTax rate significantly decreased
• Tax rate significantly decreased from 43.9% to 14.4%
• Reduction mainly due to successful restructuring of subsidiaries which enabled recognition of loss carry-forwards
• Sustainable tax rate at28-30%
Income taxes in % of profit before taxes
0
20
40
60
80
100
14.4%
43.9%45.9%
81.7%
2013 2011 2012 2014

172014 Annual Results . March 5, 2015
Balance sheetEquity ratio further improved
CHF million 2014 2013
Total assets 1’099.3 990.6
Non-current assets 536.2 440.7
Cash and cash equivalents 140.9 117.9
Net debt 53.9 75.0
Short-term financial liabilities 61.0 48.6
Long-term financial liabilities 134.6 138.0
Subordinated shareholder loans 0.0 25.0
Shareholders’ equity 392.5 302.0
in % of total assets 35.7 33.0
• Solid balance sheet without goodwill
• Net debt decreased from 75.0 to 53.9 million CHF
• Cash position amounted to 140.9 million CHF by the end of 2014
• Equity ratio improved from 33.0% to 35.7%

182014 Annual Results . March 5, 2015
Net debtContinuous reduction of net debt since 2011
CHF million • Net debt declined to 53.9 million CHF (2013: 75.0 million CHF)
• Since 2011, net debt decreased by more than 100 million CHF
• Gearing amounted to 13.7%
154.8
53.975.0
123.0
0
40
80
120
160
200
2014201320122011

192014 Annual Results . March 5, 2015
RONARONA exceeded 20% mark
• RONA remarkablyincreased by 10 percentagepoints to 20.3%
• RONA more than twice ashigh as WACC
• Higher RONA due toimproved earnings
In %
8.7% WACC
10.0
20.3
10.3
0
2
4
6
8
10
12
14
16
18
20
22
2012 20142013

202014 Annual Results . March 5, 2015
Cash flowsHigh investments and positive cash flow
• Higher net profit boosts cash flow
• Operating net working capital was kept at low prior-year level which resulted in an operating cash flow of 138.2 million CHF
• Sharp increase in investments led to a free cash flow of 29.5 million CHF
CHF million 2014 2013
Net cash flow from operating activities 138.2 165.7
Net cash flow from investing activities -108.8 -98.6
Free cash flow 29.5 67.1
Net cash flow from financing activities -15.0 -20.7
Cash and cash equivalents at Dec. 31 140.9 117.9

212014 Annual Results . March 5, 2015
Dividend payoutSignificant increase of dividend proposed
2014 2013
Net profit in million CHF 102.8 36.2
Attributable to shareholders ofAutoneum Holding Ltd in million CHF
78.9 14.5
Earnings per share (EPS) in CHF 17.03 3.12
Dividend per share in CHF 4.50 1.30
• Dividend proposal of4.50 CHF per share
• Pay-out ratio is 26.4%, dividend yield at 2.7%
• Distribution from thereserve from paid-in capital

Agenda
1. Review of business year 2014 Martin Hirzel, CEO
2. Financial results 2014Martin Zwyssig, CFO
3. Outlook 2015Martin Hirzel, CEO

232014 Annual Results . March 5, 2015
Growing demand for Autoneum’s productsGlobal trends drive acoustic & thermal management
Acoustic treatment fordownsized engines
Demand for lightweight and noise reducing
products
Growing automobile production
(mainly Asia)
Increasing globalization
Global CAGR of 4% to reach100 million LVs* mark by 2018
More engine bay and underbody products required
Need for innovative suppliers to cope with newpowertrain concepts
80-90% of LVs will be madeon global platforms
*light vehicles

242014 Annual Results . March 5, 2015
Key focus areas for growthGrowth strategy by product line
• Gain market share through roll-out of innovations
• Expand vertical integration in all regions
• Migrate further customers to lightweight constructions
• Increase business in growing underbody market
• Offer full underbody product range (underbody shields, heatshields and wheelarch outerliners)
• Establish RUS as global underbody technology (incl. Asia)
• Extend engine encapsulation business with competitive technologies
• Push market penetration of engine encapsulation concept
• Offer both engine- and body-mounted engine bay treatments
Interior Floor Underbody Engine BayProduct examples:
• Carpets
• Inner Dashes
• Floor Insulators
Product examples:
• Underbody Shields
• Heatshields
• Wheelhouse
Product examples:
• Engine Covers
• Hoodliners
• Outer Dashes

252014 Annual Results . March 5, 2015
Key focus areas for growthRegional action plans
Expand
Fix
Transform
Grow
• Participation in Mexican growth
• Roll-out underbody systems
• Prepare for next growth phase
• Operational excellence at new relocatedBrazil plant
• Innovation roll-out
• Market share gains
Annual sales growth up to 20% by:
• New customers
• Roll-out underbody & carpetsystems
262014 Annual Results . March 5, 2015
Targets 2020Accelerate profitable growth
• Net sales of 2'600 million CHF
• Emerging markets: > 20% share in group’s netsales
• EBITDA margin of 12%
• Equity ratio > 40%
• RONA > 20%
• Target dividend payout of at least 30% of net result attributable to Autoneum shareholders

272014 Annual Results . March 5, 2015
Guidance2015
Global environment
Profitability
Sales
• Subdued increase in global automobile production to around 90 million light vehicles expected in 2015 (growth rate of 2.4%)*
• Net sales growth of 4-5% in local currencies in line with the financial mid-term targets
• Appreciation of Swiss franc will lead to slightly decreasednet sales consolidated in Swiss francs
• Further increased operating margin despitenegative currency effects expected
*according to IHS estimates

282014 Annual Results . March 5, 2015
Autoneum. Mastering sound and heat.

292014 Annual Results . March 5, 2015
Contacts and event calendar
Investors Media Contact address
Dr. Martin ZwyssigCFO T +41 (0)52 244 82 82 [email protected]
Dr. Anahid RickmannHead Corporate CommunicationsT +41 (0)52 244 83 [email protected]
Autoneum Holding AGSchlosstalstrasse 43 / P.O. BoxCH-8406 Winterthurwww.autoneum.com
Important dates 2015
Annual General Meeting March 26, 2015
Semi-Annual Results July 22, 2015
Autoneum listed on SIX Swiss Exchange
Valor SymbolValor NumberISIN
AUTN12748036CH0127480363

302014 Annual Results . March 5, 2015
Disclaimer
Autoneum is making great efforts to include accurate and up-to-date information in this document, however
we make no representations or warranties, expressed or implied, as to the accuracy or completeness of the
information provided in this document and we disclaim any liability whatsoever for the use of it.
The information provided in this document is not intended nor may be construed as an offer or solicitation
for the purchase or disposal, trading or any transaction in any Autoneum securities. Investors must not rely
on this information for investment decisions.
All statements in this report which do not reflect historical facts are statements related to the future which
offer no guarantee with regard to future performance; they are subject to risks and uncertainties including,
but not limited to, future global economic conditions, exchange rates, legal provisions, market conditions,
activities by competitors and other factors outside the company's control. The vehicle production figures for
2014 and forward looking are based on the latest estimates of IHS Global Insight.
© 2015 Autoneum Holding Ltd, All rights reserved