Welcome to our new PowerPoint template · Effect of partial demerger Changes in loans and other...
76
Ahlstrom Investor presentation August, 2013
-
Upload
phungquynh -
Category
Documents
-
view
213 -
download
0
Transcript of Welcome to our new PowerPoint template · Effect of partial demerger Changes in loans and other...

Ahlstrom Investor presentation
August, 2013

Contents
– Ahlstrom in brief
– Q2/2012 summary and outlook
– Business area financials
– Strategic themes and execution
– Combination of Label and Processing and Munksjö AB
– Long-term financial targets and dividend policy
– Global sourcing
– Sustainability
– Key financials 2008-2012
8/9/2013 © 2012 Ahlstrom Corporation Page 2

Ahlstrom today
– High performance fiber-based materials company
– Approximately 3,800 employees in 28 countries on six continents
– Net sales EUR 1 billion in 2012 (continuing operations)
– Founded in 1851, constantly moving forward
– Listed on the NASDAQ OMX Helsinki since 2006
8/9/2013 © 2012 Ahlstrom Corporation Page 3
Our offering: products with purpose
Protect
Purify
Provide surface & structure
High performance fiber-based materials that enable the required functionality
and sustainability of our customers’ products
Products for
• Medical drapes and
gowns
• Sterile Barrier Systems
(sterilization wraps)
• Face masks
• Food and beverages
packaging
• Medical tape
• Substrates for masking
tapes
Products for
• Oil and fuel filtration
• Air and water filtration
• Gas turbine and life
science filtration
Products for
• Wallcoverings
• Floorings
• Building panels
• Wind turbine blades and
boat hulls
8/9/2013 © 2012 Ahlstrom Corporation Page 4

8/9/2013 © 2012 Ahlstrom Corporation Page 5
Business areas
Building and Energy is one of the leading players globally for materials
used in wall coverings, floorings and windmill blades
Food and Medical is one of the leading players globally for materials
used in teabags, food packaging, masking tape and
medical gowns and drapes
Transportation Filtration is the global leader in transportation filtration
materials
Advanced Filtration is a global supplier of air and liquid filtration
materials, with a leading market position in Life
Science and Gas Turbine filtration.

Creating value 1. Primary production
– Natural fibers: wood, cotton, hemp
– Oil and petrochemicals
2. Raw material supplier – Pulp producers
– Synthetic fiber producers (PET, PP, glass)
– Chemical suppliers
5. Marketer / seller – World class consumer
or industrial brands
6. Consumers
3. Ahlstrom – Other roll goods producers
4. Converters and industrial customers – Healthcare and consumer goods suppliers
– Transportation industry suppliers
– Air and liquid filter manufacturers
– Packaging industry
– Wallcover printers and designers
8/9/2013 © 2012 Ahlstrom Corporation Page 6

Page
North America
307.5 EUR million (19%)*
5 Plants
4 Sales offices
Europe
861.8 EUR million (54%)*
22 Plants
11 Sales offices
South America
204.6 EUR million (13%)*
3 Plants
2 Sales offices
Rest of the world
31.3 EUR million (2%)*
3 Sales offices
Asia-Pacific
193.5 EUR million (12%)*
4 Plants
15 Sales offices
Making and marketing globally (Net sales figures include discontinued operations in 2012)*
8/9/2013 © 2012 Ahlstrom Corporation 7

Major acquisitions and divestments
1980s 1990s 2010s 2000s
Focus on specialty
papers, filtration
‒ Acquisition of
Filtration Sciences
Inc. in the USA
(1989)
Move to nonwovens
‒ Acquisition of
Sibille-Dalle in
France (1996)
Expand and focus on nonwovens
and specialty papers
Key acquisitions:
‒ Dexter’s nonwoven fabrics
production in the USA (2000)
‒ Orlandi’s spunlace production in
Italy (2007)
‒ Fiberweb’s consumer wipes
business in Italy, Spain, USA
(2007)
‒ Fabriano Filter Media in Italy
(2007)
‒ Friend Group, manufacturer of
vegetable parchment in the USA
(2008)
More focused business portfolio and
expansion in Asia
‒ Acquisition of a filtration plant in China
(2010)
‒ Joint venture in medical papers and
masking tape substrates in China
(2010)
‒ Acquisition of a 49.5% stake in Porous
Power Technologies, LLC (2011)
‒ Acquisition of Munktell Filter AB
(2012)
Key divestments and exits:
‒ Ahlstrom machinery (2000)
‒ Ahlstrom Pumps (2000)
‒ Ahlstrom Electronics (2000)
‒ Åkerlund & Rausing Carton
(2000) and flexible packaging
(2001)
‒ Kamtech (2002)
‒ Alcore cores and board
(2004-2006)
8/9/2013 © 2012 Ahlstrom Corporation Page 8
Key divestments and exits:
‒ Exit from dust and air filtration
materials, sealing & shielding
papers (2010)
‒ Divestment of Home and
Personal -business area
(2011)
‒ Demerger of Label and
Processing business (2013)
Key divestments and exits:
‒ Exit from publication
papers (1987)

Q2/2013 Summary & Outlook

Ahlstrom adopted new IFRS standard
09/08/2013 © 2012 Ahlstrom Corporation Page 10
EUR million
Reported
2012 Adjustment
Restated
2012
Operating profit* 18.6 3.1 21.7
Net financial expenses -17.3 -2.2 -19.4
Profit / Loss for the period* -15.9 0.7 -15.2
Total equity 543.9 -58.8 485.1
Employee benefit obligations 44.4 36.2 80.6
Gearing ratio, % 55.8 6.7 62.5
– The adoption of the revised IAS 19 Employee Benefits standard results in higher
operating profit, higher pension liability and lower pension assets and reduced
equity in the Group's financial figures for 2012
*Continuing operations

April-June 2013 in brief
© 2012 Ahlstrom Corporation Page 11
Highlights
– Net sales and profitability improved slightly
– Advanced Filtration and integration of Munktell
– Higher selling prices and improved product mix
– LP Europe demerger completed, Coated Specialties in Brazil expected to be
completed during H2/2013
Lowlights
– Volatile demand in North America
– Higher indirect and administration costs
– Focus units at Food and Medical
– Higher gearing ratio due to demerger effects
8/9/2013

Q2/2013 key figures
8/9/2013 © 2012 Ahlstrom Corporation Page 12
EUR million Q2/2013 Q2/2012
Change,
%
Q1-Q2/
2013
Q1-Q2/
2012
Change,
%
Net sales 265.0 261.6 1.3 520.3 521.9 -0.3
Operating profit excl. NRI 7.9 7.4 6.3 14.4 17.9 -19.9
% of net sales 3.0 2.8 2.8 3.4
Gearing* 83.7 56.4 83.7 56.4
ROCE, % 1.0 1.5 3.2 3.8
*Including discontinued operations

8/9/2013 © 2012 Ahlstrom Corporation Page 13
Quarterly net sales development
264.4 266.6 251.9 242.8
260.3 261.6 248.8 240.1 255.3 265.0
0
25
50
75
100
125
150
175
200
225
250
275
300
325
350
Q1/11 Q2/11 Q3/11 Q4/11 Q1/12 Q2/12 Q3/12 Q4/12 Q1/13 Q2/13
EUR million
1.3%
Highlights
– Higher selling prices
– Favorable product mix
Lowlights
– Adverse currency effect
– Sales in North America

Quarterly operating profit development
10.5
7.4 7.3
-4.1
6.5
7.9
-3,0 %
-2,0 %
-1,0 %
0,0 %
1,0 %
2,0 %
3,0 %
4,0 %
5,0 %
6,0 %
7,0 %
-6
-4
-2
0
2
4
6
8
10
12
14
Q1/12 Q2/12 Q3/12 Q4/12 Q1/13 Q2/13
EUR million Operating profit excl. NRI % of net sales
Highlights
‒ Pricing management
Lowlights
‒ Higher indirect production
and administration costs,
mainly related to new units
8/9/2013 © 2012 Ahlstrom Corporation Page 14
2012 figures restated
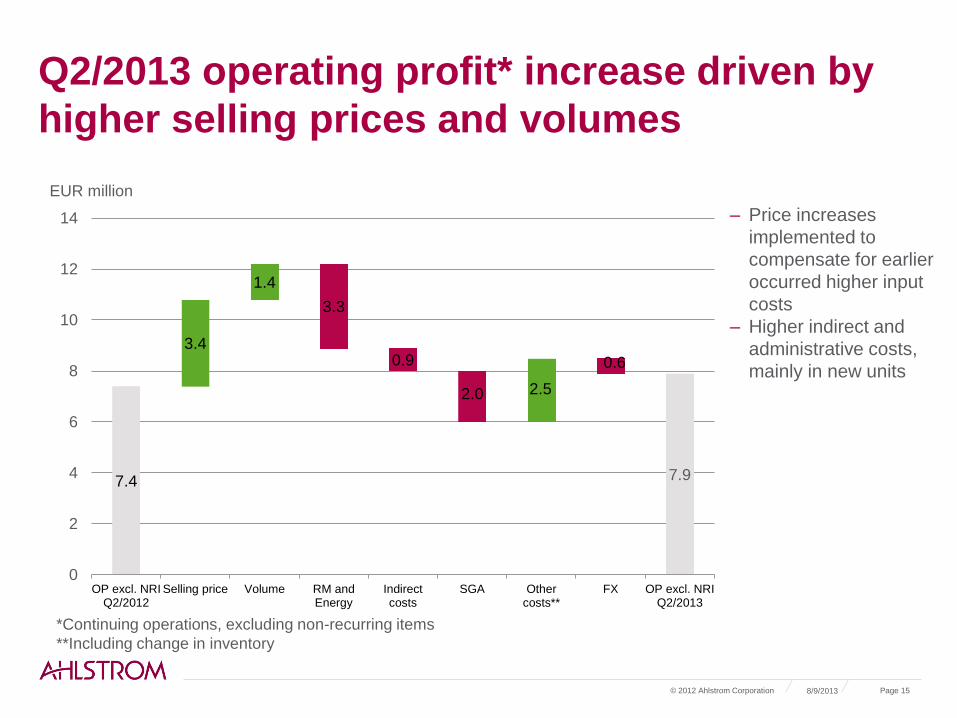
Q2/2013 operating profit* increase driven by
higher selling prices and volumes
8/9/2013 © 2012 Ahlstrom Corporation Page 15
7.4 7.9
3.4
1.4
3.3
0.9
2.0 2.5
0.6
0
2
4
6
8
10
12
14
OP excl. NRIQ2/2012
Selling price Volume RM andEnergy
Indirectcosts
SGA Othercosts**
FX OP excl. NRIQ2/2013
EUR million
*Continuing operations, excluding non-recurring items
**Including change in inventory
– Price increases
implemented to
compensate for earlier
occurred higher input
costs
– Higher indirect and
administrative costs,
mainly in new units

8/9/2013
Quarterly net cash from operating activities (including discontinued operations)
18.5
27.6 26.7
10.9 14.6
27.5
21.2
15.5
-21.4
35.5
-25
-20
-15
-10
-5
0
5
10
15
20
25
30
35
40
Q1/11 Q2/11 Q3/11 Q4/11 Q1/12 Q2/12 Q3/12 Q4/12 Q1/13 Q2/13
© 2012 Ahlstrom Corporation Page 16
– Cash flow increased
due to the release of
operative working
capital
EUR
million

8/9/2013 © 2012 Ahlstrom Corporation Page 17
Development of operative working capital (including discontinued operations)
230.7
194.3
176.7 179.1 171.8 169.9 169.3
198.3
155.5
20
25
30
35
40
45
50
55
100
125
150
175
200
225
250
275
Q1/10 Q4/10 Q4/11 Q1/12 Q2/12 Q3/12 Q4/12 Q1/13 Q2/13
Days EUR million
Operative working capital* Turnover rate in days
– Operative working capital
released due to LP Europe
demerger
– Turnover rate was 39 days
on June 30, 2013 (41 days
on Dec. 31, 2012)
*Operative working capital = Accounts receivables + inventories – accounts payable

8/9/2013 © 2012 Ahlstrom Corporation Page 18
Gearing ratio (including discontinued operations)
– Lower net debt due to the completion
of LP Europe demerger
– Gearing ratio affected by:
– EUR 30.9 million net of tax
impairment loss and costs to
sell related to the Coated
Specialties demerger
– EUR 67.6 million recognition of
Coated Specialties distribution
liability
– Fair valuation of Munksjö Oyj
shares causing EUR 28.6
million write-down
– Gearing ratio was 83.7% on June 30,
2013
– Ahlstrom has an option to repay its
EUR 80 million hybrid bond in
November, 2013
– The company is exploring
refinancing options
375.9
330.1
237.8
241.2
290.2 279.8
303.4
348.9
294.5
0%
10%
20%
30%
40%
50%
60%
70%
80%
90%
100%
150
175
200
225
250
275
300
325
350
375
400
Q1/10 Q4/10 Q4/11 Q1/12 Q2/12 Q3/12 Q4/12 Q1/13 Q2/13
EUR million
Interest bearing net liabilities Gearing ratio, %
Gearing ratio:
target range 50–80%
Gearing

Balance sheet
8/9/2013 © 2012 Ahlstrom Corporation Page 19
June 30, 2013 Dec. 31, 2012
EUR million
Total non-current assets
Inventories
Trade and other receivables
Other short-term receivables
Cash and cash equivalents
Assets classified as held for sale and
distribution to owners
Total assets
Total equity
Provisions
Interest bearing loans and borrowings
Employee benefit obligations
Trade and other payables
Others
Liabilities classified as held for sale and
distribution to owners
Total equity and liabilities
634.9
121.5
177.0
0.7
72.1
151.8
1,157.9
351.7
9.2
367.6
71.3
280.5
22.4
55.3
1,157.9
575.4
112.4
157.4
0.6
53.4
448.3
1,347.5
485.1
9.2
357.7
81.4
196.2
19.8
197.9
1,347.5
Gearing ratio
83.7
62.5
Demerger effect of Label and
Processing. Includes EUR 80
million hybrid bond.
Gearing ratio higher due to
impairment loss and recognition
of Coated Specialties distribution
liability and fair valuation of
Munksjö Oyj shares.
Coated Specialties, Brazilian
part of Home and Personal,
production lines to be divested
Coated Specialties, Brazilian
part of Home and Personal,
production lines to be divested
2012 figures are restated
Market value of shareholding in
Munksjö Oyj EUR 49.9 million
and Suominen Oyj EUR 35.3
million
EUR 67.6 million recognition of
Coated Specialties distribution
liability

Statement of cash flows (including discontinued operations)
8/9/2013 © 2012 Ahlstrom Corporation Page 20
Q2/2013 Q2/2012
EUR million
EBITDA
Adjustments
Changes in net working capital
Financial items
Income taxes paid / received
Net cash from operating activities
Acquisition of Group companies
Purchases of intangible and tangible assets
Other investing activities
Net cash from investing activities
Dividends paid and other
Effect of partial demerger
Changes in loans and other financing activities
Net cash from financing activities
Net change in cash and cash equivalents
Cash and cash equivalents at the beginning of the
period
Cash and cash equivalents at the end of the period
20.8
-1.4
19.9
-2.7
-1.2
35.5
-1.4
-23.5
-77.0
-102.0
-29.1
146.5
-18.8
98.6
32.2
43.1
73.1
28.4
-1.8
8.3
-5.5
-2.0
27.5
-20.8
7.2
-13.7
-60.0
6.6
-53.4
-39.6
88.2
48.8
Wallcovering materials in
Binzhou, China,
Filtration materials investment
in Turin, Italy
Operative working capital
released due to the LP
Europe demerger
2012 figures are restated
EUR 78.5 million equity
contribution to Munksjö Oyj
Debt transfer related to LP
Europe demerger
– Target to reach annual costs savings of EUR 35 million by the end of 2014
• Includes earlier announced EUR 15 million cost savings measures, of which approximately EUR 10
million relate to costs being transferred to Munksjö Oyj
• Net effect approximately EUR 25 million
– Key actions:
• Completion of demerger related transfers
• Reduction of selling, general and administration (SGA) costs
• Optimization and productivity improvements in the supply chain
– Personnel reductions of about 350 globally
– Completion of key development programs will increase efficiency and enable cost savings
– Ahlstrom to book non-recurring items of approximately EUR 15 million in 2013-14
8/9/2013 © 2012 Ahlstrom Corporation Page 21
Rightsizing program

Outlook for 2013
© 2012 Ahlstrom Corporation Page 22
‒ Net sales from continuing operations are expected to be EUR 980-
1,140 million
‒ Operating profit margin excluding non-recurring items from continuing
operations is expected to be 2-5% of net sales
‒ Investments excluding acquisitions are estimated to amount to
approximately EUR 75 million
8/9/2013

–8/9/2013 –© 2011 Ahlstrom Corporation –Page 23
Focus on growth in 2013
New products
Bringing new products
successfully to the market
Sales growth
Good growth with key accounts
already in 2012
Increase sales to smaller customers
Create new business opportunities
with existing and new customers
Increase flexibility and
responsiveness to smaller
customers

Business area review

Advanced Filtration
© 2012 Ahlstrom Corporation Page 25 8/9/2013
is a global supplier of air and liquid
filtration materials, with a leading market
position in Life Science and Gas
Turbine filtration.
Main competitors: GE Whatman, Lydall
EUR million Q2/2013 Q2/2012
Change, %
Q1-Q2/2013
Q1-Q2/2012
Change, %
Net sales 26.2 18.9 39.1 50.5 37.4 34.9
Operating profit 3.7 2.9 27.4 6.8 5.6 22.7
% of net sales 14.0 15.2 13.5 14.9
Operating profit excl. NRI 3.7 2.9 27.4 6.8 5.6 22.7
% of net sales 14.0 15.2 13.5 14.9
RONA, % 29.6 39.4 27.9 38.6
Sales volumes, 000s tons 4.3 3.4 26.8 8.3 6.8 21.8

Building and Energy
© 2012 Ahlstrom Corporation Page 26 8/9/2013
Main competitors: OCV, Saertex,
Dresden Papier, MetsaBoard,
Freudenberg, Johns Manville
is one of the leading players globally for
materials used in wall coverings,
floorings and windmill blades
EUR million Q2/2013 Q2/2012
Change, %
Q1-Q2/2013
Q1-Q2/2012
Change, %
Net sales 71.0 72.4 -1.9 144.4 150.7 -4.1
Operating profit 1.6 2.2 -28.6 4.0 5.6 -28.1
% of net sales 2.2 3.1 2.8 3.7
Operating profit excl. NRI 1.6 2.2 -26.8 4.1 5.7 -27.8
% of net sales 2.3 3.1 2.8 3.8
RONA, % 6.7 9.2 9.1 11.8
Sales volumes, 000s tons 37.9 38.2 -0.7 77.2 79.0 -2.3

Food and Medical
© 2012 Ahlstrom Corporation Page 27 8/9/2013
is one of the leading players globally for
materials used in teabags, food
packaging, masking tape and medical
gowns and drapes
Main competitors: PGI, Glatfelter,
Wausau, Purico, MetsäTissue
EUR million Q2/2013 Q2/2012
Change, %
Q1-Q2/2013
Q1-Q2/2012
Change, %
Net sales 88.7 89.4 -0.8 173.4 178.4 -2.8
Operating profit 1.5 1.1 29.8 1.5 3.6 -58.5
% of net sales 1.7 1.3 0.9 2.0
Operating profit excl. NRI 1.7 1.6 5.1 2.5 4.0 -38.4
% of net sales 1.9 1.8 1.4 2.3
RONA, % 3.2 2.4 1.6 3.7
Sales volumes, 000s tons 29.6 29.1 1.7 57.8 59.1 -2.3

Transportation filtration
© 2012 Ahlstrom Corporation Page 28 8/9/2013
is the global leader in transportation
filtration materials
Main competitors: Hollingsworth &
Vose, Neenah Paper
EUR million Q2/2013 Q2/2012
Change, %
Q1-Q2/2013
Q1-Q2/2012
Change, %
Net sales 81.0 77.4 4.6 155.6 149.0 4.5
Operating profit 4.6 0.2 8.7 3.6 141.8
% of net sales 5.6 0.2 5.6 2.4
Operating profit excl. NRI 4.6 4.0 14.7 8.7 7.7 13.5
% of net sales 5.6 5.1 5.6 5.2
RONA, % 11.9 0.5 11.9 5.1
Sales volumes, 000s tons 28.8 27.8 3.3 55.5 53.9 2.8

Strategic themes and execution

Growth
from
established
platform
8/9/2013 © 2012 Ahlstrom Corporation 30
Ahlstrom’s strategic path 2009-2013
2009 2010 2011 2012
Cost structure
Balance sheet
Customer driven focus –
Global key accounts and regional customers
Technology driven
product innovation
Divestments: sealing & shielding, dust filtration,
Home and Personal business area
Demerger of Label and Processing business
Common processes, enhancement of capabilites
Strategy
review and
execution
Crisis
management
One Ahlstrom –
integrated company
2013–2020

Ahlstrom products match global megatrends
Environmental awareness
Resource scarcity
Demographics and urbanization
More with less: Increased demand
for cleaner water and water cleaning
solutions, renewable energy and
substitute materials.
The need for cleaner air calls for
more environmentally friendly
transportation, energy production
and distribution
Increased demand for safe food
production and packaging,
single-use medical materials and
equipment and functional
materials for construction
Sustainability
as the key
driver
Ahlstrom’s products
8/9/2013 © 2012 Ahlstrom Corporation Page 31
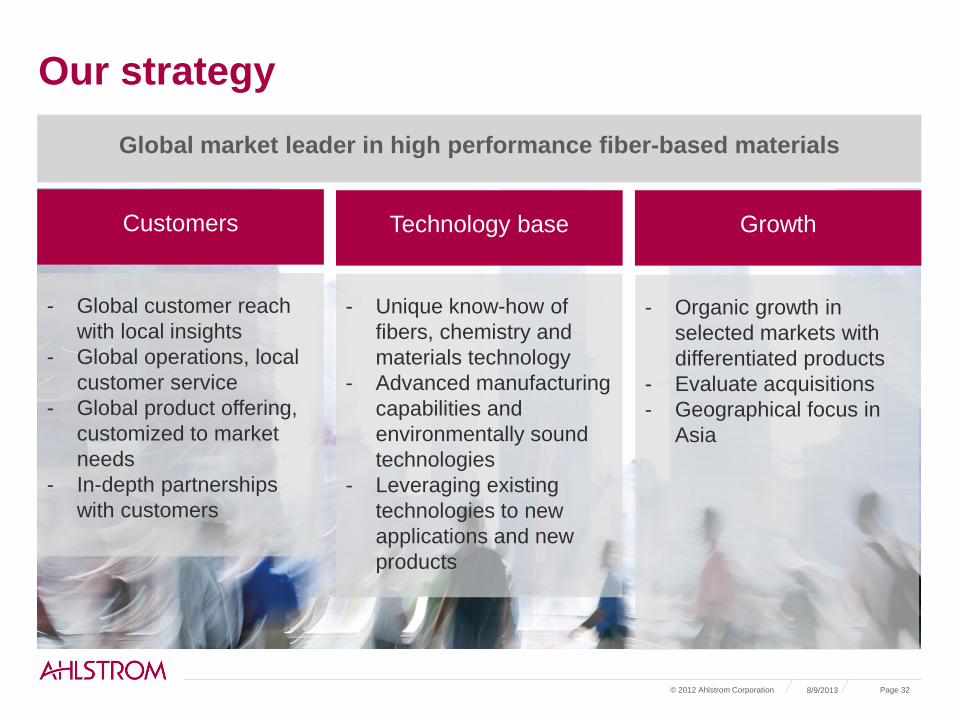
Our strategy
Global market leader in high performance fiber-based materials
Customers
Technology base
- Unique know-how of
fibers, chemistry and
materials technology
- Advanced manufacturing
capabilities and
environmentally sound
technologies
- Leveraging existing
technologies to new
applications and new
products
- Global customer reach
with local insights
- Global operations, local
customer service
- Global product offering,
customized to market
needs
- In-depth partnerships
with customers
Growth
- Organic growth in
selected markets with
differentiated products
- Evaluate acquisitions
- Geographical focus in
Asia
8/9/2013 © 2012 Ahlstrom Corporation Page 32

Business portfolio development
Expand differentiated product
offering in medical applications
Purify
Protect
Provide
surface &
structure
Expand in selected specialties
for building, construction and
packaging applications
Strengthen position in
wallcoverings and expand
in functional wallcoverings
Establish global leadership in air,
water and life science filtration
materials
Reinforce global leadership
in transportation filtration
8/9/2013 © 2012 Ahlstrom Corporation Page 33

High priority programs
Winning new business
Launching successfully new products
Reaching and exceeding my targets
Improving quality, flexibility and reducing cost
Achieving commercial success for Longkou, Mundra
and Binzhou
High priority
programs
To be able to execute
our business strategy,
we have defined five
high priority programs
and key focus areas
that are crucial to
our success.
Growing through differentiation
Implementing a high performance culture
Driving a world-class supply chain
Winning in Asia
Delivering outstanding customer value

Ahlstrom
is a high
performance
materials
company,
partnering
with leading
businesses
around the
world to help
them stay ahead.
Act
responsibly
Create
value
Learn
and renew
Inspiring people,
passionate about new ideas, growing with our customers
Performance, Improvement, Certainty, Simplicity
Core
Purpose Values
Vision
Brand
Promise
8/9/2013 © 2012 Ahlstrom Corporation Page 35

Combination of Ahlstrom’s Label and Processing and Munksjö AB

The first phase has been completed
8/9/2013 © 2011 Ahlstrom Corporation Page 37
PHASE ONE
PHASE TWO
‒ In August 2012, Ahlstrom and EQT announced the establishment a new company called
Munksjö Oyj
‒ Munksjö Oyj acquired Munksjö AB in exchange for shares in Munksjö Oyj
‒ Munksjö Oyj acquired the European operations of Label and Processing through
a partial demerger in exchange for shares distributed to Ahlstrom shareholders
‒ Ahlstrom Corporation and institutional investors made a EUR 128 million equity investment in
Munksjö Oyj
‒ Munksjö Oyj shares started trading on June 7, 2013
‒ Munksjö Oyj acquires the Brazilian operations of Label and Processing through
another partial demerger in exchange for shares to be distributed to Ahlstrom shareholders
(Demerger consideration of 0.265 Munksjö share for each one held in Ahlstrom Corporation)
‒ Expected time of completion: second half of 2013

Page
Execution of the second phase
– The Brazilian competition authority (CADE) has approved the demerger
(May 23, 2013)
– Approval of Ahlstrom’s Extraordinary General Meeting (July 4, 2013)
– The transaction still requires some regulatory approvals in Brazil
– Ahlstrom expects to complete the transaction during the second half of
2013
8/9/2013 © 2012 Ahlstrom Group 38
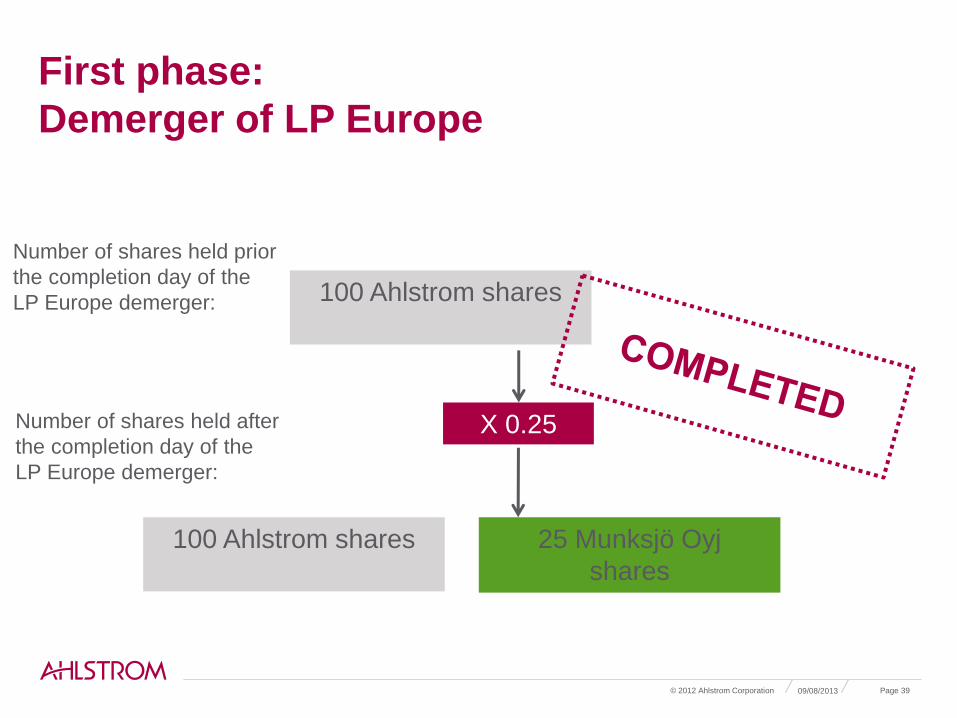
First phase:
Demerger of LP Europe
100 Ahlstrom shares
X 0.25
100 Ahlstrom shares
25 Munksjö Oyj
shares
Number of shares held prior
the completion day of the
LP Europe demerger:
Number of shares held after
the completion day of the
LP Europe demerger:
09/08/2013 © 2012 Ahlstrom Corporation Page 39

Second phase:
Coated Specialties (Brazil) demerger
100 Ahlstrom shares
X 0.265
100 Ahlstrom shares
25 Munksjö Oyj
shares
Number of shares held prior
the completion day of the
Coated Specialties
demerger:
Number of shares held after
the completion day of the
Coated Specialties
demerger:
25 Munksjö Oyj
shares
26 Munksjö Oyj
shares
In total, 100 Ahlstrom and 25 + 26 = 51 Munksjö Oyj shares
09/08/2013 © 2012 Ahlstrom Corporation Page 40

Appendix: Munksjö Oyj’s major shareholders
9.8.2013 © 2012 Ahlstrom Corporation Sivu 41
Shareholder % of all the shares and votes
Munksjö Luxembourg Holding 32.13%
Ahlstrom Corporation 23.42%
Ilmarinen Mutual Pension Insurance Co. 5.81%
Vimpu Intressenter Ab 3.08%
Antti Ahlström Perilliset Oy 3.01%
Others 32.54%
Total 100%
Shareholder
% of all the shares and votes
Munksjö Luxembourg Holding 24.40%
Ahlstrom Oyj 17.79%
Vimpu Intressenter Ab 4.81%
Antti Ahlström Perilliset Oy 4.72%
Ilmarinen Mutual Pension Insurance Co. 4.58%
Muut 43.71%
Total 100%
After the first phase:
After the second phase:

Clear strategic fit
8/9/2013 Page 42
• Munksjö Oyj will be a focused specialty paper company in
attractive market segments
• Specialty paper as the core business, serving as a
platform for continued growth
• Balanced product portfolio
• Munksjö Oyj will have strong market positions on all
specialty paper markets, including the markets for decor
papers, abrasive backings and release liners
• Long customer relationships, deep know-how of customer
needs and high technical expertise within production and
product development contribute to the sustainability of
these leading market positions
Focused
specialty
paper
company
Leading
market
positions

Substantial synergy opportunities
8/9/2013 Page 43
• Synergies in the form of cost savings and efficiency
improvements identified amounting to approximately
EUR 20-25 million on an annual basis once fully
implemented, mainly relating to:
• Purchasing
• Production efficiencies
• Pulp
• Logistics
• Sales
• Of the total synergies, approximately 60% are expected to be
realized within 12 months after the completion of the first
partial demerger and the remainder during the next 2-3 years
• The parties will establish joint sourcing activities
Annual
synergies,
fully
implemented
of approx.
EUR 20-25
million
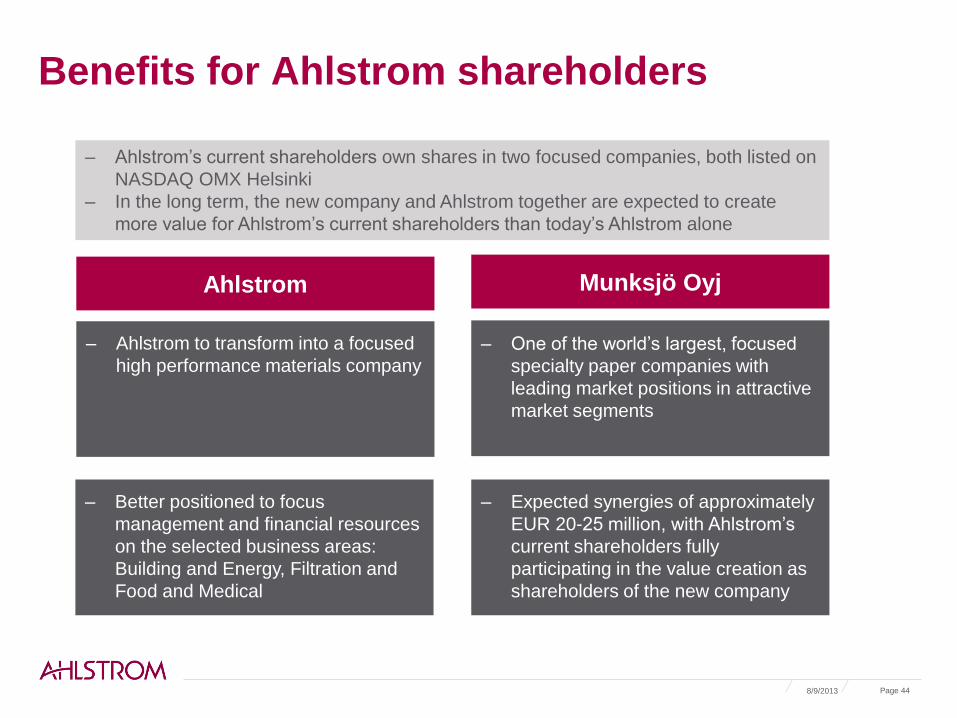
Benefits for Ahlstrom shareholders
8/9/2013 Page 44
‒ Expected synergies of approximately
EUR 20-25 million, with Ahlstrom’s
current shareholders fully
participating in the value creation as
shareholders of the new company
‒ One of the world’s largest, focused
specialty paper companies with
leading market positions in attractive
market segments
‒ Ahlstrom to transform into a focused
high performance materials company
‒ Better positioned to focus
management and financial resources
on the selected business areas:
Building and Energy, Filtration and
Food and Medical
Ahlstrom Munksjö Oyj
‒ Ahlstrom’s current shareholders own shares in two focused companies, both listed on
NASDAQ OMX Helsinki
‒ In the long term, the new company and Ahlstrom together are expected to create
more value for Ahlstrom’s current shareholders than today’s Ahlstrom alone

Financing
Munksjö Oyj
– Ahlstrom, Varma, Ilmarinen and
EQT invested EUR 128 million to
Munksjö Oyj’s equity
– Munksjö Oyj has signed EUR 365
million term and revolving facilities
agreement
Ahlstrom Oyj
– Ahlstrom’s net debt will be
reduced by approximately EUR 63
million after the EUR 78.5 million
investment to Munksjö Oyj
09/08/2013 © 2012 Ahlstrom Corporation Page 45

Long-term financial targets and dividend policy

Long-term financial targets
ROCE at least 13%
Annual net sales growth at least 5%
At constant currency rates, including acquisitions
Gearing 50−80%
To be maintained within the target range
Profitability
Growth
Solidity
8/9/2013 © 2012 Ahlstrom Corporation Page 47

8/9/2013 © 2012 Ahlstrom Corporation Page 48
Return on capital employed 2008-2012
1.4
-1.1
5.0
0
1.6
-4
-2
0
2
4
6
8
10
12
14
2008 2009 2010 2011* 2012* **
%
ROCE target
minimum 13%
*Continuing operations excluding Label and Processing &
Home and Personal
** The figure has not been restated according to the
revised IAS 19 standard

Performance against long-term financial targets
0
20
40
60
80
100
120
200
8
200
9
201
0
201
1
201
2**
*0
500
1 000
1 500
2 000
200
8
200
9
201
0
201
0*
201
1*
201
1**
201
2**
Sales growth
At least 5% annually
Gearing ratio
Maintain within 50-80%
-1.5%
-11.4% +18.7%
*Continuing operations excluding Home and Personal
**Continuing operations excluding Home and Personal & Label and
Processing
***The figure has not been restated according to the revised IAS 19 standard
EUR
million %
8/9/2013 © 2012 Ahlstrom Corporation Page 49
-1.8%

‒ Aim is to pay a dividend of not less than
one third of net cash from operating
activities after operative investments,
calculated as three-year rolling average.
0,0
0,5
1,0
1,5
2,0
2008 2009 2010 2011* 2012
Dividend per share (€)
0
25
50
75
2008 2009 2010 2011* 2012
Total amount of dividends paid (EUR million)
0.63 0.45
29 21 26
0.55
41
0.88
Dividend policy
1.30
61
*Consisting of a dividend of EUR 0.87 per share and an extra
dividend of EUR 0.43 per share.
8/9/2013 © 2012 Ahlstrom Corporation Page 50
– A dividend of EUR 0.63 per share was
paid for the financial year ended Dec. 31,
2012.
– (Based on Ahlstrom’s dividend
policy, a dividend of at least EUR
0.54 per share would have been
paid)

Shareholders
5.1 1.5 2.0
2.6
23.8
10.6
54.5
Public sector institutions
Financial and insurance institutions
Non-profit institutions
Nominee registered
Corporations
Foreign holders
Finnish private investors
Major shareholders (31/7/2013)
1. Vimpu Intressenter Ab 10.39%
2. Antti Ahlström Perilliset Oy 10.02%
3. Varma Mutual Pension
Insurance Company 3.28%
4. Huber Mona Lilly 2.69%
5. Tracewski Jacqueline 2.16%
6. Nahi Kai Anders 1.71%
7. Kylmälä Tauno Kim 1.65%
8. Lund Niklas Roland 1.49%
9. Kylmälä Kasper Johannes 1.45%
10. Studer Anneli 1.43%
Shareholder structure (31/7/2013)
Ahlström family members hold approximately 67% of
the shares*
*Ahlstrom Corporation is not aware of any shareholders’
agreements relating to its share
8/9/2013 © 2012 Ahlstrom Corporation Page 51

Global sourcing

Total costs EUR 940 mil. (excl. NRI) in 2012*
‒ Natural fibers
• Pulp (NBSK, BHKP, specialty pulps)
• Abaca
• Viscose rayon
‒ Synthetic fibers
• Polyester
• Polypropylene
‒ Chemicals
• Latex
• Titanium dioxide
• Starch
• Clay
• Liquid solvents
‒ Main sources of energy
• Natural gas
• Electricity
8/9/2013 © 2012 Ahlstrom Corporation Page 53
24%
14%
13% 8% 3%
23%
15%
Total costs*
Wood pulp, other natural fibers Synthetic fibers
Chemicals Energy
Delivery costs Wages and salaries
Other fixed costs
*Continuing operations

62%
27%
7%
2% 1% 1%
Raw materials (1,158,335 tons in total)*
Woodpulp ChemicalsSynthetic fibers PackagingAnnual fibers Recycled paper
8/9/2013 © 2012 Ahlstrom Corporation Page 54
Raw materials used in 2012*
Key raw materials 2012*
Wood pulp Tons 718,140
Synthetic fibers Tons 80,192
Chemicals Tons 316,330
– 91% of the fiber material used in 2012 was
from renewable sources
*Including discontinued operations

8/9/2013 © 2012 Ahlstrom Corporation Page 55
Energy usage in 2012*
Fuels 2012*
Coal TJ 1,323
Oil TJ 67
Gas TJ 7,161
Solid Waste TJ 899
Other TJ 341
Total 9,791
Electricity
Purchased MWh 732,109
Own production MWh 76,194
Other MWh 1,109
Total 809,412
Process heat
Steam TJ 8,062
Gas (IR) TJ 2,362
Electric energy (IR) TJ 24
Total 10,448
*Including discontinued operations

Pulp price trends
8/9/2013 © 2012 Ahlstrom Corporation Page 56
Ahlstrom’s total costs
Natural fibers
Other
USD/ton
Source: FOEX Indexes/Bloomberg
200
300
400
500
600
700
800
900
1000
1100
1200
Hard wood pulp Soft wood pulp

Sustainability

Sustainability as a key driver in product development
EcoDesign approach is based on
life-cycle assessment
The target is to minimize the
environmental impacts of a product
over its whole life-cycle
EcoDesign approach is a
continuous improvement process
focusing on:
• Technical performance
• Cost efficiency
• Environment
© 2012 Ahlstrom Corporation Page 58 8/9/2013

Our approach to sustainability
PRODUCT
DEVELOPMENT RESPONSIBLE
SOURCING
MANUFACTURING
SALES AND
MARKETING
– Minimized
environmental
impacts of the
products over
their life cycle
(LCA)
– Social impacts
of products
– Certified fiber
sources
– Supplier Code of
Conduct
– Water use
– Waste
minimization
– Resource
efficiency
– Energy use
– Minimized
emissions to air,
water and soil
– Product
stewardship
– Sustainable
value
propositions
– Helping
customers to
solve their
sustainability
challenges
Safety in workplace, human rights, leadership and management practices
Economic, social and environmental focus areas in Ahlstrom's value chain
8/9/2013 © 2012 Ahlstrom Corporation Page 59

Waste and carbon dioxide emissions
Landfilled solid waste
500
510
520
530
540
550
560
570
580
590
600
2008 2009 2010 2011 2012
kg CO2/ton of product
Carbon dioxide emissions
Tons/year kg/ton of
product
Kg CO2/ton
of product
8/9/2013 © 2012 Ahlstrom Corporation Page 60
0
5
10
15
20
25
0
5000
10000
15000
20000
25000
2008 2009 2010 2011 2012
Tons/Year Kg/ton of product

Key financials 2008-2012 (Figures in the following section have not been restated according to revised IAS 19 standard)
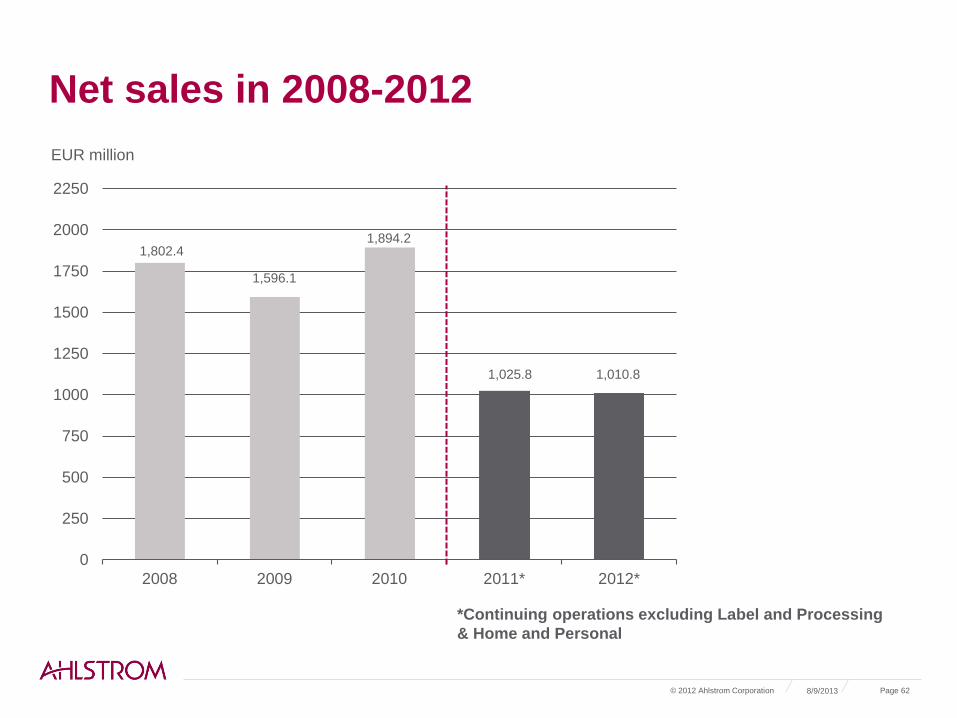
Net sales in 2008-2012
0
250
500
750
1000
1250
1500
1750
2000
2250
2008 2009 2010 2011* 2012*
1,802.4
1,596.1
1,894.2
1,025.8 1,010.8
*Continuing operations excluding Label and Processing
& Home and Personal
EUR million
8/9/2013 © 2012 Ahlstrom Corporation Page 62

EBITDA in 2008-2012
0
2
4
6
8
10
12
14
16
0
25
50
75
100
125
150
175
200
2008 2009 2010 2011* 2012*
EBITDA % of net salesEUR
million %
*Continuing operations excluding Label and Processing
& Home and Personal
126.9 123.2
158.2
61.4 71.0
8/9/2013 © 2012 Ahlstrom Corporation Page 63

Operating profit in 2008-2012
-2%
-1%
0%
1%
2%
3%
4%
5%
6%
7%
8%
-20
-10
0
10
20
30
40
50
60
70
80
2008 2009 2010 2011* 2012*
EUR million Operating profit Operating profit excl. NRI % of net sales
35.7 39.8
74.2
-14.6
14.6
53.7
2.1
29.6
18.6 17.9
*Continuing operations excluding Label and Processing &
Home and Personal
8/9/2013 © 2012 Ahlstrom Corporation Page 64

8/9/2013 © 2012 Ahlstrom Corporation Page 65
Return on capital employed 2008-2012
1.4
-1.1
5.0
0
1.6
-4
-2
0
2
4
6
8
10
12
14
2008 2009 2010 2011* 2012*
%
ROCE target
minimum 13%
*Continuing operations excluding Label Processing &
Home and Personal
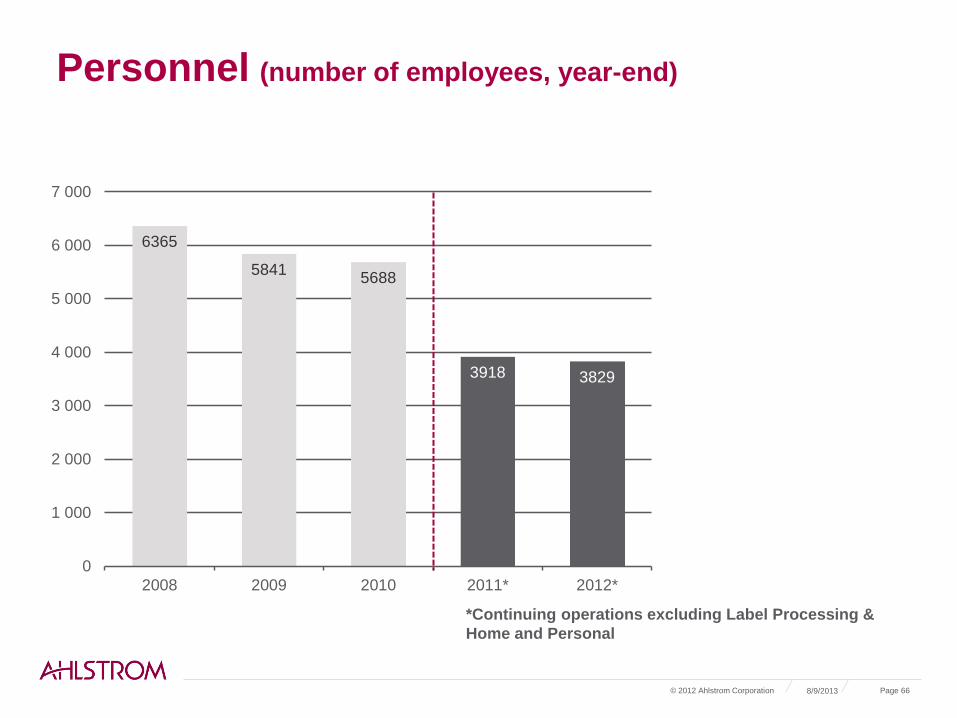
Personnel (number of employees, year-end)
6365
5841 5688
3918 3829
0
1 000
2 000
3 000
4 000
5 000
6 000
7 000
2008 2009 2010 2011* 2012*
*Continuing operations excluding Label Processing &
Home and Personal
8/9/2013 © 2012 Ahlstrom Corporation Page 66

Net cash from operating activities 2008-2012 (including discontinued operations)
0
25
50
75
100
125
150
175
200
225
2008 2009 2010 2011 2012
83.7 78.7
102.4
209.6
167.5
EUR
million
8/9/2013 © 2012 Ahlstrom Corporation Page 67
– Cash flow stabilized
after the completion of
the operative working
capital project in 2009-
2010

8/9/2013 © 2012 Ahlstrom Corporation Page 68
Development of operative working capital (including discontinued operations)
20
25
30
35
40
45
50
55
100
125
150
175
200
225
250
275
Q1/10 Q4/10 Q4/11 Q1/12 Q2/12 Q3/12 Q4/12
Days EUR million
Operative working capital* Turnover rate in days
230.7
– Operative working capital
has been stable since the
end of 2011
– Turnover rate was 41
days on December 31,
2012 (41 days on Dec.
31, 2011)
*Operative working capital = Accounts receivables + inventories – accounts payable
194.3
176.7 179.1 171.8 169.3 169.9

Investments 2008-2012
0
20
40
60
80
100
120
140
160
180
2008 2009 2010 2011* 2012* 2013E*
Capex, excl. acquisitions Capex, incl. acquisitions Depreciation
– Annual maintenance
investments approximately
EUR 30 million
– In 2012, investments were
EUR 74.1 million, excluding
acquisitions
– In 2013, investments are
anticipated to be
approximately EUR 75 million
(excluding acquisitions)
EUR
million
74.1
95.4
128.0
167.0
63.8 63.8
51.1
62.3
49.8 50.8
75.0
8/9/2013 © 2012 Ahlstrom Corporation Page 69
*Continuing operations excluding Label Processing &
Home and Personal

Gearing ratio (including discontinued operations)
0
10
20
30
40
50
60
70
80
90
100
100
150
200
250
300
350
400
450
500
550
600
2008 2009 2010 2011 2012
Interest bearing net liabilities Gearing ratio, %
– Net debt and gearing
ratio reduced starting
from 2008
– Gearing ratio on
December 31, 2012
was 55.8%
Gearing ratio:
target range 50–80%
303.4
598.7
395.9
330.1
237.8
EUR
million %
8/9/2013 © 2012 Ahlstrom Corporation Page 70

Debt servicing figures
8/9/2013 © 2012 Ahlstrom Corporation Page 71
0
1
2
3
4
5
2008 2009 2010 2011 2012
Net debt/Ebitda
0
1
2
3
4
5
6
2008 2009 2010 2011 2012
Ebitda/Interest coverage

8/9/2013 © 2012 Ahlstrom Corporation Page 72
Maturity profile of medium/long-term credit
facilities
– Total liquidity, including cash
and unused committed credit
facilities was EUR 326.0 million
at the end of Q2/2013.
– In addition, Ahlstrom had
undrawn uncommitted credit
facilities and cash pool overdraft
limits of EUR 143.2 million
available.
0
25
50
75
100
125
150
175
200
225
250
2013 2014 2015 2016 2017 2018-
EUR million
Mid-term and long-term loans Undrawn credit facilities EUR 100 million bond

Interest-bearing loans and borrowings
0
50
100
150
200
250
300
200
8
200
9
201
0
201
1
201
2
Long-term loans
0
50
100
150
200
250
300
350
400
450
500
2008 2009 2010 2011 2012
Short-term loans
Current portion of non-current loansOther short-term debtCommercial papers
EUR
million EUR
million
8/9/2013 © 2012 Ahlstrom Corporation Page 73

Senior bond issue in November, 2010
Issuer:
Ahlstrom Corporation
Status: Senior, unsecured, unsubordinated
Amount: EUR 100 million
Maturity: 5 years
Coupon: Fixed rate 4.50%, payable annually in arrears, Act/Act
Governing law: Finnish
Clearing: Euroclear Finland (RM)
Listing: Helsinki, to be applied post-issuance
Documentation: Stand-alone bond documentation, including Change of Control-clause,
Cross-Default and Negative Pledge
Lead Managers: Nordea Markets, Pohjola Bank
– Part of the funding strategy to prolong maturity structure and widen funding base
8/9/2013 © 2012 Ahlstrom Corporation Page 74
Hybrid bond
– EUR 80 million domestic hybrid bond* with a coupon rate of 9.50% per annum
• Issued on November 9, 2009 to strengthen balance sheet
• Ahlstrom has an option to call the bond in November, 2013
• The company is exploring refinancing alternatives
*A hybrid bond is an instrument which is subordinated to the company's other debt obligations and which is treated as equity in the IFRS financial statements. Hybrid bonds do not confer to their holders the right to vote at shareholder meetings and do not dilute the holdings of the current shareholders.
8/9/2013 © 2012 Ahlstrom Corporation Page 75

Thank you
For further information:
Juho Erkheikki
Manager, Financial Communications & Investor Relations
T: +358 50 413 4583