Welcome to MM207, Statistics! Unit 1 Seminar Dr. Bob Lockwood To resize your pods: Place your mouse...
20
Welcome to MM207, Statistics! Unit 1 Seminar Dr. Bob Lockwood To resize your pods: Place your mouse here. Left mouse click and hold. Drag to the right to enlarge the pod.
-
Upload
sydney-campbell -
Category
Documents
-
view
219 -
download
3
Transcript of Welcome to MM207, Statistics! Unit 1 Seminar Dr. Bob Lockwood To resize your pods: Place your mouse...
Welcome to MM207, Statistics!
Unit 1 SeminarDr. Bob Lockwood
To resize your pods: Place your mouse here.
Left mouse click and hold.Drag to the right to enlarge the pod.
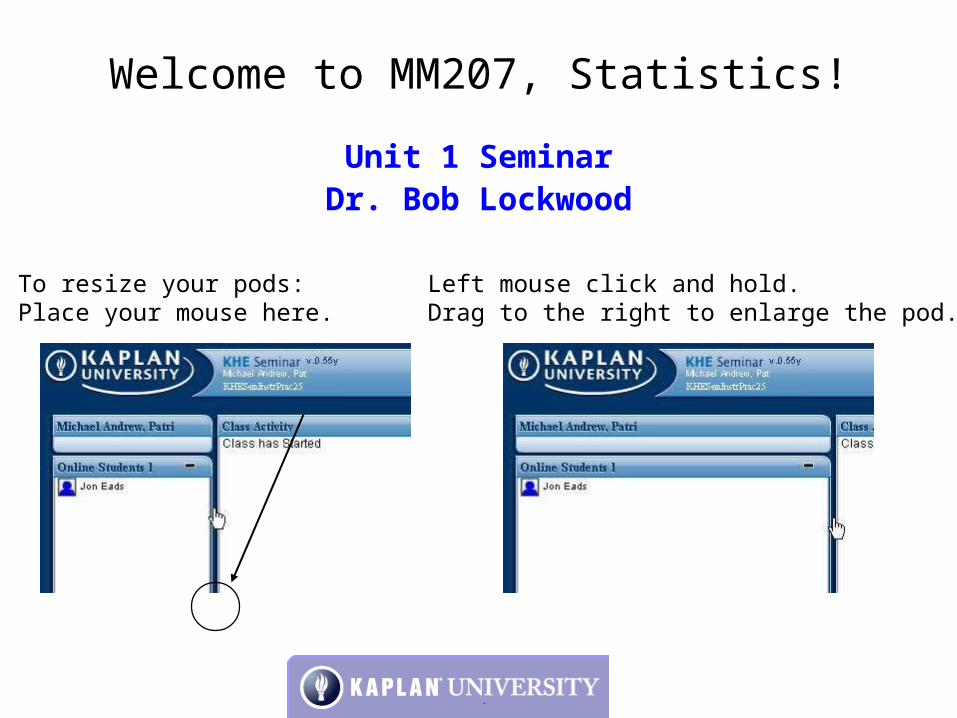
Seminar Outline
• Welcome!• Brief Syllabus Review• Contact Information for Instructor• Seminar Rules• Discussion
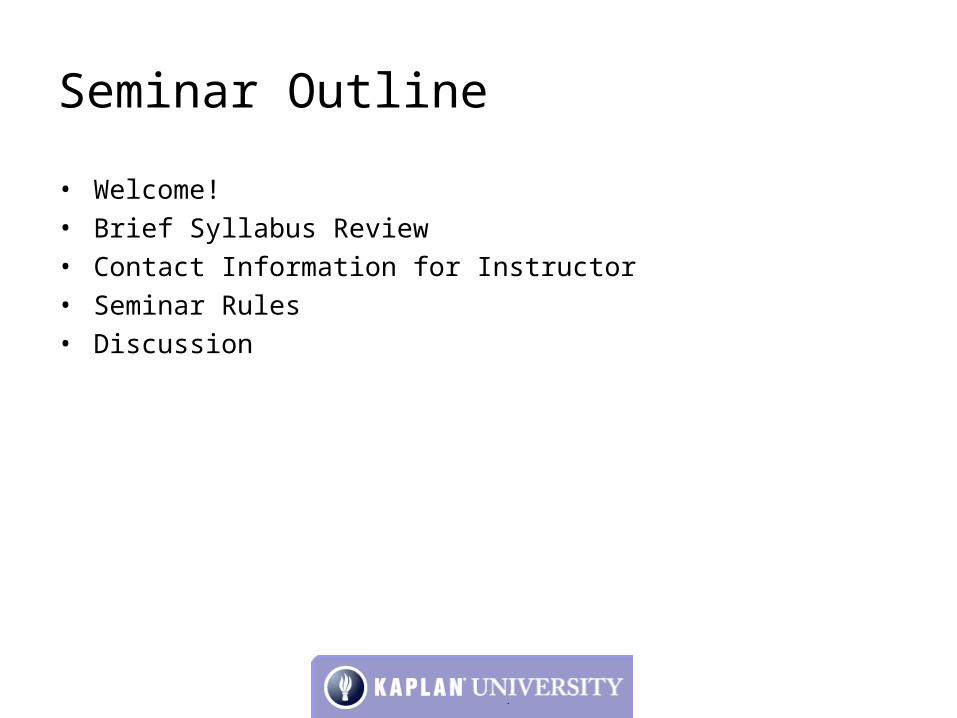
Syllabus Highlights
Due Dates All learning activities for a unit are due by Tuesday 11:59 pm ET.
Late penalties Projects: 2% per day late Discussion Threads: Unless there is a really big reason that you cannot
post to a unit, I do not accept late discussion board posts. If I approve a late post there will be 10% per week late fee. Please see my Syllabus Addendum Announcement for details.
All late assignments due by: 11:59 pm ET Sunday ending Week 10
Instructor Contact Information
• Instructor: Robert E. Lockwood [Dr. Bob]
• Email: [email protected]
• AIM Screen name: drboblockwood
• Office hours: By appointment and we can meet in AIM, on the phone or in a seminar room.
• Phone Number: 334-220-1244 (be kind I live in the Central time zone)

Ask Questions! Do not wait until Tuesday night.
Office Hours:
Make an appointment if you need to talk with me
Email questions any time. I have my email forwarded to my phone so if it is critical I will know quickly.
Tutoring is available in the Math Center most evenings. Go to My Studies on the Kaplan page.
Tutoring is also available through Pearson, MML Tutoring Services link is under Course Home.
Course Materials
• Text book
• Student Solutions Manual
• Technology Manual for Excel 2007
– There are three parts in the manual, we will use the third section,
which is for Excel 2007
– The CD with the Technology Manual has the PHStat software.

Home Page Features
• Announcements – Read them…they just might help!
• Doc Sharing – Check this each week at the beginning of the unit
• Unit Links– MML Ungraded Tutorials
• Course Extras– Electronic Resources– Multimedia Library
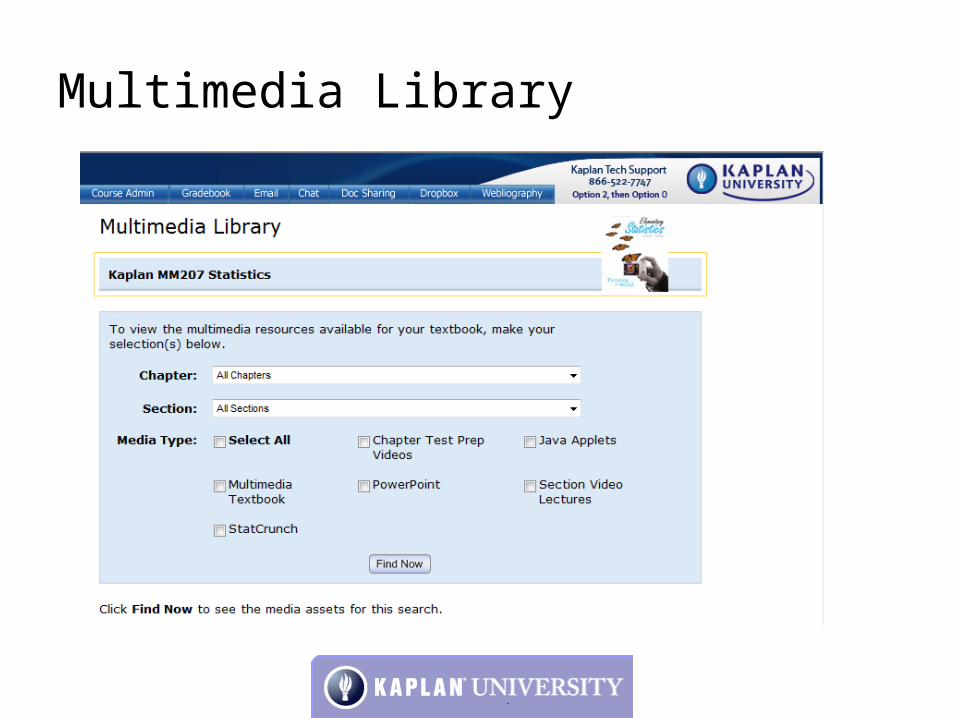
Multimedia Library
Excel is Required for this Course
• Excel Templates: Course Extras, Doc Sharing• Video Tutorials
– www.drboblockwood.com
• Microsoft Excel Help
Excel 2003 Helphttp://office.microsoft.com/en-us/excel/FX100646961033.aspx?ofcresset=1
Excel 2007 Helphttp://office.microsoft.com/en-us/excel/FX100646951033.aspx

Seminar Rules and Structure• Usual format of seminar will involve a brief discussion of a concept
and then working with the Excel template for that unit. You should try very hard to download and examine the template before seminar.
• We will be working with Excel during the seminar and you will need to have it up and ready. Since it is an audio seminar you can be actually working in Excel as I talk you through the procedure. You do not need to post unnecessarily but I would like to know that you are working the problem and whether you are having success or trouble with the procedure.
• Social posts (It is raining, Hi, Bye, My car broke down) will not help your participation grade.
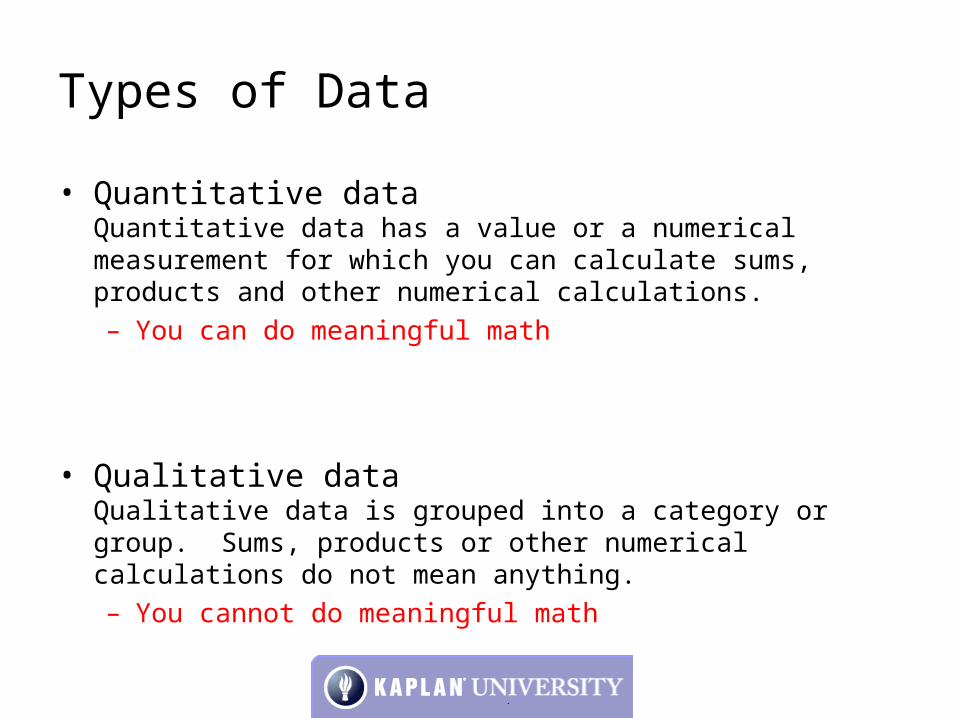
Types of Data
• Quantitative dataQuantitative data has a value or a numerical measurement for which you can calculate sums, products and other numerical calculations.– You can do meaningful math
• Qualitative dataQualitative data is grouped into a category or group. Sums, products or other numerical calculations do not mean anything.– You cannot do meaningful math
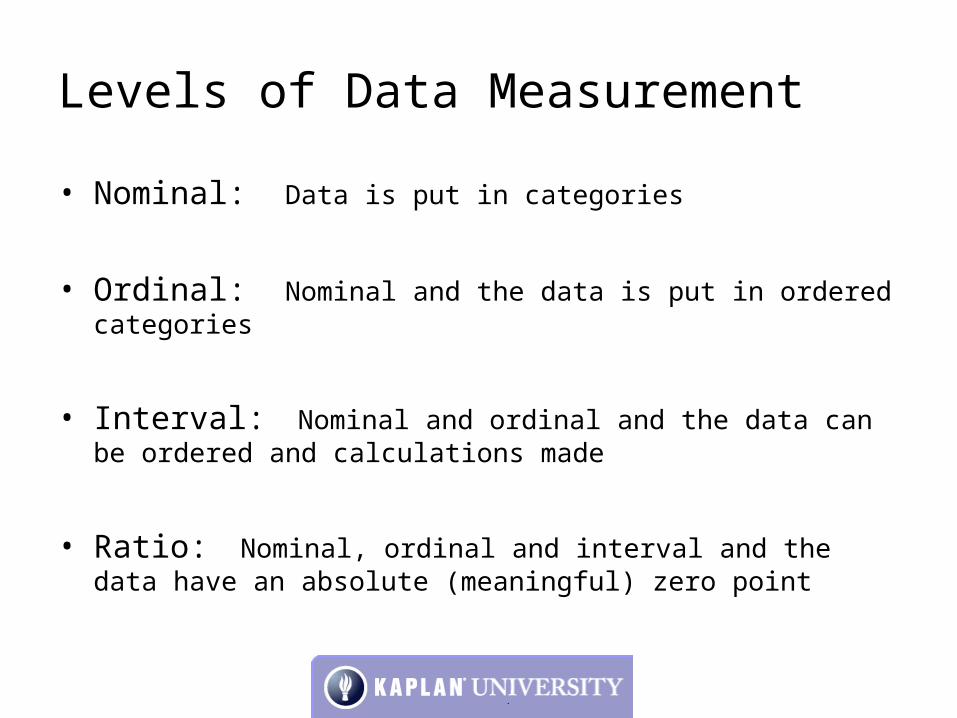
Levels of Data Measurement
• Nominal: Data is put in categories
• Ordinal: Nominal and the data is put in ordered categories
• Interval: Nominal and ordinal and the data can be ordered and calculations made
• Ratio: Nominal, ordinal and interval and the data have an absolute (meaningful) zero point
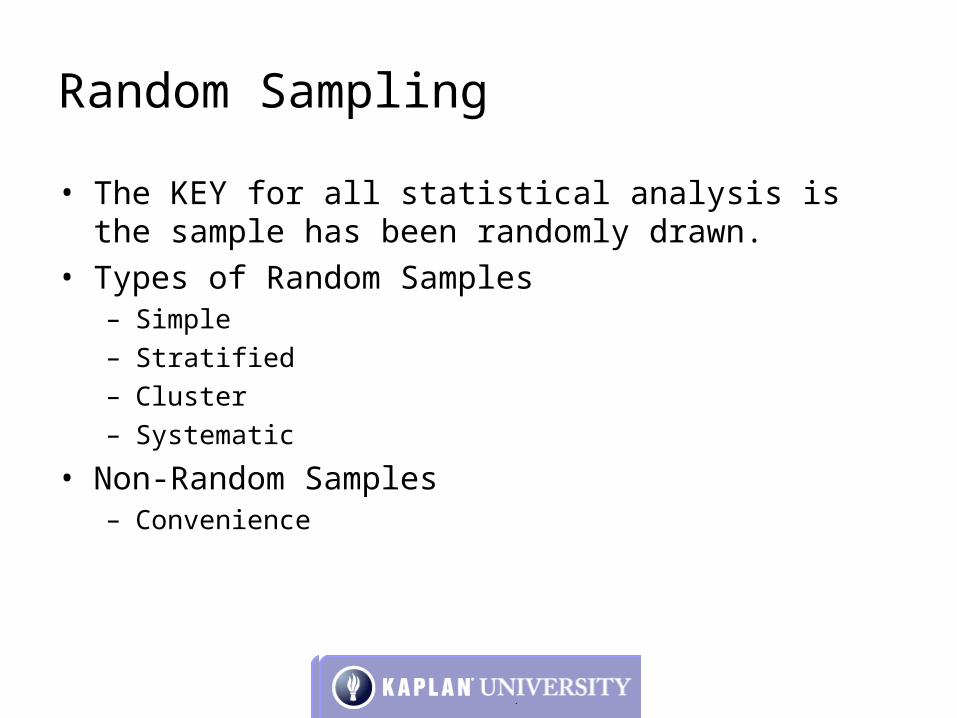
Random Sampling
• The KEY for all statistical analysis is the sample has been randomly drawn.
• Types of Random Samples– Simple– Stratified– Cluster– Systematic
• Non-Random Samples– Convenience
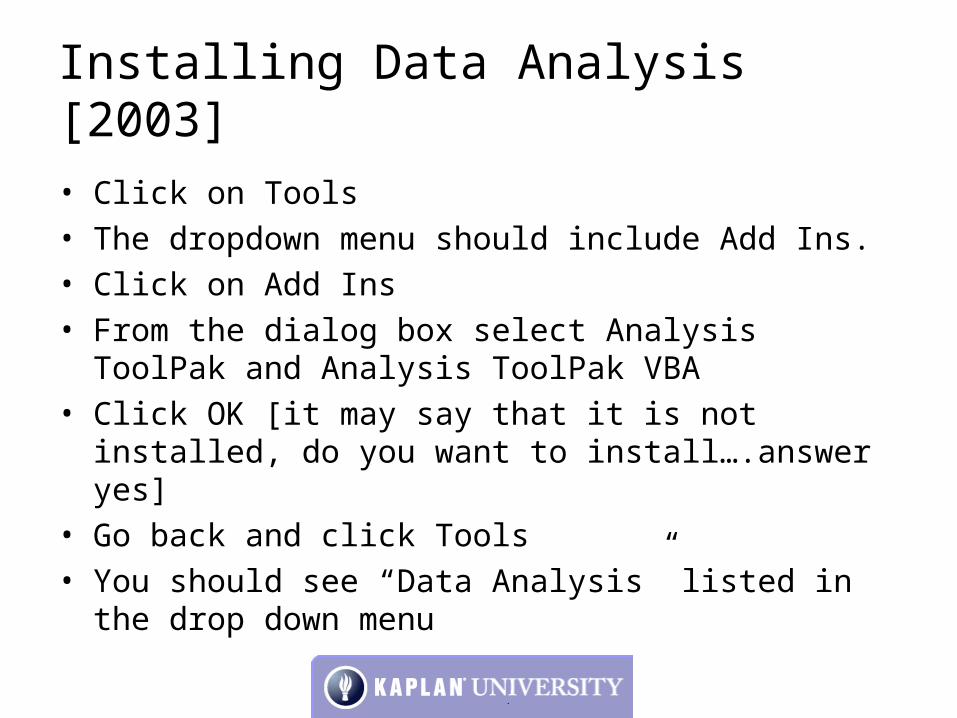
Installing Data Analysis [2003]
• Click on Tools • The dropdown menu should include Add Ins.• Click on Add Ins• From the dialog box select Analysis ToolPak and
Analysis ToolPak VBA• Click OK [it may say that it is not installed, do you want
to install….answer yes]• Go back and click Tools• You should see “Data Analysis” listed in the drop down
menu
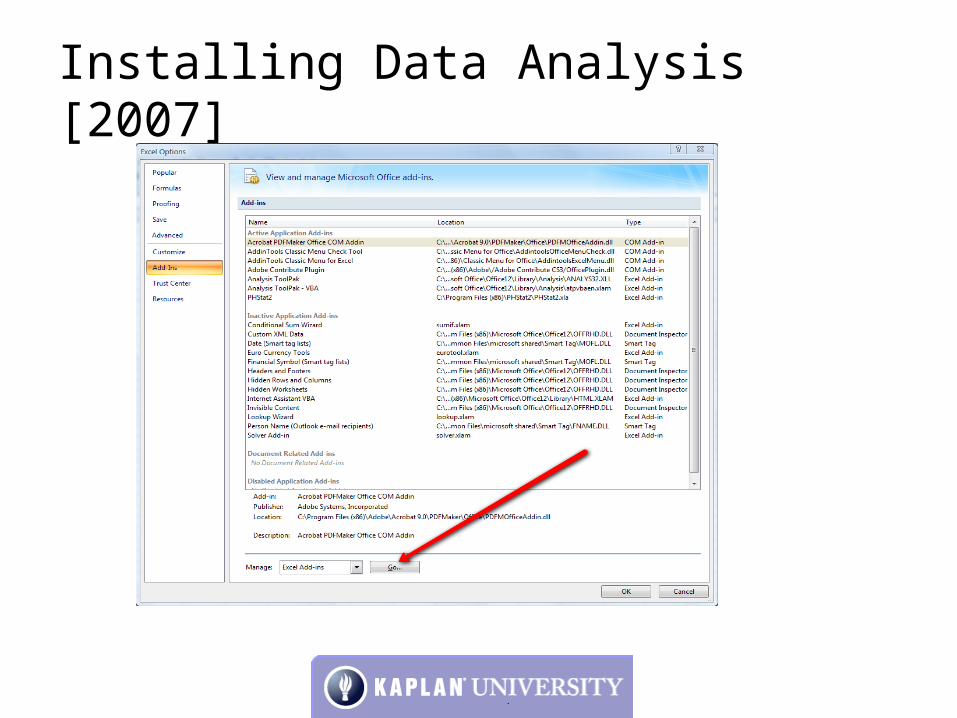
Installing Data Analysis [2007]
• Open Excel• Click the Office button in the upper left corner of
the screen• Select Excel Options [located on the bottom right
of the dropdown box]• You will then see Manage ADD INS at the
bottom. Click GO
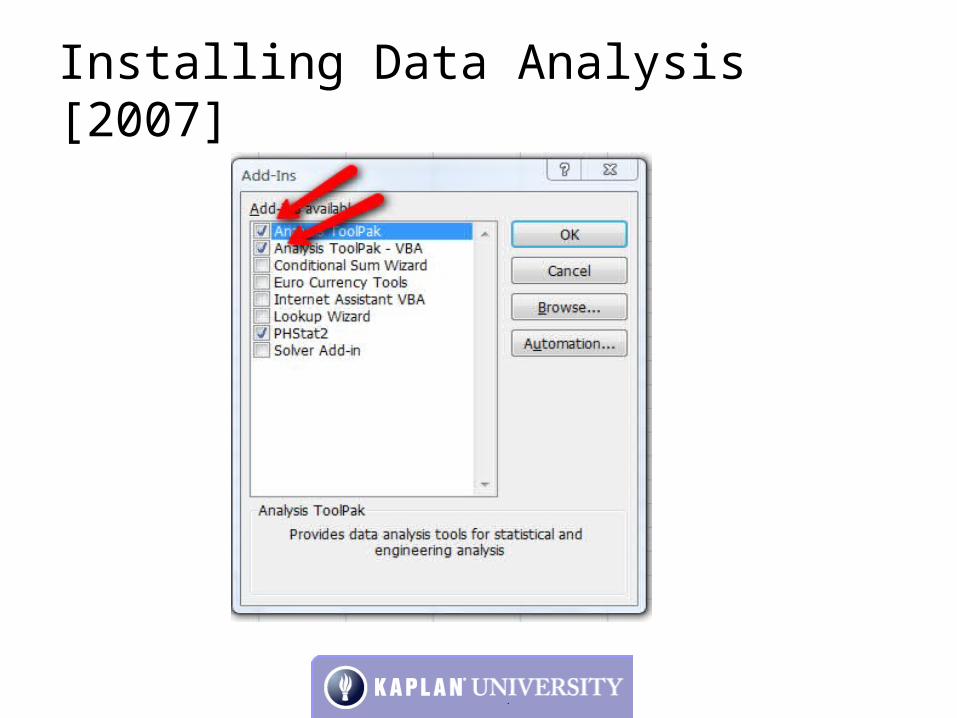
Installing Data Analysis [2007]
• Select Analysis ToolPak
• Select Analysis ToolPak VBA
• Click OK
Installing Data Analysis [2007]
Installing Data Analysis [2007]
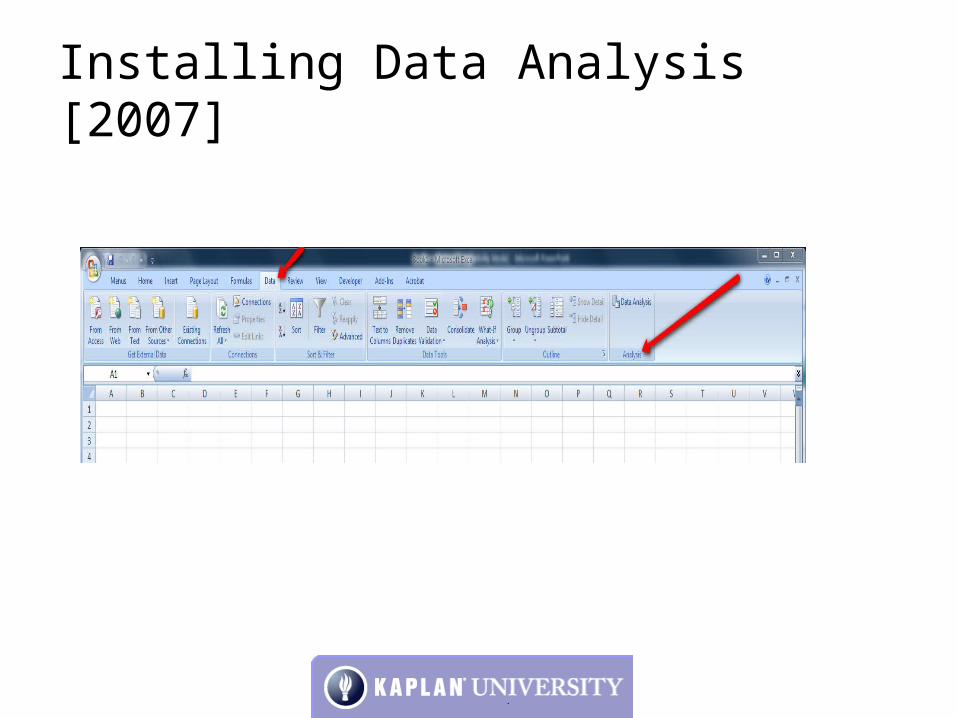
Installing Data Analysis [2007]
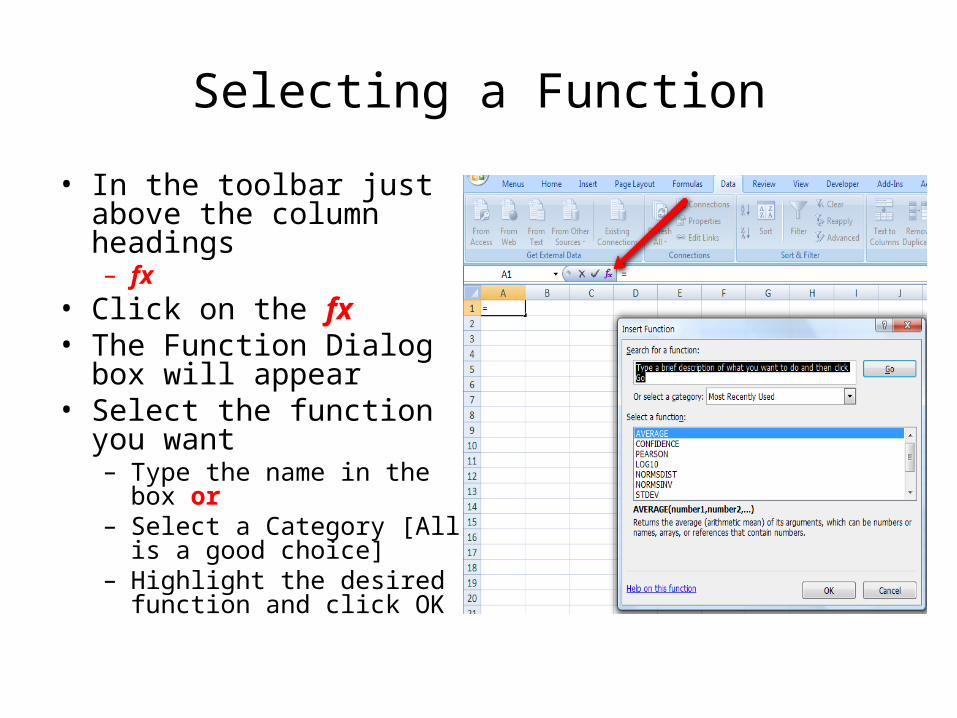
Selecting a Function
• In the toolbar just above the column headings– fx
• Click on the fx• The Function Dialog box
will appear• Select the function you
want– Type the name in the box
or– Select a Category [All is a
good choice]– Highlight the desired
function and click OK