Welcome to Interactive Chalkboard Mathematics: Applications and Concepts, Course 1 Interactive...
64
Mathematics: Applications and Concepts, Course 1 Interactive Chalkboard Copyright © by The McGraw-Hill Companies, Inc. Developed by FSCreations, Inc., Cincinnati, Ohio 45202 Send all inquiries to: GLENCOE DIVISION Glencoe/McGraw-Hill 8787 Orion Place Columbus, Ohio 43240
-
Upload
aisha-cobbs -
Category
Documents
-
view
218 -
download
1
Transcript of Welcome to Interactive Chalkboard Mathematics: Applications and Concepts, Course 1 Interactive...

Mathematics: Applications and Concepts, Course 1 Interactive ChalkboardCopyright © by The McGraw-Hill Companies, Inc.
Developed by FSCreations, Inc., Cincinnati, Ohio 45202
Send all inquiries to:
GLENCOE DIVISIONGlencoe/McGraw-Hill8787 Orion PlaceColumbus, Ohio 43240

Lesson 3-1 Representing Decimals
Lesson 3-2 Comparing and Ordering Decimals
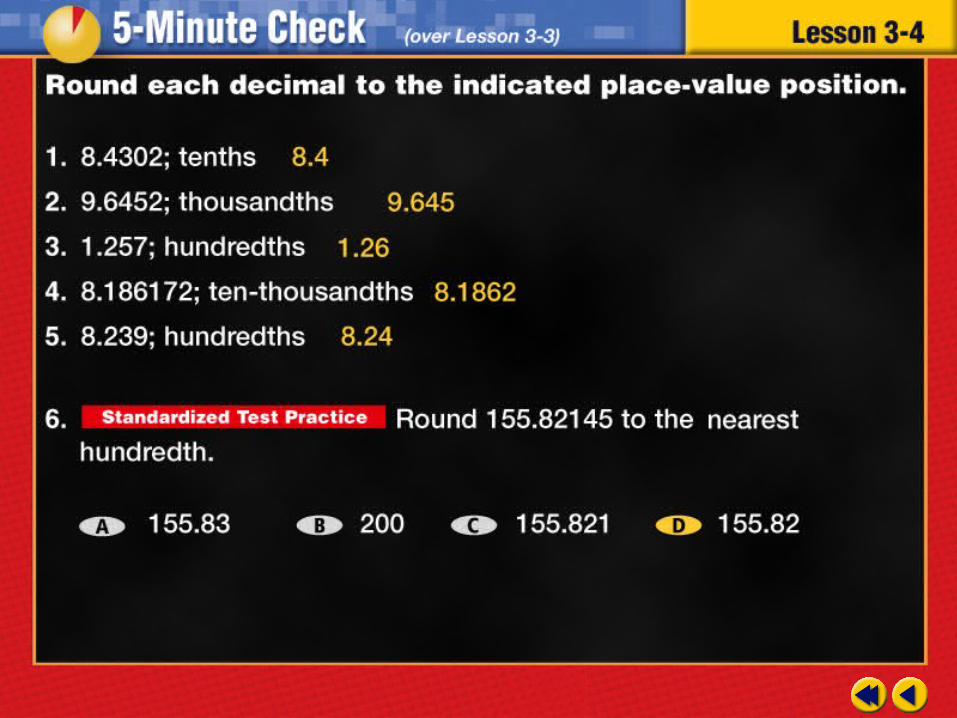
Lesson 3-3 Rounding Decimals
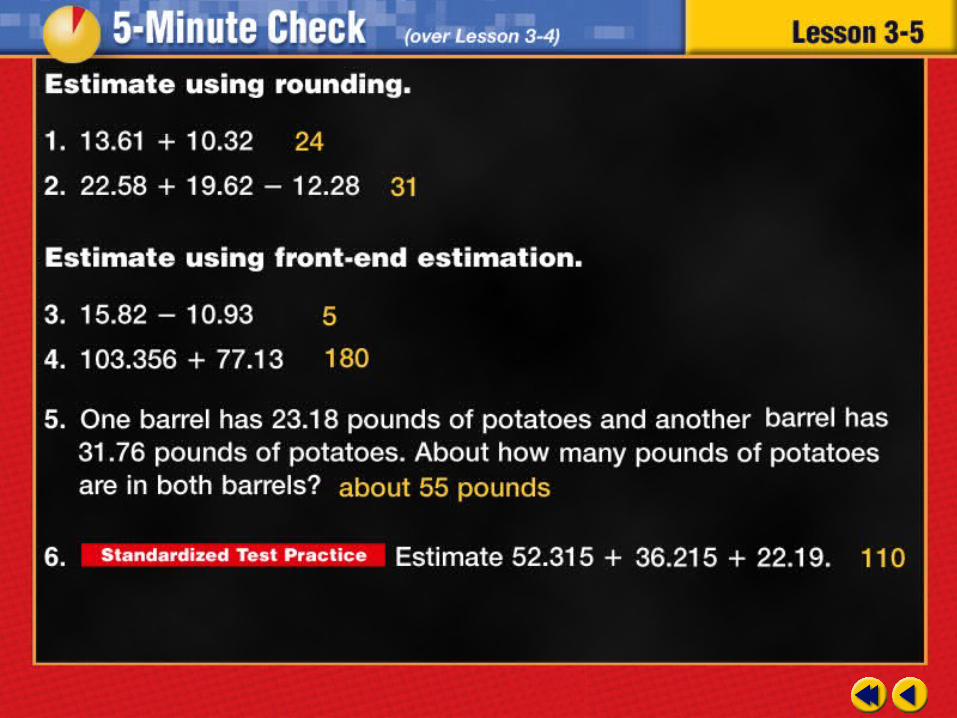
Lesson 3-4 Estimating Sums and Differences
Lesson 3-5 Adding and Subtracting Decimals
Example 1 Write a Decimal in Word Form
Example 2 Standard Form and Expanded Form

Write 102.056 in word form.
Answer: 102.056 is one hundred two and fifty-six thousandths.

Write 230.108 in word form.
Answer: two hundred thirty and one hundred eight thousandths
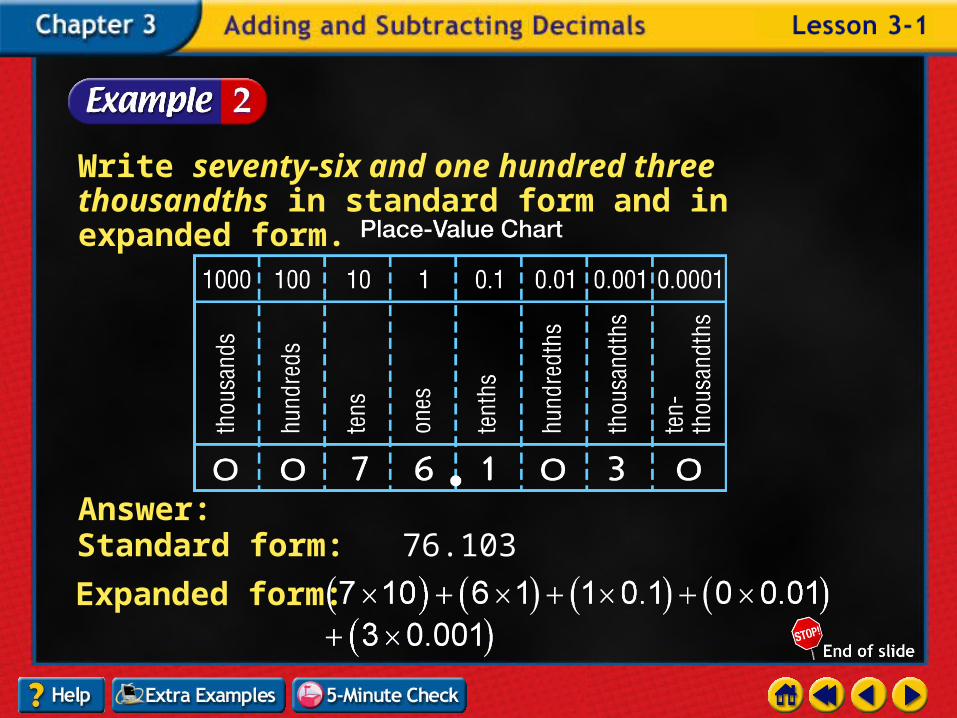
Write seventy-six and one hundred three thousandths in standard form and in expanded form.
Answer: Standard form: 76.103
Expanded form:
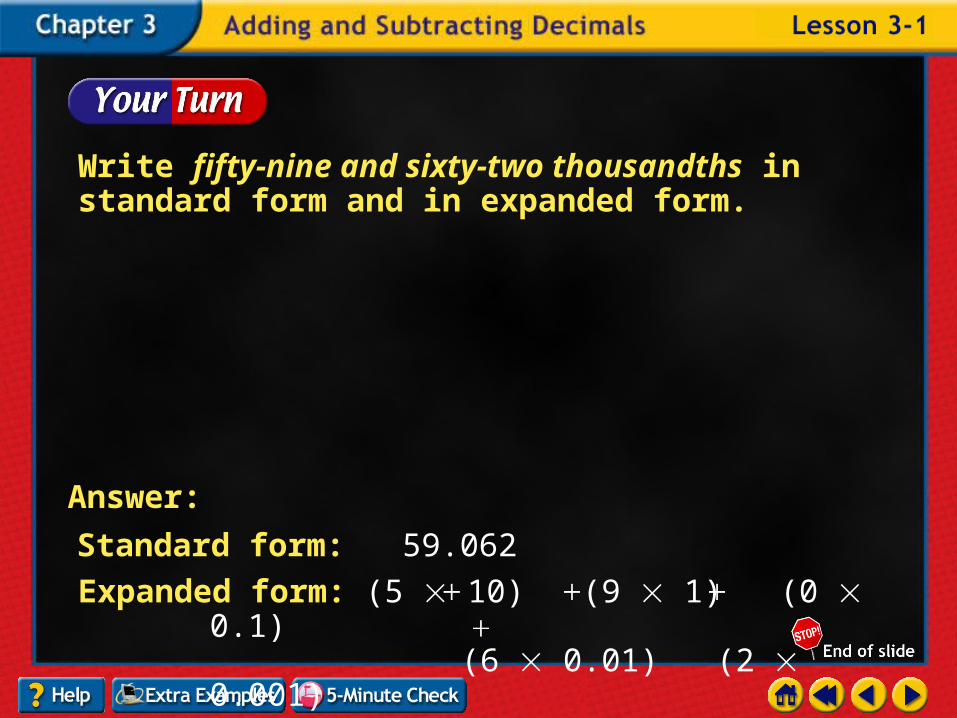
Write fifty-nine and sixty-two thousandths in standard form and in expanded form.
Expanded form: (5 10) (9 1) (0 0.1) (6 0.01) (2 0.001)
Standard form: 59.062
Answer:


Example 1 Compare Decimals
Example 2 Order Decimals
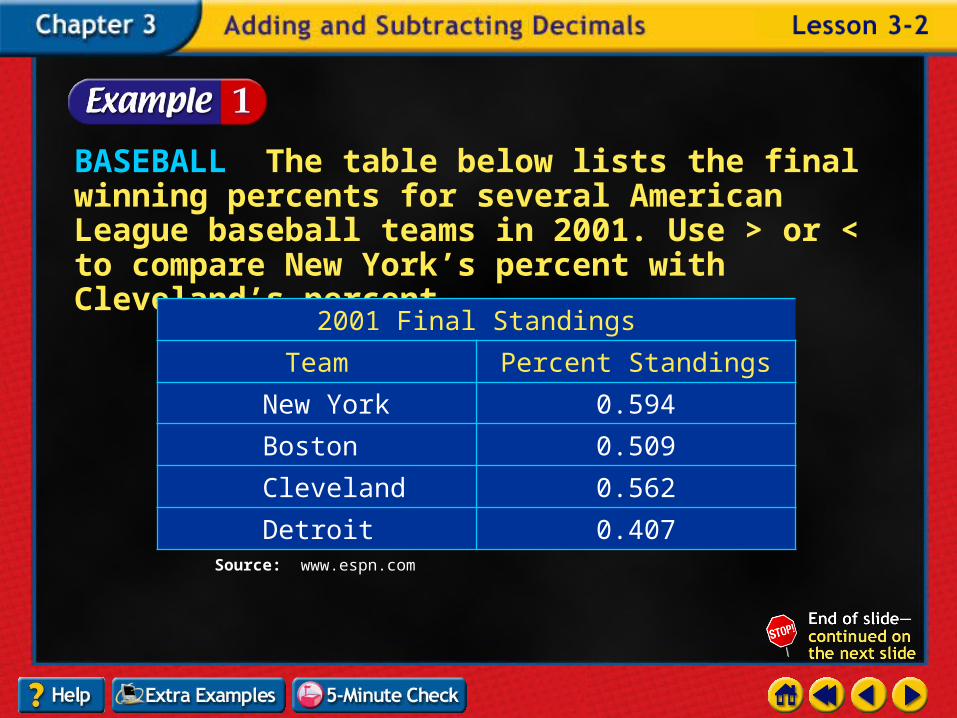
BASEBALL The table below lists the final winning percents for several American League baseball teams in 2001. Use > or < to compare New York’s percent with Cleveland’s percent.
Source: www.espn.com
2001 Final Standings
Team Percent Standings
New York 0.594
Boston 0.509
Cleveland 0.562
Detroit 0.407

Method 1 Use place value.
Since 9 > 6, 0.594 > 0.562.
First, line up the decimal points.
Then, starting at the left, find the first place the digits differ. Compare the digits.
New York:Cleveland:

Method 2 Use a number line.
Numbers to the right are greater than numbers to the left. Since 0.594 is to the right of 0.562, 0.594 > 0.562.
Answer: 0.594 > 0.562; New York had the higher winning percentage.

EXAMS In Mr. Smith’s math class, 29.65% of the students earned a grade of “A” at the end of the semester. In Mrs. Dempsey’s class, 29.85% of the students earned a grade of “A” at the end of the semester. Use > or < to compare the percent in Mr. Smith’s class with the percent in Mrs. Dempsey’s class.
Answer: 29.65% < 29.85%

Order 25, 25.1, 24.36, and 25.03 from least to greatest.
Answer: The order from least to greatest is 24.36, 25, 25.03, and 25.1.
25
25.1
24.36
25.03
First, line up
the decimal points.
Next, annex zerosso that each has thesame number ofdecimal places.
Finally, use placevalue to comparethe decimals.
25.00
25.10
24.36
25.03

Order 71, 71.04, 70.89, and 71.4 from least to greatest.
Answer: 70.89, 71, 71.04, 71.4

Example 1 Round Decimals
Example 2 Round Decimals
Example 3 Use Rounding to Solve a Problem

Round 7.601 to the nearest whole number.
Answer: To the nearest whole number, 7.601 rounds to 8.0.
On the number line, 7.6 is closer to 8.0 than 7.0.
7.601Then look at the digit to the right. Since 6 is greater than 5, add one to the underlined digit.
Underline the digit to be rounded. In this case, theones place.

Round 4.321 to the nearest whole number.
Answer: 4

Round 68.94 to the nearest tenth.
Answer: To the nearest tenth, 68.94 rounds to 68.9
On the number line, 68.94 is closer to 68.9 than 69.0.
68.94Then look at the digit to the right. Since the digit is 4, the digit 9 stays the same.
Underline the digit to be rounded. In this case, thedigit is in the tenths place.

Round 125.38 to the nearest tenth.
Answer: 125.4

EARNINGS In the year 2000, the average hourly wage for a U.S. production worker was $13.75. How much is this to the nearest dollar? The average weekly earnings were $474.38. What is this to the nearest dollar?
Answer: To the nearest dollar, the average hourly wage was $14.00.
To round to the nearest dollar, round to the nearest ones.
$13.75
Underline the digit in the ones place.
Then look at the digit to the right. The digit is greater than 5. So, add one to the underlined digit.

Answer: To the nearest dollar, the average weekly earnings were $474.00.
Round $474.38 to the nearest ones.
$474.38 $474.00 Since 3 is less than 5, the digit in the ones place remains the same.

CEREAL The price per ounce for a box of cereal is shown as $0.1275 on the tag in the grocery store. How much is this to the nearest cent?
Answer: $0.13

Example 1 Use Estimation to Solve Problems
Example 2 Use Estimation to Solve Problems
Example 3 Use Front-End Estimation
Example 4 Use Clustering

POPULATION The table below shows the population of the American colonies in 1770. Estimate the total population of North Carolina and South Carolina.
240.1
447.0
Population (thousands)Colony
Population (thousands)Colony
Connecticut 183.9 162.9New York
Delaware 35.5 197.2
New Hampshire 62.4
Georgia 23.4
Massachusetts 235.3 124.2
Maryland 202.6 58.2
New Jersey 117.4
Virginia
North Carolina
South Carolina
Rhode Island
Pennsylvania
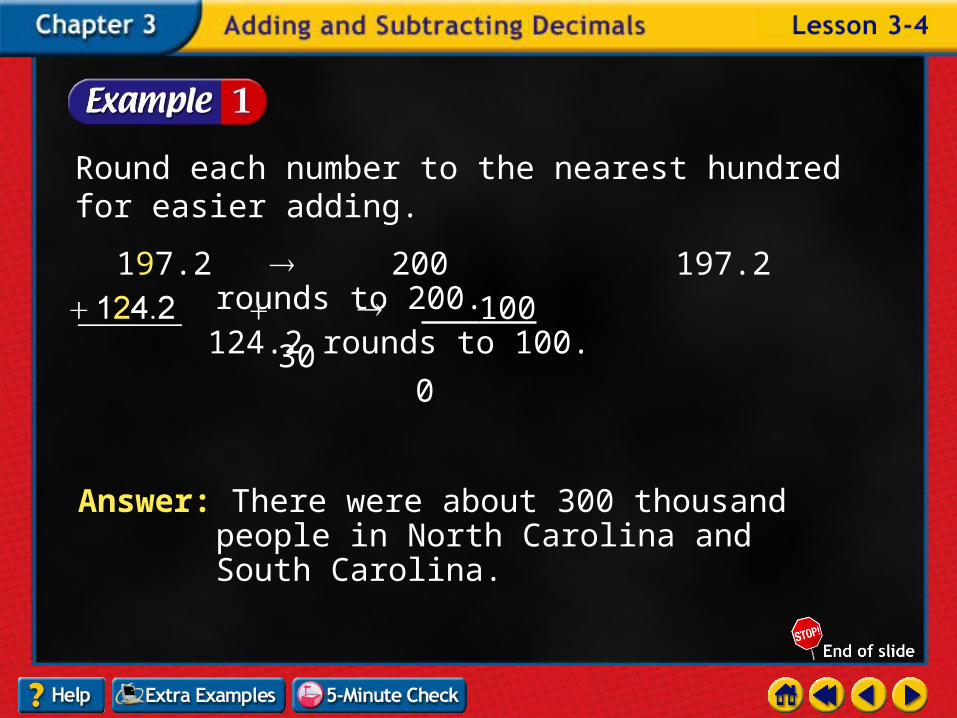
Answer: There were about 300 thousand people in North Carolina and South Carolina.
Round each number to the nearest hundred for easier adding.
197.2 200 197.2 rounds to 200.
300
100 124.2 rounds to 100.

POPULATION The table below shows the population of the American colonies in 1770. Estimate how many more people were in Massachusetts than in Connecticut.
Answer: about 60 thousand more people
240.1
447.0
Population (thousands)
Colony Population (thousands)
Colony
Connecticut 183.9 162.9New York
Delaware 35.5 197.2
New Hampshire 62.4
Georgia 23.4
Massachusetts 235.3 124.2
Maryland 202.6 58.2
New Jersey 117.4Virginia
North Carolina
South Carolina
Rhode IslandPennsylvania

POPULATION The table below shows the population of the American colonies in 1770. Estimate how many more people lived in Rhode Island than in Georgia in 1770.
240.1
447.0
Population (thousands)
Colony Population (thousands)
Colony
Connecticut 183.9 162.9New York
Delaware 35.5 197.2
New Hampshire 62.4
Georgia 23.4
Massachusetts 235.3 124.2
Maryland 202.6 58.2
New Jersey 117.4Virginia
North Carolina
South Carolina
Rhode IslandPennsylvania
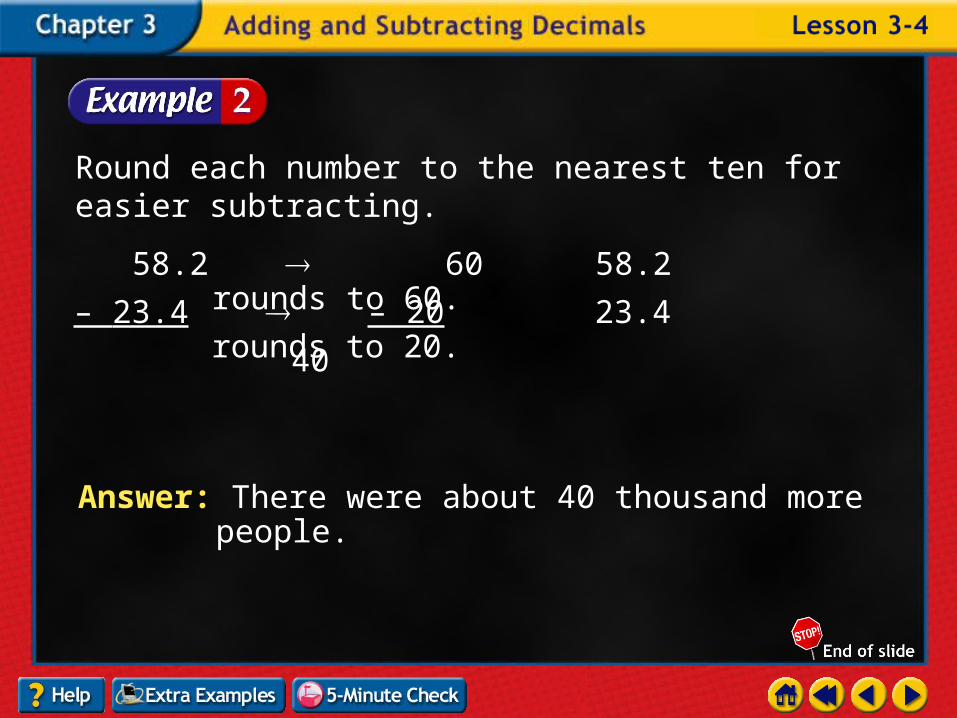
Answer: There were about 40 thousand more people.
Round each number to the nearest ten for easier subtracting.
58.2 60 58.2 rounds to 60.– 23.4 – 20 23.4 rounds to 20. 40
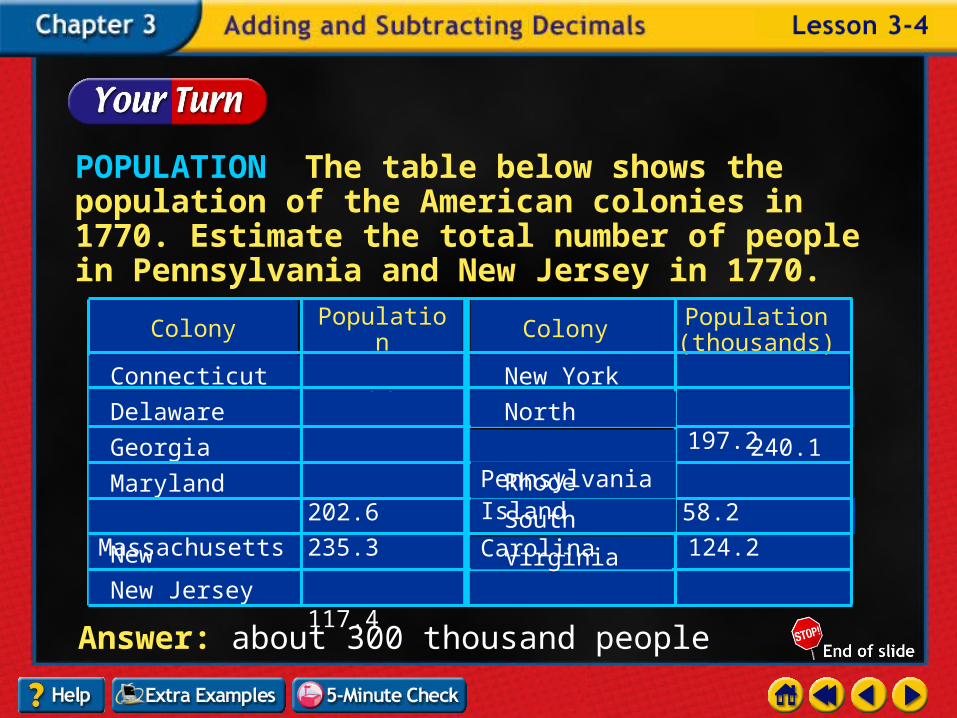
POPULATION The table below shows the population of the American colonies in 1770. Estimate the total number of people in Pennsylvania and New Jersey in 1770.
Answer: about 300 thousand people
240.1
447.0
Population (thousands)
Colony Population (thousands)
Colony
Connecticut 183.9 162.9New York
Delaware 35.5 197.2
New Hampshire 62.4
Georgia 23.4
Massachusetts 235.3 124.2
Maryland 202.6 58.2
New Jersey 117.4Virginia
North Carolina
South Carolina
Rhode IslandPennsylvania

Estimate using front-end estimation.
Answer: Using front-end estimation, is about 69.
Add the front digits. Then add the next digits.
6
69
+ 55.9 14.8
+ 55.9
14.8

Answer: 97
Estimate using front-end estimation.
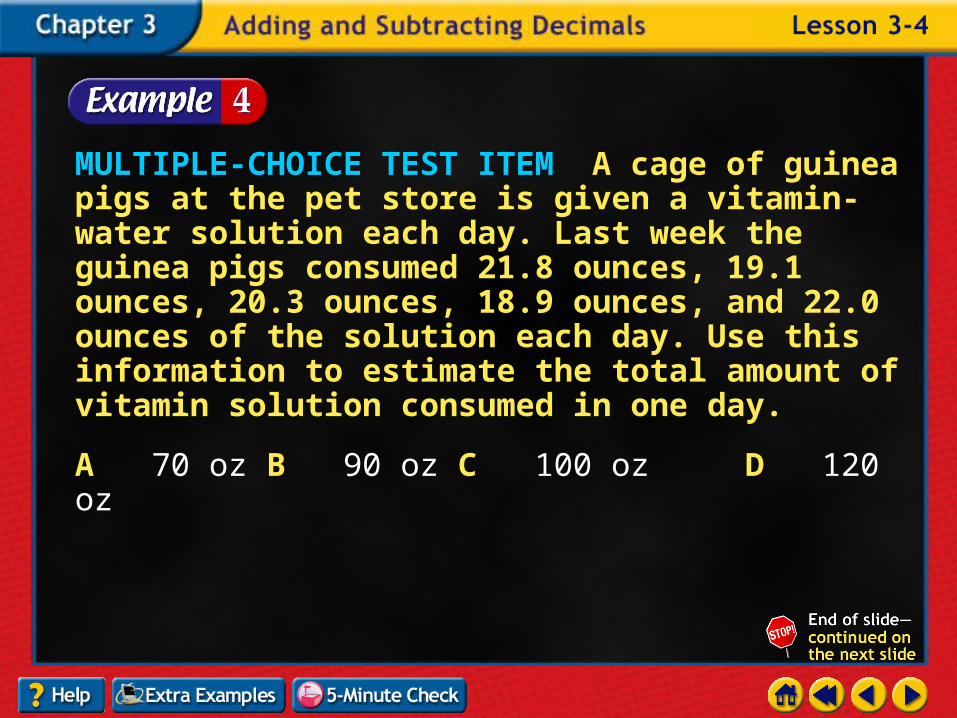
MULTIPLE-CHOICE TEST ITEM A cage of guinea pigs at the pet store is given a vitamin-water solution each day. Last week the guinea pigs consumed 21.8 ounces, 19.1 ounces, 20.3 ounces, 18.9 ounces, and 22.0 ounces of the solution each day. Use this information to estimate the total amount of vitamin solution consumed in one day.
A 70 oz B 90 oz C 100 oz D 120 oz

Read the Test Item The addends are all clustered around 20.
Answer: C
17.8 → 20
19.1 → 20
20.3 → 20
18.9 → 20
+ 22.0 → + 20
100
Solve the Test Item Multiplication is repeated addition. So, a good estimate is 5 20, or 100.

MULTIPLE-CHOICE TEST ITEM During the month of February, Jonathon spends $14.78 on gasoline the first week, $15.35 on gasoline during the second week, $15.94 on gasoline during the third week, and $14.07 on gasoline during the fourth week. Use this information to estimate the total amount Jonathon spent on gasoline during February.
Answer: C
A $35 B $50 C $60 D $100

Example 1 Add Decimals
Example 2 Subtract Decimals
Example 3 Annex Zeros
Example 4 Use Decimals to Solve a Problem
Example 5 Evaluate an Expression

Find the sum of 75.6 and 21.3.
Answer: The sum of 75.6 and 21.3 is 96.9.
Compare the answer to the estimate. Since 96.9 is close to 97, the answer is reasonable.
Estimate
96.9 Add as with whole numbers.
Line up the decimal points.75.6+ 21.3

Find the sum of 34.6 and 53.2.
Answer: 87.8
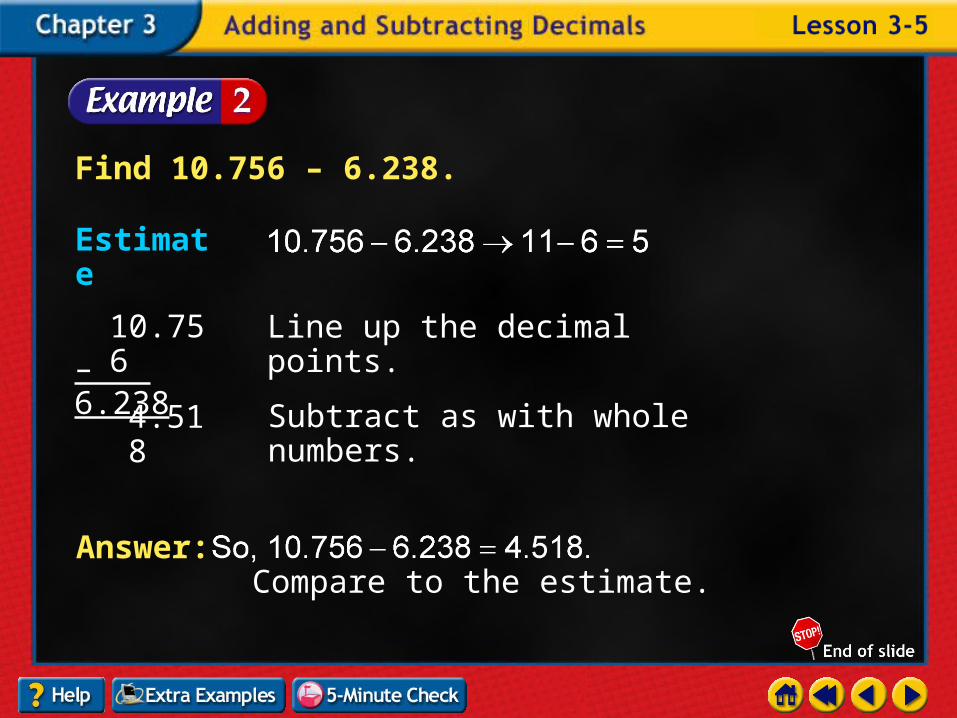
Find 10.756 – 6.238.
Estimate
Answer: Compare to the estimate.
Line up the decimal points.
4.518 Subtract as with whole numbers.
– 6.23810.756
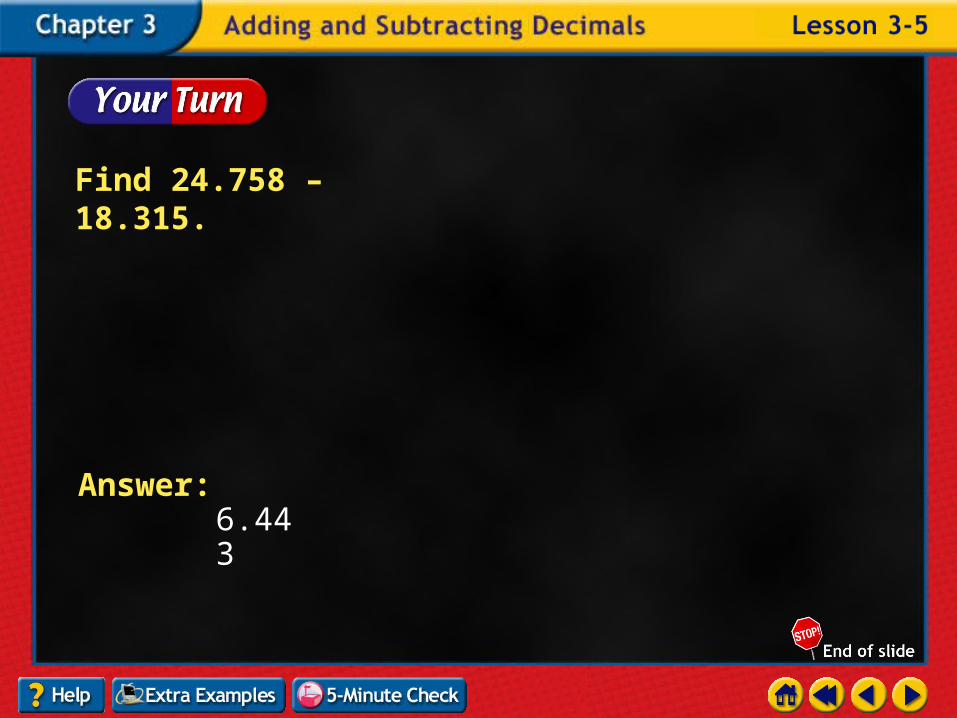
Find 24.758 – 18.315.
Answer: 6.443

Find 8 – 1.74.
Estimate
Answer: Compare to the estimate.
Annex zeros.8.00
– 1.746.26

Find 9 – 3.28.
Answer: 5.72
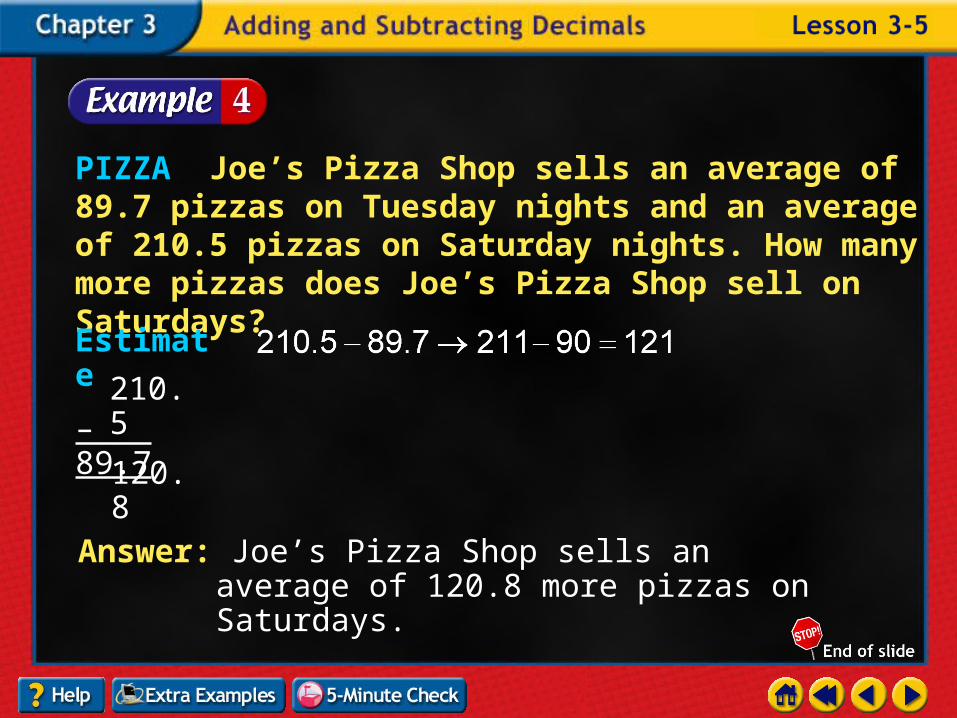
PIZZA Joe’s Pizza Shop sells an average of 89.7 pizzas on Tuesday nights and an average of 210.5 pizzas on Saturday nights. How many more pizzas does Joe’s Pizza Shop sell on Saturdays?
Answer: Joe’s Pizza Shop sells an average of 120.8 more pizzas on Saturdays.
Estimate
210.5– 89.7
120.8
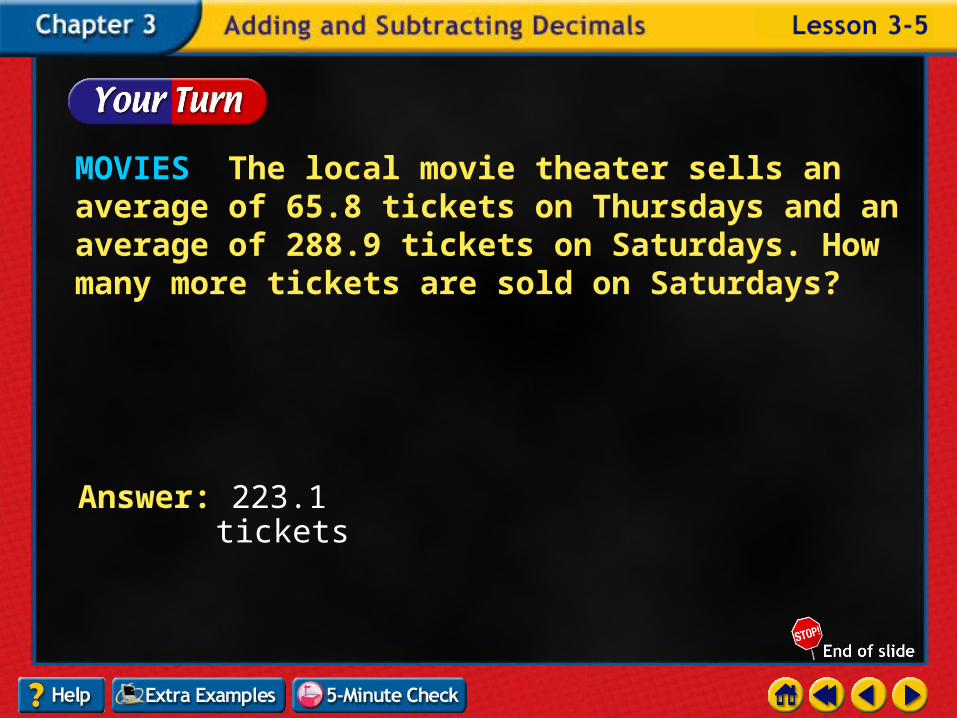
MOVIES The local movie theater sells an average of 65.8 tickets on Thursdays and an average of 288.9 tickets on Saturdays. How many more tickets are sold on Saturdays?
Answer: 223.1 tickets

Answer: The value is 5.95. This value is close to the estimate. So, the answer is reasonable.
ALGEBRA
Replace a with 10.75 and b with 4.8.
Estimate
10.75– 4.80
Line up the decimal points.Annex a zero.
5.95 Subtract as with whole numbers.
Answer: 70.13
ALGEBRA


Explore online information about the information introduced in this chapter.
Click on the Connect button to launch your browser and go to the Mathematics: Applications and Concepts, Course 1 Web site. At this site, you will find extra examples for each lesson in the Student Edition of your textbook. When you finish exploring, exit the browser program to return to this presentation. If you experience difficulty connecting to the Web site, manually launch your Web browser and go to www.msmath1.net/extra_examples.

Click the mouse button or press the Click the mouse button or press the Space Bar to display the answers.Space Bar to display the answers.


Click the mouse button or press the Click the mouse button or press the Space Bar to display the answers.Space Bar to display the answers.
Click the mouse button or press the Click the mouse button or press the Space Bar to display the answers.Space Bar to display the answers.

Click the mouse button or press the Click the mouse button or press the Space Bar to display the answers.Space Bar to display the answers.

Click the mouse button or press the Click the mouse button or press the Space Bar to display the answers.Space Bar to display the answers.

End of Custom Shows
WARNING! Do Not RemoveThis slide is intentionally blank and is set to auto-advance to end
custom shows and return to the main presentation.