Welcome to Cubic’s 2019 Annual Shareholder Meeting Annual... · 2019-02-21 · within the meaning...
13
Welcome to Cubic’s 2019 Annual Shareholder Meeting February 18, 2019
Transcript of Welcome to Cubic’s 2019 Annual Shareholder Meeting Annual... · 2019-02-21 · within the meaning...

Welcome to Cubic’s 2019 Annual Shareholder MeetingFebruary 18, 2019

2Safe Harbor & DisclosuresThis presentation contains statements that relate to future events and expectations and as such constitute forward-looking statementswithin the meaning of the Private Securities Litigation Reform Act of 1995. Any statements about our expectations, beliefs, plans,objectives, assumptions or future events or our future financial and/or operating performance are not historical and may be forward-looking. These statements are often, but not always, made through the use of words or phrases such as “may,” “will,” “anticipate,”“estimate,” “plan,” “project,” “continuing,” “ongoing,” “expect,” “believe,” “intend,” “predict,” “potential,” “opportunity” and similar words orphrases or the negatives of these words or phrases. These statements involve risks, estimates, assumptions and uncertainties, includingthose discussed in “Risk Factors” in the Company’s Form 10-K for the year ended September 30, 2018, that could cause actual results todiffer materially from those expressed in these statements.
Because the risk factors referred to above could cause actual results or outcomes to differ materially from those expressed in anyforward-looking statements made by us or on our behalf, you should not place undue reliance on any forward-looking statements.Further, any forward-looking statement speaks only as of the date on which it is made, and we undertake no obligation to update anyforward-looking statement to reflect events or circumstances after the date on which the statement is made or to reflect the occurrence ofunanticipated events, or combination of factors, may cause actual results to differ materially from those contained in any forward-lookingstatements.
This presentation also includes non-GAAP financial measures as that term is defined in Regulation G. Non-GAAP financial measuressupplement our GAAP disclosures and should not be considered an alternative to the GAAP measure. Reconciliations to the mostdirectly comparable GAAP financial measures can be found in the Appendix to this presentation. Cubic has not provided a reconciliationof forward-looking financial measures such as Adjusted EBITDA to the most directly comparable financial measures prepared inaccordance with GAAP because Cubic is unable to quantify certain amounts that would be required to be included in the GAAPmeasures without unreasonable efforts, and Cubic believes such reconciliations would imply a degree of precision that would beconfusing or misleading to investors.

Global Provider of Market-leading, Innovative Solutions3
Transportation SystemsLeading integrator of payment systems and
intelligent travel solutions
Mission SolutionsBest-in-class provider of
expeditionary C4ISR solutions
Defense TrainingTop provider of
defense training systems
56% of sales 17% of sales 27% of sales
Sales$1.2b
Employees5,600
Backlog90%+ of sales
Prime contractor$4.1b
>3x sales
CustomersBlue chip customers
Note: percentages based on FY2018 sales C4ISR = Command, Control, Communications, Computers, Intelligence, Surveillance and Reconnaissance

Cubic is a technology-driven, market-leading global provider of innovative, mission-critical solutions that reduce congestion and increase operational readiness and effectiveness through increased situational understanding.
Cloud ComputingSecure NetworkCommunications
Algorithms / Simulation
Data Visualization
Cyber Management
Power Management
Instrumentation
Our Common Mission and Technologies4

5Goal 2020 Growth Catalysts Achieved
Investments paying off with all six catalysts achieved in Fiscal 2018
$1.8B new business won (with ~$2B potential follow-on) while building growth platform

6
Vertical integration of intersection management enables Cubic to optimize arterial intersections and roads based on broader inbound regional traffic from highways and to give priority to shared modes
Trafficware brings:Fills technology gaps (e.g. PODs,
adaptive signal control, Infrastructure-2-VehicIe)Diverse U.S. customer base
(access to small/mid market)Vertically integrates Cubic into
intersections and arterial roads management
Significant Advancement on Operations & Analytics Pillar of Cubic’s NextCity strategy
• Intersection video detection
• Unmatched algorithm accuracy
• Tracks vehicles and cyclists through the intersection
• Fully integrated suite of intelligent intersection technology
• Most advanced offering
• Smart infrastructure for smart cars
• Regional / highways coordination and congestion management
• First of its kind ICMP (Sydney)
GRIDSMART brings:Fills technology gaps (e.g.
computer vision, traffic analytics) Best-of-breed for out-of-
pavement detection Unique customersInternational capability
Cubic brings:NextCity visionGlobal footprintLarge city presenceBroader transportation portfolioRegional transportation and
congestion management platform
Growth synergies across up-selling, cross-selling and international expansion in a global ITS market of ~$10 billion with a CAGR >20%
$560m
$900m
2018 2023P
The most advanced solution for intersection traffic detection and response
10% CAGRUS ITM market
Cities need smart infrastructure
solutions to manage congestion, improve safety on the road, and to prepare for a
more complex, connected world
Demand for intelligent solutions and concerted effort to connect vehicles to intersectionsDetection Adaptive Traffic Mgmt.
Traffic Planning

Delivering Strong Growth
Fiscal 2018: Record backlog at $4.1B (3.4x annual revenue), up $1.5B YoY
Fiscal 2018: Record Sales (increased 9%); Adj. EBITDA increased 20% YoY
Fiscal 2019P: Strong organic growth; enhanced with cash EPS accretive acquisitions
Raised $228m in public offering to de-lever and provide flexibility to support our strategy
FY17 FY18 FY19Guidance
FY17 FY18 FY19Guidance
Sales ($m) Adj. EBITDA ($m)
$1,203$1,108
$104.6$87.5
~$1,438
(at midpoint) (at midpoint)
~$150
Note: financial results reflect continuing operations
7

Goal 20208
1 2019P represents the midpoint of fiscal 2019 guidance.2 MTA = Metropolitan Transportation Authority, MBTA = Massachusetts Bay Transportation Authority, T2C2 = Transportable Tactical Command Communications, JALN = Joint Aerial Layer Network, SLATE = Secure Live, Virtual, Constructive Advanced Training Environment, LTE = Long-term evolution, ISR = Intelligence, Surveillance and Reconnaissance3 Adj. EBITDA is a non-GAAP financial measure. Reconciliations to the most directly comparable GAAP financial measurers can be found in the Appendix to this presentation
7.9%8.7%
~10.4%
11% to 12.5%
$1,108 $1,203
~$1,550 to$2,000
$1,450to
$1,500
Sales $mPotential M&A
2017 2018 Goal 2020
Adj. EBITDA3 Margin
Organic Growth Drivers
New York MTA2
Boston MBTA2
Brisbane Bay Area Mobile and
adjacencies
T2C22
FIRSTNET JALN2
Airborne ISR2
SLATE2
LTE2 on the move Virtual training
CTS CMS CGD
Margin Improvement DriversSupply Chain
Consolidation of manufacturing
Reduction in suppliers Continuous
improvement
Segment Examples
Discipline during bid and execution
Product model in CTS Low cost engineering
SG&A
Centralization of support functions
Shared Services Benchmarks and
rationalization
2019P1 2017 2018 Goal 20202019P1
$1,438
$150$1,364
Implied margin at midpoint
Trafficware + GRIDSMART acquisition impact 11% CAGR
organic+19%YoY

Enable US Army Network Transformation
Increase role in Airborne ISR
Cross domain and multi-modal training offering
Training as a Service
AI powered Adaptive Training Systems
Capitalize on AFC competitive position, expand in mid-market
Leverage mobile app launches to further monetize NextCity
Capture adjacencies of congestion management and charging
Next Wave of Value Creation
Establish key position in Joint Aerial Layer Network Architecture
Extend into new and attractive markets leveraging our core capabilities
Leverage new digitally enabled business models to drive top quartile returns
Expand leadership in core positions with a pivot to digital business models
Transform our business• From programs to digital platforms• From data collection to data-driven decisions• From one-time delivery to recurring revenue
Leverage One Cubic platforms
Going Forward
Building technology-driven, market-leading platforms
CTS
CMS
CGD
Mid-term
9

Key Investment Highlights10
Robust Growth Profile Supported by Significant Backlog and Recent Wins
Proven Management Team With Deep Industry and Operational Experience
Technology-driven, Market-leading Global Provider of Innovative, Mission-critical Solutions
Enhanced Portfolio and Disciplined Capital Allocation Position Cubic for Growth and Shareholder Value Creation
Enriching Products with Information & Analytics to Provide Keener Insights to Customers
Transformative Innovations and Acquisitions to Advance Strategic Priorities

Appendix
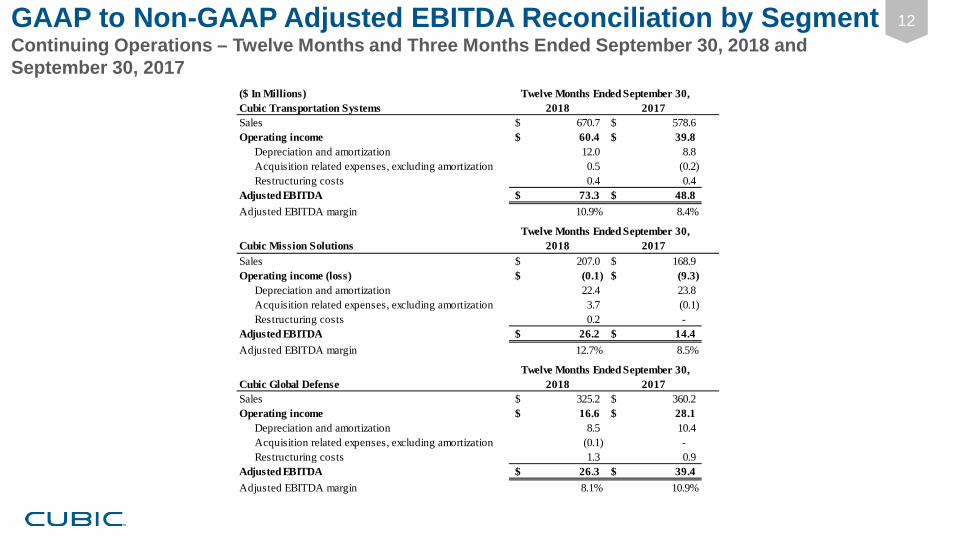
12GAAP to Non-GAAP Adjusted EBITDA Reconciliation by SegmentContinuing Operations – Twelve Months and Three Months Ended September 30, 2018 and September 30, 2017
($ In Millions)Cubic Transportation Systems 2018 2017Sales 670.7$ 578.6$ Operating income 60.4$ 39.8$ Depreciation and amortization 12.0 8.8 Acquisition related expenses, excluding amortization 0.5 (0.2) Restructuring costs 0.4 0.4 Adjusted EBITDA 73.3$ 48.8$ Adjusted EBITDA margin 10.9% 8.4%
Cubic Mission Solutions 2018 2017Sales 207.0$ 168.9$ Operating income (loss) (0.1)$ (9.3)$ Depreciation and amortization 22.4 23.8 Acquisition related expenses, excluding amortization 3.7 (0.1) Restructuring costs 0.2 - Adjusted EBITDA 26.2$ 14.4$ Adjusted EBITDA margin 12.7% 8.5%
Cubic Global Defense 2018 2017Sales 325.2$ 360.2$ Operating income 16.6$ 28.1$ Depreciation and amortization 8.5 10.4 Acquisition related expenses, excluding amortization (0.1) - Restructuring costs 1.3 0.9 Adjusted EBITDA 26.3$ 39.4$ Adjusted EBITDA margin 8.1% 10.9%
Twelve Months Ended September 30,
Twelve Months Ended September 30,
Twelve Months Ended September 30,

13GAAP to Non-GAAP EBITDA & Adjusted EBITDA ReconciliationContinuing Operations – Twelve Months and Three Months Ended September 30, 2018 and September 30, 2017
($ In Millions)Cubic Consolidated 2018 2017Sales 1,202.9$ 1,107.7$ Net income (loss) from continuing operations attributable to Cubic 8.1$ (25.7)$ Noncontrolling interest in loss of VIE (0.3) - Provision for income taxes 7.1 14.6 Interest expense, net 8.8 14.1 Other non-operating expense (income), net 0.7 (0.4)
Operating income 24.4 2.6 Depreciation and amortization 46.6 48.0 Other non-operating (expense) income, net (0.7) 0.4 EBITDA 70.3 51.0 Acquisition related expenses, excluding amortization 4.5 (0.2) ERP/Supply chain initiatives 24.1 34.4 Restructuring costs 5.0 2.3 Loss on sale of fixed assets - 0.4 Other non-operating expense (income), net 0.7 (0.4)
Adjusted EBITDA 104.6$ 87.5$ Adjusted EBITDA margin 8.7% 7.9%
Twelve Months Ended September 30,