Welcome ALSO Holding AG Annual Results Media Conference 2014 · ALSO Holding AG Annual Results...
26
BMK, February 17, 2014 1 Welcome ALSO Holding AG Annual Results Media Conference 2014
Transcript of Welcome ALSO Holding AG Annual Results Media Conference 2014 · ALSO Holding AG Annual Results...

BMK, February 17, 2014 1
Welcome
ALSO Holding AG
Annual Results Media Conference 2014
Disclaimer
This presentation contains forward-looking statements or opinions
which are based on current assumptions and forecasts of the ALSO
management. Known and unknown risks, uncertainties, and other
factors could lead to material differences between the forward-looking
statements made here and the actual development, in particular the
results, financial situation, and performance of our Group. The Group
accepts no responsibility for updating these forward-looking
statements or adapting them to future events or developments.
BMK, February 17, 2014 2
Agenda
BMK, February 17, 2014 3
1 Financial Year 2013
2 Financial Data
3 Summary and Outlook
4 Questions and Answers
G. Möller-Hergt/R. Retzko

General Situation
BMK, February 17, 2014 4 Fiscal Year 2013
2012 2013
Economy
World (GPD)
Euro zone (GDP)
+2.7%
-0.6%
+2.4%
-0.4%
ICT distribution market*
In countries relevant for ALSO
Commercial sector (B2B)
Consumer sector (B2C)
-0.2%
-1.5%
+3.5%
-1.7%
+0.1%
-6.5%
ALSO
Net sales
Market share*
EUR 6.3 bn
24.6%
EUR 6.5 bn
25.3%
* Source: CONTEXT Distribution Panel 2013 (excl. Baltics and NL)

ICT Distribution Market* 2013: 20.4 bn. euros (-1.7%)
Market composition by product category
BMK, February 17, 2014 5
5.2% 2.7%
14.5%
7.7%
3.7%
5.4%
5.7%
7.6% 4.0%
19.7%
6.8%
17.0%
*Source: CONTEXT Distribution Panel 2013 (excl. Baltics and NL) ** Growth 2013 compared to 2012
Fiscal Year 2013
Desktops -1**
Servers -11%**
Notebooks -15%**
Tablets +32%**
Smartphones +16%**
Components +3%**
Printing -4%**
Consumables -1%** Displays -9%**
Others -2%**
Disk storage -6%**
Software +2%**
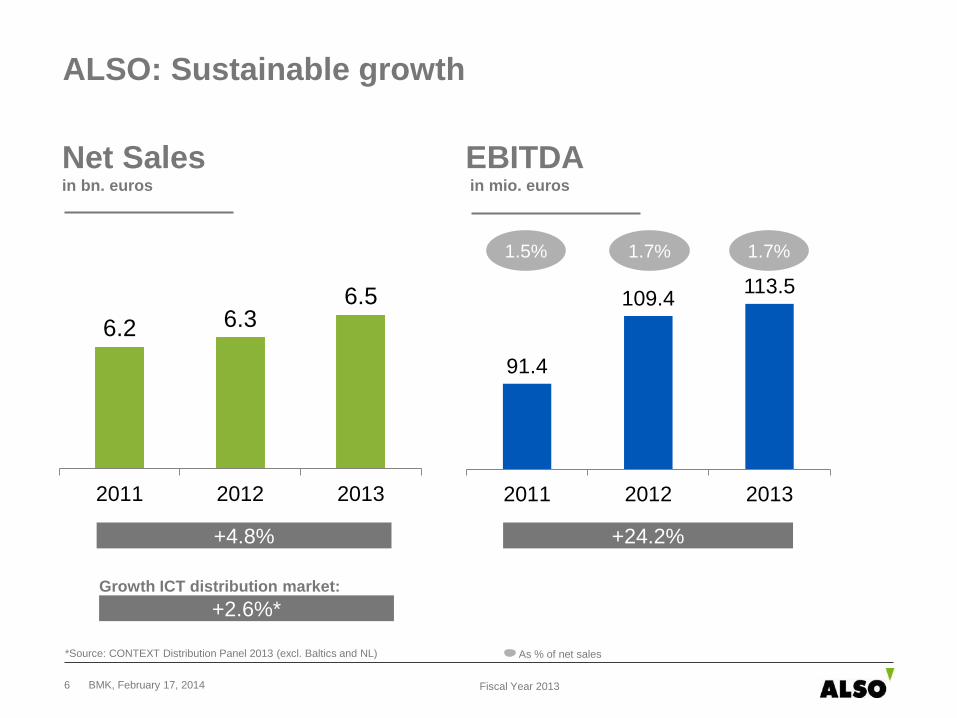
ALSO: Sustainable growth
BMK, February 17, 2014 6
6.2 6.3 6.5
2011 2012 2013
1.7% 1.7% 1.5%
91.4
109.4 113.5
2011 2012 2013
Net Sales EBITDA in bn. euros in mio. euros
As % of net sales
Fiscal Year 2013
*Source: CONTEXT Distribution Panel 2013 (excl. Baltics and NL)
+4.8% +24.2%
Growth ICT distribution market:
+2.6%*
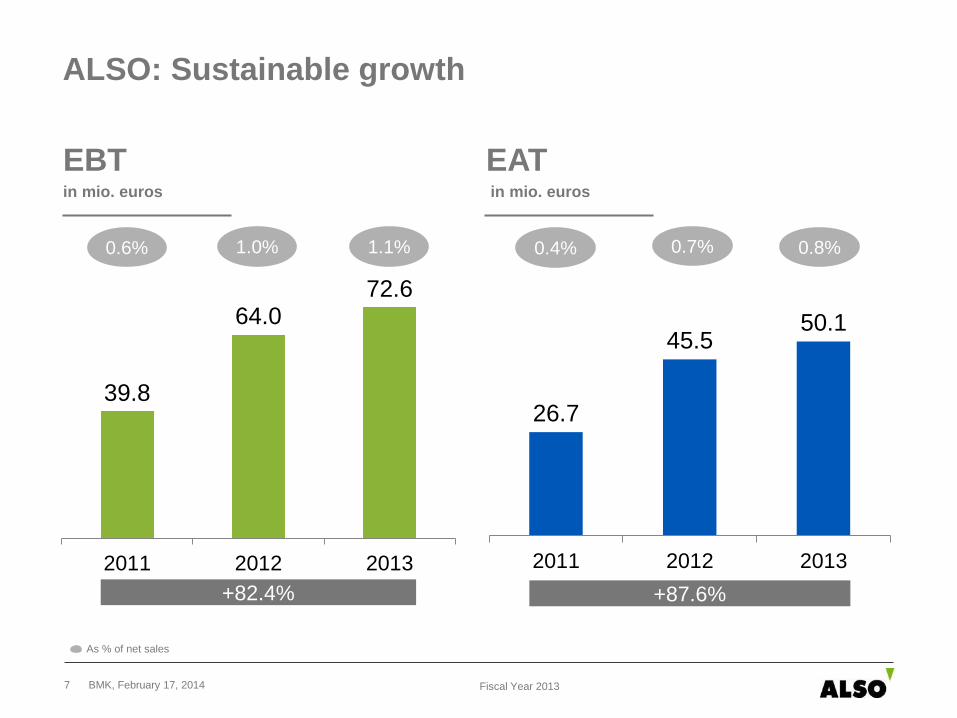
ALSO: Sustainable growth
BMK, February 17, 2014 7
39.8
64.0 72.6
2011 2012 2013
26.7
45.5 50.1
2011 2012 2013
0.7% 0.8%
EBT EAT in mio. euros in mio. euros
+82.4% +87.6%
1.1% 1.0% 0.6% 0.4%
Fiscal Year 2013
As % of net sales

Sustainable increase for the shareholders
BMK, February 17, 2014 8
0.7
1.2 1.4*
2011 2012 2013
2.72
4.27 4.81
2011 2012 2013
Dividend per share Earnings per share in CHF in CHF
*Proposed
Fiscal Year 2013
+100% +76.8%

BMK, 17. February 2014 9
Significant improvement in results at the same time as
investment in the future
113.5
109.4
10.6
1.8
-8.3
EBITDA2012
Grossmargin
Personnelexpenses
Operatingexpenses
EBITDA2013
Maintain: Market share slightly improved
Product portfolio retained
Optimize: PIP developed further
Reinvent: Decoupling Supply, Solutions, and Services
Digital distribution, cloud, web-Shop
Enhance: Acquisitions in DE and NL
Digital distribution ESD, POSA, ALSO Digital
Optimize: SAP conversion in LT and LV completed
Business Intelligence Tool pursued
POP introduced in DE
Reinvent: Decoupling Supply, Solutions, and Services
Enhance: Acquisitions in DE and NL
Enhance: Acquisitions in DE and NL
Digital distribution ESD, POSA, ALSO Digital
Optimize: SAP conversion completed in LT and LV
Business Intelligence Tool pursued
POP in DE introduced, PIP pursued
In mio. euros
Fiscal Year 2013
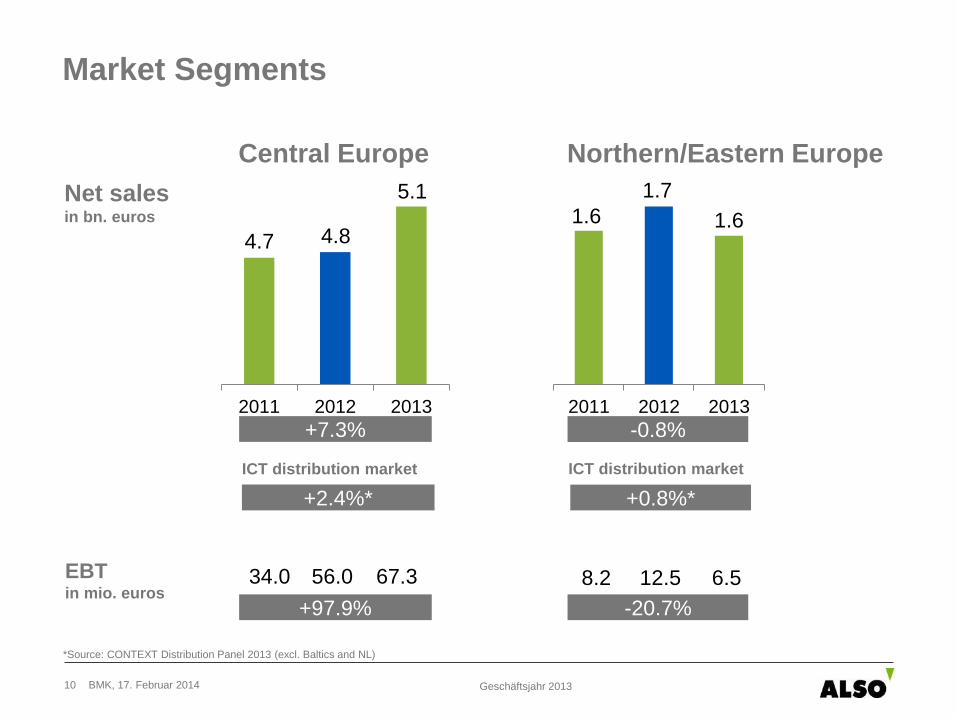
Market Segments
Central Europe Northern/Eastern Europe
BMK, 17. Februar 2014 10 Geschäftsjahr 2013
ICT distribution market ICT distribution market
*Source: CONTEXT Distribution Panel 2013 (excl. Baltics and NL)
+2.4%* +0.8%*
2011 2012 2013
4.7
+7.3%
4.8
5.1
-0.8% 2011 2012 2013
1.6
1.7
1.6
8.2 12.5 6.5 34.0 56.0 67.3
+97.9% -20.7%
EBT in mio. euros
Net sales in bn. euros
Agenda
BMK, February 17, 2014 11
1 Financial Year 2013
2 Financial Data
3 Summary and Outlook
4 Questions and Answers

BMK, February 17, 2014 12
EUR mio. 2012 2013
Net sales 6 297.0 100.0 % 6 532.6 100.0 %
Gross margin 418.0 6.6 % 428.6 6.6 %
Operating expenses -308.6 -4.9 % -315.1 -4.9 %
EBITDA 109.4 1.7 % 113.5 1.7 %
Depreciation and amortization -25.9 -0.4 % -26.1 -0.4 %
Operating profit (EBIT) 83.5 1.3 % 87.4 1.3 %
Financial result -19.5 -0.3 % -14.8 -0.2 %
Income taxes -18.5 -0.3 % -22.5 -0.3 %
Net profit Group (EAT) 45.5 0.7% 50.1 0.8 %
Consolidated statement of comprehensive income
Financial Data

BMK, February 17, 2014 13
EUR mio. 12.31.2012 12.31.2013
Current assets 1 082.0 81 % 1 251.7 84 %
Non-current assets 254.0 19 % 241.1 16 %
Total assets 1 336.0 100 % 1 492.8 100 %
Current liabilities 869.6 65 % 932.2 62 %
Non-current liabilities 77.6 6 % 139.3 10 %
Equity 388.8 29 % 421.3 28 %
Total liabilities and equity 1 336.0 100 % 1 492.8 100 %
Consolidated statement of financial position
Financial Data
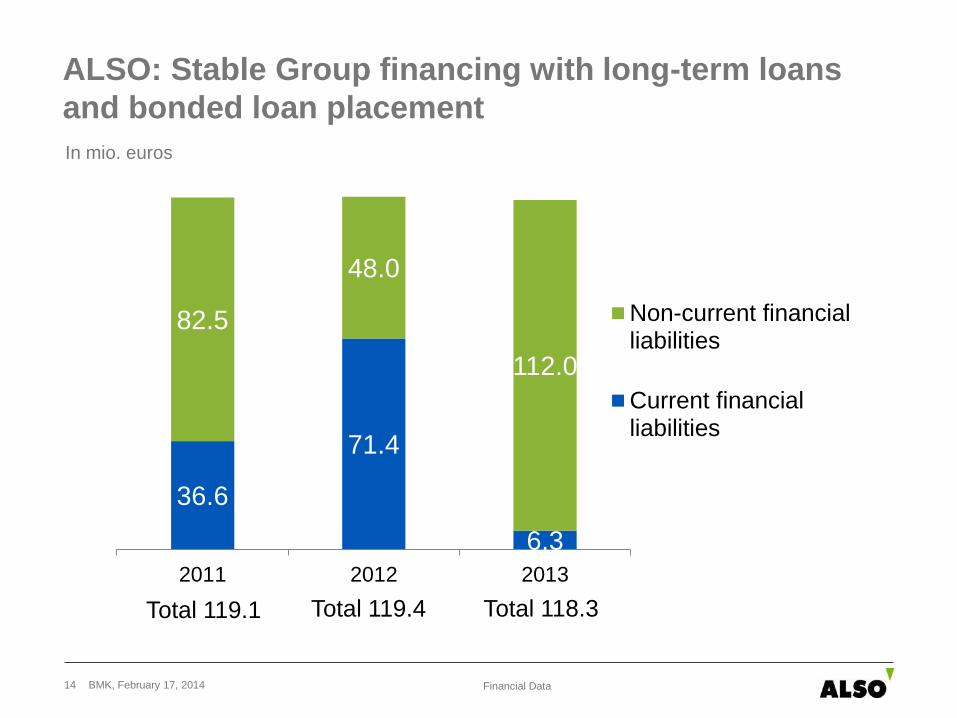
ALSO: Stable Group financing with long-term loans
and bonded loan placement
36.6
71.4
6.3
82.5
48.0
112.0
2011 2012 2013
Non-current financialliabilities
Current financialliabilities
BMK, February 17, 2014 14
Total 118.3 Total 119.4
In mio. euros
Financial Data
Total 119.1

BMK, February 17, 2014 15
Consolidated statement of financial position
Changes in liabilities 2012/2013
1 336.0
1 492.8
120.4
32.5
5.0
-1.1
2012 Trade payables Financial liabilities Equity Others 2013
In mio. euros
Financial Data
BMK, February 17, 2014 16
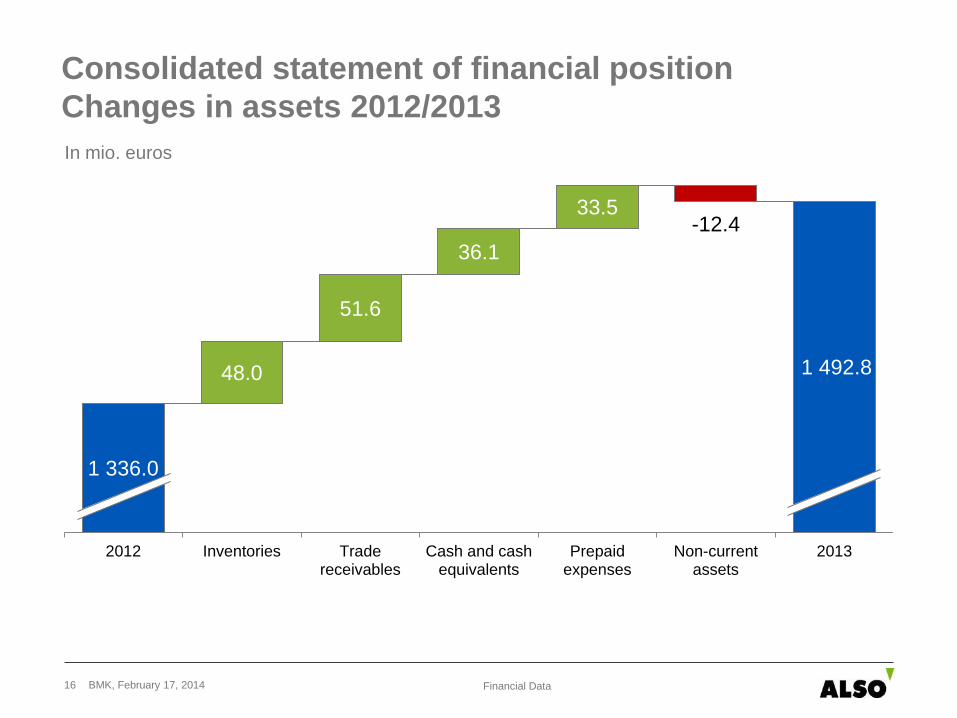
Consolidated statement of financial position
Changes in assets 2012/2013
1 336.0
1 492.8 48.0
51.6
36.1
33.5 -12.4
2012 Inventories Tradereceivables
Cash and cashequivalents
Prepaidexpenses
Non-currentassets
2013
In mio. euros
Financial Data
BMK, February 17, 2014 17
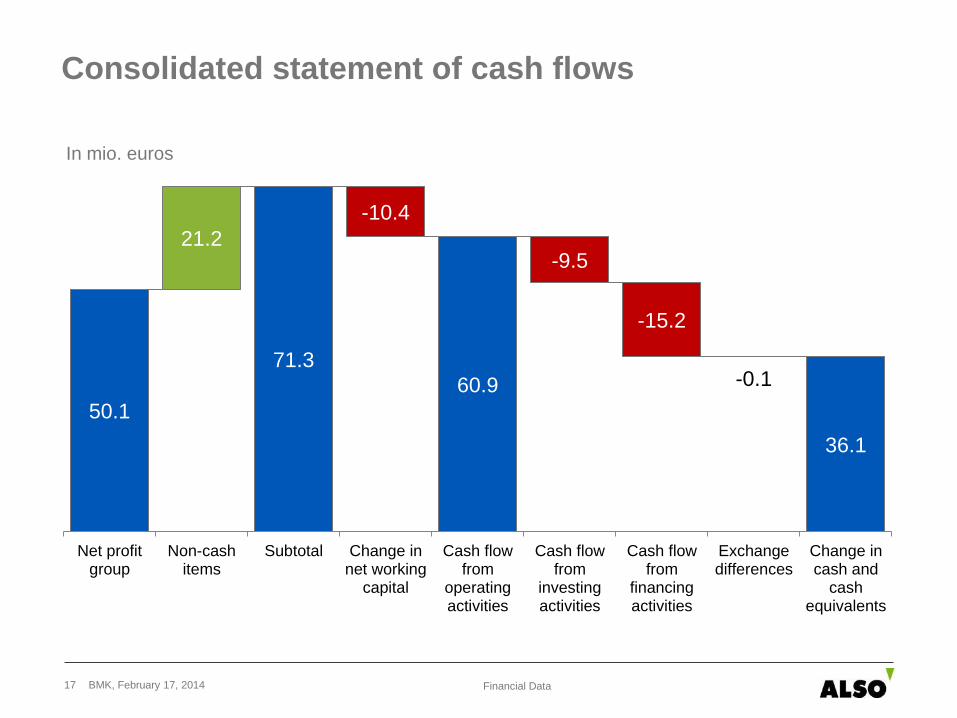
Consolidated statement of cash flows
50.1
71.3
60.9
36.1
21.2
-10.4
-9.5
-15.2
-0.1
Net profitgroup
Non-cashitems
Subtotal Change innet working
capital
Cash flowfrom
operatingactivities
Cash flowfrom
investingactivities
Cash flowfrom
financingactivities
Exchangedifferences
Change incash and
cashequivalents
In mio. euros
Financial Data
Agenda
BMK, February 17, 2014 18
1 Financial Year 2013
2 Financial Data
3 Summary and Outlook
4 Questions and Answers

MORE: the core strategy
BMK, February 17, 2014 19 Summary and Outlook
BMK, February 17, 2014 20
ALSO Outlook: MORE
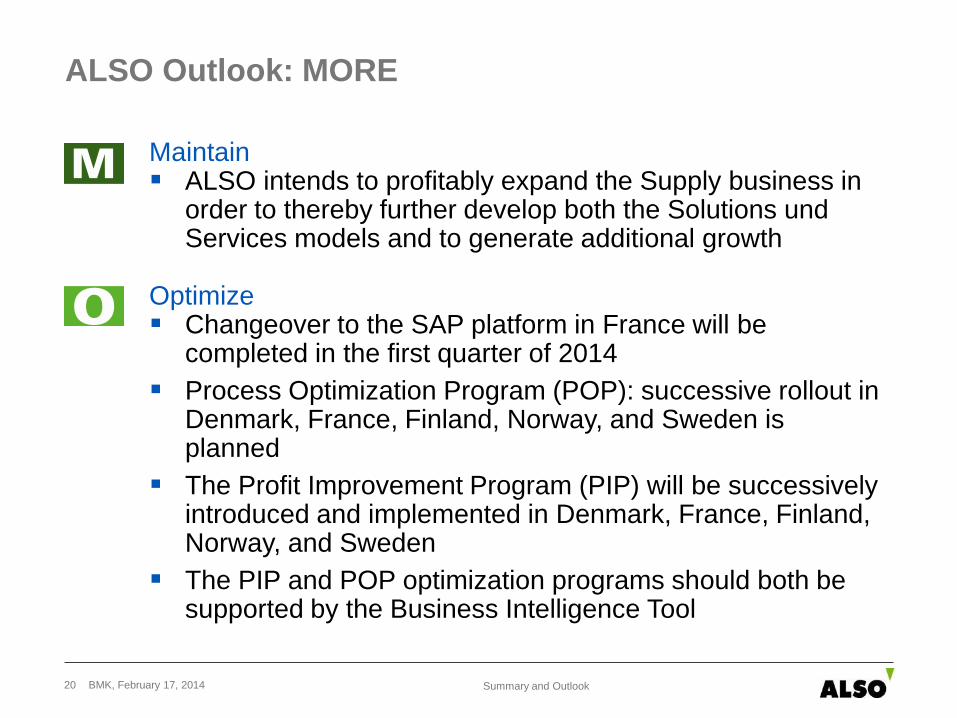
Maintain ALSO intends to profitably expand the Supply business in
order to thereby further develop both the Solutions und Services models and to generate additional growth
Optimize Changeover to the SAP platform in France will be
completed in the first quarter of 2014
Process Optimization Program (POP): successive rollout in Denmark, France, Finland, Norway, and Sweden is planned
The Profit Improvement Program (PIP) will be successively introduced and implemented in Denmark, France, Finland, Norway, and Sweden
The PIP and POP optimization programs should both be supported by the Business Intelligence Tool
Summary and Outlook
BMK, February 17, 2014 21
ALSO Outlook: MORE
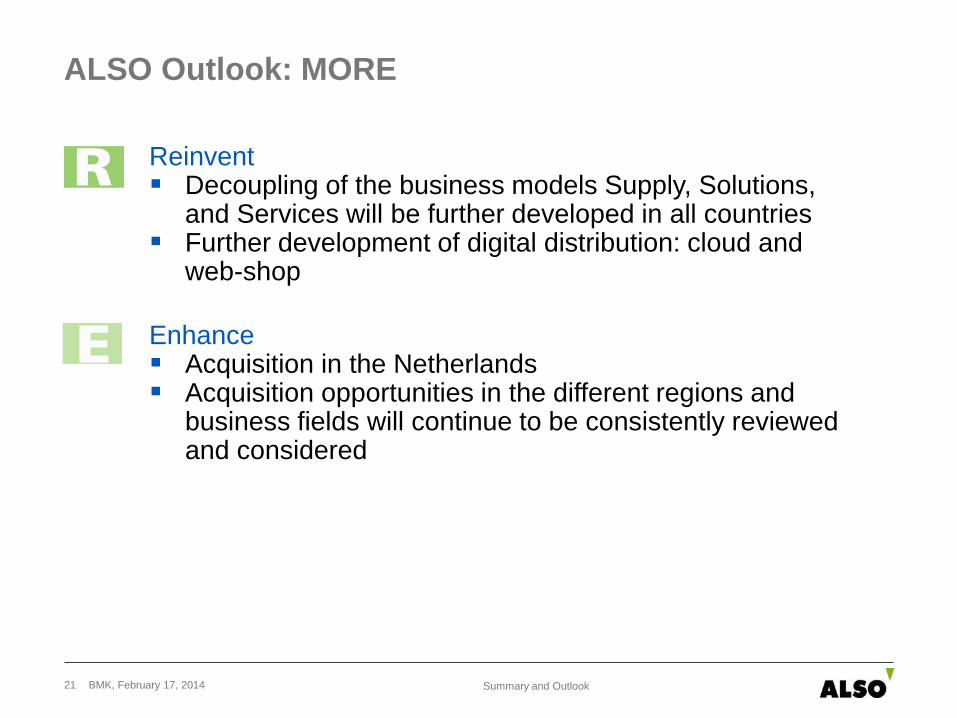
Reinvent Decoupling of the business models Supply, Solutions,
and Services will be further developed in all countries Further development of digital distribution: cloud and
web-shop
Enhance Acquisition in the Netherlands Acquisition opportunities in the different regions and
business fields will continue to be consistently reviewed and considered
Summary and Outlook
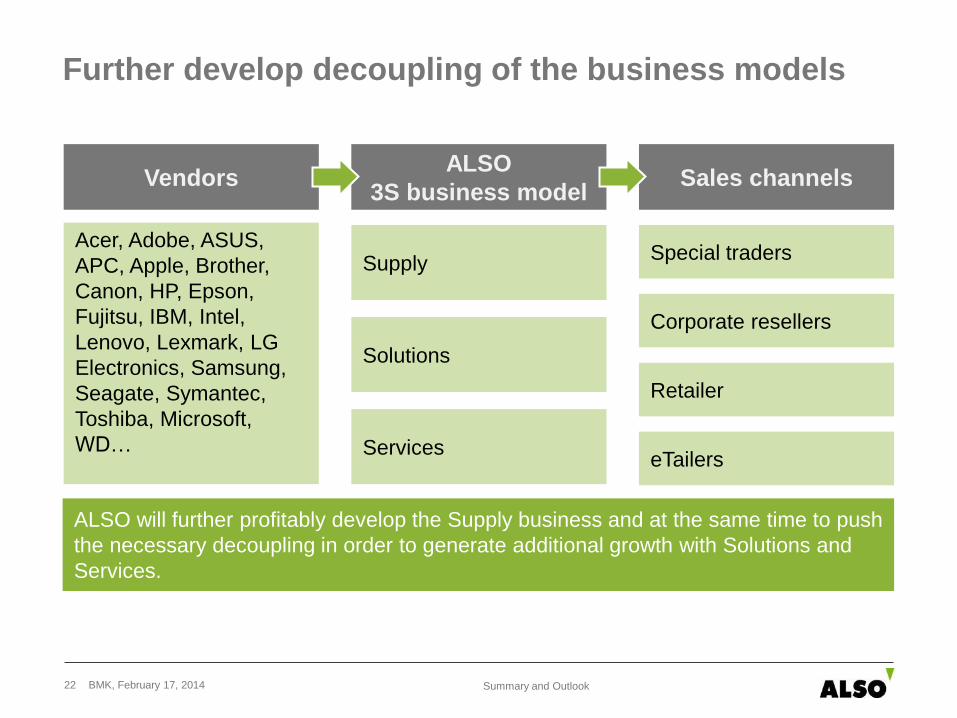
Further develop decoupling of the business models
ALSO will further profitably develop the Supply business and at the same time to push
the necessary decoupling in order to generate additional growth with Solutions and
Services.
ALSO
3S business model Sales channels
Acer, Adobe, ASUS,
APC, Apple, Brother,
Canon, HP, Epson,
Fujitsu, IBM, Intel,
Lenovo, Lexmark, LG
Electronics, Samsung,
Seagate, Symantec,
Toshiba, Microsoft,
WD…
Vendors
Supply
Solutions
Services
Special traders
Corporate resellers
Retailer
eTailers
BMK, February 17, 2014 22 Summary and Outlook

Market Outlook 2014
ICT industry*
Expectations for the economic development of the ICT industry remain subdued.
Cloud
In the coming years in the Public Cloud area for the western European countries,
growth of around 12% is anticipated.
Gartner market research institute (end-user spending)
For 2014, for the entire IT market in the ALSO countries* (excluding IT and
telecommunication services), Gartner forecasts growth of 2.9%
In the devices sector, Gartner forecasts growth of 2.2%
In the data center sector, Gartner expects performance to weaken (-0.7%)
For the software sector, Gartner forecasts growth of 5%
* Excluding Baltics
Source: “Gartner Market Databook, 4Q13 Update” (December 2013)
Disclaimer: The Gartner Report(s) described herein, (the “Gartner Report(s)”) represent(s) data, research opinion, or viewpoints published as part of a syndicated
subscription service by Gartner, Inc. (“Gartner”), and are not representations of fact. Each Gartner Report speaks as of its original publication date (and not as
of the date of this publication) and the opinions expressed in the Gartner Report(s) are subject to change without notice.
BMK, February 17, 2014 23 Summary and Outlook

BMK, February 17, 2014 24
ALSO Outlook
The MORE strategy will be consistently implemented, and
decoupling of the Supply, Services, and Solutions business
models will be further pursued
Strengthening profitability has priority over unqualified increase
in net sales
This outlook is based on a number of conditions, notably that revenue develops as expected, particularly for businesses that are sensitive to
short-term changes in the economic environment. It also excludes the effects of legal and regulatory matters and significant portfolio effects.
Control variables 12.31.2013 Medium-term targets
Profit before tax (EBT) EUR 72.6 mio. EUR 82−89 mio.
Net profit Group EUR 50.1 mio. EUR 60−65 mio.
Payout ratio 29.0% 25−35%
Summary and Outlook

ALSO Group – Financial Calendar
BMK, February 17, 2014 25
Date Event
March 13, 2014 Annual General Meeting
April 24, 2014 Media release: Selected key figures as of March 31
July 29, 2014 Interim Report
October 28, 2014 Media release: Selected key figures as of September 30
February 17, 2015 Annual Results Media Conference
Summary and Outlook

BMK, February 17, 2014 26
ALSO – a leading European full-range provider for
the ICT industry