Weighted Technique Using Image Fusion Techniques for … · 2015-08-30 · Histogram Equalization...
10
International Journal of Computer Science Trends and Technology (IJCST) – Volume 3 Issue 4, Jul-Aug 2015 ISSN: 2347-8578 www.ijcstjournal.org Page 233 Weighted Technique Using Image Fusion Techniques for Enhanced Visual Quality Anju Rani [1] , Rupinder Kaur [2] Department of Computer Science and Engineering RIMT-IET , Mandi Gobindgarh Punjab Technical University, Jalandhar Punjab - India ABSTRACT Image fusion is a process by which complimentary details from multiple input images are integrated into a single image, where the output fused image provide more information and more suitable for the purpose of human visual perception. Various enhancement schemes are used for enhancing an image which includes gray scale manipulation, filtering and Histogram Equalization (HE). Histogram equalization is one of the well-known image enhancement technique. In this study, an image fusion based techniques, called weighted technique, is proposed for image enhancement. First compute the conventional histogram then calculate magnitude gradient and weight function. Keywords:- Weighted Technique, Histogram Equalization, Image Fusion, Gradient, Weight Function I. INTRODUCTION Image Enhancement is to bring out detail that is hidden in an image or to increase contrast in a low contrast image. Whenever an image is converted from one form to other such as digitizing the image some form of degradation occurs at output. A post-processing procedure using an image enhancement method is needed in order to produce an image having better quality. Many software or image enhancement methods were developed to cope with these problems. In general, image enhancement methods can be classified into four categories: histogram-based methods, transform based methods, exposure-based methods and image fusion based methods. Histogram equalization (HE) is the most well-known technique for image enhancement . HE uses a non-linear mapping function to produce an enhanced image with its histogram approximating a uniform distribution. However, HE fails to produce pleasing pictures owing to three common drawbacks: 1) false contour; 2) amplified noises; 3) washed out appearance. Pizer et al. proposed a local HE method called adaptive histogram equalization. First, an image is divided into several non-overlapping blocks. Then, HE is applied on each block independently. Finally, the enhanced blocks are fused together using bilinear interpolation in order to reduce blocking artifacts. Some brightness preservation HE methods tried to preserve the original brightness to some extent, which is essential for consumer electronic products. These methods first divide the histogram into two or more sub-histograms and then apply HE on each sub-histogram independently. The main drawback of brightness preservation methods is that sometimes they may produce unnatural artifacts because some regions may be enhanced excessively. The paper is organized as follow. Section 2 illustrates the related works followed, in Section 3 presents the Proposed weighted techniques of image enhancement. Section 4 presents the experimental results. Section 5 represents conclusion, Section 6 represents the Future scope. Section 7 represents References. II. RELATED WORK X. Fang et al. [1] proposed a method to improve the enhancement result with image fusion method with evaluation on sharpness. Image enhancement can improve the perception of information C. Wang and Z. Ye [2] proposed a novel extension of histogram equalization, actually histogram specification, to overcome such drawback as HE (HISTOGRAM EQUALIZATION). To maximize the entropy is the essential idea of HE to make the histogram as flat as possible Mary Kim and Min Gyo Chung[3]Recursively separated and weighted histogram equalization for brightness preservation and contrast enhancement Chen Hee Ooi, Nicholas Sia Pik Kong, and Haidi Ibrahim[4]Bi-Histogram Equalization with a Plateau Limit for Digital Image Enhancement Pei-Chen Wu, Fan-Chieh Cheng, and Yu-Kumg Chen[5]A Weighting Mean-Separated Sub-Histogram Equalization for Contrast Enhancement S. D. Chen and A. Ramli [6-7] proposed a generalization of BBHE referred to as Recursive Mean-Separate Histogram Equalization (RMSHE) to provide not only better but also scalable brightness preservation Y. Wang, Q. Chen [8] presented a novel histogram equalization technique equal area dualistic sub image RESEARCH ARTICLE OPEN ACCESS
Transcript of Weighted Technique Using Image Fusion Techniques for … · 2015-08-30 · Histogram Equalization...
International Journal of Computer Science Trends and Technology (IJCST) – Volume 3 Issue 4, Jul-Aug 2015
ISSN: 2347-8578 www.ijcstjournal.org Page 233
Weighted Technique Using Image Fusion Techniques for
Enhanced Visual Quality Anju Rani [1], Rupinder Kaur [2]
Department of Computer Science and Engineering
RIMT-IET , Mandi Gobindgarh
Punjab Technical University, Jalandhar
Punjab - India
ABSTRACT
Image fusion is a process by which complimentary details from multiple input images are integrated into a single image,
where the output fused image provide more information and more suitable for the purpose of human visual perception.
Various enhancement schemes are used for enhancing an image which includes gray scale manipulation, filtering and
Histogram Equalization (HE). Histogram equalization is one of the well-known image enhancement technique. In this
study, an image fusion based techniques, called weighted technique, is proposed for image enhancement. First compute
the conventional histogram then calculate magnitude gradient and weigh t function. Keywords:- Weighted Technique, Histogram Equalization, Image Fusion, Gradient, Weight Function
I. INTRODUCTION
Image Enhancement is to bring out detail that is hidden in
an image or to increase contrast in a low contrast image.
Whenever an image is converted from one form to other
such as digitizing the image some form of degradation
occurs at output. A post-processing procedure using an
image enhancement method is needed in order to produce
an image having better quality. Many software or image
enhancement methods were developed to cope with these
problems. In general, image enhancement methods can be
classified into four categories: histogram-based methods,
transform based methods, exposure-based methods and
image fusion based methods. Histogram equalization
(HE) is the most well-known technique for image
enhancement. HE uses a non-linear mapping function to
produce an enhanced image with its histogram
approximating a uniform distribution. However, HE fails
to produce pleasing pictures owing to three common
drawbacks: 1) false contour; 2) amplified noises; 3)
washed out appearance. Pizer et al. proposed a local HE
method called adaptive histogram equalization. First, an
image is divided into several non-overlapping blocks.
Then, HE is applied on each block independently. Finally,
the enhanced blocks are fused together using bilinear
interpolation in order to reduce blocking artifacts. Some
brightness preservation HE methods tried to preserve the
original brightness to some extent, which is essential for
consumer electronic products. These methods first divide
the histogram into two or more sub-histograms and then
apply HE on each sub-histogram independently. The main
drawback of brightness preservation methods is that
sometimes they may produce unnatural artifacts because
some regions may be enhanced excessively.
The paper is organized as follow. Section 2
illustrates the related works followed, in Section 3
presents the Proposed weighted techniques of image
enhancement. Section 4 presents the experimental results.
Section 5 represents conclusion, Section 6 represents the
Future scope. Section 7 represents References.
II. RELATED WORK
X. Fang et al. [1] proposed a method to improve the
enhancement result with image fusion method with
evaluation on sharpness. Image enhancement can improve
the perception of information
C. Wang and Z. Ye [2] proposed a novel extension of
histogram equalization, actually histogram specification,
to overcome such drawback as HE (HISTOGRAM
EQUALIZATION). To maximize the entropy is the
essential idea of HE to make the histogram as flat as
possible
Mary Kim and Min Gyo Chung[3]Recursively separated
and weighted histogram equalization for brightness
preservation and contrast enhancement
Chen Hee Ooi, Nicholas Sia Pik Kong, and Haidi
Ibrahim[4]Bi-Histogram Equalization with a Plateau
Limit for Digital Image Enhancement
Pei-Chen Wu, Fan-Chieh Cheng, and Yu-Kumg
Chen[5]A Weighting Mean-Separated Sub-Histogram
Equalization for Contrast Enhancement
S. D. Chen and A. Ramli [6-7] proposed a generalization
of BBHE referred to as Recursive Mean-Separate
Histogram Equalization (RMSHE) to provide not only
better but also scalable brightness preservation
Y. Wang, Q. Chen [8] presented a novel histogram
equalization technique equal area dualistic sub image
RESEARCH ARTICLE OPEN ACCESS
International Journal of Computer Science Trends and Technology (IJCST) – Volume 3 Issue 4, Jul-Aug
2015
ISSN: 2347-8578 www.ijcstjournal.org Page 234
histogram equalization, is put forward in this paper. First,
the image is decomposed into two equal area sub images
based on its original probability density function
Y. T. Kim [9] proposed a novel extension of histogram
equalization to overcome such drawback of the histogram
equalization
D. Rajan and S. Chaudhuri [10] presented two new
techniques of using data fusion, based on the modality of
the data generation process, to generate a super resolved
image from a sequence of low resolution image intensity
data
.
III. PROPOSED WEIGHTED TECNIQUE
FOR IMAGE ENHANCEMENT
In this study, an image fusion based approach, called
weighted technique, will be proposed for image
enhancement. Image fusion have been widely developed
for producing high quality images in applications such as
remote sensing, medical imaging, high dynamic range
imaging ,multi-focus imaging.
The proposed weighted technique approach works on
pixel value, Image fusion algorithm could be applied on
greyscale images or colour images.
Flowchart of Image Fusion:-
Image fusion algorithm could be applied on greyscale
images or colour images. The fus ion algorithms for both
greyscale as well as color images are described below:
Greyscale Images:-
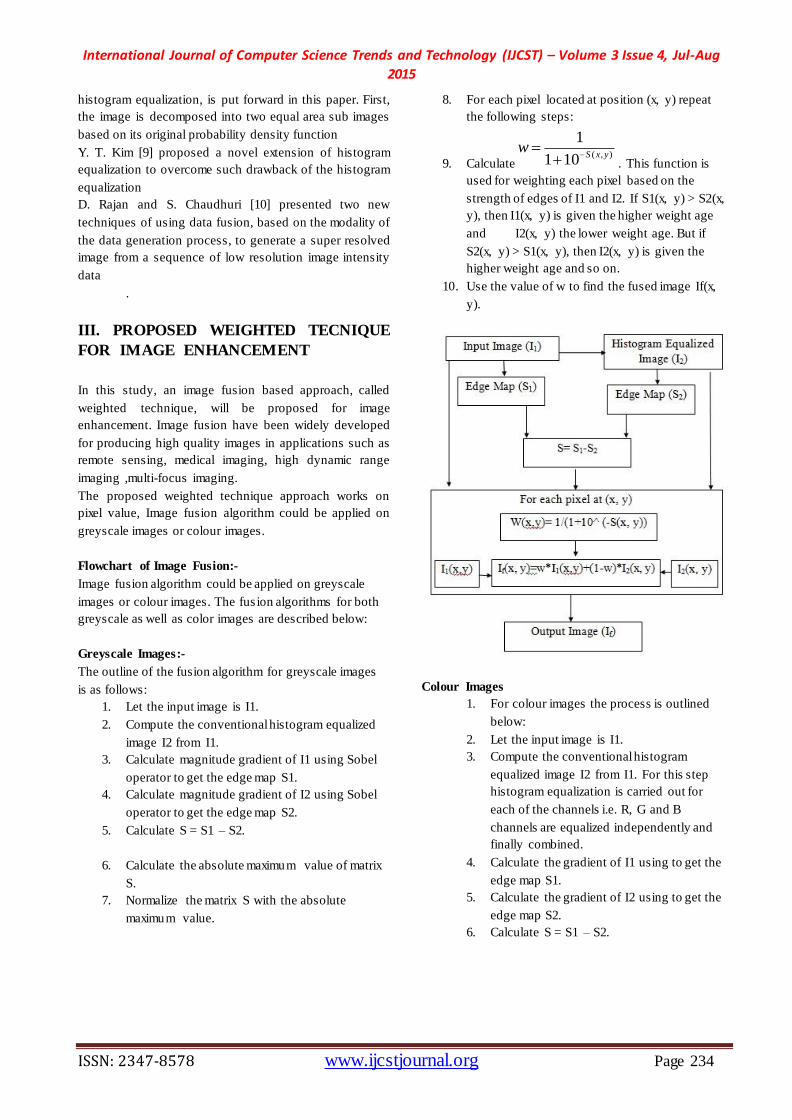
The outline of the fusion algorithm for greyscale images
is as follows:
1. Let the input image is I1.
2. Compute the conventional histogram equalized
image I2 from I1.
3. Calculate magnitude gradient of I1 using Sobel
operator to get the edge map S1.
4. Calculate magnitude gradient of I2 using Sobel
operator to get the edge map S2.
5. Calculate S = S1 – S2.
6. Calculate the absolute maximum value of matrix
S.
7. Normalize the matrix S with the absolute
maximum value.
8. For each pixel located at position (x, y) repeat
the following steps:
9. Calculate( , )
1
1 10 S x yw
. This function is
used for weighting each pixel based on the
strength of edges of I1 and I2. If S1(x, y) > S2(x,
y), then I1(x, y) is given the higher weight age
and I2(x, y) the lower weight age. But if
S2(x, y) > S1(x, y), then I2(x, y) is given the
higher weight age and so on.
10. Use the value of w to find the fused image If(x,
y).
Colour Images
1. For colour images the process is outlined
below:
2. Let the input image is I1.
3. Compute the conventional histogram
equalized image I2 from I1. For this step
histogram equalization is carried out for
each of the channels i.e. R, G and B
channels are equalized independently and
finally combined.
4. Calculate the gradient of I1 using to get the
edge map S1.
5. Calculate the gradient of I2 using to get the
edge map S2.
6. Calculate S = S1 – S2.
International Journal of Computer Science Trends and Technology (IJCST) – Volume 3 Issue 4, Jul-Aug
2015
ISSN: 2347-8578 www.ijcstjournal.org Page 235
7. Calculate the absolute maximum value of
matrix S.
8. Normalize the matrix S with the absolute
maximum value.
9. For each pixel located at position (x, y)
repeat the following steps:
10. Calculate( , )
1
1 10 S x yw
.
11. Use the value of w to find the fused image
If(x, y). This step is repeated for each R, G
and B channel.
12. Finally combine the R, G and B channels to
get the output fused image. The flowchart
for color image fusion is same except the
fusion is carried out on the three channels
simultaneously.
Gradients
For a function f(x, y), the gradient of f at (x,
y) is defined as the two dimensional column vector
x
y
f
G xf
fG
y
(3.1)
The magnitude of this vector is given by
1/222
f ff
x y
(3.2)
The first order derivative of a one dimensional function
f(x) is the difference
( 1) ( )f
f x f xx
(3.3)
The simplest approximations [1] to the first order
derivative are
8 5 6 5x yG z z andG z z
(3.4)
Masks of even size are awkward to implement. The
smallest filter mask is of size 3 × 3. An approximation
using absolute values still at point z5 but using 3 × 3 mask
is
7 8 9 1 2 32 2xG z z z z z z
(3.5)
3 6 9 1 4 72 2yG z z z z z z
(3.6)
The difference between the first and third rows of the 3 ×
3 image region approximates the derivative in the x-
direction, and the difference between the transition in gray
level. In practice optics, sampling and other image
acquisition
imperfections yield
edges that are blurred,
with the degree of
blurring being
determined by factors
such as the quality of
the image acquisition
system, the sampling rate, and illumination conditions
under which the image is acquired. Instead an edge point
now is any point contained in the ramp, and an edge
would then be a set of such points that are connected. The
thickness of the edge is determined by the length of the
ramp, as its transition from an initial to a final grey level.
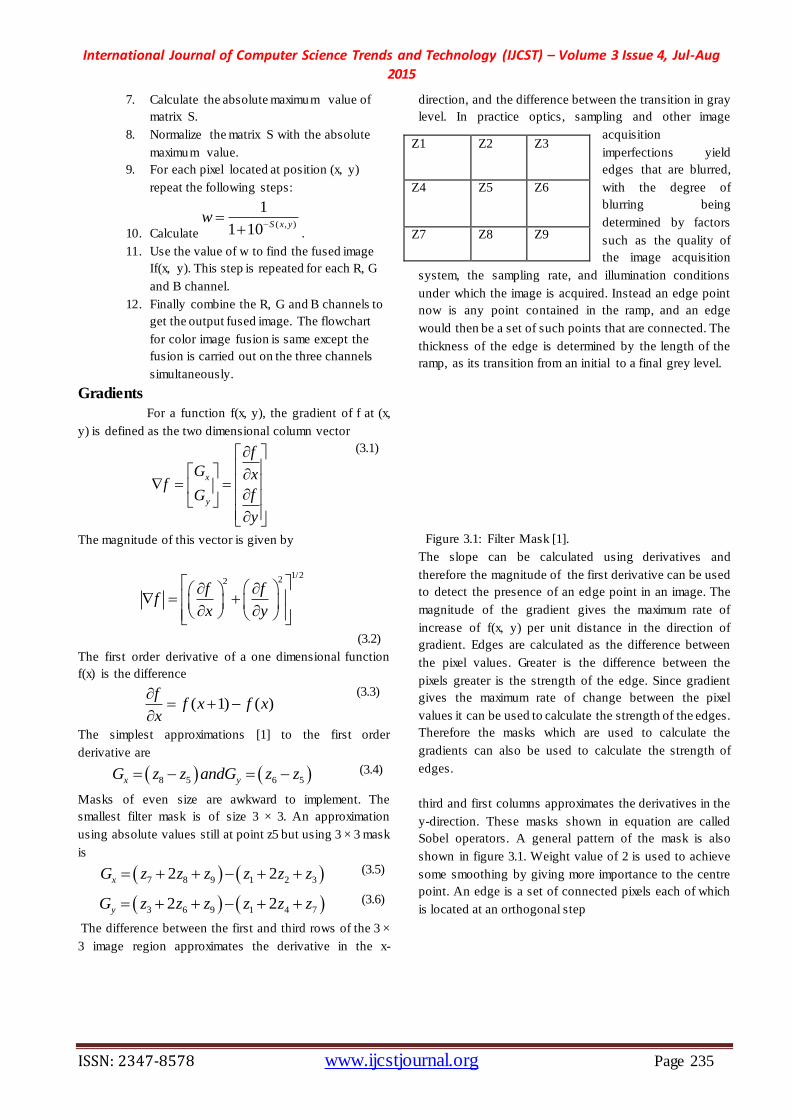
Figure 3.1: Filter Mask [1].
The slope can be calculated using derivatives and
therefore the magnitude of the first derivative can be used
to detect the presence of an edge point in an image. The
magnitude of the gradient gives the maximum rate of
increase of f(x, y) per unit distance in the direction of
gradient. Edges are calculated as the difference between
the pixel values. Greater is the difference between the
pixels greater is the strength of the edge. Since gradient
gives the maximum rate of change between the pixel
values it can be used to calculate the strength of the edges.
Therefore the masks which are used to calculate the
gradients can also be used to calculate the strength of
edges.
third and first columns approximates the derivatives in the
y-direction. These masks shown in equation are called
Sobel operators. A general pattern of the mask is also
shown in figure 3.1. Weight value of 2 is used to achieve
some smoothing by giving more importance to the centre
point. An edge is a set of connected pixels each of which
is located at an orthogonal step
Z1 Z2 Z3
Z4 Z5 Z6
Z7 Z8 Z9
International Journal of Computer Science Trends and Technology (IJCST) – Volume 3 Issue 4, Jul-Aug
2015
ISSN: 2347-8578 www.ijcstjournal.org Page 236
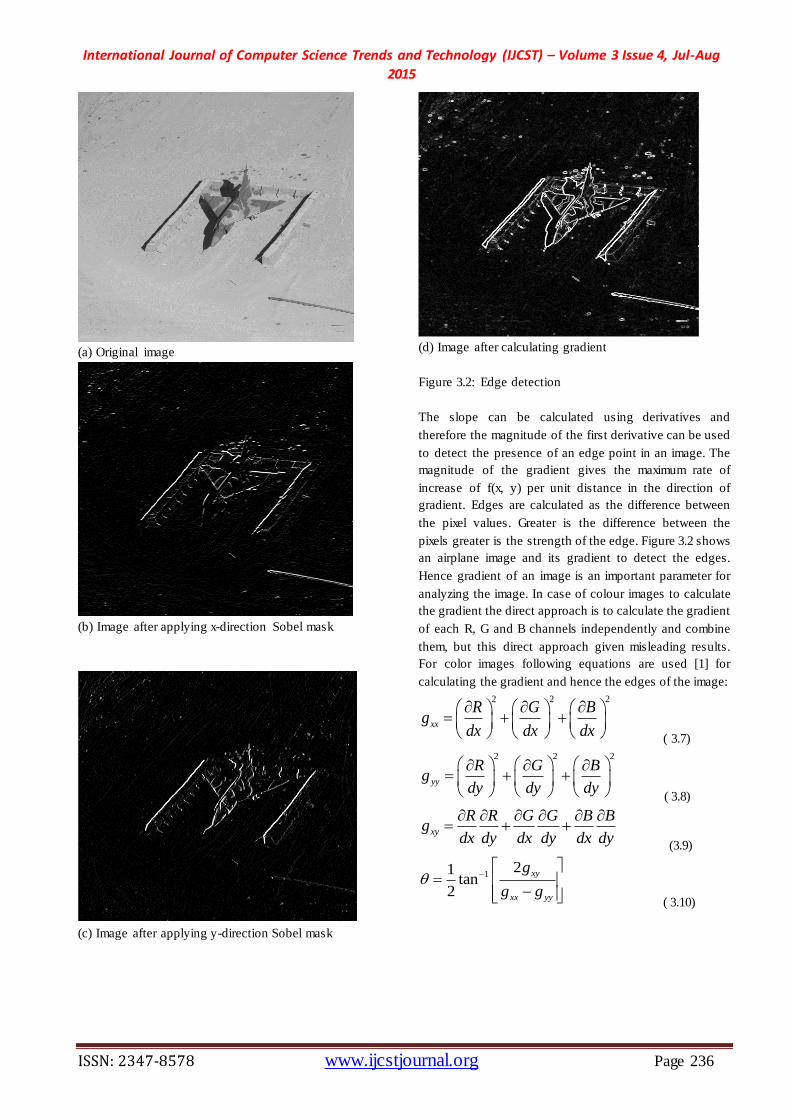
(a) Original image
(b) Image after applying x-direction Sobel mask
(c) Image after applying y-direction Sobel mask
(d) Image after calculating gradient
Figure 3.2: Edge detection
The slope can be calculated using derivatives and
therefore the magnitude of the first derivative can be used
to detect the presence of an edge point in an image. The
magnitude of the gradient gives the maximum rate of
increase of f(x, y) per unit distance in the direction of
gradient. Edges are calculated as the difference between
the pixel values. Greater is the difference between the
pixels greater is the strength of the edge. Figure 3.2 shows
an airplane image and its gradient to detect the edges.
Hence gradient of an image is an important parameter for
analyzing the image. In case of colour images to calculate
the gradient the direct approach is to calculate the gradient
of each R, G and B channels independently and combine
them, but this direct approach given misleading results.
For color images following equations are used [1] for
calculating the gradient and hence the edges of the image:
2 2 2
xx
R G Bg
dx dx dx
( 3.7)
2 2 2
yy
R G Bg
dy dy dy
( 3.8)
xy
R R G G B Bg
dx dy dx dy dx dy
(3.9)
121
tan2
xy
xx yy
g
g g
( 3.10)
International Journal of Computer Science Trends and Technology (IJCST) – Volume 3 Issue 4, Jul-Aug
2015
ISSN: 2347-8578 www.ijcstjournal.org Page 237
1/2
1( ) cos 2 2 sin 2
2xx yy xx yy xyF g g g g g
(3.11)
Here gxx, gyy, gxy are the gradients in x, y and x-y
directions respectively and θ is the direction of
maximum gradient. F (θ) represents the gradient of the
colour image.
Design of Weight Function
As shown for fusing the two images weight w is used.
The value of w can lie in the range [0, 1]. Detail aware
contrast enhancement method assigns weights
manually. In order to automate the process of image
fusion the calculation of this weight value needs to be
automated. For pixel-by-pixel fusion of the two images
this weight value must be calculated for each possible
pixel location in the images. Based on the strength of
edges in the two source images two cases are possible
1. If S1(x, y) > S2(x, y) i.e. edge at location (x, y) in
image I1 is greater than the edge at location (x, y)
in I2.
In this case the pixel in image I1 i.e. I1(x, y) must
be given the higher weight age and I2(x, y) the
lower weight age.
2. If S2(x, y) > S1(x, y) i.e. edge at location (x, y) in
image I2 is greater than the edge at location (x,
y)in I1.
In this case the pixel in image I2 i.e. I2(x, y)
must be given the higher weightage and I1(x, y)
the lower weightage
For implementing the above two cases we use equation
of the form
1
1 xw
where [ 1,1]x
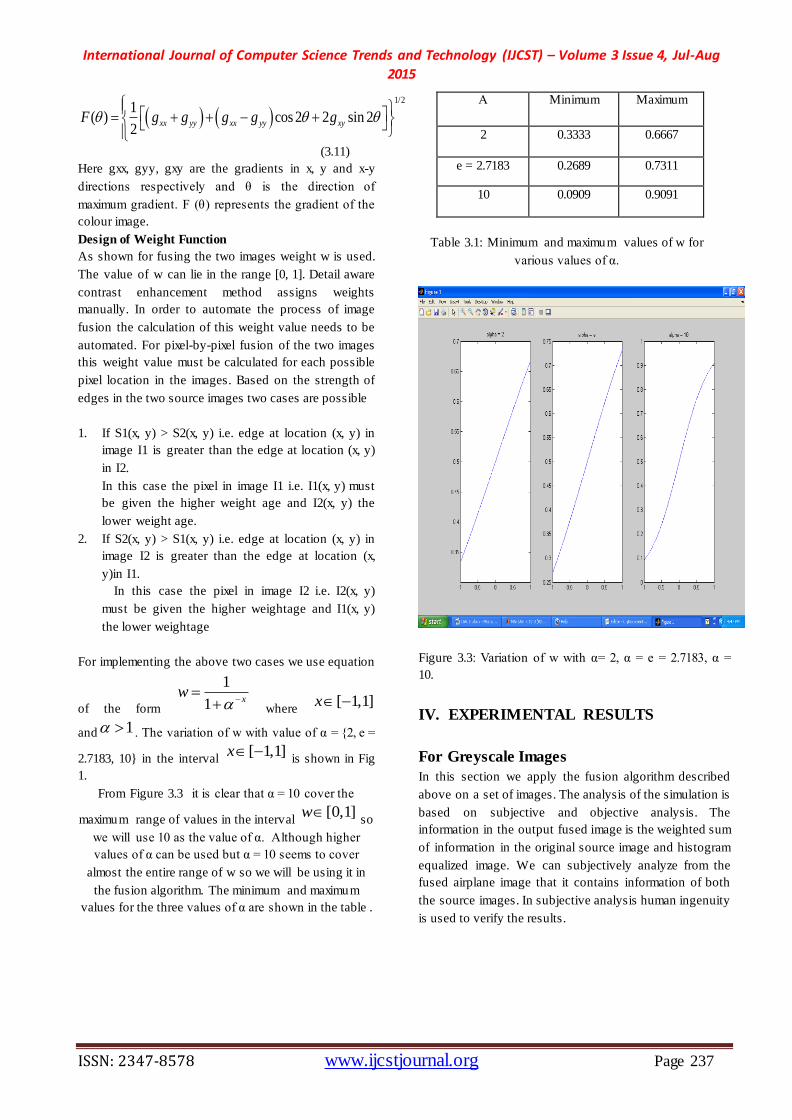
and 1 . The variation of w with value of α = {2, e =
2.7183, 10} in the interval [ 1,1]x
is shown in Fig
1.
From Figure 3.3 it is clear that α = 10 cover the
maximum range of values in the interval [0,1]w
so
we will use 10 as the value of α. Although higher
values of α can be used but α = 10 seems to cover
almost the entire range of w so we will be using it in
the fusion algorithm. The minimum and maximum
values for the three values of α are shown in the table .
Α Minimum Maximum
2 0.3333 0.6667
e = 2.7183 0.2689 0.7311
10 0.0909 0.9091
Table 3.1: Minimum and maximum values of w for
various values of α.
Figure 3.3: Variation of w with α= 2, α = e = 2.7183, α =
10.
IV. EXPERIMENTAL RESULTS
For Greyscale Images
In this section we apply the fusion algorithm described
above on a set of images. The analysis of the simulation is
based on subjective and objective analysis. The
information in the output fused image is the weighted sum
of information in the original source image and histogram
equalized image. We can subjectively analyze from the
fused airplane image that it contains information of both
the source images. In subjective analysis human ingenuity
is used to verify the results.
International Journal of Computer Science Trends and Technology (IJCST) – Volume 3 Issue 4, Jul-Aug
2015
ISSN: 2347-8578 www.ijcstjournal.org Page 238
Objective methods used for the measurement of image
fusion performance are statistical in nature. Here we used
the standard deviation, average gradient and entropy for
comparing the original image and the fused image.
Standard deviation is the deviation about mean. It
represents the dynamic range of values present in an
image about the mean. Average gradient is used for
measuring the clarity of the image. Entropy is the measure
of randomness or amount of information present in the
image. More is the entropy more is information present in
the image.
In the first airplane image, the track become clear after
histogram equalization but key information is lost then
final fused image obtained consist of both the key
information and visibility of the track. In the second
image of road map, road become clear after histogram
equalized image but some information is lost, then final
fused image comprise both key information of the original
image and visibility as that of histogram equalized image.
Third image comprised a view of the bridge which shows
better results after applying the algorithm as compare to
original and histogram equalized image. Last image
comprised a crowd view in which many people are sitting,
the image become clear after histogram equalization but
key information is lost then final fused image obtained
consist of both the key information and visibility of the
crowd.
The simulation results of these images are shown below.
We are interested in relative changes between source and
fused images.
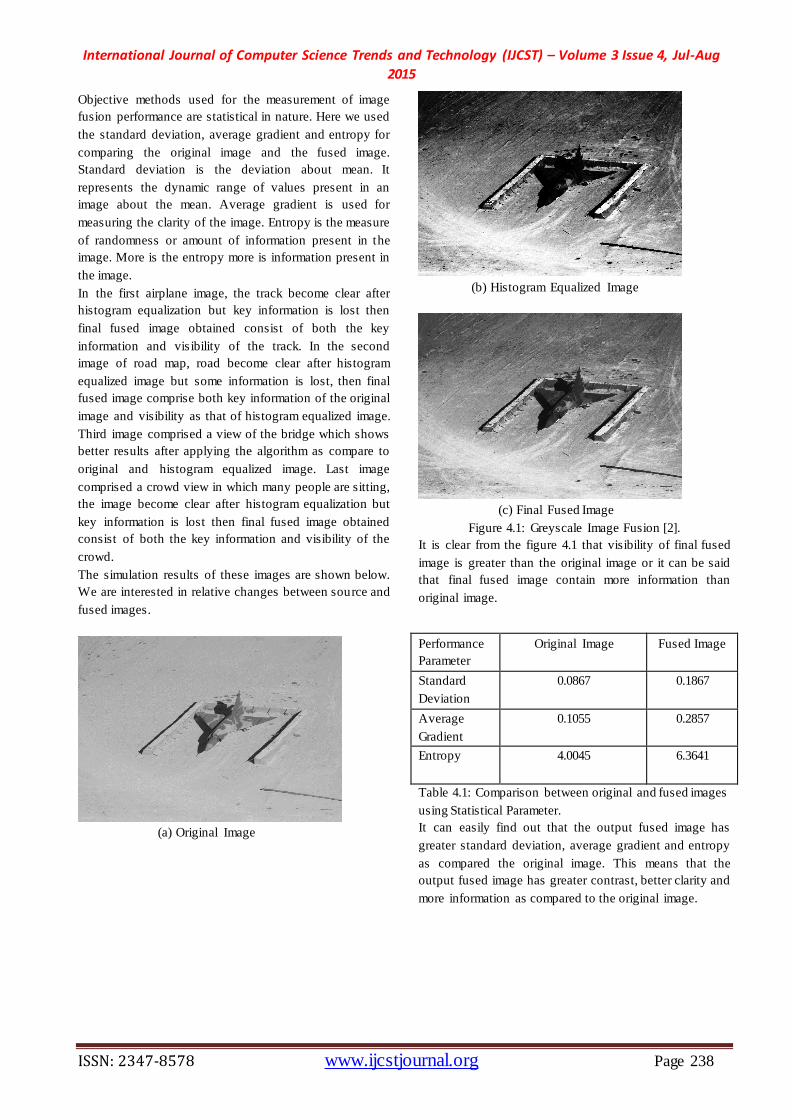
(a) Original Image
(b) Histogram Equalized Image
(c) Final Fused Image
Figure 4.1: Greyscale Image Fusion [2].
It is clear from the figure 4.1 that visibility of final fused
image is greater than the original image or it can be said
that final fused image contain more information than
original image.
Performance
Parameter
Original Image Fused Image
Standard
Deviation
0.0867 0.1867
Average
Gradient
0.1055 0.2857
Entropy 4.0045 6.3641
Table 4.1: Comparison between original and fused images
using Statistical Parameter.
It can easily find out that the output fused image has
greater standard deviation, average gradient and entropy
as compared the original image. This means that the
output fused image has greater contrast, better clarity and
more information as compared to the original image.
International Journal of Computer Science Trends and Technology (IJCST) – Volume 3 Issue 4, Jul-Aug
2015
ISSN: 2347-8578 www.ijcstjournal.org Page 239
(a) Original Image
(b) Histogram Equalized Image
(c) Final Fused Image
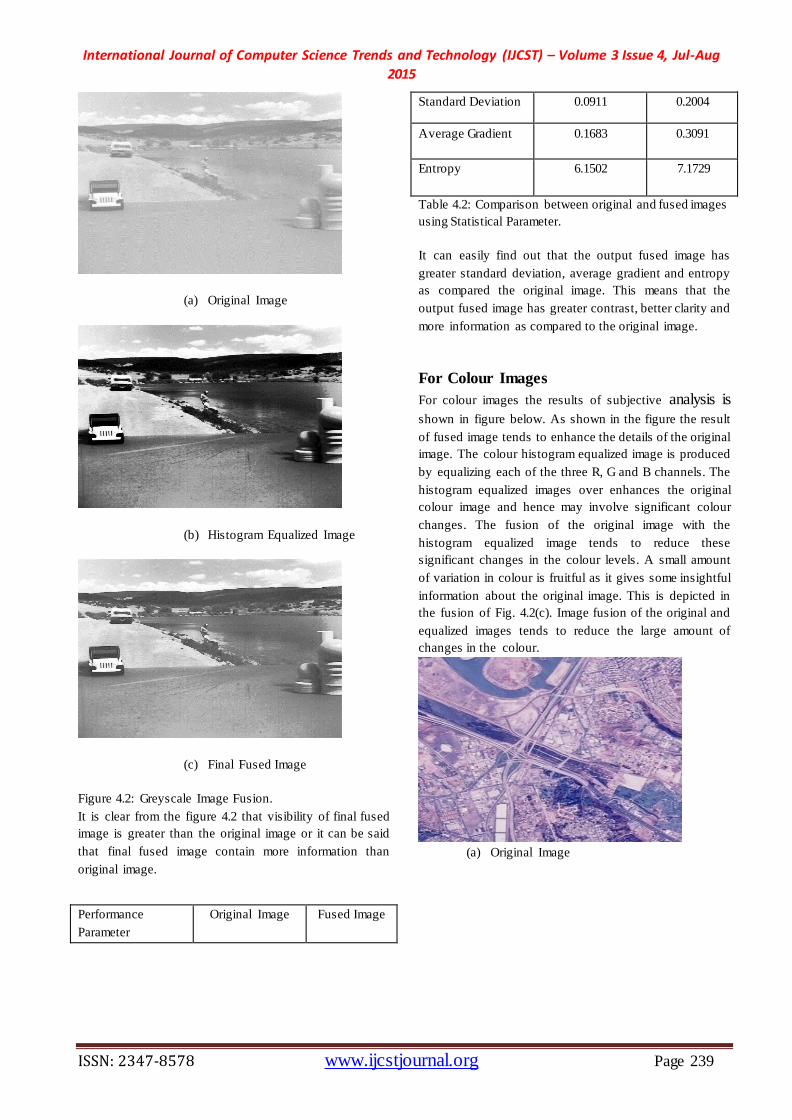
Figure 4.2: Greyscale Image Fusion.
It is clear from the figure 4.2 that visibility of final fused
image is greater than the original image or it can be said
that final fused image contain more information than
original image.
Performance
Parameter
Original Image Fused Image
Standard Deviation 0.0911 0.2004
Average Gradient 0.1683 0.3091
Entropy 6.1502 7.1729
Table 4.2: Comparison between original and fused images
using Statistical Parameter.
It can easily find out that the output fused image has
greater standard deviation, average gradient and entropy
as compared the original image. This means that the
output fused image has greater contrast, better clarity and
more information as compared to the original image.
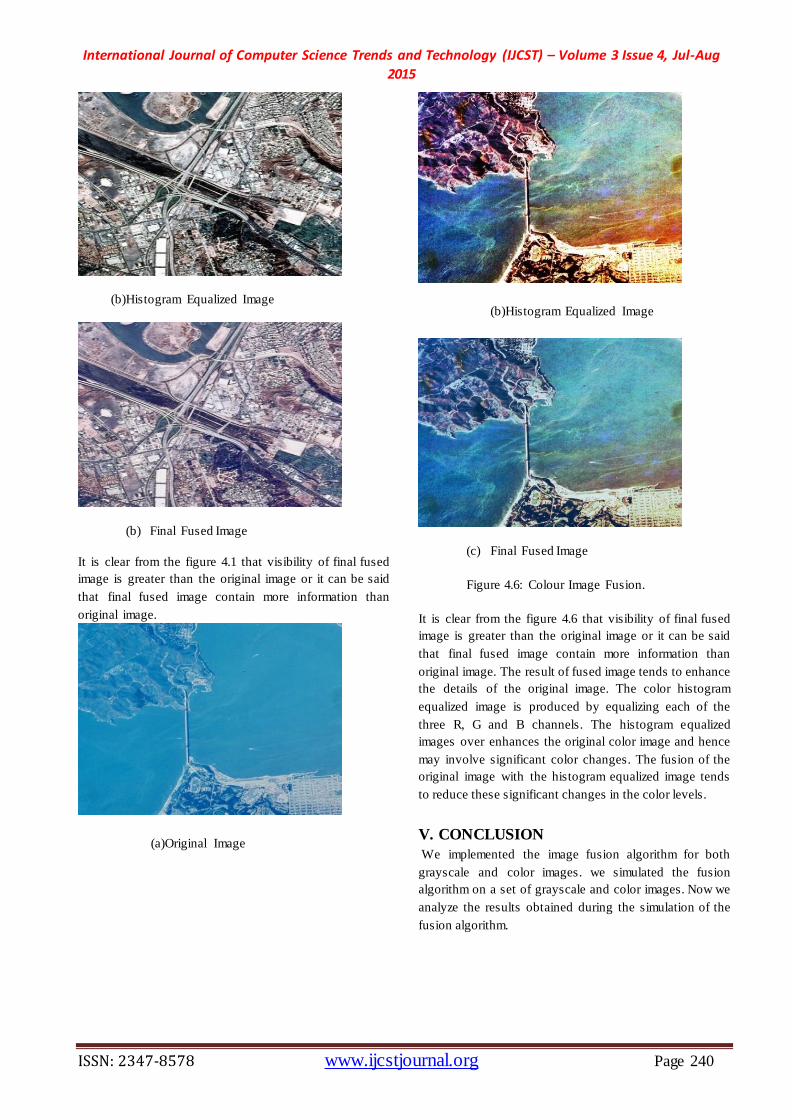
For Colour Images
For colour images the results of subjective analysis is
shown in figure below. As shown in the figure the result
of fused image tends to enhance the details of the original
image. The colour histogram equalized image is produced
by equalizing each of the three R, G and B channels. The
histogram equalized images over enhances the original
colour image and hence may involve significant colour
changes. The fusion of the original image with the
histogram equalized image tends to reduce these
significant changes in the colour levels. A small amount
of variation in colour is fruitful as it gives some insightful
information about the original image. This is depicted in
the fusion of Fig. 4.2(c). Image fusion of the original and
equalized images tends to reduce the large amount of
changes in the colour.
(a) Original Image
International Journal of Computer Science Trends and Technology (IJCST) – Volume 3 Issue 4, Jul-Aug
2015
ISSN: 2347-8578 www.ijcstjournal.org Page 240
(b)Histogram Equalized Image
(b) Final Fused Image
It is clear from the figure 4.1 that visibility of final fused
image is greater than the original image or it can be said
that final fused image contain more information than
original image.
(a)Original Image
(b)Histogram Equalized Image
(c) Final Fused Image
Figure 4.6: Colour Image Fusion.
It is clear from the figure 4.6 that visibility of final fused
image is greater than the original image or it can be said
that final fused image contain more information than
original image. The result of fused image tends to enhance
the details of the original image. The color histogram
equalized image is produced by equalizing each of the
three R, G and B channels. The histogram equalized
images over enhances the original color image and hence
may involve significant color changes. The fusion of the
original image with the histogram equalized image tends
to reduce these significant changes in the color levels.
V. CONCLUSION
We implemented the image fusion algorithm for both
grayscale and color images. we simulated the fusion
algorithm on a set of grayscale and color images. Now we
analyze the results obtained during the simulation of the
fusion algorithm.
International Journal of Computer Science Trends and Technology (IJCST) – Volume 3 Issue 4, Jul-Aug
2015
ISSN: 2347-8578 www.ijcstjournal.org Page 241
For grayscale images consider the airplane image. When
we histogram equalize it using the conventional histogram
equalization the details which were not clear in the
original image gets exposed here. Consider the track that
gets visible after the histogram equalization. This happens
because histogram equalization enhances the contrast of
the original image. But the disadvantage of using
histogram equalization is that it over enhances the original
image. Because of this the key information that was
present in the original image gets lost in the histogram
equalized image. In other words, original image and
histogram equalized image contains complementary
information. This is clear from the original airplane and
histogram equalized airplane image. We can utilize this
complementary relation between the two images by using
the fusion algorithm described to produce output fused
image. The information in the output fused image is the
weighted sum of information in the original source image
and histogram equalized image. We can subjectively
analyze from the fused airplane image that it contains
information of both the source images.
Our claim that the fused image is the enhanced version of
the original image is supported by the objective analysis
of original image and the fused image. This can be easily
found that the output fused image has greater standard
deviation, average gradient and entropy as compared the
original image. This means that the output fused image
has greater contrast, better clarity and more information as
compared to the original image.
Similar arguments can be given for the enhancement of
colour images. one can easily say that output fused image
is the enhanced version of the input image merely on the
basis of subjective analysis. The enhancement in case of
colour images involves variation in colour information
and it is this variation in colour information which is
responsible of input image enhancement. It is to be noted
that fusion of the histogram equalized image with the
original image keeps the colour change within limits.
VI. FUTURE SCOPE
While designing image enhancement techniques the speed
of execution of the program is also an important factor.
Therefore, the fusion algorithm can be optimized for
speed in future research. Also future research can also be
done to compare the performance of fusion algorithm on
colour images objectively.
REFERENCES
[1] Xiaoying Fang, Jingao Liu, Wenquan Gu, Yiwen
Tang, “A Method to Improve the Image
Enhancement Result based on Image Fusion”,
International Conference on Multimedia
Technology, 2011, pp. 55-58
[2] Y. Wang, Q. Chen, B. Zhang, “Image
enhancement based on equal area dualistic sub-
image histogram equalization method,” IEEE
Trans. on Consumer Electronics, vol. 45, no. 1,
pp. 68-75, Feb. 1999.
[3] Mary Kim and Min Gyo Chung, “Recursively
separated and weighted histogram equalization
for brightness preservation and contrast
enhancement”, IEEE Trans. Consumer
Electronics, vol. 54, no. 3, pp.1389 - 1397,
August 2008.
[4] Chen Hee Ooi, Nicholas Sia Pik Kong, and Haidi
Ibrahim, “Bi-Histogram Equalization with a
Plateau Limit for Digital Image Enhancement”,
IEEE Trans. Consumer Electronics, Vol. 55, No.
4,NOVEMBER 2009.
[5] ]Pei-Chen Wu, Fan-Chieh Cheng, and Yu-Kumg
Chen, “A Weighting Mean-Separated Sub-
Histogram Equalization for Contrast
Enhancement”,IEEE Trans. Biomedical
Engineering and Computer Science, 2010.
[6] S.-D. Chen, A. Ramli, “Contrast enhancement
using recursive mean-separate histogram
equalization for scalable brightness
preservation,” IEEE Trans. On Consumer
Electronics, vol. 49, no. 4, pp. 1301-1309,
Nov.2003
[7] Y.-T. Kim,“Contrast enhancement using
brightness preserving bi - histogram
equalization,” IEEE Trans. On Consumer
electronics, vol. 43, no. 1, pp. 1-8, Feb. 1997.
[8] Iyad Jafar ,and Hao Ying,” Multilevel
Component-Based Histogram Equalization for
Enhancing the Quality of Grayscale Images”,
IEEE EIT, pp. 563-568, 2007.
[9] Nymlkhagva Sengee, and Heung Kook Choi,
“Brightness preserving weight clustering
histogram equalization”, IEEE Trans. Consumer
Electronics, vol. 54, no. 3, pp. 1329 - 1337,
August 2008.
[10] Gyu-Hee Park, Hwa-Hyun Cho, and Myung-
Ryul Choi, “A contrast enhancement method
using dynamic range separate histogram

International Journal of Computer Science Trends and Technology (IJCST) – Volume 3 Issue 4, Jul-Aug
2015
ISSN: 2347-8578 www.ijcstjournal.org Page 242
equalization”, IEEE Trans. Consumer
Electronics, vol. 54, no. 4, pp. 1981 - 1987,
November 2008.
[11] Deepali A.Godse, Dattatraya S. Bormane (2011)
“Wavelet based image fusion using pixel based
maximum selection rule” International Journal of
Engineering Science and Technology (IJEST),
Vol. 3 No. 7 July 2011, ISSN : 0975-5462
[12] Vijayaraj, V.; Younan, N.; O’Hara, C.(2006).
“Concepts of image fusion in remote sensing
Applications”. In Proceedings of IEEE
International Conference on Geosciences and
Remote Sensing Symposium, Denver, CO,
USA, July 31–August 4, 2006, pp.3798-3801.
[13] L.Chan, S. Der and N. M. Nasrabadi. “Dualband
FLIR fusion for automatic target recognition”,
Information Fusion, 4, 35-45, 2003
[14] D.Rajan and S.Chaudhuri. “Data fusion
techniques for super-resolution imaging”,
Information Fusion, 3, 25-38, 2002.
[15] Y.Schechner and S. K.Nayer “Multidimensional
fusion by image fusion” Department of
Computer Science, Columbia University, New
York, USA 2007.


![REVIEW OF IMAGE ENHANCEMENT … ENHANCEMENT USING HISTOGRAM EQUALIZATION Histogram equalization [11] is a common technique for enhancing the appearance of images. Suppose we have an](https://static.fdocuments.in/doc/165x107/5cccf48b88c9932b558cddc3/review-of-image-enhancement-enhancement-using-histogram-equalization-histogram-equalization.jpg)