WeightbyHeightandAge for Adults18-74Years · WeightbyHeightandAge for Adults18-74Years: ......
63
Data from the NATIONAL HEALTH SURVEY Weight byHeight andAge for Adults18-74Years: Uniied States,1971-74 A~c and scx distributions of’ weight b)’ single inches of hci~ht for LKILdts 18-74 years of Jgc in the civilian nuninstitutionalizd population of the United States. DHEW Publication No. (PHS) 79-1656 U. S. DEPARTMENT OF HEALTH, EDUCATION, AND WELFARE Public Health Service Office of Health Research, Statistics, and Technology National Center for Health Statistics Hyattsville, Md. September 1979 Series 11 Number 208
Transcript of WeightbyHeightandAge for Adults18-74Years · WeightbyHeightandAge for Adults18-74Years: ......

Data from theNATIONAL HEALTH SURVEY
WeightbyHeightandAgefor Adults18-74Years:Uniied States,1971-74
A~c and scx distributions of’ weight b)’ single inches of hci~ht forLKILdts 18-74 years of Jgc in the civilian nuninstitutionalizdpopulation of the United States.
DHEW Publication No. (PHS) 79-1656
U. S. DEPARTMENT OF HEALTH, EDUCATION, AND WELFAREPublic Health Service
Office of Health Research, Statistics, and TechnologyNational Center for Health StatisticsHyattsville, Md. September 1979
Series 11Number 208

NATIONAL CENTER FOR HEALTH STATISTICS
DOROTHY P. RICE, Director
ROBERT A. ISRAEL, Deputy DirectorJACOB J. FELDMAN, Ph.D., Associate Director for Analysis
GAIL F. FISHER, Ph.D., Associate Directc~rfor the Cooperative Health Statistics SystemROBERT A. lSRA EL, Acting Associate Director for Data Systems
JAMES T. BAIRD, JR., Ph.D.. Associate Director for International StatisticsROBE RT C. HUBE R, Associate Director for J4anagement
MONROE G. SIRKEN, Ph.D., A ssociate Director for Mathematical StatisticsPETER L. HURLEY, Associate Director for Operations
JAMES M. ROBEY, Ph.D., Associate Director for ProgramDevelopmentPAUL E. LEAVE RTON, Ph.D., Associate Director for Research
ALICE HAYWOOD, Information Officer
DIVISION OF HEALTI+ RESOURCES UTILIZATION STATISTICS
ROBERT S. MURPHY, DirectorS[DNEY ABRAHAM, Chiel Nutrition Statistics Branch
KURT R. MAURER, Acting Chief Survey Planning and Development Branch
DIVISION OF OPERATIONS
HENRY MILLER, Chic~ Health l<xaminationField Operations Branch
COOPERATION OF THE U.S. BUREAU OF THE CENSUS
In accordarwc with specifications established by the Ntitior-ml Ckntcr for Ikaith Statistics, the
Bureau uf the Cknsus, und(r a contractual agrccmcnt, participated in the clcsign and selection of
the swnplr, ami curried out the first su+!c 01 the field intervicwin~ and certain pwts of thest22tist ical proccssin~.
Vital and Health Statistics-Series 1 l-No. 208
DHEW Publication No. (PHS) 79-1656[.ibrary oj”CotlgrcssCatalog CardNumber 78-606159

Library of Congress Cataloging in Publication Data

CONTENTS
Introduction ... .. .. .. .... .. .... .. .. .. .. .. .. .. .... .. .. .. .. .. .. .. .. .. .. .. ... ... .. .. .. .. .. ..... . . ..... ... .. .... . .. .... .. ... .. .. . .... .. ...................
fv4cthnrfs .... .. .. .... .. .. .... . ... .. .... .. .. .... . ... ... ... ... .. ... . .... ... .. ... .. . .. .. .. .. .... .... .. .. ... . .. .... .. .. .. .... .. .... ...........................Height ... .. .... .. .. .... .. .. .. .... .. .... .. .... .... .. .. .. .. .. .. ..... .. .. ... .. .. .. .. .. .... .. .. . . .. .... .. ....... . .. .. .. .. .. .. .. .. .......................Wci~ht . .. . ..... .. ........ ... .... .. . ...... . ... ..... . ... .. .. .. ... .. ... .. ... .. . ... .... .. . .... .. . .. ... .. ... ... ... .. ... .... . . .. .. ........................
Findings ... .. .. .. .. .. .. .. .. .. .. ... ... .. .. .... .. ... . .... .. .. .... .. .... ... ... . ... .. . . ..... ... .. ... . .. .. .... .. .. .... .. .. ..... .. .............................
Comparison With Previous Survey . .. .. .... .. .. .... .. .. ... ... .. .... ... .. ... .. . . .. .. .. .. .. .. .. .. .. ... .. . .. .. .. .. ..... ... . .... . ... .. .. . .. .. ..
Discussion ...... .. .... .. .. . ..... .. .. .. .. .... .... .. .. .. .... .. .. .. .. .... .. .... .. .... .. . ..... .. .. .. .. .. .. .... . ... ... ... .. .. .. .. ...... ......................Comparison with Previous Survey .. .. .. .. .... . ... .. .. .. .. .. .. .. . . ...... .. ..... . .. .. .. .. .. .. .. .. .. .... .. ... ... .. .. ..... . .. .. .... . ... .
Summary .. .. .. .. .. .... .... . ..... .. .. .. .. .. .. .. ... . .. .... .. .. .... .. .. . .... . .. .. ... .. . ...... .. .. .. .... . ..... .. ... . .. . . .. ... . .. .. .... .. ................ ...
Rcfcrenccs ... .. .. .. .... .. .. ... . .. .. .. ... . .. .. .... .... ..... . .. .... .. ... ... ... ... .... . . ...... .. .. ... . .. .. .... ... .. . ... .. . .. .. .. ..........................
List of Dcttiilcd Tables ... ... .. .... ... . .. .... .... .... . ... .... ... . ..... ... . .... ... .. ... . .. ...... . ..... .. .. . ... .. ... ... . .. . ..... .. . ... . ... .. .... . ...
Appendix: Statistical Nntcs .. .... .. .. . .... ... ..... ... .. .... .. .. .. .. .. .. .... ... . .. .. ... . .... .. .. ...... ... ... .. .. .. .... .. ... . .. .. .. ..... .. . .....
1.
2.
3.
4.
5.
6.
7.
8.
9.
10.
11.
LIST OF TEXT FIGURES
Unadjusted mean and median weight of mrm and women aged 18-74 years, by height:United States, 1971-74 ... . ... .. .. .. .. ... . .. .. .... .. .... ... ... .. .. . .. ..... .. .. ... .. .. . .... . .... ..... .... .. ... ... ... .. .. ..... .. ..... ... . ...
Unadjusted mcanwcights and smoothed mcanwcights (cstimatcd frornth crcgressio ncquations)ofrncnandwomcnagcd 18-74 years, byhcight: United States, 1971 -74 . .. .. .. .... ... ... .. . ..... .. . .. ...... . ...
Avemgc diffcrcncc o~,cr height range betwecnunadjustcd mean weights and mean weights fromregression equations formcn and women, byagc: United States, 1971 -74 ... . ..... .. .. .... .... .... .. .... ... .. ..
Average weights of mcn by ayc group and height: United States, 1960-62 and 1971 .74 ... ... . ..... . .... .
Average weights ofwomcn byagc~oup andhcight: United SVatcs, 1960-62 and 1971 -74 .... .... .. ....
Diffcrcnccs at the 95th pcrccntilc of the weight distribution of mcn and women in HES (1960-62)and IIANES (1971-74), by agc and height: United States .. .... ..... .. ...... .. ... ..... . . ...... . . ..... .... . .... ... .. ... ..
Diffcrcnccs at the 90th pcrccntilc of the weight distribution of mcn and women in IIES ( 1960-62)and HANES (1971 -74), byagcandhcight: United States .. .... .. .. .. .. .. .... .. .. .... .. .. .. .... .... .... .. .. .... .. .. .....
Diffcrcnccs at the 80th pcrccntilc of the wci.ght distribution of men and women in IIES (1960-62)and HANES (1971 -74), byagc andhcight: United States .... .. .. .. .. ... ... .. .. .. ..... .. .. ... .. .. .. .... .. .. .... .. .... ...
Differences ot the 20th pcrccntilc of the weight distribution of mcn and women in IIES ( 1960-62)and HANES (1971 -74), by agcandhcight: United States .. .. .. . . .. .. .. .... .... .. . ... .. .. .. .... . . .. .. .. .. .. .... . .... ....
Diffcrenccs at tic 10th pcrccntilc of the weight distribution of mm and women in IIES ( 1960-62)and HANES (1971-74), by aqc and hci.ght: United States ... .... . .. ... ... ... ...... .... .. ... .. .... ... .. ... . ... .... .. . .. ..
Diffcrcnccs atthc5th pcrccntilcof thcwcightd istribution ofmrnand \vomcnin IIES(1960-6!2)and HANES (1971-74), by age and height: United States . .. .... .. ... ..... .. .... .. ... ..... . . ..... .. .. ...... .. .. ... ... . ..
1
~
2~
~
5
1112
1~
14
15
43
3
4
4
6
7
8
8
9
9
10
10

SYMBOLS
Data not available ----------------------------------------- ---
Category not applicable -------------------------------- . . .
Quantity zero ----------------------------------------------- -
Quantity more than O but less than 0.05 ------ 0.0
Figure does not meet standards ofreliability or precision ----------------------------- *
iv
WEIGHT BY HEIGHT AND AGE
FOR ADULTS 18-74 YEARS
Sidney Abraham, Clifford L. Johnson, I’v1.S.P.H., and hkitthcw F. hTajjar,Division of Health Examination S~atistics
INTRODUCTION
The hci~ht and weight measurements ob-
tained from the Health and Nutrition Ikamina-tion SLu-vcy (HANKS), conducted by theNational Center for Hca.lth Statistics from April1971 thro~~gh June 1974, arc used to present
weight findings by height among mm and
women a~cd 18-74 years in the United States.In this report, weight by hci~ht data arc
analyxcd and discLlsscd by age and SC.S. ThetcchniqLlcs of mcasurcrncnt arc also discussed.The present findings arc compared with theHealth Examination SLirvcy (1-IIW), 1960-62.]
The analysis of weight by height studies withvariables IJthcr than a:c and scx wiIl bc prc-scntcci in fLltLlrc reports. Consideration of bodycomposition and configuration of obesity and of
nLltrilional statL~s wi]] ak be subjects of futurereports.
IIANES WJS designed to rncasurc the nutri-tional status of a scientifically dcsi~mcd samplereprcscntativc of the civilian noninstitLltion-
:Llixcd ])opulation in the Unitccl States of ages 1
through 74 years. This survey was :LISOdesignedto t)btain solmc limited information on theocncr~ll health statLls of the entire agc groLlp as,>well as sl)ecific information on the hedlh statusand medical care needs of those aged 25-74
yc:Lrs in the civilian lloninstitL[ti{ )n:L1izcd pol)ula-tion. A dc’t:Likd ckcription of the specificcontent and plan of ol>cration, inducting sarn]]lcdesign, has been published.z
As in prcvioLu IIcalth lkmina~ion Surveyprograms, the U.S. Burctiu ol’ the Census cool)-crated in the sw-nplc dcsi:n and in the initial
visits and interviewing at sclcctcd eligible house-holds in the 65 primary sampling L[nits (PSU’S)
throughoLlt the United States. Additional hoLlsc-
hold visiting, interviewing, history taking, andcaptaining of the examination portion of thepro~am were performed by the mobile exami-nation ccntcr’s field teams. The selcctcd samplepersons for- whom an :Lppointmcnt could bc
made were brought into the spcciall}’ con-
structed mobiIc cxarnination ccntcrs which weremoved into a central location in wch of theprima~ sampling Lmits. The teams, whichtraveled to the varioLls sL[rvcy locations thrt]Llgh-Out the coLlntry, inclLldc’d profession:d and
paraprofcssiomd medical and dental examinersand technicians, intcn~icwcrs, and t~thcr staff.
“rhc probability sampIc? design LIscci in thesL]rvcy providcrl a higher sanl~)lin~ ratio of thepoor, prcsch(wl chilclrcm, women of chilc[bcarins
ages, :Lnd the cldm-1}’ than of t)thm-s in thecivilian, ]Ioninstittltioll:dizcd population.
Field data collection operations for the firstHAN1}S sLlrvcy wmc started in April 1971 andcomplctc-d in JLIIW 197-I. Of the 28,043 pm-sonsaged 1.74. vcllrs \\,hc) ~~,cr~ sclcctcd ill the
nati(]naI l)robability sample to represent the 194million persons in that agc g-r~L1p in the civilian
noninstitLltiona] ixcd pol)Ldation, 20,749, [Jr 74
pcrccnt, were cxaminccI. When :L(l.iLlstmrnts arc
made for the differential sampling ratios USCC1for the effect or ovcrsanlpIin: among the p[mr,
preschool children, women of cflilcibcw-in: age,ancl the cldc~rly, this corresponds to an cffcctivcresponse rate 0175 percent.
Am(mg those 18-74 years of age at the timeof into-view for whom height ancI ;vci:ht
1

measurements were made, there were 13,645persons examined out of the probability sampleof 19,572 sclcctcd to represent the 128.0million of that agc in the population.
This is an unadjusted response rfitc of 70pcrccnt and an effective adjusted response rateof 70 percent. National estimates in this reportarc based on weighted observations, i.e., the dataobtained for each examined person arc inflatedto the Icvcl of the total po@ation.
METHODS
The examinces changed from their street
clothing into disposable paper examination uni-forms and foam rubber slippers designed tofacilitate and standardize various clcmcnts of theexamination. Body measurements were made atvarious times of the day at each examinationcenter and in different seasons of the year.
Thus body measurcrncnts were not standardizedby diurnal and seasonal variations. Weights varybetween winter and summer and may differdepending upon rcccncy of l(md and water
intake.
Height
For persons agccl 18-74 yew-s, height wasrnczsurcd with the cxamince wearing disposable
foam rubber slippers, feet together, back and
heels q+inst the upright bar of the height scale,head approximately in the Fmnkfort horizontalplane (“look straight ahead”), and standing erect(“stand LIp td]” or “stand LIp real stmight” with
some assistance and demonstration when ncccs-sary). However, upward pressure was not
cxcrtcd by the examiner to purposefully“stretch cvcry(mc in a stanclard manner, ” 2s isrccommcndcd by some. ~
The hci~ht-measuring equipment consisted
01’ a vcrtictil bar with a steel tape attached to a
lCY’CIplatl’orm. ,Lttachcd perpendicularly to thevertical btir was a horizontal bxr which was
brought down snLIsly on the cxarnincc’s hcud.Attached to another bar in the same plane as the
horizontal measuring bar was a ]’oiaroid camerawhich rw’ordcd the subject’s identification nunl-bcr next to the pointer on the scale, therebygivinx a l~rccisc rcadin:. “1’hc camera not only
gave a permanent record that minimized ob-server and recording errors but, by sliding upand down with a horizontal bar and alwaysbeing in the same plane, also eliminated parallax.That is, if the pointer had been in the space infront of the scale, it would have been read toohigh if the observer had looked up at the scalefrom below or too low if read down from above.
Weight
A Toledo self-balancing scale that mechani-cally prints the wei~ht to one-quarter of a pounddirectly onto the permanent record was used.‘rhis direct printing minimized obscrvm andrecording errors. The scaIc was calibrated with a
set of known weights; any necessary fine adjust-ments were made at the beginning of each newtrailer location, i.e., approximately every n}onth.The recorded weight was later transferred to apunched card to the nearest 0.25 pound (lb.).The total weights of all clothing worn rangedfrom 0.20 to 0.62 lb.; this was not dccluctedfrom weights presented in this report. Theexamination clothing used was the samethroughout the year so there is no seasonalvariation in the weight of clothing.
FINDINGS
Among men the averasc weights range from140 pounds for those 62 inches in height to 197
pounds for those 74 inches tall (&able 1 and”figure 1).
Among women the average weights rmge
from 123 pounds for those 57 inches tall to 161pounds for those 68 inches in height. Weights atthe extremes of the height mngc in some agc~roups did not show this constant incrcmc inweight. with advancing height. For cxarnplc, inthe a~c grcmp 55-64 years, those measuring 57inches weighed 10 pounds more, on the average,
thtin those 1 inch taller. In the agc groLIp 65-74years, the tallest group at 68 inches averaged 5pounds less than those 1 inch shorter. Thisrcllccts, in part, the greater sampling variability
at the extremes O( the hci(ght rangy.‘1’ablcs 2 and 3 present descriptions of the
distributions 0[ wci~ht by height for eachscs-agc group. The 5th, 10th, 25th, 50th, 90th,
2

200 r
190}
*4’
J,l, ,, l,,,,110
100
057 59 61 63 65 67 69 71 73 74
HEIGHT IN INCHES
Figure 1. Unadjusted mean and median weight of men and
women aged 18-74 years, by height: United States, 1971-74
and 95th pcrccntilcs arc given. At times, the 5thand the 95th pcrccntiks arc unstable. Thisinstability is caused by the small sample size ofgroups subclassified by SCX,age, and height.
Percentile distributions were derived fromsatnpIc sizes as small as 15 for some of the abovesubclassifications. Whenever less than 15 wereavailable for a scx-agc-height group, the per-centile is not given since these sample sizes madethe distributions at the extreme lower and uppertail Icss meaningful. This cutoff of 15 is arbi-trary and relative–less vaILIc should be attachedto the pcrccntiks obtained from sample sizes of15-30 than to those derived from much Im-gcrstimpIcs.
At each sclcctcd pcrccntilc point in thedistributions of weight by height among menand women, there tends to be an incrcwc inwci~ht with height for all age groups. Thispattern was also dcscribcd previously for themean weight by height. Some indication of thevariation in weight among individual of thesame height and agc is shown by the pcrccntilcsin tables 2 and 3.
Within each agc group, the average weighttends to increase with height. Deviations fromthis tendency probabIy reflect sampling errors
rather than any real weight diffcrcnccs in thepopulation groups from one height interval tothe next.
For persons taIlcr or shorter than theextremes of the height range shown, the samplewas too small to provide rcIiablc estimates of thepopulation’s weight distribution. Nlore compIetcweight and height distributions containingfurther information on these extremes arcshown in tables 2 and 3.
The distribution of weight for any givenheight tends to be positively skwcd, with~wcatcr deviations above than below the averageweight. This is rcflcctcd by the fairIy consistentcxccss of mean over median weights shown infigure 1.
For the purposes of smoothing the findingsfrom HANTES linear regression of weight onheight was used (see appendix). Mean weightsfor given heights were obtained from a linearregression equation for mcn and women for thesix age groups 18-2-I, 25-34, 35-44, 45-54,55-64, and 65-74 yew-s. The equations of weightby height were fitted by the ]east-squaresmethod, which holds that the line of “best fit”is the onc for which the sum of the squares ofthe residual errors is a minimum. “rhc linearregression of weight by height clcscribcs theaverage change in weight accompanying a unit ofchange in height. The estimtites of the con-stants—regression coefficient (b) and l--intercept(a)–in the re~~cssion equation 1’ = a + bx andthe standard error of estimate around theseregression lines for 12 age-sex groups are shownin table XV (see appendix).
Height-w’eight tables arc presented for menand women in the agc range 18-74 years, withmean weight values for each inch of height forthe height range of 62-74 inches for men and57-68 inches for women (tabIcs 4 and 5). Threeadditiomd vaIucs bclo~~’ and above the rncan~~,cight arc ~so giy,cn in these tab]cs. They
represent estimates of the range of 60, 80, and90 pm-cent, respectively, of the popultitionaround the mean weight.
Y& 0.8416 SY.X
Yt 1.2816 Sy-x
1’-21.6449 SY.X
3

For example, assuming normality the pre-
dicted mean plus or minus 0.8416 timesstandard error O{ the estimote indicates theran~c of weights that is cxpectcd to include 60percent 01 the examined pm-sons of u specificheight for a given age and sex group.
In this instance one would expect 30 pcrccmtof the individuals to be within this weight rangebelow and above the mean weight, with 20pm-cent falling outside either of these rtingcs,
values roughly eqliivalcnt to the lower and upper
20th pcrccntilcs of the distribution of weight byheight for agc and scx groups. The other two
estimates wound the mean (1’ i 1.2816 SY. ,
~lnd ]’ ~ 1.6449 S~. ~ represent 80 ancl 90 per-cent of the particular height group. This isrou~hly equivalent to the lower and upper10th and 5th pcrccntilc, respectively, of the
distribution of wei:ht by height for age and
Scx groLlps.
The srnoothcd averages shown in table 5were obtained from the linear regression equa-tions of weight on height for each of the 12
LLgc-scx groups (SW appendix). There w-c smalldifferences bctwccn the smoothed ~vcragcs and
the averages obtained directly from the data,avera:ing lCSS than a pound over the indicated
height ran:c (figures 2 and 3).
Among lmcn the differences rmgc from 0.08pound at ages 25-34 to 1.38 pounds at ages
55-64 years. The corresponding values amongwomen are 0.33 pound at ages 65-74 years and
2.3 pounds ut ages 55-64 years. The diffcrcnccsarc Jttributcd to the Icss stable values at the
extremes of the height distribution.The height-weight t~blcs (tables 4 and 5)
summarized in table 6 show that the averageweights by height for men and women increasewith age but in different patterns. AverageweiShts of mcn incrcasc rapidly until the agcgroup 25-34 years. The rwte of increase thenflattens out, with the averuge weights peaking in
the agc group 45-54 years for men of heights lCSSthan 68 inches and declining thereafter. The
average weights of men of heights 68 inches andmore peak tit ages 35-44 years and then tend to
decline.The average weights of women generally
advance rapidly to the agc group 35-44 years.
‘rhcy increase less r~pidly in the age groups
200–
190 -
180 –
170 –
g 160z
$ 150 -zGg ?40
E3
130
120[
/,,,,,,,,,,
110
100
057 59 61 63 65 67 69 71 73 74
1 HEIGHT IN INCHES
Figure 2. Unadjusted mean weights and smoothed mean weights
(estimated from the regression equations) of men andwomen aged 18-74 years, by height: United States, 1971-74
L_____1824 25.34 3544 45.54 55.64 6574
AGE IN YEARS
F’igure 3. Average difference over height range betweenunadjusted mean weights and mean weights from re@essionequations for men and women, by age: United States,1971-74
4

45-54 find 55-64 years, peak at the latter agegroup, and then decline.
The estimated number of adults, by age andsex in the Scncral population by weight groupsfor height, is shown in tables 7-20. The numberof adults in the HANES sample, by weight groupfor height, is presented in tables HI-XIV.
COMPARISON WITH PREVIOUSHES SURVEY
The average weights of men and women byheight m measured in the Health and NutritionIixamination Survey of 1971-74 were generallygreater than those from the HeaIth Examination
Survey (1111S) of 1960-62 (table 21, figures 4 and5). Among persons in age ~woup 18-24 years, thedifferences between averages during this periodincreased with height. This direction was Icssevident for men than for women, particuIm-ly inthe shorter heights. However, at ages 25-34 yearsthe pattern was reversed for women. The dif-fcrcncc between the average weights of women
in HANES and in IHES dccrcascd as heightincrcascd.
The differences in average weights for menand women 35-44 years showed the same
pattern. HAN ES data showed the averageweights of shorter people to be less than those inHES data and those of taller and medium weightpeople to bc more. Diffcrcnccs in averageWeights for taller persons and those of medium
height ringed from 1 to 13 pounds.Avcrtigc weights of women -!5-54 years in
IIIiS were, with one cxccption, 2 pounds Iw.s
than those of women in HANES. Avcra$c ~~cightsfor mcn shorter than 69 inches in this same age
gToU]) were ako 2 pounds Iess for HES and were
2 to 5 pounds less for mcn taller than 69 inches.At a~cs 55 years and over the average weight
for women in IIANES differed littIc from thatof women in III%. On the other hand, diffcr-cnccs bctwccn the average weight of men in
I IANKS and that of men in HKS increased withan increase in height. Men in II ANIt S with abuvc
fivcra~e height (69 inches and mm-c) weighedmore on the average-7 to 14 pounds at ages55-64 and 7 tO I 1 pounds at ages 65-74
years-than men in HIM did.
Women examined in HI%, 1960-62, tend toattain their maximum avemgc weigh t t w~odecades later than men of heights 67 inches andless. The corresponding figure is one decade laterfor men 68 inches and more. Ilromen in HANES
show the same picture with the exception thattheir maximum average \veight is attained t~vodecades later than the taller men and one decadelater than the shorter men (tabIe 22). This dcIaymay reflect the ~veight and caloric consciousnessof women.
In both HES and HANES women show agcatcr relative gain in average ~vcight with age ascompared to men. It shouId be noted that thesefindings may be influenced by changes in body
size for the successive generations in thesecross-sectional data.
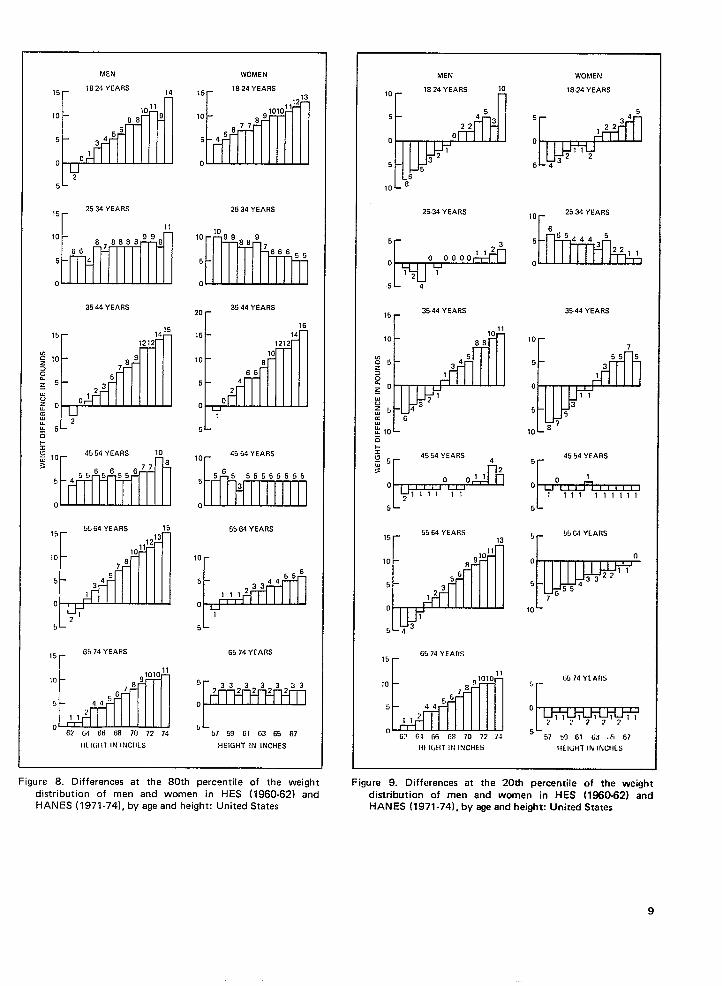
Selected percentiles of weights for each inchof height arc shown for HKS, 1960-62, andHANES, 1971-74, by age and sex in tables 23-28and figures 6-11. The differences in weightbetween HANES and HES, discussed previouslyfor the mean of the distribution, were also
observed for the upper end of the distribution(80th, 90th, and 95th percentiles) but at a largerorder of magnitude.
The greatest difference in weights of menwas at the 95th percentile. HANTES, greater ateach inch of height for each age group than the
corresponding percentiles for HM, averaged 9pounds OVCIdI. It ranged from u high of 10pounds at ages 18-24 to a lo~v of 6 pounds atages 65-74. At the 90th and 80th percentiles,the corresponding weights al’eragcci 7 and 6pounds more, respectively, otter all a~e groups
than those for Ill%.Similar patterns appcw- when the diffcrcnccs
between H/~T1;S und HES in the weight of
women in the upper distribution were anal~’zcd(tables 23-28 and figures 6-1 1). tit the 95th,
90th, and 80th pcrccntilcs, ~veights of personsexamined for II ANF.S wmc higher, on theaverage, than those for HFX by 9, 8, and 6
pounds, respcctivcly, for all +gc groups. ‘rhcdiffcrcnccs in ~vcights increased consistently~i~ith incrcascd height cxc~pt for th~ :lSC grollp
25-34 years, when the \vcights of shorter w[)rncn~,crc greater than those of t]l~ nl~dillm :lnd t:lllcr
heights.In contrast, Ior the lo~vcr end ut’ the
distribution (20th, 10th, and 5th percentiles)
5

210
200
[
18-24 YEARS 210 r 2534 YEARS
1901 — HAN ES, 1971-74
HES, 1960-62
1
140 ,..
130
o~62 63 64 65 66 67 68 69 70 71 72 73 74
210-
200 -
190 -
z~ 180 -0
; 170 -1-
= 160 -$
150 -
140 -
130 -<
35-44 YEARS
62 63 64 65 66 67 68 69 70 71 72 73 74
210r 55-64 YEARS
200 -
190 -‘8~ 180 -0&
~ 170 -+$ 160 -g
150 -
140 -
130j
62 63 64 65 66 67 68 69 70 71 72 73 74
HEIGHT IN INCHES
130L-
o~~62 63 64 65 66 67 68 69 70 71 72 73 74
210r 45-54 Y[.ARS
I200 -
190 -
180 -
170 -
160 -
[,, ,,, ,,, ,,, ,
140
130
0 -i
62 63 64 65 66 67 68 69 70 71 72 73 74
210
[
65-74 YEARS
200
I
130!-
o’~-u62 63 64 65 66 67 68 69 70 71 72 73 74
HEIGHT IN INCHES1 ~$tirlliltrd “;,lt,e~ I’r(,lll ~cgrcssic)l] Cqu;ltiot]s (II’ weights I’or sj~e~it’iud og~ grnutts.
N()’11{: l(~r I 960-62 ond 197 I-74, height wtts meusurcci without shots. l.<)r 1960-62 clothing weight WJS estimattcl M
avtrtiging 2 PO II II LIS. which wert, dc!ductrd t’n)m weights sh(~wn: for 1971-74 cl<~thing weight mnged from 0.20 to 0.62 pound,
which ww not dtductcd I’n]m weights shown.——
Figure 4. Average weightsl of men by age group and height: United States, 1960-62 and 1971-74

180 18.24 YEARS
1~1~
180 25-34 YEARS
170 170
160 _ HAN ES, 1971-74 160
~ . . . . . . HES, 1960.625150
,.150 .*”*
2 .*””●**
: 140 140 .*
$. . . . . . ●.*”
. . . . . . . . .y130 ●..-. . . . 130 ●.
.-. . ..*. . . . . .**
120 ●*=” .**●,. ..* 120 . .
*.C,**
110 110 ●-”*
o~ (j~57 58 59 60 61 62 63 64 65 66 67 6E 57 58 59 60 61 62 63 64 65 66 67 68
180 3544 YEARS
1=1=
180 45-54 YEARS
170 170
160..*
160.**.
●.**~
●*.
; 750. ..-”’ ●.=. . . .
. . . . 150 ..*. . . . . ●. .
. . . . ●*..
: 140. . . . . . .
..*” 140 .*lj . .*”*
●*..*” ●**$ 130 130 .*.. ”*
120 120
110 110
o~ crl~l57 58 59 60 61 62 63 64 65. 66 67 68 57 58 59 60 61 62 63 64 65 66 67 68
180 55-64 YEARS
IYIY
180 6’1-7,1 YEARS
170 170. . .. . .
160. .●*..
160g~ 150 150. ..*●***: 140 ,.** ..** 140;$ 130 130
120 120
110 110
()~ o~57 58 59 60 61 62 63 64 65 66 67 68 57 58 59 60 61 62 63 64 65 66 67 68
HEIGHT IN INCHES1
HEIGHT IN INCHESF.stimated values t’rom regrmw{)n q uutir)ns I)f weights for specified ugc gr[)up~.
NOTK: For 1960-62 und 1971-74, height was measured without sh,,es. I.ur I 960.62 c]othmg v.eight WI. estimated a,uveraging 2 pounds, which were deducted from weights shr)wn: for I 971.74 clothing tveight ranged from L1.zo t!, 0.f12 pound.wrhich was nnt deducted from weights shown.
Figure 5. Average weightsl of women by age group and height: United States, 1960-62 and 1971-74
7

MEN
201824 YEARS
15
10
5
0
IWOMEN
20 ~1824 YEARS
15
10
5
0
15r2534 YEARS
. . 151-’2534 YEARS
10 10
5 5
0 0
3544 YEARS25
3544 YEARS
r20 20
15 15
3z 10 1030Lg~ s
8z: 0 0
u.
: 154554 YEARS
g
z 10
$
5
0
20 ~5564 YEARS
15
10
5
0
15r 6574 YEARS
4554 YEARS
10
5
0
S564 YEARS
10
5
0
6574 YEARS
10 10
5 5
0 062 64 66 88 70 ?2 74 57 59 61 63 85 67
HEIGHT IN INCHES HEIGHT IN INCHES
Fiqure 6. Differences at the 95th percentile of the weight
distribution of men and women” in HES (1960-62) andHANES (1971-74), by age and height: United States
MEN
20r 1824 YEARS
WOMEN
1824 YEARS
15 15
10 10
5 5
0 0
1525.34 YEARS
r15r-2534 YEARS
10 10
5 5
0 0
20 r3544 YEARS
20 r55.64 YEARS
15
10
5
0
.5
10 —66.74 YEARS
5 -33
062 64 66 68 70 72 74
HEIGHT IN INCHES
3544 YEARS20
15
10
5
0
4554 YEARS
10777
5
0 Ill
55.64 YEARS
10
5
0
65.74 YEARS10 f-
5 -4
057 69 61 63 65 67
HEIGHTIN INCHES
Figure 7. Differences at the 90th percentile of the weightdistribution of men and women in HES (1960-62) andHANES (1971-74), by age and height: United States
MEN WOMEN MEN
10 r-1824 YEARS 10
5 -22
00
5 -
-6
10-8
15
10
5
0
151824YEARS
10
5
0
1824 YEARS
15~2534 YEARS 2534 YEARS 2534 YEARS
10r2534 YEARS
10 10
5 5
0 0
3544 YEARS20(-
3544 YEARS15
3544 YEARSr
3544 YEARS
-P1011
10 88
85 345z3 12=0
E43
2’
55a 8: ,0
=
10
P
7
555 5
31
011
53
1087’
~; 10
4554 YEARS 10
3
5
0
10 4554 YEARSr 4554 YEARS
‘r
5 -5 55555555
0
1
0 ~ o~”, r , t 1 1 I1 111 111111
5-
155564 Y[ARS 15
10
5
0
5
5564 YEARS15
5564 YEARS
10
5
0
5
5r 5564 YEARS
o0
5 -
10 rw556
523344
1110
1
5
10L
15r6574 YEAflS 6574 YEARS 6574 YEARS
15r10
5
062 64 66 6!3 70 72 74
10
5
.
GU74 YEARS
‘r5 -
0 0
2SL
57 59 G1 G3 65 67
HEIGHT IN INCHES
5L57 59 61 @ .15 67
liEIGHTIN INCHES
“ 62 6! GG 68 70 72 /4
HEIGHT IN INCHESHEI(,HTIN INCHES
Figure 8. Differences at the 80th percentile of the weight Figure 9. Differences at the 20th percentile of the weight
distribution of men and women in HES (1960.62) and distribution of men and women in HES (1960-62) andHANES (1971 -74), byage and height: United States HANES (1971 -74), byage and height: United States
9

MEN WOMEN
101824 YEARS 1824 YEARS
r
2534 YEARS 2534 YEARS
‘or
10r
3544 YEARS
7
5
v
5
333
0
1
335
5
7
10 ,09
54554 YEARS
o
s
15r 5564 YEARS5r
5564 YEARS
10 0
5 6
0 10
5
151_6574 YEARS 6574 YEARS
5
10
0
5
062 64 66 68 70 72 74 57 59 61 63 65 67
HEIGHT IN INCHES HEIGHT IN INCHES
Figure 10. Differences at the 10th percentile of the weight
distribution of men and women in HES (1960-62) andHANES (1971-74), by age and height: United States
MEN
1a24 YEARS
5 4
0
w
o
221
5
6547
.10 ,.9
12
2534 YEARS
5r
o
5 - 44
6
,OL
3544 YEARS
10
P
~e
555
,2
00
g
2:5& 54
g ,6
g .10 9
.K
:u.ii+ 4554 YEARSz25 —
21
0
5
5564 YEARS
15r
10
5
0
5
f35 74 YEARS
15
10
5
062 64 66 6e 70 72 74
HEIGHT IN INCHES
wOMEN
1824 YEARS
5-
0
-5 –
,OL
25.34 YEARS
,L
35.44 YEARS
55
0
5
10
4554 YEARS
To
5-5555555s55
5564 YEARS
5ro
5
10
6574 YEARS
5
0
5
57 59 61 63 65 67
HEIGHT IN INCHES
Figure 11. Differences at the 5th percentile of the weightdistribution of men and women in HES (1960-62) andHAN ES(1971-74), byage and height: United States
10
this direction was less eviclcnt for men, particu-
larly in the shorter heights. The weights of menbetween the two surveys in these percentileswere consistently greater only in ages 65-74years. The weights of women ages 45 years andover were consistently less inHIM.
DISCUSSION
Data on weight in relation
and agc arc a useful criterion
13ANES than in
to height by scxof onc aspect of
nutrit~)nal status. There are no current cs~imatcsof weight by height that arc representative ofthe gcmcral population. Data on such estimates,
published by the National Center for HcaIth
Statistics, Health K xam ination SLirvcy,1960-62,1 described a rcprcscnttitive sample ofthe population. Other avuilablc data arc takenfrom sclcctcd sc:mcnts of’ the population4-s andspecial study groups 6 but cannot bc gcncralizcdfor the population, The Iargcst collection of data
is from life insurance studies of insured persons.IHowever, bccausc of the composition of such
populations, the data do not rcprmcnt a truecross section of the country.
These cross-sectional data on weight andheight mcasurcmcnts of adults WC}C obtained ondiffm-cnt agc cohorts. The agc trends show themean and percentile body measurements for
successive cohorts of persons and rcfkct theeffect of di ffcrcnt environmental and hereditaryinfluences. The limitations of cross-sectionaldata arc rccqjnixcd in considering groL1p agechanges. I’tittcrns of weight gain and of gradutd
dcclinc muy be influenced by a sccuhu- trend inbody size for successive generations in u cross-scctional survey. A more accurate assessment ofthese changes can be done from longitudinal
data, where the some persons are followed formany years.
The tables in this report arc not presumed toindicate desirable or standard weight but only topresent a rcfcrcnce base for the person’s ob-
served weight. They show estimates over anclunder excess body weight of mcn and women byheight tind age. Thin-c arc no estimates of bodyfat other than what can be inferred from thedeviation of actual weight from the mean
weight; such estimates will not yield information
on how much of the weight difference isaccount-cd for by excess fat.
This approuch of predicting weight by height
showed a correlation which ranged from theorder of + 0.460 at ages 35-44 ycm-s to 0.390 atages 45-54 years for men of ages 18-74 years.
Corresponding correlation values for womenringed from + 0.285 at ages 65-74 years to+ 0.246 at ages 45-54 yew-s. The maximum
coefficient of determination for men a~cs 25-Wyears showed that about 20 pm-cent 01’ thevariance can bc explained by regression of
weight by height. For women this value wasabout 8 pcrccnt.
Comparison of an indi~~idual’s actual wcig]lt
with a standard weight is the most widely USCC1criterion of Icanncss or fatness. Inta-cst in thismeasurement stems from the findings of lifeinsurance and cpidcmiologicaI studies that relateexcess body ~vcight status to unfavorable mor-bidity and mortality cxpcricnccs. Using thismethod, the Iifc insLmncc studies dctcrmincdexcess body weight status. which is defined asthe dc~’iation of actual weight for a gi~’cn SCX,
age, and height from the average \vcight tablestimes 100.
These tables were obtained initiall> from the
hledic(j-~jcttl:iria] Investigations (19 12)J andlater from the Build and Blood Pressure StLldy(1959 ).5 Other studies, such as the FraminghamHeart Stud~’,6 dcllned excess body \vcight duc
to obesity :LSa rcklti~’e \veight of 20 pcrccnt ormore above the median \vcight for a given heightand sex.
Since it is recognized that height imd ~vcight
alone arc incomplete indicfitions of obcsitl’,
“desir:Lble” ~vcight tables that ttikc into con-sideration mcasurcmcnts of bud>’ build have
been dcvclopcd by the hktropolittin I.ife lnsur-ancc Company. Thesetables for LICILl]tS25 }earsand over, shoiving ranges of ~veights for givenheights, answer the criticism that height-~vcighttables ignored the disadvantages of the incrcasc
in body weight with ad~wncing years M \vell asvariations in body build that inllucncc theweight of individual. The average ~lrci,ghts in thetables arc for categories of bed}’ frame but thedetermination of frame size has nut been speci-fied or defined in terms of body mctisurmnents.
11

The user must exercise clinical judgment abouttype of body [ramc.
Such data arc not satislwtory for studyingthe influcncc of ohcsity on mortality. Obesity,an cxccss accumulation of fat, is ~(scd intcr-chmg-cably with (werwcight or cxccss bodyweight above standard weight. Total body
weight is a measur-c of bone, rnusclc, md f~t.Departure from average weight may be due toone or a combination of these body com-ponents. Overweight prmwntion and control is
directed agtiinst overweight due to fat, which isprimarily attributed to cxccss food intake overthe energy demands of the individual. This is the
major form of overweight in the United States.
Comparison With Previous Survey
Three factors were considered in comparing
the height-weight dat~ from the IIedth Ilxami-nation Survey ( 1960-62)2 with the currentHANES findings. The first factor, which in-
volved methods used in obtaining smoothed
average weights, was not a problem for theHANKS, 1971-74, data since a similar Iincar
rcgrmsion estimation was used.The second factor, diffcrcnccs in clothing
wei{ghts, will substantially affect the compara-bility between the studies. C10thin2 weights forIIES were nearly like those for HANF, S, averag-ing about 2 pounds more. Adjustments weremade for this difference. In both surveys,
subjects were measured without shoes.The third factor was measurement tech-
niques in HES and HANES. HIM, done by theI)ivision of Health Examination Statistics of theNatiorml Center for Health Statistics using the
same standardization of height and wcig-ht tech-
niques, provided the baseline against which thevalues from HANES were measured.
Comparable response mtes of examined per-sons cm whom measurements were taken are also
necessary in order to compare the weight
measures by height from the two surveys. TheHES sample had a response rate of 95 percent
interviewed and 86 percent examined, a highlyrepresentative sample of the civilian noninstitu-
tionalizcd population of the United States. Thecorresponding rates for IIANES were over 95percent interviewed and 70 percent examined.
The lower examination rate in the H,ANK3sample could have biased the mean weight
downward if heavier persons might bc less likelyto come for an examination. This is, however,unlikely because an analysis of medical historiescomparing the noncxaminees with the cxami-
necs indicated no large differences between thenonexamincd group and the examined group forthe medical statistics compared.
Findings from the present study show thatadults in HANES, 1971-74, gencrdly weighedmore than their counterparts in HIS, 1960-62.
Among women the differences in averageweights generally were largest at the ages under
45 years. Of women 64 inches tall, those in theage groups 18-44 years were 4 to 7 poundsheavier, on the a~teragc, than women of the sameheight and agc in 1960-62. In the age groups 45years and ova-, the differences in average
weights of women this height in the 1971-74period mm- those in 1960-62 do not exceed 2pounds.
The increase in heights cannot explain the
greater weights of men and women in HANF, S,1971-74, compared with HES, 1960-62. Al-
though adults measured in HAINM were tallerthan those in HES, differences are numericallysmall. HANES data showed men’s heights rang-ing from less than one-half inch to an inch taller
than the heights from HES data. Correspondingvalues for women arc from less than one-half
inch to slightly more than three-quarters of aninch taller. Excess caloric intake and sedentaryhabits are probably responsible for this greater
weight.The differences in average weights per: inch
of height by age for men and women were notidentical for the selected percentiles. In particu-
lar, the lowest percentiles, 20th, 10th, and 5th,were changed much less than the upper per-
centiles, which showed substantial gains inweight between surveys.
SUMMARY
This report contains weight by height find-ings by age among adult men and women aged18-74 years in the civilian noninstitutionalized
.
12

population of the United States based on datafrom HANKS in 1971-74. T~bIes of averageweights and sckctcd pcrccntilcs for adult Amcri-ci.tns arc estimated from linear regression equa-tions. I.incar regression equations save a betterthan cxpcctcd fit when used to smooth the datafor comparative purposes and to extend thcm atthe cxtrcmcs where the sample was too small toproduce rcliab~c estimates.
A comparison of the findings from theHANES study with those from the HealthExamination Survey study shows that Americanmen range in average weight from 140 pounds at
62 inches to 197 pounds at 74 inches tall;among American women this average progressesfrom 123 pounds at 57 inches to 161 pounds at68 inches.
. Adults in the HANKS study generallyweighed more than those in the Health Exami-
nation Survey. Men 18-74 years of agc in HESaveraged 3 pounds Iightcr than those in HANES.Women of this same age were about 1 pound lessthan women in HANT13S.
. The pattern of difference in averageweigh ts between the HANES study and HESstudy varied with height and age. Comparisonsarc made with adjustments for clothing.
. hlean weight increased consistently withagc and height according to both studies. How-ever, adults in HANF.S were generally heavierthan those in HES.
. At age groups 18-24, 35-44, and 55-64years, the differences in weight w-c mm-c formen ICSSthan 65 inches in height in HES than inHANES. For women in HANES at agc groups25-34 years, the differences were Iargcr at theshorter height than at the taller height, rangingfrom 3-8 pounds over HES.
—--~c)o.—
13

REFERENCES
1hlati~nal Center for Health Statistics: Weight by
height and age of adults, United States, 1960-62, by J.Roberts. Vital and Health Statistics. PHS Pub. No.1000-Series 1 l-No. 14. Public Health Service. Washing-ton. U.S. Government Printing Office, May 1966.
2 National Center for I~ealth statistics: plan and
operation of the Health and Nutrition ExaminationSurvey, United States, 1971-1973, by H. W. hliller. Vitaland Health Statistics. Series I-Nos. 10a and 10b. I.)HLWPub. No. (PHS) 79-1310. Public Health Service. Washing-ton. U.S. Government Printing Office, June 1979.
3Tanncr, J. M., Hiernaux, J., and Jarman, S.:Growth and Physique Studies in IBP Handbook No. 9.Human Biology: A Guide to Field Methods, Weiner, J. S.and Lourie, J. A. London. Internat. Biol. Programrne,1969.
4 Association of Life Insurance Medical Directors and
Actuarial Society of America: Medico-Actuarial Mor-tality Inrxstigation, Vol. 1. New York. 1912.
5 Society of Actuaries: Build and Blood PressureStudy, Vol. 1, Chicago. 1959.
6Kanne1, w. B., pea~on, G., and McNamara, p. M.:
Obesity as a force of morbidity and mortality, in FelixP. Heald, cd., Adolescent Nutrition and Growth. NewYork. Appleton-Century-Crofts, 1962.
7 Karpinos, B. D.: Weight-height standards based onWorld War II experience. ]. Am. Stat. Assoc.53:408 -419, June 1958.
8 Rosenbaum, S.: Height and weights of the Armyintake, 1951. j. Royal Stat. Sot. 117:331-347, 19~4.

LIST OF DETAILED TABLES
1. Average weight of men and women aged 18-74 years, by age and height: United States, 1971-74 .. .. ... ... . ... .. ... .... .. .. .... . .. .... ... . ...
2. Weight of mcn aged 18-74 years by agc and height: sample size, estimated population in thousands, mean, standard deviation,standard error of the mean, and sclcctcd pcrccntilcs, United States, 1971-74 ... .. ... ... . ..... . ... ... ... . .... .. .. .... . .... .... . .. .... .... . ..... . .. .. .. ...
3. Weight of women aged 18-74 years by agc and hci~ht: sarnplc siiic, estimated popuIatimr in thousands, mean, standarddeviation, standard error of the mean, and sclcctcd pcrccntilcs, United States, 1971-74 ... .. .. ... ..... .. . ...... . .. .... .. . ...... . ... .... ... ...... . .
4. Avcmgc wciShts and sclcctcd pcrccntilcs for each inch of height for mcn by age: United States, 1971-74 . .... .. . ..... . .. .. ... ... . ..... . .
5. Average wci@ts and schxtcd pcrccntilcs for each inch of height for women, by age: United States, 1971-74 .. . ..... . ... .... ... . .... ..
6. Average weights for mcn and women a~cd 18-74 years, by agc and height: United Stiatcs, 1971-74 ..... . .... .. ... .. ... .. ..... . .... .. ... . . ...
7. Estimtitcd number of mcn aged 18-74 yews in the population, by weight for height: United States, 1971-74 .. ... .. .... .. ... ... .. .. .. ..
8. fktimatcd number of mcn aged 18-24 years in the population, by weight for height: United States, 1971-74 ... .. ... ... .. . ...... . ... ..
9. Estimated number of mar aged 25-34 years in the population, by weight for height: United States, 1971-74 .... .. ... ... ... ... .... .. .. .
10. Estimated number of mcn ag-cd 35J14 years in the population, by weight for hci~ht: United States, 1971-74 .. .... ... .. ... .... .. .... .. .
11. Estimated number of mcn aged 45-54 years in the population, by weight for hci~ht: United States, 1971-74 . ... ..... . .. ..... . ... ..... .
12. Estinmtcd number of mcn aged 55-64 years in the population, by weight for height: LTnitcd States, 1971-74 .. .. .. .... ... . ...... .... ...
13. Lktimatcd number of mcn aged 65-74 ymrs in tlc population, by weight for height: United States, 1971-74 ...... .... ... . .... .. ... .. ..
14. Iktimatcd number of women aged 18-74 years in the population, by weight for height: United States, 1971-74 .. .... .. .. ...... ... ...
15. Estimated number of women aged 18-24 ycors in the population, by wci~ht for hcixht: United States, 197 I-74 ... ..... ... . .... .... ..
16. Iktimatcd number of women aged 25-34 years in the population, by wci~ht for hc,i@t: United St.ltcs, 1971-74 .. .. ... .. ... .. .... .. ..
17. Iktirmtcd number of women aged 35-44 years in the population, by weight for hci~ht: f-hited States, 1971-74 .... .... ... .. .. ... . .. .
18. Jktimatvd number of women aged 45-54 yews in the population, by wci~ht fnr hcixht: United States, 1971-74 .. .. .. ...... . . ...... ..
19. Estimated number of women aged 55-64 years in the population, by weight for hci~ht: United States, 1971-74 .... ... .... .. .. .... ...
20. Estimated number of women aged 65-74 years in the population, by weight for hcih+t: United States, 1971-74 ... .. . .. .. .... .. .... ..
21. Comparison of average weights for mcn and womwr in HES (1960-62) md HAiiES (1971-74), by agc and height:United States . ... .. ... ... .... ... ... . ..... ... ...... . ... .... ... .. ... .. ... ..... . . ..... .. .. .... ... . ... ... .. ..... . . ..... . .. . ... ... .. ..... ... . ......... ................................ .........
22. Comparison of relative change in weight by height with age over the mean for mm and women 18-24 years in HES ( 1960-62)and HANES (1 971-74): United States . . ..... . .. ..... .. ... ... .. .. ..... .. .. .... .. ... .... . .. ..... ... . ..... . . ..... .. ... .... .. .. .... ... . ..... .. .. ... .. . .. .. .. .... ................
23. Diffcrcnccs at the 95th pcrccntilc of the wcisht distribution of men and women in HES ( 1960-62) and IIANES (1 97 I-74), byage and hci~ht: United States . .. .. ..... .. . .. .... . ... ..... . .. .... .. .. .... .. . ..... .. ... ... . ... .... .. ... .... .. .. .. ... ... .... .. .. ..... . .. ...... . ... .... . .. ......... ...................
24. Differences at the 90th pcrccntik of the wci~ht distribution of mcn and women in IIES ( 1960-62) and IIANJXS ( 197 1-74), byasc and height: United States ... .. .. .. ... . .. . .... . .. . ..... .. ...... .. .. ..... . .. .... .. . ..... . .... ... ... . .... . .. ..... ... ... .. .. ... ... .... ... ... ... . .... ..............................
25. Differences at the 80th percentile of the weight distribution of men and women in HM (1960-62) and HAMS ( 1971-74), byagc and height: United States ... ... ... . .... .. ... .... . .. .. ... .. .. ... ... ... ... .. .. .... . .. . .... ... . .... . . ..... ... .. ..... .. .. ... ... . ...... .. .. ..... . ... ... .. ................ ..........
17
18
21
24
25
26
27
27
28
28
29
29
30
30
31
31
32
32
33
33
34
35
36
37
38
15

26. Dilfcrcmxs at the 20th pcrccntilc of the weight distribution of mcn and women in HES (1960-62) and HANES (1971-74), bya~c and height: United States . . . .. . . . . .. . . . . .. . . . . . . . . . . . . . . .. . . .. . . . . . . . . . . . . .. . . . . . . . . .. . . . . . . . . . . . . . . . . . . . . . . . .. . . .. . . . . . . . . . .. . . . . . . . . . . . . . . . . . . . ............................. 39
27. Dilfcrcnccs at the 10th pcrccmtilc of the weight distribution of men and women in IIfiS (1960-62) and HANES (1971-74), by. . . .
axe and h[’ight: Umtcd Stat~s . . . . . . . . . . . . . . . . . . . . . .. . . . . . . . . . . . . . . . . . . . . . . . . . . . . . . . . . . . . . . . . . . . . . . .. . . . . . . . . . . . . . . .. . . . . .. . . . . . . . . . . . . . . . . . . . . . . . . . .. ............................. 40
28. Dillcrcnccs at the 5th pcrccntilc (,1 the wci~ht distribution of mcn and women in lIES (1960-62) and HANES (1971-74), byagc and height: United States . . . . . . .. . . . . . . . . . .. . . . . . . . . . . . . . . . . . . . . . . . . .. . . . . . . . . . . . . . . . . . . . . . . . . . . . . . .. . . . . . . . . . . . . . . . . . . . . . . . . . . . . . . . . . . . . . . . . . . . . ............................. 41
16
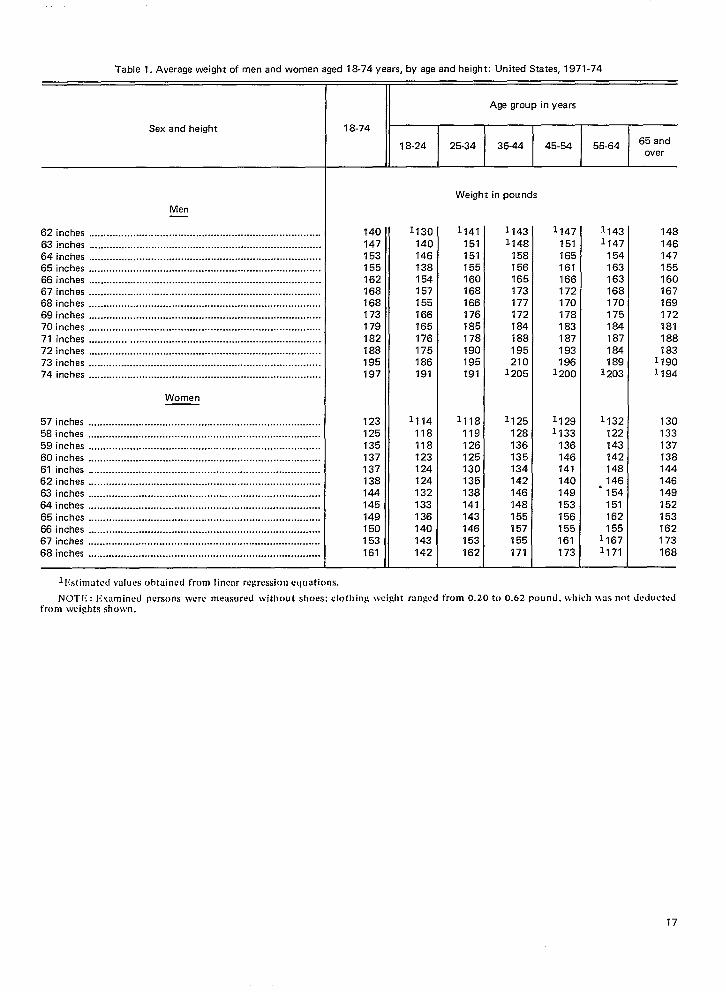
Table 1. Average weight of men and women aged 18-74 years, by age and height: United States, 1971-74
Sex and height
Men
Women
II Age group in years
18-74
18-24 25-34 35-44 45-54 55-64 65 andover
Weight in pounds
140147153155162168168173179182188195197
123125135137137138144145149150153161
1 l~stilllat~d VOIUIX obtained from ]inc:lr Ngrwk)l) cqUilti OIIS.
1130
140146138154157155166165176175186191
1114
118118123124124132133136140143142
1~41
151151155160168166176185178190195191
1118
119126125130135138141143146153162
1143l14g
158156165173177172184188195210
1205
1125
128136135134142146148155157155
171
1147
151165161166172170178183187193196
1200
11291133
136146141140149153156155161173
11431147
154163163168170175184187184189
1203
1132
122143142148146
’154151162155
11671171
148146147155160167169172181188183
11901194
130133137138144146149152153162173168
NCITI: : I,;suminwl persurrs were measured without SIIOW; ckrthing weight mngcd from 0.20 to 0.62 pound, w+ich WJS rmt Jeductcdfrom weights shown.

Table 2. Weight of men aged 18-74 years by age and height: sample size, estimated population in thousands, mean, standard deviation,
Age and height
18-74 years
62 inches .. . ... . .63 inches ... .. . .. .. .. . . ..64 inches . .. .65 inches .. . . . .. . ... . ..66 inches .. ..67 inches .. .. .68 inches . . .. .69 inches . . . .. .70 inches . . . .71 inches .. .. .. .... .... ....72 inches . .. . . ..73 inches . . . . ...74 inches . .. .....75 inches .. .. ... . .. .... .. ..76 inches .. .. .. .. .. . .....
18-24 vears
62 inches .. . ..... . .. . .... .63 inches .... .. . .64 inches . . .. .65 inches
66 inches .. .... ... .... .....67 inches .. .. .. .. .. . .. .. ..68 inches .. . .69 inches .. ..... ... . ... . ..70 inches . .. . . .71 inches ..... .... ... ... ...72 inches . . . . .73 inches ..... ... . .... .. ..74 inches . .. . .75 inches . .76 inches .. ... .
25-34 vears
62 inches . . ..
63 inches ... .. ... .. .... ...64 inches . ..65 inches . .66 inches . .
67 inches .... ....... . .. ...68 inches .. .. .. .. .. .... .....69 inches .. . ..70 inches . . .71 inches ... ... ... .. . .. .72 inches73 inches . .74 inches .. .... ... ... .... ..75 inches .. .. .. . .76 inches .. . . . .
standard error of the mean, and selected percentiles, United States, 1971-74
Samplesize
70139272453555699756686584385287176
733019
7101741
5981
116108115
76584322
67
317234170
8692
120112
7369522111
8
Esti-matedpopu-lation
inthou-sands
6471,2172,1673,8676,0057,5568,3528,6427,5545,4954,2692,8061,155
417552
147119213550
8881,1401,5001,6671,8091,342
870764329112260
13273383547
1,2171,3051,4042,0441,763
1,’1931,142
931366177216
Mean
140147153155162168168173179182188195197208198
**
146138154157155166165176175186191
**
●
151151155160168166176185178190195191
**
Stand-ard
devia-tion
——
18.4424.9325.3325.8723.3:327.3:325.0!327.9633.3:329.5031.6830.9032.9942.2931.83
.,
.,
19,8”122.2422.3!523,9420,7{326.1/325.11)25.5:230.1 !334,9!335,5:3
*,
,
29.3”725.3!525.2421.4624.1625.3G32.9944.1637.4729.6224.6030.61
**
Stand-ard
errorof themean
3.203.372.191.601.491.401.331.461.971.582.193.074.539.188.80
*,
7.644.743.033.992.653.482.613.465.366.999.57
**
*
10.06.855.533.373.552.444.026.024.174.504.048.21
**
Percentile
II+IZl
Weight in pounds
108
109112116124130129137138141139154148169144
**
118111
116121124133129141140132134
**
*
109111123129134129140141128154156157
**
123116124122133135138143144150151159158173164
**
120112125131132139137146147157148
**
*
110126128134136140148148142157165158
,*
126126135137148151151153159163166173173179169
,*
133121146140142147146157155164159
**
,
130133136145152149154159154168176167
,*
140148151
155161167168169
176181185192196192197
**
145134155153153161162170168180197
**
*
155148150157167164167180175185192182
**
150159166172176183182188195197211214218216213
**
151145165173168
182179187185201218
**
*
159161162176182i 81194197193210211217
**
163177184189191201199210212215225230233274231
**
186164172187180208195202214229228
**
*
196195194191199196225215212224224226
*+
169182199198196213212225232230241253264288232
**
187193179203195224213228228247234
**
*
197206201194207201233253224244241244
**
18

Table 2. Weight of men aged 18-74 years by age and height: sample size, estimated population in thousands, mean, standard deviation.standard error of the mean, and selected percentiles, United States, 1971 -74–Con.
—,
Age and helyht
35-44 years
62 inches ... ... ... .. ... ....63 inches .. .... .. ... ... .. ..64 inches ... .... .. .. .... ...65 inches .. .... .. .. .. .. .. . .66 inches ... .... . ... .... ...67 inches ....... . .. .... .. ..68 inches .. ... .. ... . ... . ...69 inches .. ..... . .. .. .. .. ..70 inches ..... .... .. .... . ..71 inches .. .. .... .. .. .. .. ..72 inches ..... . ... ..... . ...73 inches .. ... ... .. .... . ...74 inches ..... .. .. .. ... ... .75 inches .... .... .. ... ... . .76 inches ... .. .... . ..... . ..
45-54 years
62 inches .. .... ... ... . ... .. .63 inches ..... .. .. .. .. .. ....64 inches ... .. ... ... . .. . ... .65 inches ...... . .. . .... . .. ..66 inches .. .... .. . . .... ... ..67 inches ... . .. ... ... . .. ....68 inches .. .. .. .. .. .. .. .. ...69 inches .. .. ... .. .... ... .. .70 inches .... .. .. .. ... . .. .. .71 inches ..... ... ...... .... .72 inches .... .. .. .... . ... ...73 inches ..... .. .. ... .. .... .74 inches .... .. .. . ... .... .. .75 inches ... .. .... ... . .. ....76 inches ..... .. .. .... ... .. .
55-64 years
62 inches ... . .... .. .. .... .. .63 inches ... .. .... .. ..... .. .64 inches .. . .. ... ... .. .. ....65 inches .... .. .. .. . .. ... .. .66 inches .. .. . .... .. . .. .....
67 inches ... .. .. .. ... . ..... .68 inches .. .. . ... .. .. .... .. .69 inches ... .. ... .. .. ..... ..70 inches .. . . .. .. .. . ... .. .. .71 inches .. .. . ... . .. ...... ..72 inches .. .. .. .. .. .. ...... .73 inches .. ... .... .. .. . ... ..74 inches .. . .. ..... . . .. .. ...75 inches ... .. ...... .. ... ...76 inches .... .... .. .. . ... .. .
Samplesize
3122340
6375
98978869442911
52
916235976
112121110
8454492710
61
10123359699690755648
2215
411
Est!.matedpopu.Iatlon
Inlhou.sands
88200298524987
1,2411,6031,5361,3431,128
882465198
7230
141211290765
1,0761,6051,7201,5941,341
818870425173
5022
133192485757
1,0891,4391,3131.241
841833325195
705
24
Mean
**
158156165173177172184188195210
***
*
151165161166
172~70178183187193196
***
●
*
154163163168170175184187184189
***
Standard
devra.tton
**
18.0325.5924.7624.1020.7923.7430.7223.4636.6831.76
***
*
14.9135.9626.0124.1929.1927.4827.3025.0828.6124.8431.36
●
●
*
●
●
23.8526.8221.2131.7224.5726.4732.0528.3835.0122.52
**●
Standarcl
errorof themean
**
6.024.463.863.092.472.354.022.99
6.215.27
●
**
*
4.7010.33
3.203.60
2.963.532.922.874.674.278.08
●
●
●
●
*
3.823.403.763.263.944.325.606.029.206.65
***
Percentile
111111’
Weight in pounds
**
125121
124134140140143155138159
***
*
107101116136129126136143134156144
***
*,
104112123128130139139153131158
*●
*
**
139125132147150147147159140172
*,*
*
136126131137143130142147153164156
*●
*
*●
124128131135146146149154132160
**●
**
151137144159162153166169169186
***
*
143140143151158154162164169176173
●
●
*
●
●
140146152145154154165167157171
●
●
*
**
160159164172
177169185186197204
***
*
154159161165168173176184190193192
●
●
*
●
*
154162165167171172177187182194
*●
*
**
173169181185
194189198199222225
●
+,
●
161193177179
185185190199199213217
*●
●
●
●
165177176182182188
198203213202
*●
●
**
183190192206
204199207223237258
***
*
168224189194202
210215211220225222
●
●
*
*,
182196186204201209224214215212
***
**
184192203211209208218232243277
***
*
169236211200
215223220234236240234
***
**
201209193229214
238236232239233
●
**
19

Table 2, Weight of men aged 18-74 years by age and height: sample size, estimated population in thousands, mean, standard deviation,
standard error of the mean, and selected percentiles, United States, 1971-74—Con.
Age and height
65-74 vears
62 inches ... .. .. .... .. .. . .63 inches ... .. . .... .... ... ..64 inches ... .. . ..... . ... .. .65 inches .. ... .. ... .. .. ..66 inches .. . .... .. .. .. .. ....
67 inches ... . .. .... ... . .68 inches ... .. . ... .... .. .69 inches ... . .. .70 inches .. . . .. . .71 inches .. .. . ... .. .72 inches ... .. .. .. ... . .. .. .73 inches . .. . .74 inches .. .. ..75 inches ... .. .. . .. .... .. .76 inches .... .. .. .
Sample
Slzr!
3872
153213218
249239176129
654510
51
Est!-
mated
popu-
lation
(n
thou.
sands
124224497725745827812558458181179
2618
1
Mean
148146147155160
167169172181188183
,**●
—.—-
Stand.ard
devla.Ilon
18.1719.9421.6121.3424.5324.4825.2024.6529.3623.4728.19
,.,....
Stand.
ard
error
of the
mean
3.262.432.121.582.041.671.873.023.004.325.32
●
,**
Percentile
I5th I10thI 25th I 50th I 75th
I90th I 95th
Weight in pounds
120112110118117
127126139139146143
****
124
121
121
124
129
135
137
143
149
153
149*
*
*
*
NOTI;: I{xamir,cd persons were measured without shoes; clothing weight ranged frnm 0.20
138132132141147153152152161178161
,***
148144148156159167167168177190
185****
155156161170175180182187193204202
****
172177175181189197204209214218211
****
179182182188199
212214214236230233
****
I 0.62 pound, which was not deductedfrum weights shown.
20

Table 3. Weight of women aged 18-74 years by age and height: sample size, estimated population in thousands, mean, standard deviation,
Aye and height
18-74 years
57 inches .. ... .... ... .. ... .58 inches .. . .. .... .. .. .... .59 inches .. . ... .... .. ... ...60 inches ... .. .... .. . .. ....61 inches .... .... ... . .. .. ..62 inches ... ... . .. ... ... .. ..63 inches .... .. ... ..... .. ...64 inches ..... ... . ...... . .. .65 inches ... ..... . ... .. .. . .66 inches ..... .. .... ... .. ...67 inches .... .... .. .... .. .. .68 inches ..... .. .. .. .... .. ..69 inches ... ..... .. . ..... .. .70 inches ... ...... .. .. .. ....
18-24 years
57 inches .. ... ..... ... .. ... .58 inches ... .. ..... ... . .... .59 inches . .... .. ..... . . .....60 inches ... .. .. .. .. .. . . .. ..61 inches .... .. .. ... ... ... ..62 inches ... .. ... ... .. .. ....63 inches ... .. .. ... .. ... ....64 inches ..... .. .. .... .. .. ..65 inches .. ... ... .. .. . .. . .. .66 inches ..... .. ... ... .. .. ..67 inches .. ... ... . ..... . ... .68 inches ...... . .. .. .. ... ...69 inches ...... ... . .... .. ...70 inches ... .. ... .. ... .... ..
25-34 years
57 inches ... . ..... ... ..... ..58 inches ..... . .... . ... .... .59 inches .. . . ...... .. .. .....60 inches .. . .. .... .. .. .. .. ..61 inches .. ... .. .... ... . ....62 inches .. . .. .... ... . .. ....63 inchas ... .. .. ... .. ... ....84 inches .... . .... ... .... ...65 inches .. ..... ... . ... . ... .66 inches .. ..... . .. .... .. ...67 inches .. ... ... . .. .... . ...68 inches ... .... .. .. .... ....69 inches ... . ..... . .. .... ...70 inches .. ..... .. .. .... ... .
standard error of the mean, and selected percentiles, United States, 1971-74
Samplesize
gg
16533861997C
1,2421,2971,2001,061
623375217
8740
11
203881
125197248245224142
93482512
13264374
205279308272269180114
712312
Est!.matedpopu-lation
inthou-sands
53e1,1052,5034,5837,493
10,16310,31610,148
9,0725,3283,1341,818
744347
70
162248560
1,0371,6911,9641,982
2,1511,257
88643 ‘1244113
80158296528
1,444
2,0812,2561,9432,0471,381
843539161173
Mean
123125135137137138144145149150153161158162
*
118118123124
124132133135140143142136
●
*
119126125130135138141143146153162153
*
Stand-ard
devia-tion
28.3!29.6128.7730.34
29.3130.4:31 .5s
30.8C33.8232.8132.6536.1 E43.2430.56
●
19.5C20.1 c24.2E25.2425.OC24.9324.OC30.1528.7~30.1623.5C17.25
*
*
20.4725.8225.7528.5128.1030.4733.8132.0731.9231.3336.2840.26
*
Stand-ard
errorof themean
4J3$
3.7f1.9:2.5~
1.011.1$1.0:1 .2[
1.4:‘1.6:1.91
2.7.!4.446.1 E
*
4.3.E4.0>4.2E2.412.311.721.742.673.023.553.464.87
●
●
4.953.304.762.121.642.332.832.44
2.053.143.848.65
*
Percentile
1111+11
Weight in pounds
8[8;95
9f10(10:1OE1():
Ilc17411712212C128
+
87g!
93
9797
101104104112112117104
●
●
959195
100103104107109109120125120
●
8[92
10?IOEICY1C)g
Ilc114II?yl~
12>12712e73C
●
909e96
10199
1061Oe110114115119119
●
*
979797
103107109110115
118123129124
,
105Iclf11211~
Ilc11~
122I .25
12712E132137133142
*
106107107109109114116119121129127130
*
*
102115106110116118120122124131137136
*
12111$
13113113213213713814C144144154144159
*
112112115118119129130130131138140134
,
*
115126120121127131131
134’137144152143
●
146I 3$
153152154151159161
162163164173166172
*
131132132132133142142143154151150142
*
●
141131134138146747150153
160173172155
*
165177
169180176176187
187193192
194209216206
*
155145154150150
162165162174164161152
●
●
147151171172172178188
187190191217177
●
171188185194191194206202212214216238254220
*
157162179182166188179190190187168170
*
*
157186185187190201207210
217221237292
*
21
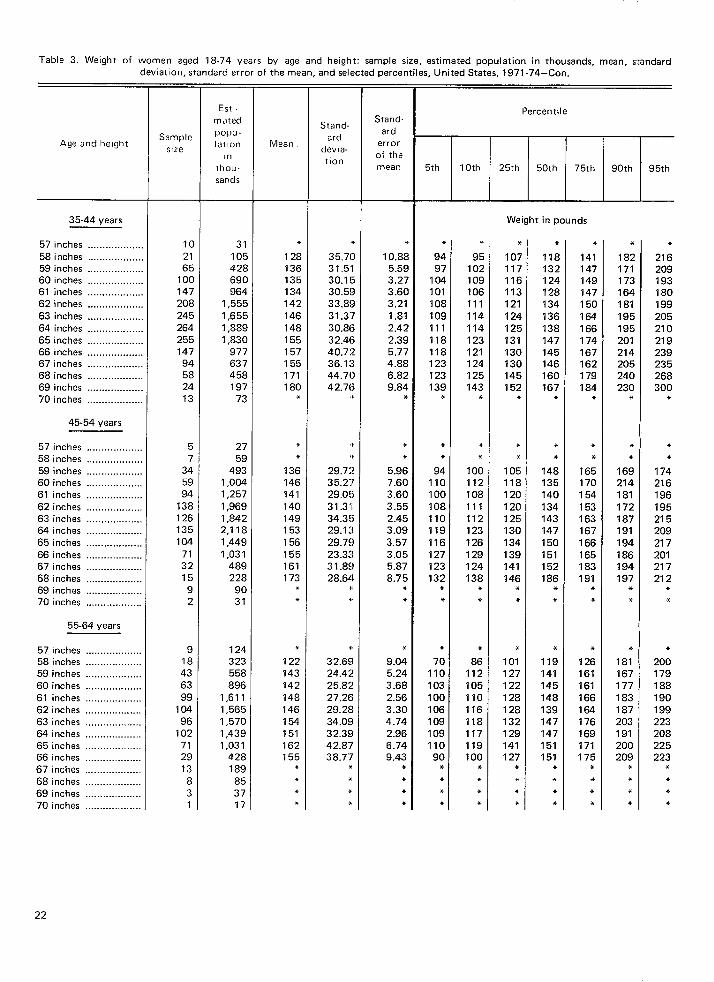
Table 3. Weight of women aged 18-74 years by age and height: sample size, estimated population in thousands, mean, standard
deviation, standard error of the mean, and selected percentiles, United States, 1971 -74–Con,
Age and he(ght
35-44 years
57 inches .... .... . ... ......58 inches . . ..... .. .. ... .59 inches . . . ..60 inches .. .. . . ... ... .. ...61 inches .. . ... . .... .. .. ...62 inches ... .. . ... ... .. ...
63 inches ... .. ..... .. .. ....64 inches ... .... .... .. .. .65 inches ... . .... .... .. .. ..66 inches ... .. ...67 inches ... .. .. ..... ... ...68 inches ... .. .. ....... . .. .69 inches . .. .... . .... .. . ..70 inches ... . .. ...
45-54 years
57 inches .. . .... ... .. .....58 inches ... .. ...... ... . ... .59 inches ... .. ...... .. .....60 inches ... .. .. ... .. .. . ..61 inches .. . .. .
62 inches .. . ... .... ... .. .. ..63 inches .. .. .. ....... . ... .64 inches ... .... . ...... ... ..65 inches ...... ... ....... . . .66 inches ..... .. .. .... .. . ...67 inches . .. .. . . ...68 inches ...... .. ... .... .. ..69 inches .. ... ... . ... ..... ..70 inches ... .... .. .. . .... ..
55-64 vears
57 inches . .58 inches ... .. . .59 inches .. .. .. .... .... . . .
60 inches ... . .. .... .. .. ..61 inches .. .. ..... ... ... .. ..62 inches .. .. .63 inches .. .. . . .64 inches . . .. . . ..65 inches .... ... .. ..... .. ..66 inches .. . .. .67 inches . .. . ..68 inches ... .. .. .. . .... .. ..69 inches . . . .70 inches .... .. .. . . ... .. ..
Samplestze
Ic2165
1Oc14720~245264255147
94582413
57
345994
138126135104
713215
92
918436399
104
96102
712913
831
Est(.
matedpopu.Iatlon
[nthou-sands
31I o~
42E69C964
1,555
1,6551,8891,830
977637458197
73
2759
4931,0041,2571,9691,8422,118
1,4491,031
489228
9031
124323558
8961,6111,5651,5701,4391,031
428189
853717
Mean
*12e136135134142
146148155157155171180
*
**
136146141140149153156155161173
**
*
122143142148146154151162155
****
Stand-ard
devla-tlon
*35.7C31.5’I30.1 !530.5!233.8!?31.3’730.8632.4640.7236.1344.7C42.76
.+
,,:,
29.7235.2729,05
31.31134.3529.1329.7923.3331.8928.64
.,
,.
*.
32.6924.42!25.82!27.2629.2$334.0s132.3SI42.8738.77
****
Stand.ard
errorof themean
*10.8.5
5.5s3.273 .6C3.211.812.422.395.774.886.829.84
*
**
5.967.603.60
3.552.453.093.573.055.878.75
**
*
9.045.243.682.563.304.742.966.749.43
●
***
Percentile
5th 10th 25th 50th 75th 90th 95th
*9497
104101108109111118118123123139
*
*,
94110100
108110119116127123132
**
,
70110103100106109109110
90*,**
*95
102109106111
114114123121124125143
*
**
100112108111112123126129124138
,*
*
86112105110116118117119100
*●
*,
Weight in pounds
%107117lIE11:121124I 25
13113C13C14~
15.2*
**
105118120120125130
134139141146
**
*
101127122128128132129141127
**●
*
*11213212412E134
136138147145146160167
*
**
148135140134143147150151152186
**
*
119141145148139147147151151
****
*141147149147150164166174167162179184
*
**
165170154153163167166165183191
**
*
126161161166164176169171175
****
*182171173164181195195201214205240230
*
**
169214181172187191194186194197
**
*
181167177183187203191200209
***●
*216209193180199
205210219239235268300
*
**
174216196195215209217201217212
**
*
200179188190199223208225223
*
***
22

Table 3. Weight of women aged 18-74 years by age and height: sample size, estimated population in thousands, mean, standarddeviation, standard error of the mean, and selected percentiles, United States, 1971-74–Con.
Age and helyht
65-74 years
57 inches .. . ... .. . .. .. . .... .58 inches .. .. ... .... .. .. ....59 inches .. . ... ..... .. ... ...60 inches ... .. .. ..... . .... ..61 inches .. .. ... ..... . .. ....62 inches ..... .. .... ... . ....63 inches .. . .. ..... .. .. .. ...64 inches ... . ... .. .. . .... ...65 inches ... .. .. .... ... . ....66 inches . .... .. .... ... . .. ..67 inches .. .. .. .... .... . ....68 inches ... .... .. ..... . .. ..69 inches . ... .... ... .. . ... ..70 inches ... .... .... .. .. .. ..
Samplesize
5173
115242300316274182138
542917
3
Est 1.matedpopu -lation
inthou-sands
204297482917
1,1731,3051,030
768572251
917815
Mean
130133137138144146149152153162173168
*+
Stand-ard
devia-tion
26.4426.2930.4529.1528.1228.8026.3227.6427.7726.2031.5023.58
●
●
Stand.ard
errorof themean
4.874.753.582.592.511.832.062.553.375.009.216.25
*●
Percentile
Weight in pounds
87 10594 10584 10499 107
100 112106 115113 120111 121119 122135 140127 145132 138
● ●
● *
113111115116126126131135132146149155
*●
133130131136140142144150150147168171
●
●
147150153158160165160167169175190184
●
*
-
167180179178177183183183189208220190
**
171188190191195200192195199215251223
*●
NC)Tlt: Examined persons were memurcxl without shoes: clothing weight ranged t’rom 0.20 tu 0.62 pound, which was not deductedfrom weights shown.
23

Table 4. Average weights and selected percentiles for each inch of haight for men by age: United States, 1971-74
,,,] i),, l,, . .. -. . ..- .-
(h! i\, cl,,, -----------
h. ill’ h<,s----------
h~ inehc, s ----------
ha inchc. s ----------
b7 inchc -----------
68 inchc>s ----------
I 751(,5
15i~107
95X5
18(1I7(1158135’)12I ()()
Y(1
185175163
j~g117105
9~
I 90I 80
~6 &JQ122110100
195185173
~127115105
199189177g
119109
2okI94182g
124114
IYl180~J.’+l,115I(1?91
195184171T iq119I0695
?00189J 76I507&—-,~~IllI0[)
?OhI95I82.fl
~– ~
1“10117IIJtl
?10I99186:EJc
121110
2152ob191-II
126115
220’209196
~
120
I 88I 78lb6g
I[)898
IV)18J171TL81,2<II)1[))
198188176[i:jjI30118108
20)19)181:Ij~lJ5l~j11)
208198186I@
128118
214204192km146I34124
219’209197
W
129
I Y!. I90)8) 18(1171 ,~h7FI4]: ,lLj~1?$ IIYIll 1(Ih10(1 Yh
20% 2[)01Y? 190I80 177!;;? [~;;
1~,) 116I09 106
2(I7 ’205196 195Ia4 }~~[H: [j>E
1341~~ 121lIJ 111
211 210200 200Iaa 187Q g
128 126117 116
216 215205 205193 192.m+ MM
133 131122 121
z~() 220209 210197 197
y ~
126 1261
186!76165i1411~1110I00
I90I80169[“g
I74I04
I94184173~;
Iitt108
199189I78I;E;
l~j113
203;:;
Ii60i-m127117
207197186~142131121
212202191
~
126
—
Hc,ight
69 inchcs ----------
70 in. h<.s ----------
71 inchc,s----------
72 inchL,6----------
71 incht.s----------
74 inches ----------
Age Eroup in vmrs
18-24 25-J4 35-44 45-5& 55-64 65-74
209199187%
129119
213203191Ef$
133123
218208196~
138128
7-~,
21j201r~~155143133
228218206~
148138
233223211qgl
153143
~~~21’32g‘+;$
135124
229218205Kg
140,79
234223210~158145I34
239228215~163150139
244233220
~
144
249238225~
160149
~~!
21!20:(.fi15f1A!I3!
7-~c21:20;r~,——161]&(13[
23:22?21:~16;155145
2 J:22!21;~17115$,45
245235222m177165155
25C24CZze~18217C16C
y~4?Ij201~r~
1?+1110
229218206[i_8Tm14blJ5
23&221211g
151140
238227215g
155144
243232220~
160149
247236224p-iig176164153
225
215202[;~
141IJI
2 )[,22C207[~
146136
2J6~~6213~165152142
240230217@
156146
244234221~
160150
250240227q%
166156
216206195LI#
1401Jo
~~o?Ifl199g
I44134
?25215204‘g
149139
229219208q
153143
233223212LI#
157147
237227216~
161151
N03’FS : lx;lnlitlcd pers[, ns were me:bsurcd witllottt shoes: clotlling wei@lt ranfted fronl 0.20 to 0.62 pound. which was not deducted t’ronl weights shown.
‘rhe wciellt val Lies were comuu ted t’rom the rcxrcssion Wuation of !vcic!lt on height hv we. The V: IIUCS above ood Mow tlw eKPectcci mew $WIIUC revresent the
+,8416, . I,2816, md + 1.644<1s’tandard error o< tie mtinl:it; covering with-in lllis mn~e 60; 80. :IIId 90 percent of the PIV1ll$Ltion aro”und the nlmn, rcspec”tivcly. Thefirst rauge is expected tllus to idcntit’y 20, 10. und 5 percent c)V th,b populxtioll of the specific height on citllPr side 01’ the mnge.
JiWrCs irl o tire the expected means,
24

Table 5. Average weights and selected percentiles for each inch of height for women, by age: United States, 1971-74
He!ght ===1=18.24 25.34 35.44 45.54 55.64 65.74
Welghr In pounds II
1601 1711 1831150 159 170138 145 154
Eg ~ IIg
78 77 8068 65 67
163 174 187153 162 174141 148 158
q q @
81 80 8471 68 71
166 178 191156 166 178144 152 162
~ g g
84 84 8874 72 75
169 181 195159 169 182147 155 166
q g g
87 87 9277 75 79
172 185 199162 173 186150 159 170
qz# ~ qg
90 91 9680 79 83
175 189 202165 177 189153 163 173
~ ~ ~
93 95 9983 83 86
1 1
185 187 178 63 inches172 175 167157 160 154
~ ~ ~
86 89 9373 77 82
189 191 182 64 tnches . . .. . . .. . . . .176 179 171161 164 158
~ g q
90 93 9777 81 86
192 195 185 65 Inches .. . . . .. . ... . .. . . .179 183 174164 168 161
lmJ ~ lEJ
93 97 10080 85 89
196 198 1S8183 1S6 177
168 171 164
~ $z# Ez#
97 100 103a4 88 92
199 202 192186 190 181171 175 168
g ~ g.
1co 104 10787 92 96
66 Inches
67 ,nchcs
. .
.. . . .
203 205 195I
68#nches ,..,.,,.,.,..,,,,..,,,,.190 193 184175 178 171
g P# ~.
104 107 11091 95 99
,,,,.,...,
.
.,...,,,,,
.........
.,.,,...
Age group In years
18.24 25-34 35-44 45.54 55.64 65.74
Weight in pounds
156 166 777 178 181 175
g g ~ g g g
96 98 103 107 110 11486 86 90 94 98 103
181 195 210 210 21 ~ 202171 183 197 197 200 191159 169 181 182 185 178
E#~~E#E#~
90 101 107 110 114 11789 89 94 98 102 106
184 199 214 214 215 206174 187 201 201 203 195
162 173 185 186 188 182
E#qmMm~g
102 105 111 115 117 12192 93 98 102 105 110
187120312171 21712191209177 191 204 204 207 198
165 177 188 189 192 185
~ ~ g g p g
106 109 114 118 121 12495 97 101 105 109 113
190120612211 221[ 2221213180 194 208 208 210 202168 180 192 193 195 189
g E# = ~ q ~
108 112 15E 122 124 128
98 100 105 109 112 117
1931 21OI 225] 2241 2261 217183 198 212 211 214 205171 184 196 196 199 193
g ~ g ~ g ~
111 116 122 125 128 132
101 104 109 112 116 121
I I I I I
25

Table 6. Average weightsl formenand women aged 18-74years, byage and height: United States, 1971-74
Sex and heightc
Men—
64 inches65 inches66 inches67 inches68 inches69 inches70 inches71 inches
72 inches73 inches74 inches
57 inches58 inches59 inches60 inches61 inches62 inches63 inches64 inches65 inches66 inches
67 inches68 inches
Women
Age group in years
18-24 25-34 35-44 45-54 55-64 65-74
130
135140145150154159164168173
178183188
114117120123126129132135138141
144147
141145
150156160165170174179184189194199
118121125128
132136139
142146150153157
Weight in pounds
143
148153158163169174179184190194200205
125129133137141144148152156159
163167
147
152156160164169173177182187191196200
129133136140143747150154158161
165168
143
147153158163168173178183189193197203
132136140143147150153157160164
167171
143
147151156160164169173177182186190194
130134137140
144147151154158161165169
ll~stin]~t~d “alucs frtIIIj regression equtitic)ns of weight on height forspccified WY groups.
NOTI;: I;xamincd pcrsnns wtre mewurcd without shoes: cl()illitlg weight rongedfrom 0.20to 0.62pc)und, wllichw,ls[]()t deductedfrom weights shown.
26

Table 7. Estimated number of men aged 18-74 years in the population, by weight for height: United States, 1971-74
He!ght
Weight {n pounds
TotalLess 11o- 120. 130. 140. 150.than
160- 170. 180. 190. 200. 210. 220. 230 or
110119 129 139 149 159 169 179 189 199 209 219 229 m~,~
Estimated population #n thousands
Toml 3,8881 6,2MI 8,4931 8,7621 8,3471 6,904] 5,1401 3,339
Zlm2,359
~
2,330 1,635
1419
25 6522 84
176 57256 127348 207222 196273 181480 290266 243170 111
92 41
2,385_
14
4211550
200102307381278338273138264
108170160161346303259347184167110
35
10
122 24 19 8 19 2 4 595 184 71 40 15 7 1 2
L149 161 286342 348 374453 561 526501 847 992668 783 1,252530 915 1,310363 996 1,414262 788 849118 311 647204 154 443
49 65 21332 43 94
24 3
93 124284 159617 402
1.226 828
121 331 2
l-l2,167 92 823,867 102 2016,005 47 1297,556 26 1038,352 23 1298,642 5 367,554 13 85,495 34,269 -2,8061,155
969 .
155 63 67300 178 76493 381 102
J.--L827 457 369898 610 322886 676 456
1,211 900 619847 892 376670 328 354362 311 364175 136 121
59 170 103
1;467 1;2971,035 903
788 671483 490299 361
73 5224 88
NOTK: I.x:mlind pwon~ were mwurmi without allow Cloth in!! weight ranwd from 0.20 U) 0.62 pound, which w. nut LL’I.ILIL’M I’rom w$igllt. 410 WT1.
Table 8. Estimated number of men aged 18-24 years inthepopulation, by weight for height: United States, 1971-74
Weight in pounds
Height TotalLessthan130
130- 140-139 149
180- 190-189 199 J-
200. 2100r209 more
I
Estimated population in thousands
Total .... .. .. .. ... . .. .... . .. ..... .. . .....
I11,754 956
191 113119 82213 33550 213888 117
1,140 831,500 1231,667 601,809 1071,342 6
870 191,464 -
1,116 1,795 1,959 1,818 1,198 883 706 357 866
Lass than 63 inches .... .. .. .. .. .. .. .... .. .. .. ...63 inches ... .. .. .. .. .. . ..... .. .. .. .... ... ..... .... ... .64 inches .... .. .. .. ... . .... .. .... .. ... .. .. ...... . .. ...65 inches ... .. .. . ... .. .. .. .... .. . ... .. ... .. ..... . .. ...66 inches ... ... .. .. .... . ... .. .. .. ... . ... . .. ..... . .. ...67 inches ... ... ... .. .. .... .. ...... .. .... .. ... .... .. .. .68 inches .... .... .. .. ... .... .. .... .. .. . .. .. .. .... .. .. .69 inches .. ..... . . .. .... .. .. .. .. .. .. . ... .. .. .. .... .. ..70 inches .. .... .. . ... .. .. .. .... .. .. ... .. ... .... .. .. .. .71 inches .. ... .... . ... ..... . .. .. ... ... .... . ..... .. .. ..72 inches .. .. . ..... . ... .. .. ... ... .. .. ..... .. . ...... .. .73 inches or more ... .. .. .. .... . . ...... .. .. . ... ..
731072
12165
200191118125362380
5
175
4047631468
99
3985
1592033503103571497568
11
454311317011220
191
4
343211
135126118133374
23113
9710318413921621884
119
2716
240252350320261150233110
3163
8258
167130144186136
7816810014330230334197
287
NOT1{: I{xamined persuns were meusured without shoes: clothing weightranged from 0.20 to 0.62 )ound, which was notdeducted from weights shown.
27

Table9. Estimated number of men aged 25-34 years in the population, by weight for height: United States, 1971-”74
Weight in pounds
TotalLess
130-than
140- 150- 160- 170- 180- 190-
r
200- 210 or
130139 149 159 169 179 189 199 209 more
Height
Estimated population in thousands
Total ... .. .. .. .. .. .. .. .. .. .. .. .. .. .. .. .. .
Less than 63 inches .. .... . . .. ..... ... . .... .. .. ..
13,003 521
79
645578722182301684
740 1,328
3
3682
106276
88237174154134
1921
2,102 1.518 1,448 1,218 740 I 1,7121,676
7
2429
179192209317161169171218
-
42
273383547
1,2171,3051,4042,0441,7631,1931,1421,689
1337
‘l0084
:114169
6384411223
9024
133195234222516305163111108
3714
148228212260189139169122
28
63 inches64 inches
65 inches66 inches67 inches68 inches
69 inches70 inches71 inches72 inches
321244
1127999
158191187100202
14212873
174193124300139144252
12407131
62181
4115196
19
84956
319225162290570
.... ....... .. . .... .........73 inches or more .. . .. ... . ... .... .. .. .. .. .
—.
NOTI; : Examined persnns were measured without shoes: c]oth in< weight rtinged from 0.20 to 0.62 pound, which was notdeducted from weights shown.
Table 10. Estimated number of men aged 35-44 years in the population, by weight for height: United States! 1971-74
Weight in pounds
TotalLess
130-than
140- 150- 160- 170- 180- 190-
1
200- 210 or
130139 149 159 169 179 189 199 209 more
Height
Estimated population in thousands
10,69”1
:
469 493
85 5748 1125 8
111 4265 11139 47
8856 1832 18
29 90
694 1,082
34914793
175137262
51126
3134
962 1,139
183200298524987
1,2411,6031,536
1,3431,128
882765
27293262
152
8173
127
953
12
-1 - 14
23 55
64 44
139 23
130 145193 321233 398349 183
244 126158 75116 39
64
34 -
43 42
118 121
177 31
223 225
174 235
248 270
276 235
133 23
81 42
15
30
806243
96152284363
2:2
9’7
16489
163
10’1I O!j
18’1—.
NCITI; : Examined persons were measured lvith out shoes: clothing weight ranged from 0.20 to 0.62 nound, which was not
deducted from weights shown.
28

Table 11. Estimated number of men aged 45-54 years in the population, by weight for height: United States, 1971-74
II Weight in pounds
JTotalLess
130- 140- 150-than
160- 170- 180- 190- 2oo- 210 or
130139 149 159 169 179 189 199 209 more
Height
Estimated population in thousands
Total ... .... .. .. .... .... .. .. .. .... .. . ....
Less than 63 inches .. . .. .. .... .. .. .... . .. ..... ..
57511,151
7r
569
193 77211 14290 35765 71
1,076 271,605 911,720 1711,594 581,341 -
818 22870 5
893 1,292
I1,662 1,564
13 464 -25 27
150 76306 135321 211180 412258 303151 143
77 5775 14541 51
1.491 1.140 564 1.401-
231639
103117
587964253416
68413274
105120139124133
101038
57656
120156265236125105
833432
3
57
1072494
174307054
405043
112178207141150271209
63 inches64 inches65 inches66 inches67 inches68 inches69 inches70 inches71 inches72 inches
.............................................36
687
113158
91150238138119
11093
207143270319117106126
.............................................
.............................................
73 inches or more ... .. ..... .... .... ... .. .. ... .. .
NOTI; : Examined persons were mcwured without shtws: cluthirrg w’eight ranged from 0.20 to 0.62 pound, vhich was notdeducted from \veigl]ts shnwn.
Table 12. Estimated number of men aged 55-64 years in the population, by weight for height: United States, 1971-74
Weight in pounds
----
Total Less130- 140-
than150- 160- 170- 180- 190- 2oo- 210 or
130139 149 159 169 179 189 199 209 more
Height
Population in thousands
Total ... ..... . .. .... .. ... ... .. .. .. .. ... . . 8,999 594
I543 877
23 6444 1337 9218 13050 77
144 20752 6861 17236 2531 047 26
5
1,125
33237279
136187252129
67116
1417I
1,297 1,662
23 -30
103 1097 174
359 164143 271185 330186 285
95 17762 145
3 3140 47
1.044 513 515
3734143714
12156
145
56
829
2119
119118102150125103
71
Less than63 inches64 inches65 inches66 inches67 inches68 inches69 inches70 inches71 inches72 inches
63 inches .. . .. .... .. ... .... .. .. ..... ..... . .. ... . .. .. ...... . .. . .. ... . ...... .. .. ... ..
188192485757
1,0891,4391,3131,241
841833325294
38828087
107102
647
24
7
5168
132
99198134141127
87
34931
13032447082145873 inches or more .. .... .. .. .. ... . . .... ... .. .... .
NOT1i: l{xuminw.1 persons \verc metisurcd \vitl] nut SII(K.S: c.]otl]in$ \\ei.@]t ranged from 0.20 10 0.62 pound, which was notdeducted t’rOm weights shnwn.
29

Table 13. Estimated number of men aged 65-74 years in the population, by weight for height: United States, 1971-74
Height 1Weight in pounds
Tots ILessthan
130- 140- 150- 160- 170- 180- 190- 200 or
1301139 149 159 169 179 189 199 more
Population in thousands
Total ... .. ...... .. .. .... .. . ... . .... .. .. .... ..... . ... . 775 529 I 340 5035,497 II 559 423 616 933 819
47 51 1143 63 672 104 55
104 131 13978 171 115
84 138 13149 113 156
89 62 11225 61 5215 9 1012 29 30
242 76224 49497 107725 88745 91827 53812 60558 13458 9181 1225 12
2 212 117 1246 2673 3087 6082 5277 3474 4944 3714 37
283185854350581816
25
23174397
108165141
71
809
21
2229
3659
101
82925465
NOT I{: I{xomined persnns were mew,ured without shoes: clothing weight mnged from 0.20 to 0.62 Dound. which was notdeducted from weights shown.
. .
Table 14. Estimated number of women aged 18-74 years in the population, by weight for height: United Statas, 1971-74
Weight in pounds
Height TotalLess
than90. 100. 110. 120. 130. 140. 150. 160- 170- 180. 190. 200. 270- 220 or
90 ‘9109 119 129 139 149 159 169 179 189 199 209 219 more
I Population in thousands
Total . . . I 67,927,, 554, l,5a6, 4,516 8,721 I 10,733 I 11,364 I 8,083 I 6,022 I 4,994 [ 3,404 I 2,3o1 I 1,856
Less than 57 Inches HI Q! 60\ 24 7 118 161-157 inches 536 70
58 inches .. 1,105 10059 inches . . . . . 2,503 5760 !nches .. . . . . 4,583 3861 inches . .. .. 7,493 10162 inches . .. .. .. ... . .. .. .. .. . 10,163 4563 inches .. .. . .. . ... . ... .. .. ... ... 10,316 3664 Inches .... .. . .. ... .. .. .. .. .. . .. .. 10,148 4165 inches . . 9,07966 (riches 5,328 2267 inches 3,13468 Inches 1,81869 Inches or more 1,315 1
54 6575 224
132 340269 380
300 8a2301 890
160 743
103 48599 34a31 95
19
4 18
22 3963 11
180 324371 262666 493
622 627
915 689
830 779955 663
19 6569 37
930
148182
230
259325
1813
918
334
927 579 613 4501,092 1,123 1,029 8021,634 2,058 1,493 1,1481,427 1,451 1,861 1,2591,219 1,712 1,903 1,174
966 1,452 1.796 1,072
223 156
344 279
460 272
563 263
571 462407 306
317275
170
167202171
44
3226
11421
86191
110163
89614322
—
22107
222309
267327191137133
90—
I 323
%WK
30

Table 15. Estimated number of women aged 18-24 years in the population, by weight for height: United States, 1971-74
Height
Weight in pounds
Less11o-
than120- 130- 140- 150- 160- 170- 180- 190-
110119 129 139 149 159 169 179 189 199
Total200 ormore
300
1237384180333228
Population in thousands
Total ..... .. ... ... ..... .. . ...... . 12,925 II 1,991 2,56C 2,392
351681
166349336375477340
95121
2,428
I1,282 672
2 1314 -44 1562 9
127 61245 82147 115195 145112 78170 57163 98
589
2010223975
1014295
10085
348
6
213
19267975681933
177
17185618173212
8
186
2132
41252529
48
Less than 59 inches ... . ... .... . .. ..59 inches .. ... ... . . ..... .. . .... .. .. . .. ...60 inches .. ... .. . . ... ... .. . . .... .. . .. ....61 inches ... . .... ..... . ... .. . ... . .. . ... ..62 inches .. .. . .. .... .... .... .. ... ..... .. .63 inches ... .. .. .. .... .. .. .. ... .. .... .. . .64 inches .. . .. ... .. .. . .... .. ... ... .... .. .65 inches ... .. ....... . .. .. ... .. . .. ..... ..66 inches ... .. ... ..... .. .. ... .. ... . ... .. .67 inches .. . .. ... .... ... . .... .. .. .. .... ..68 inches or more .... . ...... .. . ....
265248560
1,0371,6911,9641,9822,1511,257
886883
128100178275
4769
143292416
347383399263129
72
342947
147159394432492196249249
466
324266204
111918
NOTI; : kkamincd persuns were measured without shoes: clothing weight ranged from 0.20 to 0.62 pound, which vvos notdeducted from weights shown.
Table 16. Estimated number of women aged 25-34 years in the population, by weight for height: United States, 1971-74
Height
Weight in pounds
TotalLessthan
11o- 120- 130- 140- 150- 160- 170. 180- 190- 200 or
110119 129 139 149 159 169 179 189 199 more
Population in thousands
Total .. ..... .. .. .. ... ... ... . ... . .
T13,934 1,649
105 47158 71296 71528 144
1,444 3682,081 2852,256 2951,943 1832,047 1091,381 78
843 -
2,147 2,669 2,298 1,450 970 634
54
144
89905390
1464071
657
43138
107112
585644
100108
439
1222
6937498376234030I
238 783
4 610
12 46
56 5421 13071 10526 16423 11525 71
82
Less than 58 inches ..... .. . ... .. .. .58 inches .. .. .. .. .. .. .. .. .. .. .... . . .. ....59 inchas ... . .. .. ... ..... .. .. ..... ... ....60 inches .. .. .. .. .. ... . .. .. .. .. .... ... . ..61 inches .... . ..... .... .. .. .. .. .. .. ... ...62 inches .... .. .. .... .. . ....... .. . ... .. ..63 inches .. ... . ... ..... . .. .. .... .. . ... ...64 inches .. .. .. .. .. ..... . . .... . ... ...... .65 inches ... .. ... ... ... .. .. .. .... ... .. . ..66 inches .. . .. .... ... .. .. .. .. .... .. .. .. ..67 inches ... . .. .. . ..... .. ... . ...... . .. ...68 inches or more ... ... ... .. ... .. ..
353045
125285422405309291145
4014
1111
10379
263451386422416296137
95
56
3079
190287380301472213168168
225151250
178274244172159149168
116
2579
115114114175‘f39
73118
NOT1{: llxaminecf persons were meosured without shoes: clothing weight ranged from 0.20 to 0.62 pound, which was notdeducted from weights shown.
31

Table 17. Estimated number of women aged 35z14 years in the population, by weight for height: United States, 197’1-74
Height
Weight in pounds
Total
Population in thousands
Total .. .. . . .. . 11,57711 714{ 1,314
I1 13(56 2,01 I
——2 66 13
71 88161 57
145 132342 249334 345259 452:287 333‘158 167‘144 97
57 71
—
1,390 1,109 750
4 - 11’6 5 3~
46 50 276 59 15
121 96 33245 67 70155 103 141146 174 111203 232 124152 90 89112 90 29124 142 122
I
576 428 349 970
Less than 58 inches . .58 inches . . . . . . ..59 inches . . . .. .. .. .. .... ... ... ...... .60 inches .. . .... ..... . . . . .61 inches .. . .... .. .. . .. ... .. .. ... .62 inches . . . ... .... . .... . .. ..... . .63 inches . . . . .64 inches .. .. .. .... .. .... .. .. .. . . ... .65 inches .. . . .... . ....66 inches ... .. . .. ..67 inches . . ..68 inches or more . . .. . .
4
421248069
105144
552744
249
107
496494
109201050
236
6408765512333
4
93015
3576
108150194129
73152
105428690964
1,5551,6551,8891,830
977637776
348678
179107107
603813
2540
162186230142273115
812210
IIN(ITI1: Ilxamined persons were measured without shoes; clothing weight runged from 0.20 to 0.62 pound, which was not
deducted from weights shoivrr,
Table 18. Estimated number of women aged 45-54 years in the population, by weight for height: United States, 1971-74
Weight in pounds
TotalLess
11o- 120- 130-than
140- 150- 160- 170- 180- 190- 200 or
110119 129 139 149 159 169 179 189 199 more
Height
Population in thousands
I12,161 724
67 1359 30
493 156
1,004 361,257 2011,969 1661,842 912,118 91,449 la1,031 4
489 -383 -
Total . . . ...
Less than 58 inches . . ..58 inches .. ..... . ... .... ... . .... .... . . .59 inches . .... ... . . .. .. ... . .. ... . .. .. .
60 inches . . .61 inches . . . . ..62 inches .. . .. . . .. .. . .. .. .. . . . .. .. .63 inches . .. ... ... .. .. .... .. . .. .. ... ..64 inches ... . ..... . .. . .. .. .. . . .. .. ..65 inches . .. .66 inches ... . .. .. ... .... .. .. . . ... ..67 inches . . . . .. . ..68 inches or more ... .... .. . .... .. .
1,239 1,:707 1,816 1,601 1,349 1,285————
33
40265111319276110
9319
135
25‘i041135
444:?14402156108
7527
28
183176283247352
315146
3254
3
3651
244242221379157
127119
21
7
119
3262
149242242
238137
4116
8673
135146214105173
2956063 1
1827 -
62 5466 5066 34
125 28177 127
26 2835 6540 4229 41 1
34
31 11341 3645 7521 16393 122
116 129
39 5644 3661 71
NC)T1;: l;xomined persons were meusured without shoes: clothing weight ranged from 0.20 to 0.62 pound, which WJS not
deducted from weights shc)wn.
32

Table 19. Estimated number of women aged 55-64 years in the population, by weight for height: United States, 1971-74
Height
Total .. . ... ... .. .. .. . .. .. .. .. .. . .
Less than 58 inches .. . ... . ... . .. ...58 inches .... .. . .. . .... .... .... .. . ... ... .59 inches ..... ... ..... .. . ... .. .. .. ... . ...60 inches .. .. .. .. .. ...... .. .. .. .. .. .. ....61 inches .. .. ... .. . .... .... .. .. .. .. . .. .. .62 inches .... .... .. . ... .... . .. .... .. .. ...63 inches .. . . ... . .. . ... . .... .. ... .... . .. .64 inches .. .. .. .... ... . ...... .. .. . . ..... .65 inches .. . .. .. .... . .. . ...... .. .. .... . . .66 inches .... .. .. .. .. .. .. . ... .. .. .... .. ..67 inches .. .... .. . ..... .. .. .... ... . ..... .68 inches or more .. . .. ... .. . .. . ... .
Weight in pounds
TotalLess 11o-
than120- 130- 140- 150- 160- 170- 180- 190- 200 or
110119 129 139 149 159 169 179 189 199 more
10,054 958 770
300 111 15323 141 52558 24 61896 123 70
1,611 167 1111,565 116 1171,570 96 1811,439 76 1071,031 59 52
428 41 5189 - -142 4 -
1,086
27677951
186300
49211
3458
618
Population in thousands
I1,720 1,221
105 2111 4
109 87129 160220 156307 184291 197242 108105 261
83 15101 28
18 -
1,137
10
2113121910623721214343
J15
1,045
148112242129
76141100
601025
643
85
42122
88151101
55231830
462
1122
52117
7442864115 !
372 640
1814 1026 -40 3170 7458 19250 10583 98
856 20
25 7
NOTI; : Examined persons were measured ~vithout shoes: clothing weight ronged from 0.20 to 0.62 pound, which WIS notdeducted from wights shuwn.
Table 20. Estimated number of women aged 65-74 years in the population, by weight for height: United States, 1971-74
I II Weight in pmrnds
Height TotalLess
11o-than
120- 130- 140- 150- 160- 170- 180- 190- 200 or
110119 129 139 149 159 169 179 189 199 more
I Population in thousands
Total ... .. .. .... . .. ... .. .... .. ... 7,276 618 691 913 1,092 1,140 785 691 527 307 222 290
Less than 58 inches ... .. . ... .... ... 292 59 51 33 56 43 1644 35 43 30 ;;
1258 inches
4 1 -... .. .. ... ... . ... .. .. . ... .... .. . 297 71 21
59 inches .. ..... ... .... ... .. . ... .. ..... . . 482 92 62 74 56 77 17 3; 2; 16 1; 1:
60 inches ... .. .. .. .... .. ... . .. .. .. .... .. . 917 128 162 102 11861 inches
108 69 92 46 18 34 30.. . ..... ... ... ... .. .. . .... .. .... 1,173 92 107 227 164 168 127 90 90 19 50 39
62 inches .. ... .. .. .. .... .. .. .... .. ... . ... 1,305 96 130 172 208 17263 inches
- 129 151 1011,030
60 18 68.. . .... .... .. . ... .. . ..... .. ... .. 27 76 133 204 166 165
64 inches64 81 45 30 39
.. .... ... .. ... ..... .... .... .. .. . 768 25 37 42 124 150 110 130 5265 inches ... . .. .... ..... .. . .. . .. .. ... . .. .
21 22572 19 17 82 79 84 87 68 51 ;; 23 27
66 inchas m’ more ... ... . .... .... . ... 440 - 5 12 39 145 29 43 58 35 24 5Q
NOTI{: lixamineci persons were measured without SIIOCS: clothitrg weight r:lngcd frnm 0.20 to 0.62 pound. !vliich WJS notdeducted from weights sl]uw, rr.
33

Table 21. Comparison of average weights for men and women in t+ES (1960-62) and HANES (1971-74), by age and height: United States
Sex and height
62 inches63 inches64 inches65 inches66 inches67 inches68 inches69 inches70 inches71 inches72 inches73 inches74 inches
57 inches
58 inches59 inches60 inches61 inches62 inches63 inches64 iriches65 inches66 inches67 inches68 inches
62 inches63 inches64 inches65 inches66 inches67 inches68 inches
69 inches70 inches71 inches72 inches73 inches
74 inches
57 inches . .. . ....... . .. .
IHES, HAN ES,
?960- 1971-62 74
18-24 years
135138142145149
152156159163166170173177
114116118120123125127129132134136
138
146150154158162166171175179183187191195
127130134138
141145148152156159163166
130135140145150154159164168173178183188
114117120123126129‘i32135738141144147
45-54 years
147152156160164169173177182187191196200
129133136140143147150154158161165168
Excessof
HANESoverHES
—.
-E
-3-2
+1+2
+3+5+5
+7
i-e+1 c
+1 1
+1
+2+3+3+’4
+5+6+6
+7+8+9
+1+2
+2+2+2!
+-3+2+2+3+4+4+5+5
+2+3+-2+2+2+2
+2+2+2+2+2+’2
—
H ES,1960-
62
139143148152157161166170175179184188192
110114118122126130134138142146150154
146149153156
160164167171174178182185189
136139142145148150153156159162165
168
ExcessHAN ES, of
1971- HANES74 over
HEsI
25-34 years
141145150156160165170174179184189194199
118121125128132136139142146150153157
55-64 years
143147153158163
168173178183189193197203
132136140143147
150153157
160164167177
+2+2+2+4
+3+4+4+4
+4+5+5+6+7
+8-+7
+7+6+6+6+5+4+4+4
+3+3
-3-2
+2+3+4+6+7
+9+11+1 1+12+14
-4-3-2-2
-1
+1
+1+2+2+3
H ES, HAN ES,
1960- 1971-62 74
I
Excessof
HANESoverHES
147150154158162166169173177180184188192
129132134136738141143145147150152
154
35-44 years
142146149152
156159163
166169173176180183
130133136140143147150154157161164768
143148153158163
169174179184190194200205
125129133137141144
148152156159163167
65-74 vears
143147151156160164169173177182186190194
130134137140144147151154158161165
169
-4-2-1
+1+3
+5+6+7
+1 o+1 o
+12+13
-4-3-1
+1+3+3
+5+7
+9+9
+1 1
+13
+1
+1+2+4+4+5
+6+7
+8+9
+1 o+1 o+1 1
+1+1
+1
+1
+1
+1+1
NOTE: I lei~ht was n]emured witljuut shoes. Two pounds were deducted l’rorn HliS data to allow for weight of clothing; totolweights of till clothing for HANI:S ranged from 0.20 to 0.62 pound, which WJS not deduct ccl from weights shown.
34
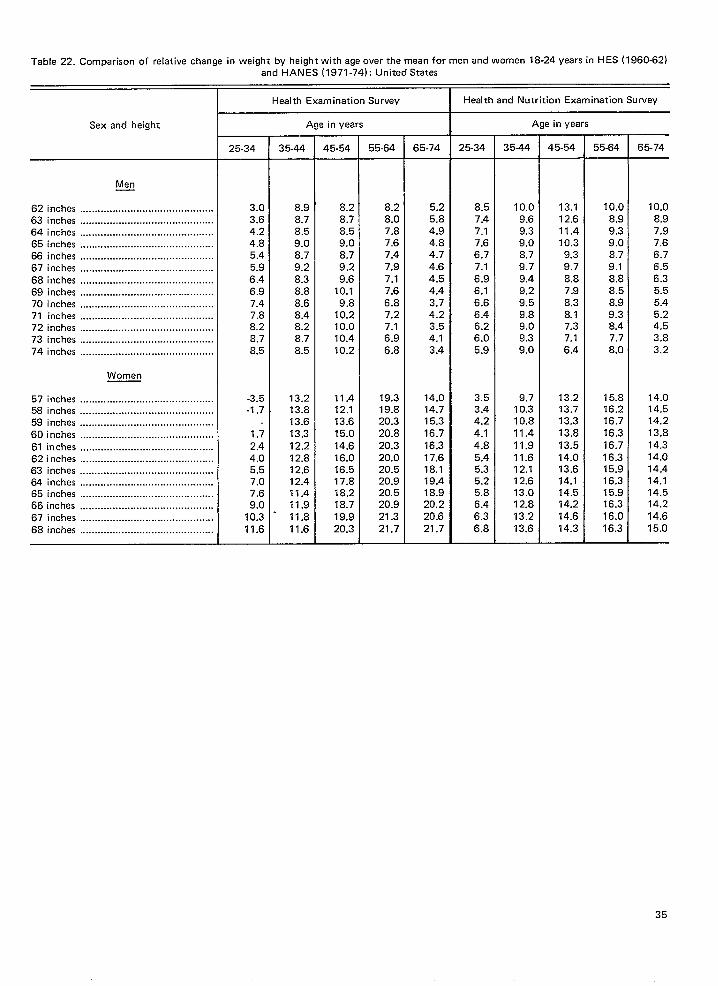
Table 22. Comparison of relative change in weight by height with age Over the mean for men and women 18-24 Years in HES (19~~-~~)---- ,
Health and Nutrition Examination Survey
and HANES (1971-74): United States
Health Examination Survey
Age in years Age in yearsSex and height
65-74 25-34 35-44 45-54 55-64 65-7425-34 35-44 45-54 55-64
Men—
62 inches63 inches64 inches65 inches66 inches67 inches
68 inches69 inches70 inches71 inches72 inches73 inches74 inches
57 inches58 inches59 inches60 inches
61 inches62 i riches63 inches64 inches65 inches66 inches67 inches68 inches
3.03.64.24.85.45.9
6.46.97.47.88.28.78.5
-3.5-1.7
1.72.44.05.57.07.69.0
10.311.6
8.98.78.59.08.79.28.38.88.68.48.28.78.5
13.213.813.613.3
12.212.812.612.411.411.9
11.811.6
8.28.78.59.08.79.29.6
10.19.8
10.210.010.410.2
11.412.113.615.0
14.616.016.517.818.218.719.920.3
8.28.07.87.67.47.97.17.66.87.27.16.96.8
19.319.820.320.820.320.020.520.920.520.9
21,321.7
5.25.84.94.84.74.64.54.43.74.23.54.13.4
14.014.715.316.7
16.317.618.119.418.920.220.6
21.7
8.57.47.17.66.77.16.96.16.66.46.26.05.9
3.53.44.24.14.8
5.45.35.25.86.46.3
6.8
10.09.69.39.08.79.79.49.29.59.89.09.39.0
9.710.310.811.411.911.612.112.613.012.813.2
13.6
13.112.611.410.3
9.39.78.87.98.38.17.37.16.4
13.213.713.3
13.813.514.013.614.114.514.214.614.3
10.08.99.39.08.79.18.88.58.99.38.47.78.0
15.816.216.716.3
16.716.315.916.315.916.316.016.3
10.08.97.97.66.76.56.35.55.45.24.53.83.2
14.014.514.213.814.314.014.414.114.514.214.615.0
Women
.............................................
35

Table 23, Differences at the 95th percentile of the weight distribution of men and women in HES (1960-62) and HANES
(1971 -74}, by age and height: United States
IIExcess
HES, HAN ES, of1960- 1971- HANES
62 74 overH ES
HES,1960-
62
HAN ES,1971-
74
Excessof
HANES
overHES
Sex and height
18-24 year! 25-34 years 35-44 yearsMen—
62 inches .... . ... .... .. .. ... ... .. . .... .. ..63 inches ... ..... ... .. .. ...... .. .. ..... ... . .
173176180
183187190194197201
204208215215
153155157159162764166168171173175177
175180
185190195199204209213
218223228233
160
163166169172175178181184187190193
191195
200
206210215220224229
234239244249
171
174178181185189192195198203206210
187190197198202206209213217
220224228232
179
182184186188191193195197200202204
188193
198203208214219224229235239245250
183
187191195199202206210214217221
+2+4
+5+7
+8+9
+1 o+12
+12
+14+1 5
+13+18
+7
+8
+9+1 o+1 o+1 1
+12+13+13+14
+15+16
+7+8
+8
+6+8+9+8+8+9
+’I o+’1o+’13+“11
+9+1 o
+9+9
‘+9+9
+9+9.+9+9+9+9
183187
194196201205210214219
223228232236
159163167171175179183187191195199203
H+E
+6+1c
+g+1c+1c+1a+1o+11+1 1+12+13
+1 2
+1 1+1 1+1 o+10+1 o
+9
+8+8+8
+7+7
-1
+2+4+5+6+8+9
+1 1
+12+13+14
+16
+2+3+4+4+5+6+6+7+7+8+8+9
+1+3+1+5+6+8
+1 o+1 1+12+15+1 5+1 7
+18
+4+5+7
+9+1 ‘1
+1 1+1 3+15
+17+1 7
+19+21
+1+1+2+4
+4+5+6+7+8+9
+1()+1()+1 1
+5+6+6+5
+6+5+6+5+6+5+6+6
64 inches
65 inches66 inches67 inches68 inches69 inches70 inches
71 inches72 inches73 inches74 inches
57 inches
58 inches59 inches60 inches61 inches62 inchas63 inches64 inches65 inches66 inches67 inches68 inches
62 inches63 inches64 inches65 inches66 inches67 inches68 inches69 inches70 inches71 inches72 inches
73 inches74 inches
57 inches58 inches59 inches60 inches61 inches62 inches
63 inches64 inches65 inches66 inches67 inches68 inches
...... .... ... . ... .........
............. . . . ............
........... . .. . .. ..... ....
. ....... ........ ......,,.,
........... ... ......
. ......... . . .. ........
Women
... ....... .. .. ...........,.,
......... .................... ..
........ .. ......... ......... ...
. ...... .... .... .... ....... .
........... ................. . ...
........ .. . .. . .... . ...
....................................
........ .. . . .... ......
...... . ....... .. ........ . ..
........... ... ...........
......... ...... . ..............
...... . ...... .... .... ..... 225
45-54 years 55-64 years 65-74 yearsMen—
187191195201203207212216220224228230236
176179183
187190194197201205209212215
194199203207211216220224229234238
243247
185189192196199203206210214
217221224
191184198
201205209212216219224227230234
185188191194197199202205208211214217
190194200205210215220224230236240244250
187191195
198202205208212215219222226
185189192195199202206209212216219223226
173176179183186190193197200204207211
186190194199203207212216220225229233237
178182185
188192195199202206
209213217
............. .......... . .......... .. ....... . .................... . ........ .. ....... ....
Women
............ . .. ...... ....... .... ...... ......... ......,................. ...... ............ . ...... .......... . ................. . .. . ......
—— —
NOT1; : Height was measured without shoes. Two pounds were deducted from H ES data to allow for weight of clothing: totalweights of all clothing fur HANKS ranged from 0.20 to 0.62 pound, which was not deducted from weights shown.
36

Table 24. Differences at the 90th percentile of the weight distribution of men and women in HES (1960-62) and HANES
(1971-74), by age and height: United States
Sex and height
Men—
62 inches ... .. .. . ... .. ... . .. ..... . .... .. . ...63 inches .. .... .. .... ... . ... ..... .. . .. ... .. .64 inches . .. .. .. .. .. .... .. .. .. .... .. .. .... ..65 inches .. ... .... .. ... ..... .. . ... .. . . .... ..66 inches . .. .. ... ... .. ...... . .. .. .. ... .. .. ..67 inches ... .. .... ..... .. ... .. .. . ... .. .. .. ...68 inches .. . .. .. ... .... . .... .. .. .. .. ... . ... ..69 inches ... . ... .... .... .. .. .. .. .. .... .. .. ...70 inches .... . ... ..... .. . .... ..... .... .. .. .. .71 inches ..... .. ...... ... . ..... ... . .. ... .. ...72 inches .. ... .. .. .. .. ... ... .. .. ... ..... ... ..73 inches ... ... . .. ..... .. .... ... .. . .. ... .. .. .74 inches .. .... .... . ...... .. ...... . . ...... ..
Women
57 inches ... .. ..... .. . ... .... . .. .... ... . .... .58 inches .. .. . ...... . .. ...... . ... ..... ... ....59 inches .. . .. . .. .... .. .. ... .... . .... ... .. ...60 inches .. ... .. ... . . .. .... ... . ... ..... .. . . ..61 inches .... .. .. .. .. .. .... .. . . ... . .... .. ... .62 inches .. .. ... ... .... .. .. ..... . .... .. .. .. ..63 inches .. .. .. . .. ..... .. .. .... .. .... .. .. .. ..64 inches .. .. .. .. .. .. .... .. . ..... .. .. .. .. .. ..65 inches .. .. .. .. .... .. .... . ... ... . .... ......66 inches .. .. .. .. .. .. .. ..... .. .... .... .. ... ..67 inches .. ... ... .. . . .. ..... ... .... .... . ... ..68 inches .. .. ...... .. ... ..... . ... .... .. ... .. .
Men—
62 inches . ... .... . .. .. .... .. .... .. .... .. .. ...63 inches ... .. .. .. .. .. .. .. .. .. .. .. .. .... .. .. .64 inches ... .. .. .. .. .. .. .. .... .. .. .. .. .. .. ...65 inches ... .. .... .. .. .. .. .. .. .. .. .. .... .. .. .66 inches ... .... ..! . .. .... .. .. .. .. .. .. .. .. .. .67 inches ... .... .. .. .. ...... .. ... .. .. .. . .. .. .68 inches ... ... .. ... .... .... .... .. .. .. .. .. ...69 inches .. ..... .. .. .. .... . . .. ... ... .. .. .. .. .70 inches .. . .. .... . ... ..... ... .... .. .. . ... .. .71 inches . .. . . .. .... .. .. .... .. .. .. ... .. ... .. .72 inches . .. .. .. ... ... . ... . ..... .. .... ... . ...73 inches .... .... ... .. .. .. .... .. .. .. .. .. .. . ..74 inches ... .. .. .. ...... .. . ... .... .. .... .. .. .
Women
57 inches .. . ... .... .. ... . .. .. . ... . . .. .. .... ..58 inches .. .. .. .... .. .. .. .. .. .. .... ... . .. .. ..59 inches .. .. ...... .. . . .... ... ... .... .. .. .. ..60 inches .. .. .. ... ... .. .. .. .. ... ... .. .. .. .. ..61 inches .. . . .. .. ...... .. .. .. .. ... ... .. .. .. ..62 inches .... .. .. .. .... .. .. .. .. .. .. .... .. ... .63 inches .. .. .. .. .. .. ... . .. .. .. .. .. . .. ... .. ..64 inches .. .... .. .. .. ... . .. .... .. .. .... . .. . ..65 inches .. .. ...... .. . ... .. ... . .... .. . .... .. .66 inches .. .. ..... . .. .. .. .. .. .. .. .. .. .. .... ..67 inches .. .. ..... .. . .... .... .... ... ... .. . ..68 inches .. .. .. .. .. .... . ... .... . ... ... .... .. .
ZF!iEE18-24 years
165168172175179182186188193196200207207
145147149151154156158160163165167169
45-54 years
178182186190194198203207211215219221227
165168172176179
183186190194197201204
16517a175180185189194199203208213218223
150153156159162165168171174177180183
18318~192196200205209213218223227232236
172176179183186190193197
201204208211
+;+:+++(+7+[
+11
+1c+1;+1:+11+1c
+5
+C+7+E+Ei+
+1c+11+1 1+12+13
+14
+5+6
+6+6+6+7
+6+6+7+8+8
+1 1+9
+7
+8+7
+7+7+7
+7+-7+7+7+7+7
ILExcess
HES, HANES, of
1960- 1971- HANES
62 74 overH ES
25-34 years
173177184186191195200204209213218222226
148152156160164168172176180184188192
181184188191195199202206209214217221224
174177180183186188191194197200203206
18C184182
195I 92
204Zo$j
213218223228233238
159162166169173177180183187191194198
55-64 years
18C18419C19520C20E
21021 ~
220226230234240
175179183186190
193196200203207210214
+7
+7+5+9+8+9
+9+9
+8+1 o+1 o+1 1
+12
+-11+1 o+1 o
+9
+8+9+8+7+7+7+6
+6
-1
+2+4
+5+6+8+9
+11+12+13+12
+16
+1
+2+3
+3+’4+5+5
+6+6+7+7+8
IIExcess
HES, HAN ES, of1960- 1971- HANES
62 74 overH ES
35-44 years
179182186190194198201205209212216220224
168171173175177180182184186189191193
176180183186190193197200203207210214217
163166169173176180183187190194197201
178183188193198204209214219225229235240
170174178182186189193197201204208212
65-74 years
176180
184189193197202206210215219223227
167171174179181184188199195198202206
-1+1+2+3+4
+6+8+9
+1 o+13
+13+15+16
+2+3
+5+7+9
+9+11
+13+1 5+1 5
+1 7+19
+1+3
+3+4
+5+6+7+8+9
+9+1 o
+4
+-5+5
+6+5+’4
+5+4
+5+4+5+5
NO’I’ l;: Height was measured without shoes. Two pounds were deducted from 111{S &ta to allo\v for weight of clothing: totalwei~hts of all clothing for IHAN1;S wnged from 0.20 to 0.62 pound, which was not deducted from weights shown.
37

Table 25. Differences at the 80th percentile of the weight distribution of men and women in HES (1960-62) and HANES
{1971-74), by age and height: United States
xr!izEs -El!!E35-44 years
Excess
ofHANES
overHES
HES,1960-
62
HAN ES,1971-
74Sex and height
18-24 years 25.34 yearsMen—
62 inches .. .. .... .. ...... .. . .... ... ... ......63 inches ...... .... . .. .. .. .. .. .... . . .. .. ..64 inches ..... ... . .... .. ..... . .. .. . .... ..65 inches .. ... ... .. .. ... . .. .. .... .. .. .. .... ..66 inches .. . . ... . ... . .. .. .. ...... .. .. .. .... . .67 inches . .. .. ... .. .. .... . ... ... . . .. .. ..68 inches .. .. .. .. .. .. .. .. .. .... .. .. .. .. .. ....69 inches .. .. .. .. ...... .. .. .. ... . .. .. .. .. .. . .70 inches .. .. . . .. ....... . .. .... .. . .. ..... .. ..71 inches .. .. .. . ..... .. .. .... .. .. .... ... . .. ..72 inches .. .. ... ..... ... ..... ... . . ... .. .. ... .73 inches .. .. .... .. .. . .. .. .. .. . .... .. .. ..74 inches .. .. . ...... .. .. ..... . . ..... .. .. .
Women
57 inches ... ... ..... .. .. ... ... . .. . ... .. . .58 inches ... .. .... .. .... ... . ... . . .. .. . . .. .. .59 inches ... ...... ... . .. .. .. . . .. ... ... .. .....60 inches . ..... .. .. . . ... ... .. .. ... ... . . .61 inches ... .. .. .. . . .... .. .. .. .... .. .. .. .. ...62 inches ... .... .. .. .... .... . ... .. .. .. .. .. .. .63 inches . .... .. .. .. .. .. .. . .. .. .. .. . .. .64 inches . .... .. .. . . .. ... .. ... .. .. . . ... .65 inches ..... .. .. .. .. .... .. .. .. ... . .. ..... ..66 inches ... .. .. ... .. ..... .. .. . .. ... . .. .....67 inches ... .. .. .. .. .. .. .. .. ..... ... .. .. .. .. .68 inches .... . .. .. .... .. ... . .. .. .. .. .. .... .. .
Men—62 inches .. .. .. . .. .. . . . .. . .. . .. .. ..... .. .63 inches .. .. .. .... .. ... .. ... .. . .. ... ... .64 inches .. .. .... .... . .. . . .. .. ... . . .. .. ...65 inches .... .. .. ... .. . .. .. ... ... . ... .... ... .66 inches .. . . ... ... .. .. .. .. .. .. .. .. .. .. .. . ...67 inches .. .. ... ... .. . . .. ... .. .. .... ... .. ... .68 inches .. .. . ...... ... .. .. .. .. .. ... .... . .. ..69 inches ... ... .... .. .. ...... .. ... ..... ... ...70 inches .. ... .... ... .. .... .. .. ... ..... ... .. .71 inches .. .. ..... .. . . .. .... .. .. .. .. .. ...72 inches .. .. ..... ... . .. . ... . .. ... ... .. ... .73 inches .. .. .. .. .. .. . ....... .. .. .. .. .. .... ..74 inches ... .... . .. .. .... .... .. .. .... .. . ..
Women
57 inches .. .... ... .. .. .... .. . .. .. .. .. .. ... ...58 inches .... ... . . . .... ... . .. .. .. .. . . . . ...59 inches ... . .. . ... ...... .. . ..... ... . . ....60 inches ... .. .. .. .. .. .. .. . . . .. .. .. ...... .61 inches .. . .. .. .. .. ... . ... ..... . ...... ..62 inches ... .. .. ... ... . ... . . ... . . .. ... .63 inches ..... .. .... .. .. .. .. .. .. .. .. .. .. .. ...64 inches .. .. . .. ...... . ... ... ..... .. ..... .. ..65 inches .... . .. . .. . ... ........ .. .. .. . .. ..66 inches ... .. . ...... . .. .. . ... .. .. .. ... .67 inches ... .. .. . .... ... ...... ... .... .. .. ....68 inches . .. . ... .... ... .... ... .. .. . ... .. ....
155158162165169172176179183186190197197
153158163168173177182187191196201206211
138141144147150153
156159162165168171
-2
+1+3+’4
+5+6+8
+8+1 o+11
+9+14
+4
+5+6+7+7+8
+9+10+10
+1 1+12+13
+4+5+5
-!-6+-5+6+5+5
+6+7
+7+10
+8
+5
+6+5+3+5
+-5+5
+5+5
+5+5+5
+6+6+4
+8+7+8+8
+8+8+9
+9+8
+1 1
+7 o
+8+9+8+8
+9+7
+6+6
+6+5+5
-2-1+1
+3+4+5
+7+8
+1 o
+1 1+12+13+15
-1+1+1+1+2+3+3+4+4+5+5
+6
168171175179183187190194198201
161165172174179183188192197201206210214
135139143747157155
159163167171175179
167171176182186191196200205210215218225
145148152155159163166169173177180184
166171176181186192197202207213
-2
+1+2+3+5+7+8
+9+1 2+12+14+15
-7
+2+4-!-6
+6+8
+1 o
+12+12+14+16
205 217223209
213
155158160162164167169171173176178180
228
134
136138140143145147149152154156158
45-54 years
167171175178183
187192196200204208210216
154158162166170173177181185188192196
55-64 years 65-74 years
171176180184188193197201206211215220224
157161164168171175
178182186189193196
167171177182187
192197202207213217221227
160164168171175178181185188192195199
169172176179183187190194197202205208212
161163167170173175178181184187190193
164168171174178181185188191195198202205
152155158162165169
172176179183186190
165169173178182186191195199
204208212216
154158161164168171175178182185189193
+1+1+2+4+4+5
+6+7+8+9
+1 o+1 o+11
+2
+3+3
+2+3+2+3+2
+3+2+3
+3
152155159165166170
173177181184188191
NOT1l: Hci~ht was metisurcd without shoes. ‘t’wo rmunds were deducted from H1lS dtta to allow for weicht of clothinc: total
——
.weights of uII clothing for t{ ANi; S ranged from 0.20 to 0.62 pound. which was not deducted from weights shown.
38

Table 26. Differences at the 20th percentile of the weight distribution of men and women in HES (1960-62) and HANES
Sex and height
Men
62 inches —... .. .. .. .. .. .. .... .. .. .. .... . ... ..63 inches ..... . .. . .... . ... .. .... . .. . ...... ..64 inches ..... .. .. .... .. .. . . ..... .. . .. ... . ..65 inches ... .. . .... ... .. .. .. ..... ... .. .. .. . .66 inches ... .. ... . .. .. .. .... .. .. .. .. .... .. ..67 inches ... .. .. .. .. .. .. .... .. .. .. .. .. .. .. ..68 inches .. .... ..... .... . .... . .. . ... ... . .. . .69 inches ... .. .. .. .. .. ... . ... ... ... .... . . ...70 inches ... .. .. .... .. ... ... .. .. .. .. ... ... ..71 inches .. ... ... . .. ... . .. .. .. .. ... ... ... ...72 inches ... .. ...... .. .. ..... . .... .... .. . ...73 inches .. . .. .. .. .. .. .. .... .. .... .... .. .. ..74 inches ... .... .. .. .. ...... .. .... .. .. .. .. ..
Women
57 inches .. .... ..... . .. .. .. .. .. .... ... ..... .58 inches .. .. ... ... .... .... . .... ... . . ... ....59 inches .. .. .. . ... .... .. .. .. .. .... .. ..... . .60 inches .. ..... ... . .... . .. . ..... .. .. .. ... . .61 inches .. . .. ... .... .. ... ... .. ... . .. .... .. .62 inches .. .. . ... ..... .. . .. ...... .. .. .. ... . .63 inches ... .... . ..... ... ... . ... .. .... ... . ..64 inches .. .. . . .. ...... .. .. .. .. .... .. .. .. .. .65 inches ... . .. .. .. .. .. .. .. ... ... . ... .. .. .. .66 inches .. .. .. .. .. ... . .. .. .... .. . ..... .. .. .67 inches .. .. . ... . .... . .. .. ... .. ... .... .. .. .68 inches .... .... ... ... ... . .. . . ... .... .. ....
Men
62 inches .... ... .. ... .. ... . ... ... .. . .. .. . .. . .63 inches ... .. .. .. .. .. .... .. .. .. . ... .. .. . .. .64 inches ... .. .. .... .... .. .... ... ..... . .. .. .65 Inches .. . .. .... .... . . .. .. .. .. ..... . .... ...66 inches ... ...... .. .. . ... .... .. .... .. .. ....67 inches .... . ... ..... . . .. .. .. ... . .... . ... ..68 inches ... ... .. ... .... .. .. ..... . .. .. . ... ...69 inches ... .. .. ...... .... .. . .. ..... .. .... . .70 inches .. . . .... .... ... ... .. .. ..... . .. ......71 inches ... .. .. .. .. .. .. .. ... .... . .... .. ... ..72 inches .. ... .. .. ... .. .... .... .. .. ... .... . ..73 inches . .. .. .... .. .. .. . ... .. ... ... .. .. .. .. .74 inches ... .. .. .. .... .. .... .. .. .. .. .. . .. ....
Women
57 inches ... .. .. ... .. .. . .. ... . .. .. .... .. .. ...58 inches .. . ... .. .... .. .. .. ... . . ...... .. .. ...59 inches .. .. ... .... . .. .. .. .. .... .. .. .. .. .. ..60 inches .. . .. .. ..... . . ...... . .. ... .... . .. .. .61 inches .. .. .. .... .. .. ... ..... . .. ..... .. .. ..62 inches ... . .. .. .. .. .. .. .. .. .. .... .... .. .. ..63 inches .... ... ... ... .. ... .... . .. ... .. .. .. ..64 inches .. .. . ... .... .. .. .. .. .. .. .... .. .. .. ..65 inches .. .. .. .. .... .. .. .. .. .. .. .. .. .. .. ....66 inches .. ... . .. ... ... . ... . ... .. ...... .... ..67 inches .. .. .... .. .. .. .. .. .... .. .. .... .. .. ..68 inches .. .. .... .. ... . .. ...... ... ... .. .. .. ..
(1971-74), by age and height: United States
EIEE18-24 years
115118122125129132136139143146150157157
949698
100‘103105107109112114116118
1-7..
12E
133137141I 4!
150
154158162166168174
102
105109113?16118123127131134138‘141
107112117122127131136141145150155160167
90939699
102103108111114117120123
45-54 years
123128132136140145
149153158163167172176
101
105108112115119122126130133137140
-[-1-!-,
-..,
+:+:
+1
+!
+:
+1(
J
-.
-.
.,
.,
#-.
+1
+;
+:
+:
++
+!
-2-1-1-1-1
-1-1
+1
+1+4+;
-1
-1-1-7+1
-1-1-1-1-1-1
--LHES, HAN ES,1960- 1971-
62 74
116121128130135139‘144148153157
162166170
85899397
101105109113117121125129
25-34 years
115119124130134139744148153158163168173
919498
101105109112115119123126130
55-64 years
123126130133137141144148151158159162166
111
114117120123125128131134137140143
119123129134139144149
154159165169173179
104108112115119122125129132136139143
Excessof
HANESoverH ES
-1-:-4
-1
+1
+1-t;+2
+E+5+5
+4
+4+4+3+5
+2+2+1+1
4-3-1
+1+2
+3+5
+6+$3
+8+10+1 1+13
-7-6-5-5-4-3-3-2-2-1-1
—
H ES,1960-
62
35-44 years
126129133137141145148152156159163167171
104107109111113116118120122125127129
—
HAN ES,1971-
74
120125130135140146151156161167171177182
96‘100104108112115119123127130134134
65-74 years
?20124127130134137141
144147151154158161
108
111114118121125128132135139142146
121125
I 22
134138142147
151155160164168172
108170113116120123127130134137141145
Excessof
HANES
overHES
-6-4-3-2-1
+1+3+4+5+8+8
+1 o+11
-8-7-5-3-1-1
+1+3+5+5
+7+5
+1
+1+2+4
+4+5+6+7+8+9
+1 o+1 o+11
-2-1-1-2-1-2-1-2-1-2-1-1
—
NOTl<;: Height was measured without shoes. Two pounds were deducted from HES data to allow for weight of clothing; totalweights of all clothing for HAN1.;S ranged from 0.20 to 0.62 pound, which was not deducted from weights shown.
39

Table 27. Differences at the 10th percentile of the weight distribution of men and women in HES (1 960-62) ancl HANES
(1971-74), by age and height: United States
mExcess
ofHANES
overHES
Excess
ofHANES
overHES
HES,1960.
62
HAN ES,1971-
74
HES,1960-
62
HAN ES,1971-
74Sex and height
18-24 years 25-34 years 35-44 yearsMen—
62 inches ... .. . . . .... .. .... .... .. .. . .. ...63 inches ... .. ... ..... .. ... ... .. ... .. .. ... .. .64 inches ... ... ..... .. ... .... ... . . ... ... .65 inches ... .. .. .. .. . .... ..... . .. . .. . .. .. ....66 inches .. .. .... . ... .. ... .... . ... .. ... . .67 inches .... ... .... .. ... ..... . .... ... .. .. ...68 inches .. . ... .. ... .. . .. ... ... .. .. . ... .. .69 inches .... ..... .... . .... ... . . .. .. .. .70 inches ... . .... .. ... . ... .. . ... ...... .. . ...71 inches . .. . .... .. .. . .. .. .. .... .... .. .. . .72 inches ... ..... ... . .... .. . . ...... .. .. .. ... .73 inches ... ..... ..... ... . ... ...... . . .74 inches . ....... . .. .. .. .. . .. ... .. .. . .. . .... .
Women
57 inches .. .... .. . .. .. .. . . ... .. . ... .. .58 inches .... . .. . ....... . ... ... .. . . .. .... ... .
59 inches .. ... ... .... . ... ..... .. ... ... ... . ...60 inches .. .. . .. .... .. .. . .. .. .. .. .... .. .61 inches .. ... ... .... .. .. . .. ... .. . .... . ... .. .62 inches ... .. ....... .. .. ... .. .. .. . .. .. . .. ..63 inches ..... ... .. ... ...... .. ... .... .. .. ..64 inches . . .. .. ... ... .. . .. .... .... .. .. . .65 inches .. . ... .. .. ... ... ... .. .. . .. .. . .. .
66 inches .. .. .. . . .... .... .. .. .. .. .. .. .. .. ....67 inches ...... .. .. .. ... ... .... .... .. .. ..... .
68 inches .... . .. .... .. .. . .. . .. ... . .. .. ..... . .
Men—
62 inches ... .. . ....... .. .. ... .. .... .... . .63 inches ... . ... ... .. ... . ....... .... ... .. ..64 inches .. .. .. . . ... .. .. . .. .. .. .. . .. ... . .65 inches ... .. .. .... .. .. .. ... .. ... .. ... . .. .. .66 inches ... .. .... .. .. .. . .... ... .. ... ..... .67 inches ... ...... .... . ...... . ... .. ... .. .....
68 inches .. . . ... .. .... .. .... ... . .... .. .. ... ..69 inches ... ... .. .. . .... .. .. . .. .. .. . .... .70 inches ... .... .... . .... .. .... .... .. .... ..71 inches .. .. .. . .. ... .. .. .. . ... . . . ..72 inches .. .. . ... ... . ... . . .. ... . ...73 inches ... .. .. .... ..... ... . ...... ... .. .. .. .74 inches ... .. .. .... .. . ... .. .. ...... .. .......
Women
57 inches .. .. .. .. . ... .. .... ... .. ... .... . ... ..58 inches .. .. .. ...... .. ... .... .. . .... .. ..59 inches . . . ... .. . .. . . .... .. .... .. . ..60 inches .... .. .... . . . .. .. .. .. .... .61 inches .. . ....... .. ... .. ... .. ... ..... . ... ..62 inches .. .. .. .. .. .. .... .. . . ... .. .. .. .63 inches .. .... .. .. . .. . .. .. . .. ... . . ...64 inches . . ... .. . . . .... .. . ... .... ... .65 inches .. .. . .... . .... . ... . .... ... . .... ..66 inches ... .. . ... ... .. .. .. .. .. ..... . ... ..67 inches .. .. .. .. .. ... . .. . .... .. .. . . . .. . .68 inches .. . .. .. . .. .. ... . .... .. .. .. .. ..
95100105110115119124129133138143148153
788184
8790939699
102105108111
102106
111117121126131135140145150155160
7780
8487919598
101105109112
116
105108112115119122126129133136
140147147
8385878992949698
101103105107
.Ic-.5-7-5-4-3-2
+2+3+1+6
-5-4
-3-2-2-1
+1+1+2+3+4
-3-2-2-2-2-1
-2-2-1
+3+1
-3-2-3-3-3-3-3-3-3-3-3-3
105109116118123127132136141145
150154158
7276
8084889296
100104108112116
-3-3-5-1-2-1-1-1-1
+1
+2
+5+4+6+3
+3+3+2
+1+1+1
-5-4-2
+1+2+4+5+7
+8+9
+1 o+12
-9-8-7-7-6-5-5-4-4-3-3-2
115“118122126130134137141145148152156160
909395
9799
102104106108111113115
108113118123128134139144149155159165170
-7-5-4-3-2
+2+3+4+7+7+9
+1 o
-10-9-7
-5-3-3-1+3
+3+3
+5+7
808488929699
103109171114118122
45-54 years 55-64 years 65-74 years
114118122126130134139143147151155157163
899296
100103107110114118121125128
111116120124128133137141146151155160164
86909397
100104107111115118122125
106110116121126131136141146152156160166
899397
100104107110114117121124128
111114118121125129
132136139144147150154
98101104107110112115118121124127130
108112115118122125129132135139142146149
97100103107710114117121124128131135
110114118123127131
136140144149153157161
9397
100103107110114117121124128
132
+2+2+3+5+5
+6+7
+8+9
+1 o+1 1
+1 1+’12
-4-3-3-4-3-4-3-4
-3-4-3-3
—
NOT1{: Height was measured without shoes. Two pounds were deducted from HES data to allow for weight of clothing; totalweights of all ckrthing for HANES ranged from 0.20 to 0.62 pound, which was not deducted from weights shown.
40

Table 28. Differences at the 5th percentile of the weight distribution of men and women in HES (1960-62) and HANES
Sex and height
Men
62 inches —.. ... .. ... .... . .... .. .. .. .... . .. ...63 inches .. . .. ...... .. .. .. .. .. . ... .. .. .. ....64 inches .... ... .... .. .. ... . .. ... ..... .. . ...65 inches .. ... . .. .. .. ... . .. .... . .. .... .. . .. .66 inches ..... . .. .. .... ... .. ... .. .... ... .. ..67 inches ... .... .. .... .. .. .. .. .. ... .... . ... .68 inches .. ... .. .. ...... . ... .... .. .. .. .. .. ..69 inches ... .. .... .. .. .. .. .. .. .. .. .. .. ... . .. .70 inches ... ... . .. ..... . .... .... .. .. .. .. .. ..71 inches ... . . .. . ... ..... . .. .. .. .. .. ... . .. ..72 inches .. . .. .. .. .. .. .. .. .. .. .. ... ... .. .... .73 inches ... ........ .. .. .. .. .. .. .. .. .. .. .. ...74 inches . . . . . . . . . . . . . . . . . . . . . . . . . . . . . . . . . . . .
Women
57 inches .. .. .. .. .. .... ..... .. .. ... .. .. .. ....58 inches .... .. .. ... . .. .. .. . .. ... ... .... ... ..59 inches ... .. ... ..... ... .. ... ... . ... .. ... .. .60 inches ... .. .. .. .. ... .. .. .... .. ...... .. .. ..61 inches ... .... .. . ..... ... . ..... . ..... . .... .62 inches .... .. .. .... .... . . .. ... ... .. .. .. .. ..63 inches ... . .. .. .. ... .. .... . ..... .. ... ... ...64 inches .. .. ... . ...... .. .. .. .. ... . .. .. .. .. ..65 inches .. . .... ... .. .. .. . ... .. .... .. .. .. .. . .66 inches .. .. .... . ... .. .. .... ...... . ... .. .. ..67 inches .. .. .. ... . .. .. .. .. . . .. .... .. .. ... ...68 inches ... ... ... ... .. .. .. .. .. .... .. .. .... ..
Men
62 inches —... ...... .. ... .. ... .. .. ... .. .. .... ..63 inches ... ...... ... . .. .. . .... .... . .. .. ... ..64 inches ... . .... ... .. .. . .. .. .. .. ... .. . .. ... .65 inches .. . .. .... .. .. .. .. .. .. .. . ... .. .. .....66 inches .. . .... .. .. .. .. .... . .. .. ... .. . ... .. .67 inches ... .. .. .... .. .. .. .. .... .. ... . ... . .. .68 inches .... .. . ..... . .. . .... . ... ... .. .... ...69 inches .... ... ... ... .. .... .. .. .. .... .... .. .70 inches ... .. .. .. .... . .. ....... .. .... .. .. . . .71 Inches .. ..... .. .. .. ... . . .... ... .. ... ... . ..72 inches ... . .... .... .... .. . .. .. ... . ... ... . . .
73 inches ... .. .. .. .. .. .... . .. .. ..... . . .. ... ..74 inches ... . ..... .. . ... ... . .. ... . .. .. .... .. .
Women
57 inches .. .. .. .... .. .. . ... . ... .. .... .. .. .. ..58 inches .... .. .. .. ... . .. . .... . .... ... . .. .. ..59 inches .. .... .. .. .. . ... .. ... .. .. ... .. .. .. ..60 inches ...... .. . ..... . .. .. . ... .. .. .. ... .. ..61 inches ... .... ... .. .. .... .. . ... .. . .. .... . ..62 inches .. . .... . .... ... .. . ..... .. ... . .. .. .. .63 inches .. ... .. .. ... ..... .. .... ... . .. .. .... .64 inches .. ... .... .. . .. ... ... .. ... .. .. ... ... .65 inches .. .. ....... ... .... .. .. ..... .. . . .. .. .66 inches .. ... ..... . ... ... ... . ........ . .. ....67 inches .. . ... ..... . .. .. .. .. . ... .. .. . ... .. ..68 inches .... .... .. .. .. .... ... .... . .... . . .. ..
(1971 -74), by age and height: United States
18-24 years
97100104107111114118121125128132139139
757779818486889093959799
105109113117121125130134138142146148
154
78818589929699
103107110114117
8590g!
100105109114119
123128133138143
6871747780838689929598
101
45-54 years
100105109113117122126130135140144149153
7377808487919498
102105109112
-12-lo
-9-7-6-5-4-2-2
+1-1
+4
-7-6-54-4-3-2-1-1
+1+2
-5-4-4-4-4-3-4-4-3-2-2
+1
-1
-5-4-5-5-5-5-5-5-5-5-5-5
IIExcess
HES, HAN ES, of
1960- 1971- HANES
62 74 overH ES
25-34 years
9599
106108113117122126131135140144148
61656973778185899397
101105
101104107111115119122126129134137140144
8790939699
101104107110113116119
9195
100106110115120124129134139144149
65687275798386899397
100104
55-64 years
96100106111116121126131136142146
150156
77818588929598
102105109112116
-4-4-6-2-3-2-2-2-2-1-1
+1
+4
+3+3+2+2
+2+1
-1-1
-5-4
-1
+1+2+4+5
+7+8+9
+1 o+12
-lo
-9-8-8-7-6-6-5-5-4-4
-3
m35-44 years
107110114118122126129133137140144148152
798284868891939597
100102104
99103106109113116120123126130133137140
87909397
100104107111114118121125
98103108113118124129134
139145149155160
677175798386
909498
101105109
65-74 years
100104108113117121126130134139143147
151
828689929699
103106110113117121
-9-7-6-5-4-2
+1+2
+5+5+7+8
-12-11
-9-7-5-5-3-2
+1+1+3
+5
+1
+1
+2+4
+4+5+6+7
+8+9
+1 o+1 o+1 1
-5-4-4-5-4-5-4-5-4-5-4-4
—
NOTI,;: Ileight was meusurci-1 without shoes. “1’wfl p[mnds were deducted t’rOm 1{1;S datu to allow fOr wri~ht uf ck)thing: tOtdweights of fill clothing fur HAN 1;S ranged f’rom 0.20 tn 0.62 pound, which was nnt deducted frnm weights sholvn.
41

APPENDIX
CONTENTS
Appendix: Statistical N[)tcs . .. ..... .... . ..... ... .. ..... . .. .. ..... . .. ...... .. .. ... ..... . ... .. ... . ..... ... .. .... .. ... ..... .. ... ..... ... .. ..... .. .
I.
II.
I.
H.
111.
Iv.
v.
VI.
VII.
VIII.
Ix.
x.
XI.
XII.
XIII.
XIV.
xv.
Nonresponsc .. .. .. ..... ... ... ..... .. ... ..... .... .. .. .. .. .. ..... . .. .. .. .. ... ..... .... . ..... .. .. ..... ... .. .... .. ... ..... .... .. .... . ... .........Missing I)ata .. .. .. .... .. .. .... .. .. .... .... .. . ... .. .. .. . ..... .. ... ..... .. ... ..... .. .. .... . ... .. ... ... .. ..... . .. .. .... .. ... ..... .. .. ...........Standard Errors ... ... . .. .... .. .. ... . .. .. ... ... .. .. .. ...... .. .. .. ... . ... . .... .. .. .. .... .. .. ...... .. .. .... ... .. ..... .. .. .... .... ... .... ......Small Categories . . .. .. ...... .. .. ...... .. . ..... .. .. .... .. .. .. .... .. .. .. ...... .. .. .. ... . .... ..... .... .... . .. .. .. .. .. .. ...... .. .... .. .... .. ..Rq+rcssion Estimates ... .. .. .. ...... .. .. .... .. ... ..... .. .. .. .. ... . .. .. .... .. .. .. .. .. .. ....... . .. .. .... .. .. .. .... .. .. .... .. .. .. .... .... .. .
LIST OF APPIENDIX FIGURES
Average weights of mcnby agcanrt height estirmtcd from regression equations for weight (y)andhcight (x): y=a +bxand loxlo y=a+bx: United Stiatcs, 1971-74 .. .. .. .. .. .. .... .. .. ...... .. . ..... .. .
Average weights uf women by a~c and hci~ht estimated from regression cquatiorw for weight (y)andhcight (X):Y=a +bxancil[>gloj,=a+bx: United States, 1971-74 .. .... .. . ..... ... .. ..... .. .. ...... . ...
LIST OF APF’ENDIX TABLES
Pcrccnt r!istributinn of nunrcspnnsc a(ijustmcnt factors in stmds 1-65: United States, 1971 -74..
Number 01 examinccs \vith unc or more missing anthropometric measurements: United States,1971-74 ... .. ... ... . . ...... . ... .... .. .. ... ..... ... . ..... . .... ...... . .. . .... .. . . ... ... .. . . .. .... .. .. ..... ... ... .... . .. . ...... ... .................
Number uf mcn aKcd 18-24 yrars by weight for height: Unitvd States, 1971-74 .... ... . .. .... .. ... ..... ..
Number nf men a~cd 25-34 years by weight for hci~ht: United States, 1971-74 .. .... .. .... . .. ....... .. ..
Number of mcn a~cd 35-44 years b} weight for height: United States, 1971-74 ... .. . ...... . .. ...... .. .. .
NumLrcr of mcn wcd 45-54 years hy wci~ht for height: Unitcrf States, 1971-74 .. ... ... .... . ...... ... .. ..
Number 01 mcn a.gt,d 55-64 years by wci~ht for height: United States, 1971-74 ... .... . .... .... .. ... .....
Number ,,f mtn aged 65-74 years by wci~ht f~,r hci~ht: United States, 1971-74 .. .... .. .. .... .. ... ..... ..
Nurnbrr (,I women aged 18-24 years by wci~hl for height: United States, 1971-74 .. .. .... ... .. .. .. ....
Numbtr of wom{n wed 25-34 ycurs hy wci~h tfor bcixht: United States, 1971-74 .. .... .. . ....... . .. ..
Numtx,r of !vorncn agrd 35-44 yctirs hy wcighl t’or hl,i~ht: United Stiitcs, 1971-74 .... ... . ..... .... .. ..
Number ,,f w,)m,,n ugcd 45-54 yrars by wci~hl for height: United States, 1971-74 .. ... ... .... . ... .....
Number of ~vomcn WC(I 55-64 years by weight for height: Unitc(i States, 1971-74 ... .... .. .. . .. .. .... .
Numfrcr 01 women ZIXCII65-74 vcars by weigh Lfor height: United Stiatcs, 1971-74 .. . ..... .. .. ...... . ..
Covfficirnt of correlation, Constlnts for regression equations, :tnd standard error of estimate d’wci~ht (y) on hrigh[ (x) of :idul[s a~cd 18-74 ymrs: United States, 1971-74 .. .. .. ... .... .... ... ... .. .... ..
43
4445525252
54
55
45
46
46
47
47
48
48
49
49
50
50
51
51
52
56
42

APPENDIXSTATISTICAL NOTES
The sampling plan of the Health and Nutri-tion I{xamination Survey followed a highlystratified multistage probability dcsi.gn in whicha sample of the civilian noninstitutionalizcdpopulation of the contcrminous United Staks1-74 years of agc was sclcctcd. I’crsons confined
to institutions or residing upon any of thereservation lands set aside for American Indianswere cxcludcd from the selection process. Suc-cessive clcmcnts dealt with in the samplingprocess were the primary sampling unit (PSU),census enumeration district (ED), segment (acluster of households), household, eligible per-son, and sample person.
The starting points in the first stage of thisdcsicgn were the 1960 decennial census lists ofaddresses and the nearly 1,900 PSU’S into whichthe contcrminous United States wus divided.Each PSU is either a standard metropolitan
statistical area, a single county, or two or threeconti~ous counties. The primary sampling unitswin-c grouped into 357 strata for usc in theHealth Interview Survey and subsequentlycollupsed into 40 superstrata for HANI.IS.
Fifteen of the 40 superstrata contained asingle Iargc metropolitan area of more than
2,000,000 population. These 15 areas werechosen for the sample with certainty. Theremaining 25 superstrata were formed by classi-
fying the nonccrtainty stratu into four popula-tion density groups within each of four geo-gmphic regions. Then, a modified Goodnlan-Kish controlled selection tcchniquc was used to
assure proportionate rcprescntiation of specified
State groups and rate of population changeclasses, the probability of selecting a PSU beingproportionate to its 1960 population. In thismanner a total first-stage sample of 65 PSU’S, or
“stands,” arc the areas within which a sumplc of
persons would bc sclcctcd for examination. ThePSU’S arc scheduled for sampling over a 3-yearperiod, with 300-600 persons examined pcrsednd.
The 1970 census data, when they becameavailable, were used as the frame for selectingthe sample within PSU’S. However, the calendarof operations required that the 1960 census databc used for the first 44 locations in the lIANES
sarnplc. The 1970 census data were used for thelast 21 stands of the sample.
Beginning with the 1970 census data, thescgrncnt size was changed from an cxpcctcd 6households sclectcd from compact clusters of 18households to an cxpcctcd compact cluster of 8households. The change was made bccausc ofoperational advantages. In addition, research bythe U.S. Bureau of the Census indicated that
precision of estimates would not bc appreciablyaffcctcd by the chmgc from noncompact clL[s-tcrs to compact clusters.
For ED’s not having usabIe addresses,generally Iocatcd in rural areas, area sampling~$las cmplo~cd. Consequently some variation in
the scgrnent size occurred. To rnakc the sampkrcprcscntativc of the current population of the
United States, the addresses or ED segments~zcrc Supplclncntcd by a sample of housing units
that had been constructed since the 1960 and1970 dcccnnial censuses.
Within each PSU, a systematic sample ofse=y-nents was selected. The ED’s that fell intothe sample were coded into one of two eco-nomic classes. The first class, identified as the
“poverty stratum, ” was composed of “currentpoverty areas” that were identified by the U.S.
Bureau of the Census in 1970 (pre-1970 census).
43
In addition, other ED’s in the PSU with a meanfamily income ol less than $3,000 in 1959(based on 1960 census) were included. Thesecond economic class, the “nonpovcrt>, stra-turn, ” includes all I~D’s not designated as belong-
ing to the “poverty stratum. ”All sample segments classified as bcin~ in the
poverty stratum wu-c retained in the sarnplc.For the first 42 stands sample segments in
nonpovcrty stratum 1}1)’s were divided into ei~htrandom subgroups. Onc of these subgrotips waschosen to remain in the HANKS sw-nplc. Re-
search indicated that efficiency of estimatescould bc incrcascd by changing the ratio of
poverty to nonl)ovcrty sc~mcnts in the non-poverty stratum. ltl~’s were divided into tworandom subgroups; onc of the subgroups waschosen to remain in the IIANKS sample. The
differential samplins permits a separate analysiswith adequate reliability of those classified asbeing below the poverty level and th~)sc classi-fied as being above the p(jvcrty level.
After idcntifyin~ the sample segments, a list
of all current addr-csscs within the segment
boundaries was rrmdc, and a member of eachhousehold was intcrvicwcd to dctcrrninc the agcand sex of each household rncmbcr as well asother demogmphic and socioeconomic informa-
tion required for the survey. If no onc was athome after repeated calls or if the household
members refused to be interviewed, the intm-viewer tried to dctcrminc the houscholc! compo-
sition from neighbors.To select the persons in sample segments to
be examined in HANES and at the same time toovcrsamplc certain groups at high risk of malnu-trition, all houschold members aged 1-74 yearsin each segment were first listed on a sample
selection worksheet with each household in thesegment listed serially. The rrumbcr of house-hold members in each of the six age-sex groups
shown below were then listed on the worksheetunder the approprititc group. The sample selec-tion worksheets were then put in segmentnumber order, and a systematic random sampleof persons in each age-sex grLJLIp was sclcctcd to
be examined using the followin~ sampling rates.
NOTE: A list of references follows the text.
1-5 years .. . . . . . . . . . . . . . . . . . . .. . . . . . . . . . . . 1/~
6-19 years .. . . . . . . . . . . . . . . . . . . . . . . . . . . . . . . 1/420-44 years (male) .. . . . . . . . . . . . . . . . . . 1/420-44 years (female) . . . . . . . . . . . . . . . . 1/245-64 year-s . . . . . . . .. . . . . . . . . . . . . . . . . . . . . 1/465-74 years . . . . . . . . . .. . . . . . . . . . . . . . . . . . . 1
The persons selected in the 65-stand sampleof IiANES comprise a rcpr-cscntativc sarnplc ofthe target population and inc]udcd 28,043
sample pawns 1-74 years of agc of whom
20,749, or 74 percent, were examined. Whenadjustments arc made for differential samplingfor high-risk groups, the response rate bccornes
75 pcrccnt.All data prcscntcd in this report arc based on
“weighted” observations. That is, data rccordcdfor each sample person arc inllated to char-
acterize the suburrivcrsc from which that sampleperson was drawn. The weight for CJCII ex-amined person is a product of the reciprocal ofthe probability of selecting the person, w-r
adjustment for nonrcsponsc cases (i.e., personsnot examined), and a posts tratificd ratio adjust-ment. The third factor increases precision by
bringing survey results into closer aligr-qncntwith known U.S. population figures for 60 age,race, and scx groups as of Novcrnbcr 1, 1972,the approximate midpoint of IHAN13S.
A detailed description of the survey designand selection technique is described in a
previous Vital and Health Statistics report.z
Non response
In any health examination survey, one of thesevere problems is nonresponsc. Usually a sizablenumber of sample persons will not participate inthe examination. Another potential for bias
occurs if the characteristics being examined arenot similar for nonparticipating and participat-ing sample persons. Intensive efforts were made
in HANES to develop and implement proceduresand inducements to reduce the number ofnonrcspondents, thereby diminishing this poten-
tial for bias.
44

Despite these intensive efforts, 25 pm-cent ofthe sample persons from 65 stands were notexamined. Consequently, the potential for a
sizable bias dots exist in the estimates in thispublication. However, from what is knownabout the nonrcspondents and the nature ofnonresponsc, it is believed that the likelihood ofsizable bias is small. For instance, only a smailproportion of persons in the first 65 stands gavereasons for nonparticipation. Therefore, theydiffer from the examined persons on the char-acteristics being examined.
An analysis of medical history data obtainedfor nonexarninces M well as cxaminecs indicatesthere is no sixabIe bias due to nonresponsc. No
ktrgc differences wet-c found bctwccn the CX-
amincd group and noncxarnined group for thestatistics compared. For example, 12 percent ofpersons examined reported having an illness orcondition that intcrfmcs with their eating, ascompared with 10 percent of persons who werenot examined but had complckd a medicalhistory. The pcrccnt of examined persons re-porting ever being told by a doctor that theyhad arthritis was 20 pm-cent; for hit# blood
pressure it WJS 16 percent; and for diabetes itwas 4 percent. The corresponding pm-ccntagesfor norwxamincd persons wet-c arthritis, 18pcrccnt; high blood pressure, 22 pcrcm-tt; anddiabetes, 4 pcrccnt.
As mentioned earlier, the datti in this reportare based on weighted observations, Llnd Qnc Of
the components of the weight assigned to anexamined person was an adjustment for non-response. A procedure was adopted that multi-plies the reciprocal of the probtibility of selec-tion of cxaminccl persons by a factor. Thisfactor brir+y estimates based on examined pu--
sons up to a Icvcl which ~vould have beenachicvecl if all sample persons had beenexamined. The nonresponsc adjustment factor iscalculated by dividing the sum of the reciprocalsof the probability of sclccti(m for all sanl])lcpm-sons in each of five income ~qwups ~vithineach stand by the sum of the rccipr(xals c)f the’probability of selection for examined samplepersons in the sarnc sLLnd and income group.
The live income gr(mps are undo- $3,000,
$3,000-6,999, $7,000-9,999, $10,000-14,999,and $15,000 or more. For sample ~veightin~
purposes, the income groLIp for 5.6 pcrccnt ofthe sample persons ~vas imputed using theeducational level of the head of the household.
To the extent that the income-~vithin-standclasses are homo#’ncous for the health charac-teristics under studlr, the adjustment procedureis effective in rcduclng the potential of bias ducto nonrcsponse. The percent distribution of thenonrcsponse adjustment factors computed forthe 65-stand sample of HANES is sho~tm intable I.
Table 1. Percent distribution of nonresponse adjustment factorsin stands 1-65: United States, 1971.74
1
Size of factorPercent
distribution
Total ... ... .. .. ..... . .... .. . .. . ..... . ... .... .. . .... . ... ... .. .. ...
r
100.0
1.00-1.24 ... . .. .. .. .. .. .... . ... . ... ... . .. .. . . .. .. .. .. . . .. .. .. .. ... ... .. .. 32.61.25-1.49 ... . . ....... . ... ... .. .. .. ... .. .. .... .... .. .. . ...... ... .. .... .. .. 38.51.50-1.74 .. . .... ... ... .. ... .... . .... ... .. .. .. .. .. ... .. ... .. .. .. . . .... .. .. 18.21.75-1.99 .. . .... .. .. .. . . .... ... .. ..... ... ... .. .. .... .. .. .. .. ... .. ..... . .. 7.42.00-2.49 . .. .. .. .. .... . . .. .... .. .. .. .. .. ...... .. .. ... ... .. .... .. ...... .. . 2.82.50-2.99 . .... .. .. .. .. .. .. .. .. .. .. .... . .. . .... .. ... .... .. .. .. .... .. ... . .. 0.33.001 . . . . . . . . . . . . . . . . . . . . . . . . . . . . . . . . . . . . . . . . . . . . . . . . . . . . . . . . . . . . . . . . . . . . . . 0,3
Missing Data
45
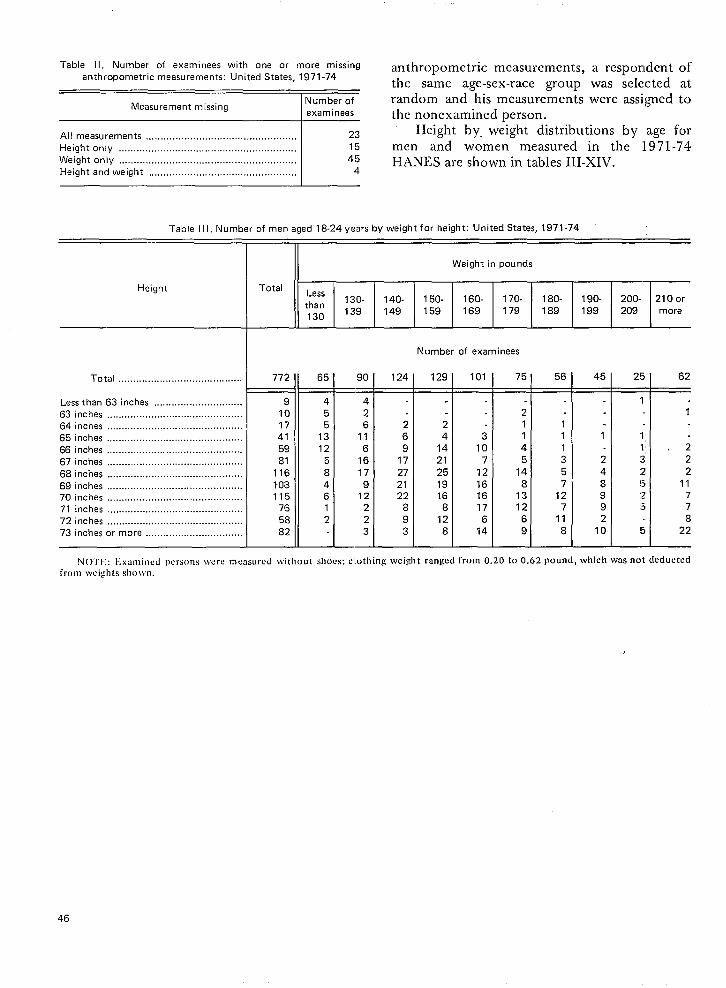
Table 11. Number of examinees with one or more missing anthropomctric mcasurcmcnts, a respondent ofanthropometric measurements: United States, 1971-74
the same age-sex-race group was selected at
Measurement missingNumber of random and his measurements were assigned toexam inees the nonexamined person.
____-u! ‘All measurements ... ..... ..... .. .. . ..... . .. . . .... . .... . .. .. . . . Height by, weight distributions by age forHeight only ... .. ... ..... .. . .. .. .. . .. .. .. .. . .. .. .. . .. . .. .. .. . .. . men and women measured in the 1971-74Weight only ... . .... ... ... .. .. .. .. ..... . .. .... . .. .. . .. .. .... . .. . HANES are shown m tables III-XIV.Height and weight .. .. ..... . .... . ..... . .... .. ... .. .. . .... . ..
Table I I 1, Number of men aged 18-24 years by weight for height: United States, 1971-74
Weight in pounds
Height TotalLessthan
130- 140- 150- 160- 170- 180- 190- 2oo- 210 or
130139 149 159 169 179 189 199 209 more
Total .. .. .. .. .. . ..... .... .. .. .. .... .. . ... .. .. .. 772 65 I
Less than 63 inches .. .... .. . ... .... .. .. .. .. .... .. 9 4’
63 inches .. ......... .... ..... .... . ..... .... .. ...... ... . 10 5
64 inches ........ ... .... ... .. . ... ..... .. .. .. ...... . .. .. 17 5
65 inches .... ... . .. .. ..... . ... .. ..... ... .. ...... ... ... . 41 13
66 inches ..... .. .. ... ..... ... .. ...... .. .... ..... .. .. . .. 59 1267 inches ... .... . ....... ... ... . .. ... .. . ... ... .. . 81 5
68 inches ... .. .... .. .... .. .... .... ... .. .. ..... .. ... .... 116 8
69 inches .... .... ..... .. .... .... ... .. . ..... .. .. .. .... .. 108 470 inches .... ... ... .. . . . .... .. .. ... .. .. .. ..... . 115 6
71 inches ... ... .... . ... . ...... ... .. .. .... .. .. ....... . .. 76 1
72 inches .... ..... ..... . ...... .. .. . ..... ... ... .... .. .. . 58 2
73 inches or more ..... ... .. ....... .. .. .. ... .. .. ... 82 -
90
426
116
16
179
12223
——
124
269
17272122
893
Number of examinees
129
24
1421
251916
812
8
101
310
712161617
614
75
21146
148
1312
69
56
111357
127
118
45
1
2
48992
10
25
T
62
-11
‘1, -‘1’ \ 2:3 2
2 2!~ 112 75 7
85 22
NOTE: Examined persurrs Ivere measured ivithout SI1OCS:clothing weight ranged from 0.20 to 0.62 pound, which wms not deductedfrom weights shotvrr.
46

Table IV. Number of men aged 25-34 years by weight for height: United States, 1971-74
Weight in pounds
Lessthan
130- 140- 150- 160- 170- 180- 190- 2oo- 210 or
130139 149 159 169 179 189 199 209 more
Height Total
Number of examinees
Total .... .. .. .. ...... .. .... .. .... .... .. .. .. ....
Less than 63 inches .... .... . .... . .. .. .... .. .. . ...63 inches .. .. ... ...... .... .. ... .. .. .. ... . .. .. .... .. . .64 inches .. .. .. .. . ...... . .. .. .... .. .. .. .... .. .... .... . .65 inches .... .. .. .. . ... .. .. .. ...... .. .. .. .... .. .. .. .. ..66 inches ... ...... .. .... .. ... .... ... .. . . .. ... . ... ..... .67 inches .. .. .... ... ... . ... .. ... ..... ... . .... .. .. ..... .68 inches .. .... .... .. .... .... .. .. .... .. .... .... .. ... ...69 inches .. .... . ...... ... .. ..... . .. .... .... .. .. .. .. .. ..70 inches .... .. ... .... .. .. . .. .. .. . ... .... . ... .... .. .. ..71 inches .... .. ... .... ... .. .. ... .. ... ... .... . .. .. .. .. ..72 inches .. .......!.... . .. ... ..... ... .. ... ... ...... .. ..73 inches or more ..... .. ... ..... .. . .... .. .. ..... ..
54 86 102 42
122424
10
16
10
99
I804 33
6 117 423 341 570 586 392 5
120 3112 2
73 269 -95 -
129 103 84 72
3356
101045512
1587
116
151012
812
1
139
11142211
88
15
32
1111191226151410
6
13
101515171410
98
1159
138
18
79
13
112657
101313
59
1
1145
1512
91932
NOT1l: I.jxwnined persons were measured without shoes: clothing weight ranged from 0.20 to 0.62 pound, which iris not deductedfrom weights shown.
Table V. Number of men aged 35-44 years by weight for height: United States, 1971-74
Weight in pounds
Total“Lessthan
130- 140- 150- 160- 170- 180- 190- 2oo- 2100r
130139 149 159 169 179 189 199 209 more
Height
Number of examinees
Total .... .. . .. .. ..... .. .. .... .. ... ..... .. .. ... .
Less than 63 inches ... . .. ... . .... .. .. .... . ... ...
63 inches .. .. .. .... . .... . .... ...... . . ..... .. ...... .. .. .64 inches .. . ..... .. .... ... .. . .. ... .... . ..... . ... .. .. .. .65 inches .. .. .. .... .. . ... . .. . .. ... .. .. .. ...... .. .. .... .66 inches .. . .. ..... .. .. . .... . ... ..... ... . .... ... .. ... ..67 inches .... . .... .. .. .... ... .. ... ..... . ... ... .. .. . ... .68 inches ..... ... . ........ .. .... ... ... ..... . .. .. ... . .. .69 inches ... ... .. . . .... .. ... ..... . .... ... . .. . ..... .. .. .70 inches .. ..... . .. . ..... ... . ..... . .. .. .. ..... . .... .. ..77 inches ... ..... .. . .. .... ... ... ... .. .. . .... .. .. .... .. .72 inches ... ... ..... ... . .. ... ... ... .... . .. .... .. .. .. .. .73 inches or more ... .. ... .... ... .. .. ... .... . ... .. .
665 33 I 38 46 65 107 88 86 821 491 71
91223406375
989788694447
535
942
31
1
221486
43314
1134
116
57512
1
127
7279
1421
363699
145712
14
109
1219
211710
4
2228
15
211212
635
246
11
13111215
66
374
13
151916
23
23
79747
10
NOT1.:: }Jxmnined persons were measured without shoes: clothing weid]t rmmed from 0.20 to 0.62 wund. which was not deductedfrOm \veigl]ts shmvn.
47

Table V1. Number of men aged 45-54 years by weight for height: United States, 1971-74
Height Tota I
Weight in pounds
ILessthan
1so. 140. 150- 160- 170- 180- 190. 2oo- 2100r
130 ’39 149 159 169 179 189 199 209 more
Number of examinees
Total .. . ..... .. .. .. .. ... . .. . ... .... ... . .. .... .. 765 77 89] 110 .69 40 97
I45 47
.
7 71 23 36 65 9
11 6
6 93 6
12 21 1
—
99] 92
=i=1616235976
112
121110
84544945
354
109
12
10
811
113
1 14 44 2
10 1010 2016 2117 15
9 166 96 52 54 2
1
3256
1289
10i’6
1
:45
10444
2329
141710
131413
2 -6 57 7
14 1124 1018 2011 174 79 53 10
NOT[{: Kxaminecf persons were measured without shnes: clcrthing weight ranged from 0.20 to 0.62 pound, which wos not deductedfrom weights shown.
Table Vll. Number of men aged 55-64 years by weight for height: United States, 1971-74
IiWeight in pcsunds
TotalLess
130.than
140- 150- 160- 170- 180- 190- 2oo- 210 or
130139 149 159 169 179 189 199 209 more
Height
Number of examinees
I597 44
15 412 433 459 10
69 696 890 575 256 148 -22 -22 -
36——.—
133238
65221
54 73 41 35 \ 5675 87 96
2265
1114
1410
4511
3
79
20111411
4413
42694
13662
11
1
3696
131113
65
11
109
17191510
932
1439334734
22
:3667
4—.
22776
10877
NOTE: Examined persons were measured without shoes: clothing weight ranged from 0,20 to 0.62 pound, which was not deductedfrom weights shown
48

Table Vlll. Number of men aged 65-74 years by weight for height: United States, 1971-74
Height
Total .. .. .... .... . ... .... .. .... .. .... .. .... ... ... .. .. .... .. .
Less than 63 inches ... .... .. ... ..... .. ...... .. ... ... ... . .. ... . .63 inches .... . ... ..... ..... . .. ... .... ... . ... .. .... . ... .. .. .. .... ... .64 inches .... .. ... .... . .... ... ... .... .... .... ..... . .. ... .. .. . ... . .. .65 inches ..... .. .. .... .. .. .. .. .. . ... .. .. .. .. .... .. .. .... ... . ... ... ..66 inches .... . ... .. .... ... .... .... . ...... . . .. .. .. .. . .... . .. .... .. . . .67 inches .... .. ... .... .. .. .. ... ... .. .. ... . . ... .. .. .. .. .... .. .... .. ..68 inches .. ... .. .. . ... .. .. .. ... .. . . .. .. .... .... ... . . ... . ... .. .... .. .69 inches ...... . .. .... ... . .. . ... . ..... .. .. .. .... .. .. .... .. . .... .. .70 inches .... ... .. . .... . ... ..... .. . .. .... . ... .... .. .. ... .. .. ..... . . .71 inches ..... .. .. .... .. .. ..... ... . ...... . .. .... .. .. .. .. . .. ..... .. ..72 inches or more .. . ... .. .. . .. .. . .. ... . ..... . .. .. ... . . ..... .. .
Weight in pounds
TotalLessthan
130- 140- 150. 160- 170- 180- 190- 200 or
130139 149 159 169 179 189 199 more
Number of examinees
1,657
8272
153213218
249239176129
6561
196
27163735262219
7412
144
1013242318
2118
9512
191
1612242827231827
772
261 I 231
14 418 525 1535 4042 3141 3734 4025 2516 19
4 67 9
207
73
14262838392418
46
160
138
15202622252313
4
103
2138
111819
9111011
164
1133
15
233025261918
NOT1; : Ixomined persons were measured with(rut shnes: clothing wei!dlt mnwd from 0.20 to 0.62 oound. which mus not deductedfrom weights shown.
Table IX. Number of women aged 18-24 years by weight for height: United States, 1971-74
Weight In pounds
Height TotalLessthan
11o- 120- 130- 140- 150- 160- 170- 180- 190- 200 or
110119 129 139 149 159 169 179 189 199 more
I Number of examinees
Total .. . .. ..... . .. ... .... . ... .. . .. . 1,524 236
Less than 59 inches .. .. .... .. . . .... .. . 36 1859 inches .. ... .. .. .. .... .. .. ..... . ... ... .... 38 1560 inches .. ... ... .. . ..... ... .. .... . ..... ... . 81 2261 inches .. ... .... .. .. .. .... .. ... .. .. . .. .. .. 125 3962 inches .. .. ... .. .. ...... ... ... ... .. .. .. ... 197 5063 inches .. ... .. .... .... .. .. ..... .. .. ... .. .. 248 4564 inches .. .. .... ... ... . ... ... .... .. . .... .. . 245 2565 inches .. . .. .... .. ... ..... . .. ..... ... . .. .. 224 1766 inches .. .. ..... .. .. ..... . ... .. .... ... . ... 142 267 inches .. . ..... ... .. .... .... .... .... . .... . 93 268 inches or more .. . .... . ... ... . ... .. . 95 1 E
290 272 261
6 4 49 3 6
19 14 729 17 1549 36 1946 43 4450 48 4743 42 4922 37 2611 12 23
6 16 21
156 93 71 45 2? 24 49
1 1 - 2 - - -2 - 3 - . - -7 2 2 6 - 2 -7 2 4 1 3 5 3
16 8 5 3 4 - 726 12 9 5 4 4 1024 14 11 12 3 4 722 22 8 4 3 3 1117 11 8 7 3 4 514 10 10 3 4 1 320 11 11 2 3 1 3
Nol”lt: I!xumincd persons were meusured without shoes: clothing weight runxed from 0.20 to 0.62 pound. which was not deductedfrom weights showII.
49

Table X, Number of women aged 25-34 years by weight for height: United States, 1971-74
Height
Weight in pounds
TotalLessthan
11o- 1120- 130- 140- 150- 160- 170- 180-
110119 1’29 139 149 159 169 179 189 I
—190- 200 or199 more
Number of examinees
Total . . . .... . .. . 1,896 63 35
2
364
12
314
117229 274 343 304 190 143 99 99
Less than 58 inches ... . ... ..... . .. . .58 inches .. .. ... ... .. .. .. .. .. .. ...... .. . . ...59 inches ... .. ... ... .. ... ..... .. . .. . .. .. .. .
60 inches . . .... .. .. .. .... .. .. . ... . ... . ...61 inches .. ... . . . .62 inches .. .. .. .. .. . . .. .. .. . .. ...... ..63 inches ... . ... .. .. .... ... .. ... .. .. .. .. ..64 inches .. .. .... .. .. .. .. .... ...... .. .. .. ...65 inches .. .... . .. . .... .. .. .. .... .. .66 inches .. .. .. ... .. .... .. .. .. .. .... . . .. .67 inches ..... . .. ... .... . ... .. . . .. .. . . ...68 inches or more . .. .. . . . .
172643
74205279308272269180114109
6121518483742
2716
8
538
16365453423119
43
238
123856545252341814
124
11263948
3960302420
1314
1024363223201620
21
1101515101317
87
22
6141518172519
916
136
14151211121114
12675
1312
5
84
118
1218162315
1211
NOTlt: I:xumined persons were measured without shoes; clothing weight ranged from 0.20 tu 0.62 pound, which was not deductedfrom weights shown.
Table Xl. Number of women aged 35-44 years by weight for height: United States, 1971-74
Weight in pounds
Lessthan
11o- 120- 130- 140- 150- 160-
110119 129 139 149 159 ‘169
Height Total
190-199L170- 180-
179 189200 ormore
167
——
Number of examinees
Total .. ...... . . .... . ... . . . ....
Less than 58 inches . .... .... ... ... ..
58 inches ... .. .. . ... .. .. ..... . ... . ... .. .. ..59 inches .. ... ... .... . .. ... .... . . ..... ..... .60 inches ... . ... . .. .. . . . . . .. .. . .. .. .61 inches .. . . . .. . . .. . . .... . . ... .. .62 inches ... .. .. . . . .... .. . . ... . . . .. .. . .63 inches .. .. .. . .. .. ... . .. .. . . . ..64 inches ... .... .. .. . .. .. .. .. .. . ... . ..65 inches .. . . .. ... . . . ... .. .. . .... .. ..66 inches ... ...... . .. . ....... ... .. ...... . . ..
67 inches .... .. ... .. .. ....... . .. .. .. .. .. ..68 inches or more . ... .. . . . .... . . ..
1,663 101 177
16 3 421 4 465 15 6
100 11 23147 26 26208 15 27245 13 22
264 7 35255 5 17147 2 9
94 - 3101 - 1
256 27: 111 76 46
12
1220224544
31342117
7
3
31110243444
59432413
9
135
13172728
2330211516
111369
20
211812
514
2
236
1211
102010
58
111226
121618
7
37
1445
1420
2634221522
278
111319
2830151516
1326
12
86431
N()’I’l; : Itxumined ~)crsons wcrv mtusurcd without shoes: !clothing weight ran@ i’rom 0.20 to 0.62 pound, which was not deductedfrom weigh ts shown
50

Table X II. Number of women aged 45-54 years by weight for height: United States, 1971-74
Weight in pounds
Height TotalLessthan
11o- 120- 130- 140- 150- 160- 170- 180- 190. 200 or
110 119 129 139 149 159 169 179 189 199 more
Number of examinees
836 52 130 112 90
I48 43
12-4 65 46 49 2
10 114 44 43 41 3
34 I 64Total ...... . .. .. .... .. ... ...... ... . 114 76
Less than 58 inches .. ..... .. .. .. .. ... .58 inches .. .. .. .... .. .. .. .. ... . .. ...... .. .. .59 inches .. ... .. .. .... . . .. ... . .... .. .. .. ....60 inches .. .. . ... .. ... ..... .. .. ... .. ... . ... .61 inches .. .. .... .. .... .... .. .. ... ... ... .. ..62 inches .. .. .... .. .... . ... ... ... .. .. .. . .. ..63 inches ... ..... . ..... ... .... .. . ..... . ... ..64 inches .. . .. .. .. .. ..... . ... .. .. .. .... .. .. .65 inches ... ... .. ... . ..... .. .. ..... ... .. ... .66 inches .. . ..... ... . ...... .. .. ... .... . .. ...67 inches ... ..... .... .. .. ... . .. .. .. ... ... . ..68 inches or more .. .. .. .. .. .... . .. ... .
87
345994
138126135
104713228
23
1149
716231
2145
1226162214
732
1 1 1
526
71141412
632 1
11
1 43 47 52 108 9
5 11
3 73 42 8
38
16201721
910
52
63
121115
71513
53
1015191924
2114
25
NOTli: Exmnined persons were mursurt’d !vith{)ut shoes: ck)thinx weight ranged from 0.20 to 0.62 Pound. w’hich ~sas not dwluctcdfrum ~veights sho~vn.
Table X111. Number of women aged 55-64 years by weight for height: United States, 1971-74
TotalLess
than11o- 120-
110119 129
Weight in pounds
EIEIzIE
Number of examrnees
Height
170-
1180-
1190-200 or
179 189 199 more
Total .... ...... .. .. .... .. .. ...... .. 670 52 51 72 103 74 4892 62] 54
IT33 29
1-1-
13 47 24 46 66 53 32-
13
Less than 58 inches .... .. .. .. . .... . ...58 inches .. .. . .... ....... .. .. .... .. .. .... .. .59 inches ..... . .... ..... .. ... .... .. ... .. ....60 inches ... . .... .... .. .. ... .... .. . ....... . .61 inches .... . . .. .. . ... . ... ..... .. .. . .... . ..62 inches ..... .. .. .. ..... . .. . ..... .... .... . .63 inches .. ... . .. .. .... . .. ... ... . .... ..... ..64 inches .. .... . ..... .. .. .. ...... .. ... ... . ..65 inches ... ... ... ...... . . .. .... ... .. .......66 inches ..... .. ...... .. .. ..... ... .. ... ... ..67 inches .. ... ..... .... . .. .... .... .. .. . .. . ..68 inches or more .. ..... ... ... .... .. ..
191843
6399
104
96102
71291313
6528865542
1
13568
10
5751
245
61120
311
3421
619
111318
1414
7541
11
!09
1214131217
21
2
26
149
1612
93
112
7 16 4
12 98 66 118 108 54 21 22 2
11
35
1112
7422
Nc)’I’1{: lixaminecl persons were metisured withuut shoes: clothing \\eigl]trunpcd t’rwn 0.20 to 0.62 L)otmd. v.hjch !tus not dcductudfrom weights shown.
51

Table XIV. Number of women aged 65-74 years by weight for height: United States, 1971-74
Height
Total . ... ... .... ... . ..... . .... .
Less than 58 inches . .... .. . . .. .. .. .58 inches ... ... .. . .. .... .. . . .. .. .. ... .59 inches .. . . .. .. .. .. .. .. ... ... .. .. .. .. .. .60 inches ... . .. .... .. ... .. . ... ... . .. .. ......61 inches .. . ..... .. ... .. .. .... .. .. . ... .. ...62 inches ... ..... ... .. .. .. .. . ... . .... .. ... .63 inches .. .. .. .... .. .... .. ...... .. .. .. .. .. .64 inches .... . .... . .. .... .. .. .. ... . .... . .65 inches .. .. .. ...... ... . .. .... ..... . .. .. ...66 inches or more ... .. .. .. .. .. ... ... ..
Weight in pounds
TotalLess
than11o- 120- 130- 140- 150- 160- 170- 180- 190- 200 or
110 119 129 139 149 159 169 179 189 199 more
Number of examinees
I1,822 160
78 1773 16
115 21242 31300 28316 22274 10182 12138 3104 -
170
17111233343022
641
222
119
21314546311212
4
268
12111533395448281810
257
67
1433454238292023
1921 179
L6 4
10 25 9
19 2430 2235 3035 2422 3219 2011 12
139
238
15222028131513
83
22378
13141412
8
62
1~36
12;I
11668
90
410151713
89
14
NOTI{: I{xtimined persons were measured withnut shnes: clothing weight ranged from 0.20 to 0.62 pound, which was not deductedt’rnm \veigllts shown.
Standard Errors
The probability design of thcsl~~~l~)~~ni~blc!;the estimation of standard errors to corrmponcl
to the weighted estimates presented. Thestandard error is primarily a measure of samplingvariability, i.e., the vari~tions that might occurby chance because only a sample of the popula-tion is surveyed. As calculated for this report,
the standard error also reflects part of thevariation which arises in the measurement
process. It dots not include estimates of anybiases which might lie in the data. The chmccs
arc about 68 out of 100 that an estimate fromthe sample would differ from a cornpletc censusby less than the standard m-rot-. The chances arcabout 95 out of 100 that the diffcrcncc wouldbe lCSS than twice the standard m-or and about99 out of 100 that it would be Icss than 2?/2
times m Iargc.Estimates of standard errors are obtained
from the sample data and arc subject tu samp-ling error when the number of cases in a CC1l is
small, or cwcn occasionally when the number ofcases is substantial.
Estimates of the standard errors for selectedstatistics used in this report arc presented in
tiablcs 2 and 3. These estimates have beenprepared by a replication technique thqt yieldsovm-a]l variability through observation +of varia-
bility among random subsamples of the total
sample. Again, readers are reminded that theseestimated standard errors do not reflect anyresidual bias which might still be present afterthe attempted correction for nonresponse.
Small Categories
In some tables, magnitudes arc shown forCC1lS when the sample size is so small that thesampling error may bc several times as great asthe statistic itself. In such instances the statistichas no meaning except to indicate that the truequantity is small. Such numbers, if shown, havebeen included to explain the overall story of thetable.
Regression Estimates
For the purpose of smoothing the samplefindings in the present study to make estimates
within certain cells where the number ofcxaminccs of a given agc and height was toosmall to produce sufficiently reliable data, Iincar
52

regression equations of the form
~= a+ b.Yi
for predicting wcig-ht (y) in pounds from height(x) in inches were fitted by the method of least
squares to each of the 12 age-sex groups in thesample of cxaminecs. The constants–regression
coefficient (b) and I’-intercept (a)–in the
regression equations arc then of the form
.—Z.Yi l-i ‘- ~.YY
b=z (x?) – YL(X)2
where F and ~ arc the mean values of x tind y,respectively.
The regression coefficient, estimating the
slope of the regression line, here measures the
avcroge number of pounds increase in weightwhich occurs with each inch of increase inheight.
The goodness of fit of these regression lines
to the obscn~ed data is determined by the usLu.Ll
standard error of estimate formula
[1~(]’i _ pi)2 ‘k
sy.x = n—2
which indicates how WCI1 the estimated weightvalues from the regression equations, Y, agree
with the actutil observed weight WLILLCS,y.The resultant estimates of the constantsdctm-mined fur the regression equations for the
12 age-sex gr[mps and the standard m-or are
shown in table .XV. To measure the precision ofthe regression cqualion the sum of squares ofthe observed VJIUCS of wci,ght }“i abotlt th~
mean 7, X( I-i -- ~)2 is considered. It can be
shown - j7)2 = ~(]’ithat X(l’i Fi)2
+ ~(yi – r)z ( }’i = luluc of weight pre-
dickxi b~’ the regression cqltation) or where
‘(]’i Fi )2 = sum i~f square-s about regression
and rcprcscnts the variation uncxplainccl by the
NOTE: A Iist of references follows the text.
~(~i – 7)2 = sum of squares dtlcto regression
represents the variation explained by theregression iinc. CIearIy it is desirable to have
Z(Pi – F)2 closeequivalently to have A>2 =
~(yi – F)2
to unity. .R2 defined abo~’e is called the
coefficient of determination. The closer R2 is tounity, the more prccisc the rc~~ession equation.
Although linear regression equations wereused to estimate the basic weight-height relation-
ship in a previous h’CHS report,2 the distribu-tion of weiyht by height might bc fitted by a
Iog-w-ithm of Ivcight. In their series of ~vcight-height data on .4rmy personnel, I<w-pinos7 andRoscnbaums f(}und that the test for linearity ofregression of tveight by height sho~vcd a signifi-
cant departure of the array means from line-arity.
In this report, linear regression equations
were calculated to estimate \veight from height.
Similar calculations were made using logarithmsof ~veight mthcr than the arithmetic ~vci~htmeasurements in relation to arithmetic height
mmsurcments. For each age find scx group, theline rcprcscnting the equation of arithmeticwei~ht by height nearly coincides with thatrcprcscnting the equation of Ioglo wcigllt by
height (fisurcs I and H).The c(wfficicnts of correlation obtained
from the regression cqutitions dm-i~’cd by corrc-Iatinx the Io%arithms of \vcight ( IOS1~ y ) in
pounds ti’ith actLKd hcixht (x, in inches) ~vcrc
slightly dilfcrcnt from thmc obtained from thelinear rclntionship of ~vci~ht to height
(table XV). Iirhcrc di[fcrenccs in thmc esti-mates exist, they m-c small md coulci bc
attributed to samplins errcn-.The ~vcisht b]’ height rclatiunship 01 data
from lIAATI;S appears to bc a ~o{)d linear fit\vithin the limits of 62-74 inches for mcn :md57-68 inches for women. Thmc limits may~ccount Ior the C1OSC fit bctw’ecn the t~vo
equations. 11’eight data from Karpin{)s’ were formen ages 18-37 years Ivith hcixhts 0159 tu 78
inches. Ctn-res])fmding data from Rt)senbaums
53

240
F
1824 YEARS
220
I200 /-- —y ,, +,).
240
F
3544 YEARS
220
120
100 [
240 r 5564 YEARs
220 LI
120
100 [
,~J62 64 66 68 70 72 74
HE I(; H1 IN INCHES
240
220
200
180
160
140
120
100
0
240
220
200
180
160
140
120
100
.,
0
240
220
200
180
160
140
120
100
:0
2534 YEARS
/
I I I I I I I I I I I I I62 64 66 68 70 72 74
4554 YEARS
I I I I I I I I I I 1 I I
62 64 66 68 70 72 74
6574 YEARS
‘-Y5----[ I I I I I I I I I I J
62 64 68 68 70 72 74
HE IGHT IN INCHES
Figure 1. Average weights of men by age and height estimated from regression equations for weight (y) and hei~ht (x): y = a + bx and
Iogloy = a +bx: United States, 1971-74
54

;20
100t
1E24YEARS
>0 1 I I I I I i I i I 1
57 wJ
61 63 65 67
240r 3544YEARS
220t
2001-
1,,,,,,,,,,,,:~w
0 57 59 $31 63 65 67
240r 5564YEARS
Jo 1 I i I I i I [ I I
57 59 61I
63 65 6?HEIGHTINIMx4ES
240
1~
2X?4YEA,%
200
18Q
160
-*-e--WI
120
240
220
m
I
4554YEARS
mo/-
100 1-J’
of 1 1 { I ( 1 i I 1 I57 B 61
163 65 6?
24CI
r
6574VE2+nS
22tlt
Xm
12?0[
JFigure 11.Average weights of women by age and height estimated from regression equations for weighr (y] and height k}: y = a + b.t and
Iogla y = u + tvc: United States, 1971.74
I
I
55

Table XV, Coefficient of correlation, constants for regression equations, and standard error of estimate of weiqht (Y) on heiqht (x) of
adults aged 18-74 years: United States, 1971-74
Sex and age
Linear
Regression equation
Y=a+bx
-172.63 + 4,842x-168.67 + 4,941x-187.49 -t 5,277x-131.83 + 4.454x-173.99 + 5.069x-131,64 + 4.385x
-56.28 + 2.965x-88.62 + 3.587x-94.02 + 3.815x-77.17 + 3.587x
-68.24 + 3,492x-76.38 + 3,583x
sY .x
27,330.527.428,428.526.0
28.032.135,033,833,429.0
Coefficient ofcorrelation
r
.438
.420
.460
.390
.426
.404
.259
.263
.270
.246
.249
.285
Semilogarithmic
‘egressioneq~Ioglo Y=a+bx
1.32 + .0127x1.39+.0121x1.34+ .0131X1.46 + .01 13x1.35 + .01 28x1.42 + .01 17x
1.48 + .0099x1.43 +. OIIIX1,46 + ,01 tOx
1.51 + ,0104X1.56 + ,0097x1.47 +. OIIIX
+
.0303
.0268
.0264
.0272
.0289
.0249
.0255
.0253
.0257
.0259
.0259,0251
.459
.445
.474
.401
.435
.404
.297
.292
.295.270
.254
.301
WI.Stat, Assoc. 411-414. 1971.NOTE: a = intcrccpt in ;cgrcssiorr cquati;ri.
b = rcwcssion coel’1’icicnt.r = Cocfficicnt of corr(,l ation.
SY.x = standard crr(w of estimate.
wcw ~vaikhlc [or mcn ages 18-40 years with the regression of weight by height as Iinem-. Thishei~h~s rangi]lg lrom 59 inches and under to 77 method smooths the findings from HAN’F. S andinches and over. simplifies the job of’ comparing this report with
Since thu-c is little chmge when using the other data series reports that are based onscmilo:w-ithrnic cc~uation, this report treated height-weight relationships.
56
*U.S. GOVERNMENT PRINTING OFFICE : 1979 0-281-259/33

VITAL AND HEALTH STATISTICS Seriw’
Scrie.r 1,
SOies 2.
.!+ries 3.
Scrit..s 4
Stries 1().
.~ori(x ]1.
.<4,ri,,i 1.?.
.Wries 13.
SCrics 14.
Serie.< 20.
Series 21.
Series 22.
Scrik,s 23.
Programs and Collection Procedures. – Reports which describe the general programs of the NationalCenter for Health Statistics and its offices and divisions and data collectiori.metfmds used and includedefinitions and other material necessary for understanding the data.
Data Evaluation and Methods Research. –Studies of new statistical m@irodology including experi-mental tests of new survey methods, studies of vital statistics collec$ofi: metftods, new analyticaltechniques, objective evaluations of reliability of coIlected data, and contributions to statistical theory.
.4 na[ytical Studies. –Reports presenting analytical or interpretive studies based on vital and healthstatistics, carryin~ the wudysis further than the expository types of reports in the other series.
Docu mcnts and COm mittcc Reports .- Final reports of major committees concerned with vital andhealth statistics and documents such as recommended model vital registration laws and revised birthand death certificates.
Data Fro m the Hea[th Interuiew Suruev. –Statistics on iIlness. accidental iniuries. disability. use ofhuspital, medi(.il, dental, md other servi~es, and other health-related topics, afi based on data ~ollectedin a continuing rmtional household interview survey.
l){fta fir,,m th t Health Examination Survey and the Health and Nutrition Examination Survey. -DataiYom direct examination, testing, and measurement of ~national sampks of the civilian noninstitu-tion.dized population provide the basis for two types of reports: (1) estimates of the medically definedprev.dencc of specific diseases in the United States and the distributions of the population with respectto physical, physiological, and psychological characteristics and (2) analysis of relationships among thevarious measurements without reference to an explicit finite universe of persons.
Ikfu }’r(,m th, Institutionalized Population Surveys. -Discontinued effective 1975. Future reports fromthese surveys will be in Series 13.
Data on Health Resources l~tilization. –Statistics on the utilization of health manpower and facilitiesproviding long-term care, ambulatory care, hospital carp, and family planning services.
Data on Health Resources: ,}fanpo wer and Facilities. –Statistics on the numbers, geographic distri-bution, and characteristics of health resources including physicians, dentists, nurses, other healthoccupations, hospitals, nursing homes, and outpatient facilities.
Data on Mortality. –Various statistics on mortality other than as included in regular annual or monthlyreports. Special analyses by cause of death, age, and other demographic variables; geographic and timeseries analyses; and statistics on characteristics of deaths not available from the vital records based onsample sumeys of those records.
Data on Natality, .}larriu~,,, ant{ Diz,orcc. –Various statistics on natality, marriage, arsd divorce otherthan m included in regular annual or monthly reports. Special analyses by demographic variables;geographic and time series analyses: studies of fertility; and statistics on characteristics of births notavailable from the vital records based on sample surveys of those records.
Data From the .Vational ,Uortality and .Vata[ity Survey s.–Discontinued effective 1975. Future reportsfrom these sample surveys based on vital records will be included in Series 20 and 21, respectively.
Data Fro m thr A’ational Surrey of Family Growth. –Statistics on fertility, family formation and dis-solution, family planning, and related maternal and infant health tODiCS derived from a biennial survev.of a nationwide probabili~ sample of ever-married women 15-44 years of age.
–.
For a list of titles of reports published in these series, write to: Scientific and Technical, Information BranchNational Center for Health StatisticsPublic Health ServiceHyattsville, Md. 20782
—

NCHSU.S. DEPARTMENT OF HEALTH, EDUCATION, ANO WE LFARE POSTAGE AND FFESPAI[)
Public Health S8wiaOffIm of Health R-h, Smiaks, d Tafmw
LS OtPAWTMENT O, HE &
Naticml Catw for NnNh Smsiaia3700 Em-west Highwmy *EW :,.
Hyatlw,lla, Mawlmd 20~2THIRD CLAS
OFFICIAL BUSINESSPENALTY FOR PRIVATE USE, S3111
D*U. S.MAIL
I Fy pubhcatmm i. dmVia) and Health S;.ttrttc,Sam ‘d 301436NCHS. I