Weight for Height BPK 303 Summer 2015. Desirable Body Weight Desirable, ideal, optimal “What...
24
Weight for Height BPK303 Summer 2015
-
Upload
alvin-luke-robertson -
Category
Documents
-
view
220 -
download
0
Transcript of Weight for Height BPK 303 Summer 2015. Desirable Body Weight Desirable, ideal, optimal “What...

Weight for Height
BPK303
Summer 2015

Desirable Body Weight
Desirable, ideal, optimal “What weight should I be?” Weight for height Weight for height with frame size Weight with optimal % body fat BMI - Body Mass Index

Weight for Height
Epidemiologists needed a measure of obesity
Often questionnaire data on height and weight alone
“Ideal” and “Desirable” Weight tables Metropolitan Life Weight for Height Tables

Weight for Height Tables
Metropolitan Insurance Co., 1983, weights at ages 25-59 based on lowest mortality.
Weight in pounds according to frame (in indoor clothing weighing 3 lbs., shoes with 1" heels).

Frame Size
Estimate of Skeletal Proportion
KIN-Scale proportional breadths & widths represent a detailed appraisal of
frame size
Range of Humerus Width (cm) for Medium Frame Size by Height group

Weight for Optimal % Body Fat
If you know the current % body fat, weight for any optimal % body fat can be calculated.
Consensus of an expert panel (1986).
Arbitrary cut-off points.

Calculation of optimal weight range
1. Calculate Fat Weight (FW) FW = body weight x Ft
Where Ft = fractional expression of % body fat
2. Calculate Fat-Free Weight (FFW) FFW = Body Weight – FW
3. Calculate the desired target weight (TW)
TW = FFW / (1 – Fx)
Where Fx = fractional expression of % body fat

Assumes no change in FFM as Body Fat changes
Not recommended since based upon a % Fat with considerable error in individual estimates (SEE = 3.7% Fat)
8
Calculation of optimal weight range

Body Mass Index(Quetelet Index - 1833)

Quetelet (1833)
Tall adults are more linear than short adults. Fully developed individuals: the weight of an
individual at different heights is related to the square of the stature:
[WT] = HT2
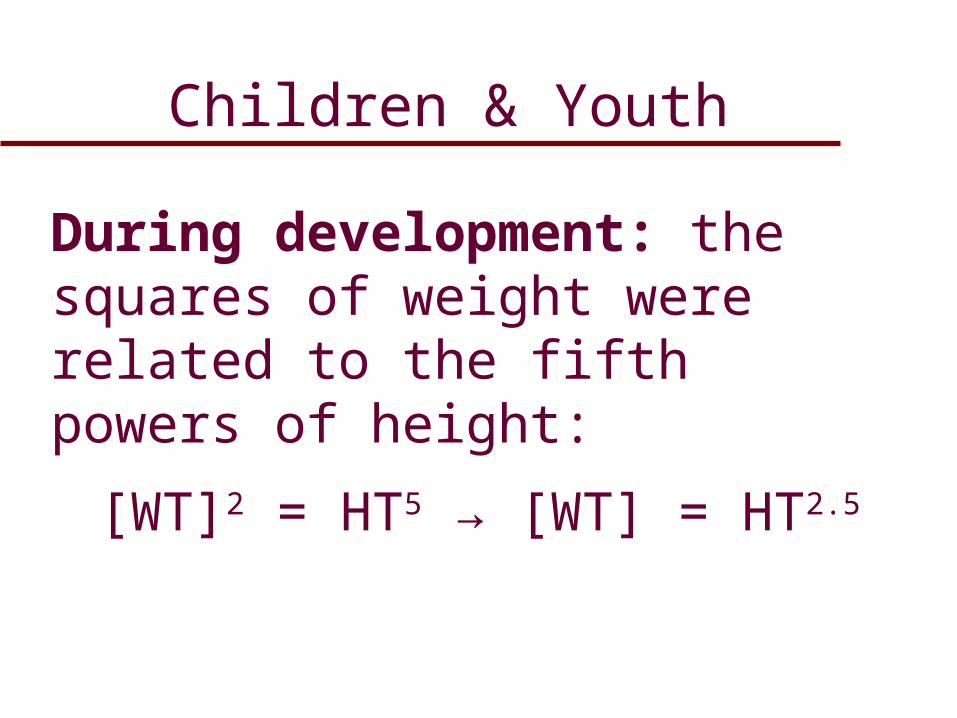
During development: the squares of weight were related to the fifth powers of height:
[WT]2 = HT5 → [WT] = HT2.5
10

Canada Fitness Survey (1981)
(20-29 years old)
WT/HT BMI WT/HT3 WT/HTb
Females b=1.549
Weight 0.967 0.861 0.706 0.918
Height 0.144 -0.127 -0.369 -0.005
S 5 SF 0.805 0.821 0.781 0.821

Correlational Analysis of Weight (WT) and Height (HT) indices in a sample of SFU Kin 303 students (aged 18–25 years)
12
Males (b=1.660) WT/HT BMI WT/HT3 WT/HT1.66 HT Height .22 -.13 -.44 -.01 -- Weight .95 .78 .55 .85 .51 Sum of 6 Skifolds .52 .57 .56 .56 -.11 Skinfold-adjusted Arm Girth relaxed .72 .67 .56 .70 .14 Skinfold-adjusted Calf Girth .54 .44 .30 .48 .29 Humerus (elbow) Width .47 .28 .07 .35 .55 Femur (knee) Width .56 .41 .23 .47 .46
Females (b = 1.906) WT/HT BMI WT/HT3 WT/HT1.906 HT Height .38 -.04 -.50 .00 -- Weight .95 .72 .37 .75 .66 Sum of 6 Skifolds .49 .49 .40 .49 .10 Skinfold-adjusted Arm Girth relaxed .436 .40 .30 .40 .13 Skinfold-adjusted Calf Girth .43 .35 .21 .36 .24 Humerus (elbow) Width .50 .29 .02 .31 .56 Femur (knee) Width .66 .46 .19 .49 .54
Ward R, Anderson G. 2012 (unpublished)

Sum of 6 Skinfolds vs BMIKIN-Scale Males and Females
13

Ross et al. 1988
Correlations of BMI are “good” with sum of skinfold corrected-girths and even bone widths
Correlations of BMI with sums of selected anthropometric measures (Canada Fitness Survey 1981)
Sum of 5 Skinfolds
Sum of corrected Limb Girths
Sum of Bone Breadths
Males 0.67 0.56 0.36
Females 0.72 0.48 0.42

Correlational Analysis of Weight (WT) and Height (HT) indices in a sample of SFU Kin 303 students (aged 18–25 years)
15
Males (b=1.660) WT/HT BMI WT/HT3 WT/HT1.66 HT Height .22 -.13 -.44 -.01 -- Weight .95 .78 .55 .85 .51 Sum of 6 Skifolds .52 .57 .56 .56 -.11 Skinfold-adjusted Arm Girth relaxed .72 .67 .56 .70 .14 Skinfold-adjusted Calf Girth .54 .44 .30 .48 .29 Humerus (elbow) Width .47 .28 .07 .35 .55 Femur (knee) Width .56 .41 .23 .47 .46
Females (b = 1.906) WT/HT BMI WT/HT3 WT/HT1.906 HT Height .38 -.04 -.50 .00 -- Weight .95 .72 .37 .75 .66 Sum of 6 Skifolds .49 .49 .40 .49 .10 Skinfold-adjusted Arm Girth relaxed .436 .40 .30 .40 .13 Skinfold-adjusted Calf Girth .43 .35 .21 .36 .24 Humerus (elbow) Width .50 .29 .02 .31 .56 Femur (knee) Width .66 .46 .19 .49 .54
Ward R, Anderson G. 2012 (unpublished)

16
Table 5-5: Correlations of Body Mass Index with Height, Weight Sum of Six Skinfolds (S6SF), Sum of Four Skinfold-adjusted Girths (SumMuscle) and Sum of Humerus and Femur Widths (SumBone) in KIN-Scale data.
BMI Height Weight S6SF SumMuscle SumBone
Male n = 230 0.040 0.852** 0.698** 0.328** 0.353**
Female n = 336
0.048 0.852** 0.689** 0.372** 0.518**

Percentage body fat as measured by dual-energy X-ray absorptiometry (DXA %fat) versus BMI and 1/BMI in women from 3 study sites combined. Reproduced from Gallagher (2000)
17

Percentage body fat by dual-energy
X-ray absorptiometry
(DXA %fat) versus 1/BMI
by sex for each of the study sites.
Reproduced from Gallagher (2000)
18

Predicted percentage body fat by sex and ethnicity
based on 4-C percentage body fat
19
Women Men
Age and BMI African American Asian White African
American Asian White
% % % % % %
20–39 y BMI < 18.5 20 25 21 8 13 8 BMI ≥25 32 35 33 20 23 21 BMI ≥30 38 40 39 26 28 26 40–59 y
BMI < 18.5 21 25 23 9 13 11 BMI ≥25 34 36 35 22 24 23 BMI ≥30 39 41 41 27 29 29 60–79 y
BMI < 18.5 23 26 25 11 14 13 BMI ≥25 35 36 38 23 24 25 BMI ≥30 41 41 43 29 29 31
Children & Youth
20
During development: the squares of weight were related to the fifth powers of height:
[WT]2 = HT5 → [WT] = HT2.5

B-values of height predicting weight in yearly age groups for Canada Fitness Survey (CFS) and Coquitlam Growth Study (COGRO) boys and girls
21
1
1.5
2
2.5
3
3.5
7 8 9 10 11 12 13 14 15 16 17 18
Age Group (years)
b-v
alu
e
CFS Boys
CFS Girls
COGRO Boys
COGRO Girls
22
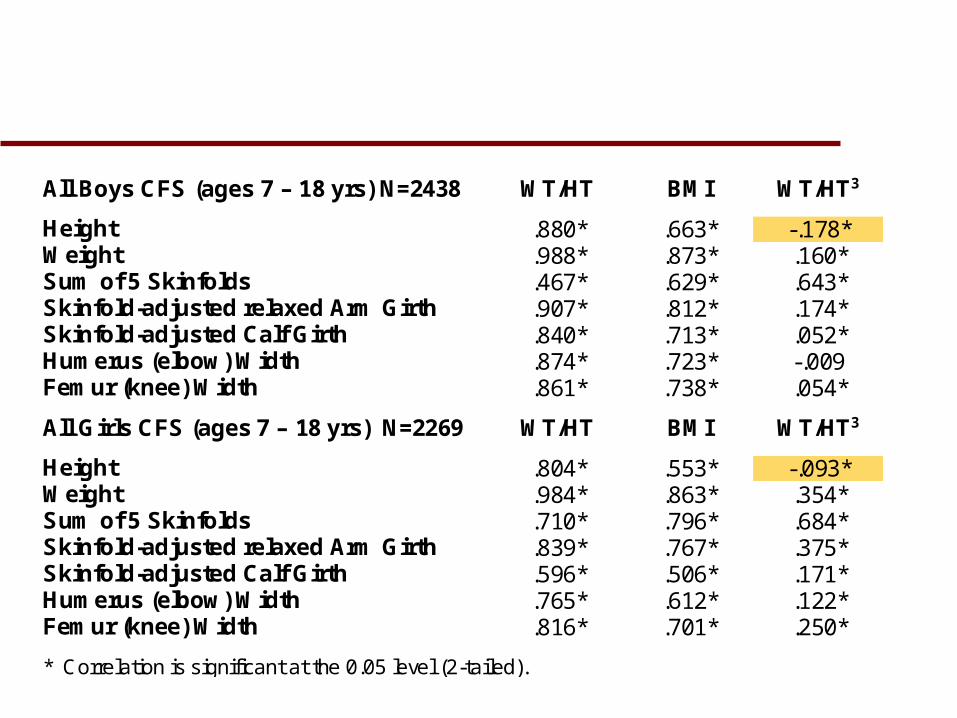
All Boys CFS (ages 7 – 18 yrs) N=2438 WT/HT BMI WT/HT3
Height .880* .663* -.178* Weight .988* .873* .160* Sum of 5 Skinfolds .467* .629* .643* Skinfold-adjusted relaxed Arm Girth .907* .812* .174* Skinfold-adjusted Calf Girth .840* .713* .052* Humerus (elbow) Width .874* .723* -.009 Femur (knee) Width .861* .738* .054*
All Girls CFS (ages 7 – 18 yrs) N=2269 WT/HT BMI WT/HT3
Height .804* .553* -.093* Weight .984* .863* .354* Sum of 5 Skinfolds .710* .796* .684* Skinfold-adjusted relaxed Arm Girth .839* .767* .375* Skinfold-adjusted Calf Girth .596* .506* .171* Humerus (elbow) Width .765* .612* .122* Femur (knee) Width .816* .701* .250*
* Correlation is significant at the 0.05 level (2-tailed).

CDC BMI Growth Charts
23

BMI
BMI is not an indicator of body fat in individuals it is a measure of weight for height
It can be useful as a population screening and awareness device, but not in individual prescription
May be useful used in conjunction with other measures