Weight at Birth and Survival of the Newborn at Birth and Survival of the Newborn ... hazardous...
35
NATIONAL CENTER Series 21 For HEALTH STATISTICS Number 3 VITAL and HEALTH STATISTICS . DATA FROM THE NATIONAL VITAL STATISTICS SYSTEM Weight at Birth and Survival of the Newborn United States, Early 1950 Statistics derived from vital records on neonatal mor- tality by weight at birth and gestation, age, by color and sex, to infants born in the United States during the first 3 months of 1950. Washington, D.C. duly 1965 U.S. DEPARTMENT OF HEALTH, EDUCATION , AND WELFARE Public Health Service . Anthony J. Celebrezze Luther L. Terry Secretary Surgeon Generol
Transcript of Weight at Birth and Survival of the Newborn at Birth and Survival of the Newborn ... hazardous...

NATIONAL CENTER Series 21 For HEALTH STATISTICS Number 3
VITAL and HEALTH STATISTICS.DATA FROM THE NATIONAL VITAL STATISTICS SYSTEM
Weight at Birth and
Survival of the Newborn
United States, Early 1950
Statistics derived from vital records on neonatal mor
tality by weight at birth and gestation, age, by color
and sex, to infants born in the United States during
the first 3 months of 1950.
Washington, D.C. duly 1965
U.S. DEPARTMENT OF
HEALTH, EDUCATION , AND WELFARE Public Health Service .
Anthony J. Celebrezze Luther L. Terry
Secretary Surgeon Generol

This report was originally published in Vital Statistics—Special Repovts, Vol. 39, No. 1 (July 1954). Since the data presented and analyzed in the report are of continuing importance, it has been reprinted in Vital and Health Statistics without change.
. .. .,,, ,,, ,., ,
... , .
Public Health Service Publication No. 1000-Series 21-No. 3
NATIONAL CENTER FOR HEALTH STATISTICS
FORREST E. LINDER, PH. D., Director
THEODORE D.WOOLSEY,Deputy Director
OSWALD K.SAGEN,PH.D.,ysnkmt Director
WALT R.SI,MMONS,MA., statistical Advi~or
ALICEM.WATERHOUSE, M.D.,Medical Advisor ,, JAMES E.-KELLY, Dental AdvijorD.D,S.,
,. LOUISR.STOLCIS,MA,,Executive O@cer
DIV1S1ON OF VITAL STATISTICS
ROBERT D. GROVE, PH. D., Chief
ANDERS S, LUNDE, PH. D., A~irtant Chief
Public Health Service Publication No. 1000-Series 21-No. 3

-----------------------------------------
--------------
---------------------------------------------
-----------------
--------------
-----------------------------------------------------------
--------------------------
-------------------------------------------------
--------------------------------------------------------------------
-------------------------------------------------------
------------------
CONTENTS
Page Introduction--------------------------------
Source of data -------------------------Registration completeness Classification Seasonality Distribution of n?t stated
and gestation.a@m Chance variation
Distributions of live’births Birth weight ------=<------------------Ge#&ien and%iW@ weight
55566
678810
Page Neonatal deaths ---------------------------- 14 ~-fih weight 14
tiestation” 17 Gestation and birth weight--------------- 17
+ttendant at birth 18 Weight distribution and neonatal
mortali~ 19 Single births in hospitals 22 Summary 24 References 25
TEXT TABLES Table Page
A. Percent of live births and neonatal deaths with birth weight a.qd gestation not stated United States, January 1 to March 31, 1950------------------------------------------------ 7
B. Birth weight statistics for single live births, by race, under alternative methods for distributing not stated birth weights: United States, January 1 to March 31, 1950 ---------- 8
c. Percent distribution of live births, by birth weight, race, sex, and plurality United States, January 1 to March 31, 1950------------------------------------------------ 9
D. Percent distribution of live births by weeks of gestation, race, sex, and pluiality: United States, January 1 to March 31, 1950------------------------------------------------ 12
E. Percent distribution of live ,births by birth weight, weeks of gestatim, race, and pku ality: United States, January 1 to Max’ch 31, 1950------------------------------------------------ 13
F. Median weights of live births by weeks of gestation, race, sex, and plurality: United States, January 1 to March 31, 1950------------------------------------------------ 14
\ G. Neonatal gmtality rates by birth weight, race, sex, and plurality United States, January 1 to March 31, 1950--------------------------------------------------------------- 15
H. Neonatal mortality rates by weeks of gestation, race, sex, and plurali~. United States, January 1 to March 31, 1950 17
I. 1Neonatal mortality rates by birth weight, weeks of gestation, and race: United States, January 1 to March 31, 1950--------------------------------------------------------------- 18
J. Neonatal mortality rates by birth weight, weeks of gestation, race, and sex: United States, January 1 to March 31, 1950------------------------------------------------ 19
K. Percent distribtuion of live births and neonatal mortality rates, by birth weight, race, and attendant at birt.k United States, January 1 to March 31, 1950 20
L. Neonatal mortality rates among births in hospitals and not in hospitals, by birth weight, race, and plurality: United States, January 1 to March 31, 1950-------------------- 22
M. Neonatal mor”~lity rates gong single births in hospitals, by detailed birth weight and race: United States, January 1 to March 31, 1950-------------------------------------- 22
3

-----------------------
----------------------- ------------------------ --------------------- -----
4 CONTENTS
Table GENERAL TABLES
1. Live birtheamd neonatal deaths, by birth weight, race, sex, andplurali~ Page
United States, January lto March 31, 1950------------------------------------------------ 26 2. Live births by birth weight, weeks of gestation, race, sex, and plurality:
United States, January 1 to March 31, 1950------------------------------------------------ ‘27 3. Neonatal deaths by birth weight, weeks of gestation, race, sex, and plurality:
United States, January 1 to March 31, 1950------------------------------------------------ 29 4. Live births and neonatal deaths, by birth weight, race, and attendant at birth
United States, January 1 to March 31, 1950------------------------------------------------ 31 5. Live births and neonatal deaths, by birth weight, race, attendant at birth, and
plurality: United States, January 1 to March 31, 195& ------------------------------------- 32 6. Single live births in hospitals and neonatal deaths among this group, by detailed birth
weight and race: United States, January 1 to March 31, .195@------l 33
FIGURES Figure Page
1. Birth weight distribution of “five births: United States, January 1 to March 31, 1950-------- 11 2. Neonatal mortality rates by birth weighk United States, January 1 to
March 31, 195& 163. Neonatal mortality rates among single births in hospitals, by detailed birth weight and race: United States, January 1 to March 31, 1950 ------------------------------------ 23
4. Neonatal mortality rates among single white births in hospitals, by detailed birth weight and specified gestation groups: United States, January 1 to March 31, 1950 ------- 24

Weight at Birth and its Effeat on Survival of the
Newborn in the United States, Early 1950
Sam Shap ire, Cliief of the Natal ity Analysis Branch, and Jeanne Unger, Analytical Statistician
INTRODUCTION
Early infancy has always been an extremely hazardous period to survive. Although great progress has been made in reducing the loss during this difficult period, it has lagged behind the success in later in-fancy. Over the past 35 years, mortality has been cut in half in the first few’ weeks of life, while in the balance of the first year, the rate has been reduced to a fifth of what it was. Today, two-thirds of the infant deaths occur in the neonatal period—i. e., within 4 weeks after birth-and in most of these cases, immaturity is cited by the physician as a factor.
The need for information on the risk of mortality among babies born at different levels of maturity has long been recognized as an essential feature of pro-grams directed at the immaturity problem. Special studies by individual hospitals and by a number of city and State departments of health have contributed greatly to meeting this need. With the addition of items on “birth weight” and “weeks of gestation” to practically all State certificates of birth in 1949, the development of data for other areas and for the nation as a whole has become a practical matter.
This report presents nationwide statistics on birth weight derived from vital records for babies born between January 1 and March 31, 1950, and for neonatal deaths among this group. The information is shown by race, sex, plurality of birth, and attendant at birth. Future reports will present birth weight statistics for broad geographic areas, and will consider the relationship between birth weight and such variables as birth order; age and previous fetal loss of the mother; age at death; and cause of death. The subject of fetal loss will also be considered in relation to neonatalmortality.
Although birth weight is used as the princip~ measure of maturity level at birth, a limited amount of gestation age statistics is introduced in this report. Despite serious errors in the birth record information on gestation age, the data contribute to the int~pr etation of a number of the differentials in mortality experience indicated by the birth weight variable. Improvement in reporting gestation age would greatly broaden the possibilities for investigating, statistically, factors that affc%t the survival of the new-born. That it is possible to obtain reasonably sound series of gestation age data has already been demonstrated by others.
Source of ciata
Matched birth and death records for infants born during the first quarter of 1950 who died”within 28 days after birth were used to obtain the mortality data
shown in this report. The matching ,of these records was incidental to carrying out an unrelated project, the 1950 birth registration test. When the matching was completed, punched cards combining information from corresponding birth and death records were prepared for the infants who died. Data from birth records for children born during January-March 1950. formed the basis for developing the weight distributions present@ and served as the denominators for the mortality rates. Birth and death certificates relating to children born to,.residents of Massachusetts were excluded from all tabulations since this State did not require the reporting of birth weight.
Matching birth certificates were not found for a small proportion (2.4 percent) of the neonatal death records filed. In the white group 2.0 percent and in the nonwhitegroup 4.6 percent of tie deaths, were not matched., With regard to age at death, the proportions of unmatchedcertificates were higher for infants dying at under 1 hour and at 5 through 27 days than at the intervening ages, but this proportion was small in all cases, never exceeding 5.8 percent. The unmatched group was also somewhat biased as to cause of death, there being greater proportions for which the cause was, pneumonia, homicide, or not stated than in the total death group.
In compiling the data for this report, all of the “unmatched:’ deafi certificates were included and a “matching” birth certificate was created for each by using data on the deathcertificates for certain personal particulars. This treatment of the unmatched ~oup was decided upon because of the different procedures followed in the States with respect to obtaining birth certificates for the group. Some States routinely match birth and infant death records and take steps to have birth-records placed on file in those cases where the matching birth records cannot be found. As a result of this procedure, virtually all of the neonatal death records filed in these States are matched. In the other areas, the proportions of unmatched records are generally much greater. Thus, by means of including rather” than excluding all qnmatched death records, a degree of comparability is achieved. This will be of especial significance for a later report where geographic data are shown.
Re@stration completeness
The data in this report are derived from records for registered events (except for the group discussed above). A test of registration completeness for 1950 indicated that practically all (98.6 percent) of the white births and 93.5 percent of the nonwhite were registered. No definitive information is available on the completeness of death registration, but it js
5

6 VITAL STATISTICS-SPECIAL REPORTS
thought to vary generally as birth registration corn-” pleteness. In some instances where infants die immediately after birth, it is probable that neither a live birth nor a death certificate is filed. A number of these infants may be reported as fetai deaths, while others may not be reported at all. This situation is undoubtedly of relatively greater importance at the very low birth weights than at the higher weights, and might lead to an understatement of the proportions of infants at the low weights and also to an understatement of the mortality rates among these children.
Classification
In almost all of the areas, birth weight was re-ported in terms of pounds and ounces. The traditional gram groupings, however, have been used to tabulate and present the data in order to facilitate comparison with the results from other studies of this type. The equivalents of these groupings in terms of pounds and ounces are as follows:
1,000 grams or less = 2 lb. 3 oz. or less 1,001-1,250 grams = 2 lb. 4 OZ.-2lb. 12 OZ. 1,251-1,500 grams = 2 lb. 13 OZ.-3 lb. 4 OZ. 1,501-1,750 grams = 3 lb. 5 OZ.-3 lb. 13 OZ. 1,751-2,000 grams = 3 lb. 14 oz.-4 lb. 6 OZ. 2,001-2,250 grams = 4 lb. 7 OZ.-4 lb. 15 OZ. 2,251-2,500 grams = 5 lb. O oz.-5 lb. 8 OZ.
2,501-2,750 grams = 5 lb. 9 oz.-6 lb. 1 OZ.
2,751-3,000 grams = 6 lb. 2 oz.-6 lb. 9 OZ. 3,001-3,500 grams = 6 lb. 10 oz.-7 lb. 11 OZ. 3,501-4,000 grams = 7 lb. 12 oz.-8 lb. 13 OZ. 4,001-4,500 grams = 8 lb. 14 OZ.-9lb. 14 OZ. 4,501 gmms or rmre = 9 lb. 15 oz. or more
The birth records for 1950 in all but a few of the Stat es requested gestation age information in the following form: “Length of pregnancy -weeks.” In practice, period of gestation is generally interpreted as referring to number of completed weeke that have elapsed between the first day of the last menstrual period and the date of birth of the child. At the present time, important inaccuracies due, in part, id failure to carry out this computation are evident in the data reported. These are described in a later section.
For purposes of classification, infants weighing 2,500 grams or less at birth have been referred to as “immature” or “premature.” This weight criterio~ was recommended by the American Academy of Pediatrics in 1935, and later adopted in the Sixth Revision of the International Lists of Diseases and Causes of Death (1948). The term “premature,” although containing the concept of duration of pregnancy, has been used for many years in connection with the birth weight criterion. In units of gestation age, it relates to pregnancies of less than 37 completed weeks. It is recognized in using these terms,
.
that there may be basic differences in physical development for some of the subgroupings of births discussed, which would affect the general applicability Of the criterion for classifying births as immature or premature.
Seasonality
The proportion of children weighing 2,500 grams or less in the first 3 months of 1950 (7.4 percent) is slightly smaller than that for the year as a whole (7.6 percent).1 The full weight distributions of white and nonwhite births included in the study cliffer somewhat from the distributions expected on the basis of data for the year as a whole. Although these differences are statistically significant (P <.001), they are of small enough order of magnitude not to distrub the relation-ships discussed in the report.
There are also differences between the’ neonatal mortali~ rates for the entire year and the rates among births in January through March of 1950. Here too, however, the differences are very small. For all races combined, tie rate for the United States for the year is 20.5 per 1,000 live births, while for January through March the rate is 19.9 for the United States and 20.0 for the United States excluding Massachusetts.
Distribution of not stated birth weights and gestation ag~
It was apparent from the data that birth weight reporting was less complete for infants born at early gestation ages than at a more advanced stage of the pregnancy cycle. To reduce this bias, gestation age information was used to distribute the groups that had no weight statements.
Not stated birth weights were allocated by first distributing the not stated weights among neonatal deaths in each gestation group according to the distribution of the “known” weights in that group. The remainder of the not stated neonatal deaths which lacked information on period of gestation was then distributed by weight according to the weight distribution for all other neonatal deaths.
For births, the group referring to’ children who died during the neonatal period was distributed as indicated above. The residual was allocated using the relationship of gestation and birth weight for the remaining group of births.
For both births and deaths the not stated gestations were distributed proportionately within each weight group where this item was stated and according to the over-all distribution if weight was not available.
lThe data for the first 3 months exclude births
to residents of Massachusetts while those for the year as a whole exclude births to residents of both Connecticut and Massachusetts. However, this difference does not affect the conclusion.

---------------------
---------------------------------------------------
---------------------
-------------------------------------------
Vol. 39, No. 1 WEIGHT
Table A gives the proportions uf birth weights not stated among births znd neonatal deaths by race and plurality. The percentages af births and deaths that had no statement of either weight or gestation age are also indicated.
Various methods for distributing the not stated birth weights were applied to the data in an effort to evaluate the effect of clifferent treatments of this group. It was found that the relationships discussed in the main body of the report were not altered by the choice of procedure. Results in terms of percentage distributions and mortality rates under each of four procedures (including the one used throughout this re-port) are shown in table B together with a description of the method. It will be noted that the clifferenc es in the statistics obtainedunder alternative procedures are relatively small.
Despite the fact that a reasonably sound basis existed for distributing the “not stateds, ” the reader is cautioned not to draw conclusions from relatively small differences in view of the fairly large size of this group. An exception to this would be a $eries of small differences which were sll in the same direction.
Chsnce variation
Chance variation, in addition to the biases in re-porting already discussed, must be considered in evaluating the data shown. This variation is related to the size of the birth population on which the figures are based and on the frequency of the occurrence
AT BIRTH 7
measured. The smaller the popukdion, or the smaller the frequency of the event in a given population group, the greater the relative variability.2 Mortality rates were not computed in the accompanying tables for certain small frequency groups, i. e., where the birth population was less than 100 and there were fewer than 20 deaths.
zl.h~ ~t~~d~rd error iS the � easure used ‘0
evaluate this variability. Chances are less than1 in 20 that a difference as large as 2 standarderrors would srise by chsnce. Generally, thestandard error of s rate per 1, 000 births is
where R is the rate and B is the number of births used to compute the rate. The standard error of the difference between 2 rates, RI and R2, is
If 2 rates differ by less than twice this standarderror, it is usually concluded that they are notsignificantly different (statistically) . When arate is low and the number of deaths is very small,
the standard error of the rate is ~ where R is *
the rate and ~ is the number of deaths. The stand
ard error of the difference between 2 such rates, RI and R2, is
4+4 r ~ ~“
TABLE A. PESCENT OF LIVE BIRTHS AND NEOIWTALDEATHS WITH BISTE WEIGE’I’MO GESTATIONNOT S!CATEO:UNITED STAKES, JMWMRY 1 TO MABCE 31, 1950
(Excludesdata for Massachusetts)
WEIGHT NOl! S!WIED prmm Am GESTATIONml! STATED
All All.births
Single Plural births
Single Plural
All racea
White --.---------Iionwhite
All races
WMteNonwhite -----------,---------
BIRTSS
3.8 3.8 4.8 2.1 2.1 2.1
3.2 3.2 3.8 1.9 1.9 1.6 7.0 7.0 9.2 3..6 3.6 4.4
NEOIWI?ALDEAms
14.7 14.8 U3.8 6.0 6.4 2.8
13.5 3.3.5 12.6 4.9 5.2 2.319.8 19.9 18.4 10.5 11.2 4.5

-----
-------------
-----------
-----
-----------
-----------
8’ VITAL STATISTICS-SPECIAL REPORTS
TABLE B. BIRTH WEIGBT STATISTICSFOR SINGIIELIVE BEWES, BY RACE, UNDER ALTERNATIVEMETHODSFOR DISTR.lB-UYING NOT STATEDBIRTH WEIGH?KSUNITED STATES,JANUARY1 TO MARCH 31, 1950:
(Excludesdata for Massachusetts)
1
I NONWEIT!E
BIRTH WEIGBT(IN GRAMS)
Method I Method I Method I Method Method Method A B c D A B
PERCENIDIS’I!RIBUTIONOl?BIR’TES
All weights 100.0 100.0 100.0 100.0 100.0 100.0 100.0 100.0
1,000 or lef3s----------- 0.4 0.4 0.4 0.4 0.5 0.5 0.5 0.5 1,001-1,500------------- 0.5 0.5 0.5 0.5 0.7 0.7 0.7 0.7 1,501-2,000------------- 1.0 1.0 1.0 1.0 1.5 1.5 1.5 1.5 2,001-2,500 4.2 4.2 4.1 4.2 5.9 5.9 5.7 5.9
2,501-3,000------------- 17.4 17.4 17.2 17.5 20.5 20.4 19.9 20.5 3,001-31500------------- 38.6 38.6 39.3 38.6 35.6 35.7 37.5 35.6 3,501-4,000------------- 28.~ 28.2 27.8 28.2 24.0 24.0 23.2 24.0 4,001-4,500------------- 7.9 7.9 7.9 7.9 7.4 7.4 7.2 7.4 4,501 or more 1.8 1.8 1.8 1.8 3.9 3.9 3.8 3.9
NEONATAL MORTALITYRATES
All weights 17.3 17.3 17.3 17.3 24.4 24.4 24.4 24.4
1,000 or less 880.2 881.4 889.8 878.2 835.2 836.1 849.2 823.6 1,001-1,500------------- 575.0 577.4 578.5 573.3 511.0 508.0 516.0 507.4 1,501-2,000------------- 238.4 235.9 233.9 239.6 190.0 190.9 185.1 192.2 2,001-2,500------------- 53.5 53.2 50.4 54.4 50.0 49.7 4s.1 51.0
2,501-3,000------------- 12.2 12.2 12.4 12.4 15.1 15.1 15.5 15.3, 3,001-3,500------------- 6.2 6.2 6.7 6.4 9.5 9.6 10.4 9.7 3,501-4,000------------- 4.9 5.0 4.7 5.1 10.4 10.5 10.0 10.6 4,001-4,500------------- 6.7 6.7 6.4 6.9 12.3 1’2.6 12.0 12.7 4,501 or more 12.1 12.1 u. 5 12.4 20.3 20.9 20.1 21.1
mm. -The alternativescliffer onlyinthe method for allocatingthenotstatedweights for which geetat Ion ages were reported. These methods are deecribedbelow: A. se; text for descriptionof this method. B. It is assumedthat the not statedsat each geetationage fall at the median weight for that gestation
level.c. It Is assumedthat thereisparallelisminthe percentagedistributionsofknown weights and gestations,
and on this basis the not statedsat each gestationage are distributedto an equatedweight group orgroups. (See reference8 for detailsof this method.)
D. It isassumedthat the not statedsare distributedaccordingto the generalweight distributionwithoutregard to gestationage reported.
DISTRIBUTIONS OF LIVE BIRTHS of the children that died in the neonatal period. The birth of a live born infant weighing 1,500
Birth weighJ grams or less was a very infrequent event (1.1 percentof all births). Each advance towsrd higher weight
A great majori~ of the children born in the ftist brought a sharp incresse k the proportion of children 3 months of 1950 weighed over 2,500 grams at birth. born, with the result that over two-thirds of the In fact, only 7.4 percent weighed 2,500 grams or less immature births fell in the weight group 2,001-2,500 (table C). However, in this group are about two-thirds grams.

---------
---------------
---------------
---------
---------------
Vol. 39, No. 1 W EIGHT AT BIRTH 9
‘TABLE c. PERCENT DISTRIBUTION OF LIVE BISTBS, BY BIXTE WEIGBT, RACE, SEK, AND PLOSALITY: UNITED STATES, JANUARY 1 TO NAROH 31, 1950
(Births with birth weight not stated are distributed. Excludes births to residents Of Massachusetts)
AIL RACES WHITE NONWHITE ,BIR!lTiWEIG2T
(IN GRANs) Both Both Both
Male Female Male Female Male Femalesexes sexes sexes
TOTAL BIRTES
All wei@rts 100.0 100.0 100.0 100.0 100.0 100.0 .100.0
1,000 or less--------------- 0.5 0.5 0.5 0.4 0.4 0.4 0.6 0.6 0.6 1,001-1,500----------------- 0.6 0.6 0.6 0.6 0.6 0.6 0.s 0.8 0.9 1,501-2, 000----------------- 1.4 1.3 1.4 1.3 1.2 1.4 1.8 1.7 2.0 2,001-2,500----------------- 4.9 4.3 5.6 4.7 4.1 5.3 6.4 5.6 7.3
2,501-3,000----------------- 18.1 E. .4 21.0 17.7 14.9 20.7 20.6 18.3 23.0 3,001-3,.500----------------- 37.7 36.1 39.4 38.1 36.3 40.0 35.1 34.6 35.6 3,501-4,000----------------- 27.L 29.8 24.2 27.7 30.5 24.7 23.5 25.5 21.5 4,001-4,500----------------- 7.7 9.5 5.8 7.8 9.7 5.8 7.3 8.5 6.0 4,501 or mOre--------------- 2.1 2.6 1.5 1.8 2.3 1.2 3.8 4.5 3.2
2,500 or less 7.4 6.7 8.1 7.0 6.3 7.6 9.7 8.7 10.7 2,501 or mere--------------- 92.6 93.3 91.9 93.0 93.7 92.4 90.3 91.3 89.3
Median weight (in grSJU6)l--- 3,320 3,390 3,260 3,330 3,400 3,270 3,280 3,330 3,220
SINGLE BIRT’E3
All weights--------- 100.0 100.0 100.0 100.0 100.0 100.0 100.0 100.0 100.0
1,000 or less 0.4 0.4 0.4 0.4 0.4 0.4 0.5 0.5 0.5 1,001-1,500----------------- 0.5 0.5 0.5 0.5 0.5 0.4 0.7 0.6 0.8 1,501-2,000----------------- 1.1 1.0 1.1 1.0 1.0 1.1 1.5 1.4 1.6
4.4
2,501-3,000----------------- 17’.9 15.1 20.8 17.4 14.6 20.5 20.5 18.1 22.9 3,001-3,Soo----------------- 38.2 36.5 40.0 38.6 36.7 40.6 35.6 35.1 36.2 3,501-4,000----------------- 27.6 30.3 24.7 28.2 31.0 25.1 24.0 26.0 21.9 4,001-4,500----------------- 7.8 9.7 5.9 9i’. 9.8 5.9 7.4 8.7 6.1 4,501 or more--------------- 2.1 2.7 1.5 l..e 2.4 1.2 3.9 4.6 3.2
2,500 or less--------------- 6.4 5.8 7.1 6.0 5.5 6.6 8.6 7.6 9.6 2,501 or mere--------------- 93.6 94.2 92.9 94.0 94.5 93.4 91.4 92.4 90.4
2,001-2,500-----------------T 3.8 5.1 4.2 3.6 4.s 5.9 5.1 6.7
Median weight(in gmms)=--- 3,330 3,400 3,270 3,340 3,410 3,280 3,290 3,340 3,240
BIRTHS lliPLURAL S13TS
A1l. weights 100.0 100.0 100.0 100.0 100.0 100.0 100.0 100.0 100.0 II
1,000 or lese 4.0 3.9 4.1 3.9 3.8 4.1 4.2 4.4 4.0 1,001-1,500----------------- 5.6 5.0 6.1 5.4 4.8 6.1 6.1 5.9 6.3 1,501-2,000----------------- 14.2 12.6 15.9 14.2 12.3 16.0 14.5 13.7 15.3 2,001-2,500----------------- 29.2 28.1 30.4 29.2 28.2 30.2 29.2 27.3 31.3
2,501-3,000----------------- 29.5 30.2 28.7 29.9 30.8 29.1 27.1 27.1 27.2 3,001-3,500----------------- 14.1 16.1 12.0 14.2 16.2 12.1 13.4 15.3 SL.3 3,501-4,000----------------- 2.8 3.5 2.1 2.5 3.2 1.9 4.0 4.7 3.2 4,001-4,500----------------- 0.6 0.6 0.6 0.5 0.5 0.5 1.2 1.2 1.2 4,501 or mOre--------------- 0.1 0.1 0.1 0.0 0.1 0.0 0.3 0.4 0.3
2,500 or less--------------- 53.0 I 49.5 56.5 52.8 49.2 56.4 54.0 2,501 or mere--------------- 47.0 50.5 43.5 47.2 50.8 43.6 46.0
51.3 4s.”7
56.8 43.2
Median wei@t (in grems)l--- 2,400 2,460 2,520 2,400 2,440 2,4s0 2,400
lComputed to nearest 10 grams on basis of original reporting units of pouuds and ounces.
-Percentages for summary gcoupa were independently computed ead therefore do not necessarily equal exactlyNOII1.the sum of the individual component groups.
788-367O-65—2
10 VITAL STATISTICS-SPECIAL REPORTS
The area of. peak concentration of births was between 2,501 and 4,000 grams. The first 500-gram group in this interval (2,501-3,000) contained 18 per-cent of all births, while almost two-thirds weighed 3,001-4,000 grams. Only a comparatively small proportion of births (2.1 percent) fell in the upper weight interval (4,501 grams or more).
Race. -Nonwhite babies weighed on the average 50 grams less than white babies (table C). Although this gap is small, there are some notable differences in the weight distributions of white and nonwhite births (figure 1A).
A greater proportion of the nonwhite children were born at the immature weights and weights above 4,500 grams, where the major problems of obstetric and pediatric care exist. Infants weighing 2,500 grams or less represented 7.0 percent of all white live births as compared with 9.7 percent of nonwhite. At the highest weight level shown, the percent of non-white births (3.8) was double that of white (1.8).
Comparison of the percentages of white and non-white births at weights around the modal groups for the distributions also reveals some variation. For both, the highest proportion of births occurred at 3,001-3,500 grams. Around this peak, however, there was somewhat greater symmetry in the nonwhite distribution with the percentages of babies weighing 2,501-3,000 and 3,501-4,000 grams being nearly equal. In contrast, the distribution of white births was weighted more heavily at 3,501-4,000 grams.
Plurality= —Members of plural sets represented only 2.0 percent of all live births, but they accounted for 14.8 percent of the children weighing 2,500 grams or less at biiith. Figure lB indicates the extreme difference in the weight of children born in single and plural deliveries, which gives rise to this situation. In multiple deliveries, over half of the liveborn children (53.0 percent) were 2,500 grams or less at birth, while only 3.5 percent weighed over 3,500 grams. This is in sharp contrast with the situation among single births, where the corresponding figures were 6.4 and 37.5 percent, respectively.
In both single and plural births, the average weight was slightly lower for nonwhite children than for white.
&.—Another characteristic shoting hportant weight differentials at birth is sex (figure lC). Fernak?s on the average weighed less than males. This was true in the case of both single and plural births in each race group.
For single births in the white and nonwhite groups, there was very little difference in the proportions of male and female children weighing under 2,001 grams (table C). At 2,001-2,500 grams, however, the pro-portions of female births turned up more sharply, and the total group prematurely born according to the weight criterion was a fifth higher than that among males.
The peak frequency class for both male and female births in the two race groups was 3,001-3,500 grams. Comparison of the percentages on each side of this weight interval demonstrates, as do the average weights, the tendency of males, to reach, appreciably heavier weights in utero than females. A white male child was more than twice as likely to weigh 3,501-4,000 as 2,501-3,000 grams. For females, the percentages in these weight groups nearly baIanced each other. A somewhat similar situation existed among nonwhite births.
Larger proportions were found at the higher or’ nmre. For both male the proportion weighing ever, was higher than
of male than female infants weights through 4,501 grams and female nonwhite infants, 4,501 grams or more, how-
in either sex of white births.
Gestation and birth wei~h
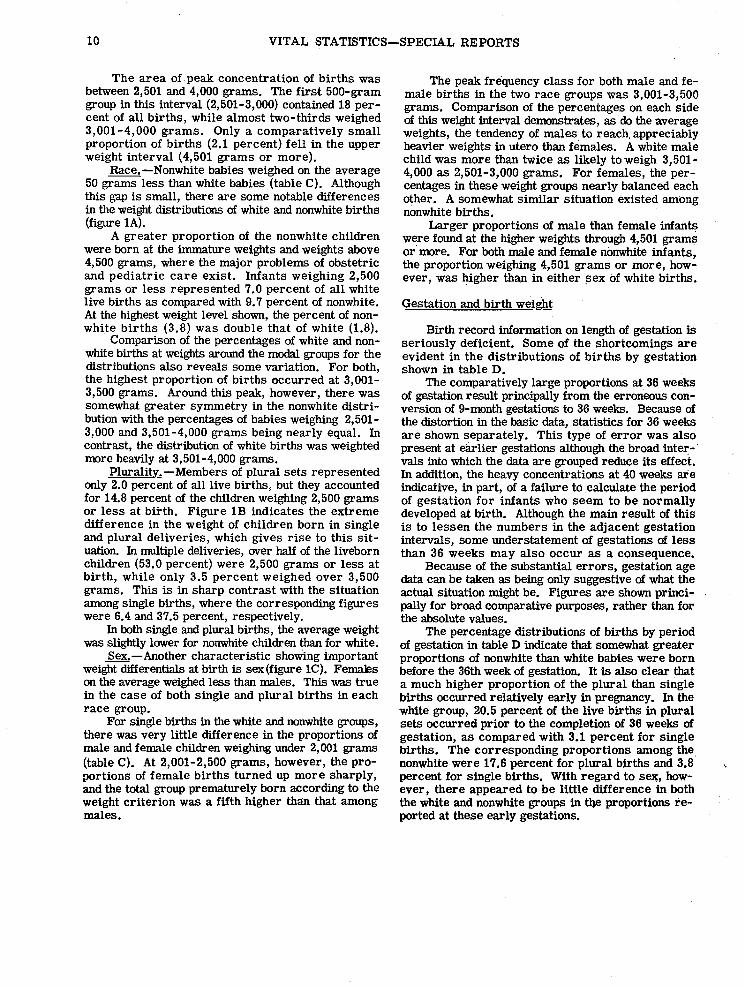
Birth record information on length of gestation is seriously deficient. Some of the shortcomings are evident in the distributions of births by gestation shown in table D.
The comparatively large proportions at 36 weeks of gestation result principally from the erroneous con-version of 9-month gestations to 36 weeks. Because of the distortion in the basic data, statistics for 36 weeks are shown separately. This type of error was also present at e6.rlier gestations although the broad inter-” vals into which the data are grouped reduce its effect. In addition, the heavy concentrations at 40 weeks tie indicative, in part, of a failure to calculate the period of gestation for infants who seem to be normally developed at birth. Although the main result of this is to lessen the numbers in the adj scent gestation intervals, some understatement of gestations of less than 36 weeks may also occur as a consequence.
Because of the substantial errors, gestation age dsta can be taken as being only suggestive of what the actual situation might be. Figures are shown principally for broad comparative purposes, rather than for the absolute values.
The percentage distributions of births by period of gestation in table D indicate that somewhat greater proportions of nonwhite than white babies were born before the 36th week of gestation. It is also clear that a much higher proportion of the plural than single births occurred relatively early in pregnancy. In the white group, 20.5 percent of the live births in plural sets occurred prior to the completion of 36 weeks of gestation, as compared with 3.1 percent for single births. The corresponding proportions among the, nonwhite were 17.6 percent for plural births and 3.8 percent for single births. With regard to sex, how-ever, there appeared to be little clifference in both the white and nonwhite groups in t@ proportions re-ported at these early gestations.

Vol. 39, No. 1 WEIGHT AT BIRTH 11
FIGURE 1
BIRTH WEIGHT DISTRIBUTION OF LIVE BIRTHSI UNITED STATES, JANUARY I TO MARCH 31, 1950
P,ERCENT IN lNtiViDUAL WEIGHT GROUPS CUMULATIVE PERCENT DISTRIBUTION
Percent A-Race Percent A-Race 100
80 1 30
60
20
40
10
20 /
/ 0 ob~ 1,000 1,00 L [,501- 2,001- 2501- 3,00 L 3,50!- 4.001- 4.501 1,000 1,500 2,000 2,500 3,000 3,300 4000 4.500 TOILII
or less 1300 2,000 2,500 3,000 3,500 4,000 4,500 07 mm? or less or k%, or less orI*5s or Iesz or leas or less or less
B- Plurality B-Plurality
100
80 30
/ Plural
60 //-720
/’ 40 /’
/’ 20 /’
/
.44 /
0 t ! ! ,
10 1,300 2,000 2,500 3,000 3,500 4,000 4,500 101 or less 1$00 2,000 2,500 3,000 3,500 4,000 4,500 or more 0 b orless orless or I es] ., 1,s. of less or less or less
C-Sex C-Sex 40 100
1,000 1,001. 1,501- 2,00! - 2,501- 3,001 - 3,501- 4,001. 4,501 1,(
8030
60/20 ,- —-
f/
40 — .-...-
10 k
20
0 I I I I 0
BIRTH WEIGHT (In worm)
-----
------------------------------
-----------
------------------------------
--------
------------------------------
-----
---------------------------
-----
------
------
---
------
------
------
------
------
------
---------------------------
12 VITAL STATISTICS—SPECIAL REPORTS
TABLE D. PERCENTDISTRIBUTIONOF LIVE BIRTHS BY WEEKS OF GESTATION,RAOE, SEX, AND ETJJRALITY: UNITED STATES, JANUARY1 TO MAXCH 31, 1950 i
(Birthstith gestationnot statedare distributed. Excludesbirths to resldentaof Maesaohusetlm)
Under 37 Q
BACEANDSKX Total 28 28-31 32-35 36 weeks 37-39 40 week8 weeks weeks weeks
weeks
100.0 0.6
100.0 0.6 100.0 0.6
100.0 0.6
100.0 0.6 100.0 0.5
100.0 0.8
100.0 0. s 100.0 0.8
100.0 0.5
100.0 0.5 100.0 0.7
and weeks weeks and
All racee
M&leFemale
White
Male Female
INonwMte
Male
over over
TOTAL BIRl?SS -
0.9 2.0 8.5 88.0 8.9 75.9 3.2-
0.9 2.1 8.4 87.9 0.9 2.0 8.5 88.1
0.8 2.0 7.8 88.8 9.3 76.1 3.5”
0.9 2.1 7.8 88.7 0.8 2.0 7.8 88.9
1.3 2.1 12.5 83.3 6.9 7.4.9 1.5
1.3 1.9 12.5 83.5 1.3 2.2 12.5 83.~
—-
“ SINGLE BIRTHS
I 0.8 1.9 8.4 88.4 8.8 76.4 3.2
0.8 1.8 7.7 89.2 9.1 76.6 3.51.2 1.9 12.4 83.‘7 6.9 75.4 1*5
BIRTHS IN PLURAL SETS
5.2 10.8 12.7 67.3 14.9 51.4 1.1
5.3 11.4 12.3 67.2 16.1 50.0 1.24.8 8.2 14.6 67.9 9.3 58.0 0.6
Female
All racee
WhiteNonwhite
AU races
WhiteNonwhite
—
100.0 4.0
100.0 3.9 100.0 4.6
NOTE.—Percente for summarygroups ware independentlycomputedand thereforedo not necessarllyequal exactlythe sum of the individualcomponentgroups.
In the broad. gestation intervals shown in table E, there is considerable dispersion of births by weight. Many children ivho would be considered premature according to gestation age weighed over 2,500 grams, and conversely many of the low-weight infants were reported as born at or near full term. For example, in about two-fifths of the single deliveries occurring in 32-35 weeks of gestation, the infants weighed over 2,500 grams. Although the pl oportion of single births at gestations of 3? weeks and over that weighed 2,500 grams or less was small (3.6 percent), this group represented half of the immature births.
At all gestations, there were high proportions of births in plural deliveries weighing 2,500 grams or less at birth. Among those delivered before the completion of 36 weeks of gestation, all but a small segment weighed 2,500 grams or less. At the same time, lwo-fifths of those born at 37 weeks and over also fell in this weight group. In fact, half of the plural births immature according to the weight criterion were in this gestation group.
Although a wide range of birth weights is represented in each gestation age group, the median weights by gestation follow a consistent pattern.

---------------
--------------------------------------------
--------------------------------
---------------------
------------------------------------------
-------------------------------------------------------------------
-----------------------
---------------------
------------------------------------------
Vol. 39, No. 1 WEIGHT AT BIRTH 13
TABLE E. PERCEWTDISTKIBUTIONOF LIVE BIRTHS BY B~TE WEIGET, WEE= OF GESTATION, RACE, AND PLUBALITY: UNITTEOSTATES, JANOABY 1 TO MARCH 31, 1950
(Birthswith birth wei@ or gestationnot statedare distributed. Excludes births to resir3entsof Massachusetts)
I WHITE I NONWE15
1 t
BISTS WEIGHT 37 I I 37 (IN GRAMS) up 28-31 32-35 36 weeks U;$= 28-31
weeks weeks weeks weeks and
weeks weeks
L All weights 100.0 1oo.o
1,5,00or less 86.1 33.81,501-2,000 6.7 32.52,00L-2,500----------------------- 1.7 19.7
2,501-3,000------------7 1.5 5.9-3;001-3,500 2.3 4.1
3,501 or more 1.7 3.9
2,500 or less 94.5 86.02,501 or more 5.5 14.0
over
SINGLE BIRTHS
100.0 100.0 100.0 100.0 I 100.0 100.0 loo.o 10Q.O
T5.8 0.2 0.0 7~.8 34.6 7.1 0.3 0.1 20.3 1.7 0.3 10.3 33.0 21.7 1.7 0.5 33.6 8.9 3.0 2.4 20.4 33.9 8.4 4.7
21.1 18.8 17.4 2.1 5.4 17.4 17.3 21.4 12.7 34.4 40.0 2.3 3.5 12.9 31.2 37.6 6.6 36.0 39.2 5.2 3.1 6.9 41.2 35.8
59.6 10.8 3.4 90.4 88.0 62.8 10.3 5.2 40.4 89.2 9.6 12.0 37.2 89.7 94.896.6 LT
BIRTHS IN PLUBAL SETS
I I I I I ,1 AU weight$--------------- 100.0 100.0 100.0 loo. o 100.0 loo. o 100.0 100.0
* I I
1,500 or less 93.1 55.4 14.2 3.3 1.2 90.6 47.2 16.3 4.8 2.6 1,501-8,000 4.6 34.7 38.0 19.5 8.1 3.6 43.1 39.2 14.4 10.3 2,001-2,500 0.9 8.2 33.9 41.3I29.5 4.3 6.3 30.6 35.9 30.9
2,501-3,000 0.5 1.3 11.1 . 24.5 38.1 1.4 1.4 10.6 25.9 32.9 $,oold3,500----------------------- 0.5 0.1 2.4 9.2 19.0 0 0 2.4 1.3.o 16.6 3,501 or more 0.4 0.3 0.4 2.2 4.1 0 2.1 0.8 5.9 6.6
2,500 or less 98.5 98.3 86.1 64.1 38.9 98.6 96.5 86.1 55.1 43.8 2,501 or more 1.5 1.7 1.3.9 35-.9 61.1 1.4 3.5 13.9 44.9 56.2II
NO!E3 .- and thereXoredo not necessarilyequal.—Percents for summsry GOups were independentlycctsoutedexactlythe sum of the individualcomponentgroups.
Among single birtbs, the medians for gestation groups below36 weeks all fdlat immature weights. For 37 weeks and over, the figure is well above the immaturity weight level (table F).
Male infants at each gestation interval weighed on the average somewhat more than fernale infants. In terms of gram differences, the excess was greatest at the mature gestation level. Relative to the average weight at each gestation, however, the gap betsveenthe weights of males and females was most pronounced in the very early group under 28 weeks.
At gestation ages of 32 weeks or higher, the white children weighed slightly more at birth on the. f average than the nonwhite. A reverse relationship is , found at gestations under 28 weeks. The explanation for this may lie in reporting inaccuracies rather than in any developmental factor. Underreporting and misreporting as fetal deaths of the small infants who die soon after birth are believed to be more serious with respect to nonwhite births because of the high proportion not attended by physicians.
7

------
---------------
------------
--------------------------------
---------
--------------------------------
------
-----------------------------
------
-----------------------------
14 VITAL STATISTICS-SPECIAL REPORTS
TAME F. MEDIAN WEIGHTS OF LIVE BIRTHS BY WEEKS OF GESTATION,RACE,SEX,AND PLURALIIT:UNITEO STATES, JANUARY 1 TO MARCH 31, 1950
(Birthswith birth weight or gestation not statedare distributed. Excludesbirths to residentsof’Massachusetts. Mediane computed to nearest 10grams on basis of original reporting units ofpounds and ounces)
MEDIAN WEIGR’I!(IN GRAMS)AT GESTATIONGROUP
RACE AND SEX37
Under 28-31 32-35 weeks~::el weeks weeks and
over
TOTAL BIRTES
All races 92C 1, i’oc 2,310 3,350
Male----------------- 940 1,720 2,340 3,410Female 890 1,680 2,290 3,280
White 900 1,700 2,320 3,360
Ma~e 930 1,720 2,340 3>420Female 880 1,680 2,290 3,290
Nonwhite 970 1,700 2,280 3,300
Male 970 1,730 2,290 3,350Female 980 1,680 2,270 3,240
SINWE BISTHS
All racea
WhiteNonwhite m
BIRTHS IN PLURAL SE?I!S
All races
tiite:Nonwhite
mlln~mput.iw we mdim weights for ~is gesta
tion group, a further diviaionuaemadein the lowestweight group shown in this report.
NEONATAL DEATHS
Birth weighJ
The risk of death among the newborn was closely related to the weight at birth. Among infants weighing 2,500 grams or less at birth, the neonatal rate was 173.7 per 1,000, compared with 7.8 among all other infants (table G).
Only a very small proportion of’ We children weighing 1,000 grams or less lived through the first 28 days. Chances of survival improvefl considerably with a moderate increase in weight, but a little over half of those weighing 1,001-1,500 grams also died. Mortality continued to decline steeply with each added 500 grams of weight, and neonatal deaths in the highest group of the immature category (2,001-2,500 grams) amounted to 50.4 per 1,000 infants. Substantial de-creases were recorded well into the mature, weights and the optimum birth weight group for the survival of infants fell at 3,501-4,000 grams. Additional weight, particularly when it brought the weight above 4,500 grams, was on the average decidedly disadvantageous.
Race. —The oyer-all neonatal mortality ,rate among nonwhite births was about 40 percent higher than that among the white. This excess was due, in part, to the ,differences in the weight distributions already described an~ in part, to substantially greater mortality among the nonwhite at weights above 2,500 grams (figure 2A). If the wei@ distributicina for both white andmonwhite births were the same as the distribution for all births, the over-all rates would become 19.6 for the white and 22.6 for the nonwhite. In standardizing rates in this manner, it is assumed that the differences between the birth weights of white and nonwhite infants are not of an intrinsic nature but reflect basically the effect of socio- economic and other demographic factors. Comparison of the standardized with the unstandardized rate clearly indicates the major reduction in neonatal mortality for the nonwhite group that would result froti bringing the weight distribution of nonwhite births closer to that for total births.
At the lower wei@s, where the risk of mortality is great, nonwhite infants had a somewhat better chance of survival than the white. The mortality rates for the hvo groups differed only slightly at 2,001-2,500 grams. However, in the higher weights at which a preponderance of the births occur, the mortality risk among nonwhite births was greater, with the gap between the two race groups becoming relatively wider at each successive level through 3,501-4,000 grams and then narrowing slightly (figure 2A).

-----
------------
--------------
--------------
------------
------
------------
--------------
--------------------------
------------
------
------------
------------
------------
. .’,
Vol. 39, No. 1 WEIGHT AT BIRTH 15
TABLE G. NEONATALMORTALITY RATES BY BIRTH WEIGRT, RACE, SEX, AND PLURALITY:UNITED STATES, JANUARY 1 TO MARCH 31, 1950
(Based on dedths within the first 28 days afterbirth among childrenborn Jan. ltoMar. 31, 1950. Ratesper 1,000 live births. Births and deaths with birth weight not stated are distributed. Excludes datafor Massachusetts)
ALL RACES VJ31TE NONWHITE BIRTH WEIGHT (IN G=)
~ =s ‘a’e‘em’e=s I ‘a’e‘em’e RATES AMONG TOTAL BIRTHS
All weightsl 20.0 22.7 17.1 18.9 21.6 16.0 26.7 29,4 23.9——
1,000 or less 871.7 894.2 848.0 883.3 905.0 861.0 821.4 849.9 789.0 1,001-1,500-------------- 551.3 621.8 478.2 562.1 643.1 474.5 507.0 524.7 491.6 1,501-2,000 211.0 265.0 160.5 214.6 271.9 160.4 195.7 235.1 161.1 2,00L2,500-------------- 50.4 67.4 36.6 50.6 69.1 35.5 49.5 60.0 41.2
1,000 or less 871.7 895.1 846.7 880.2 903.8 855.2 835.2 858.5 809.01,001-1,500-------------- 562.3 629.1 489.6 575.0 648.5 489.9 511.0 537.4 488.81,501-2,000 228.9 281.1 178.3 238.4 294.5 182.2 190.0 221.3 163.12,00L2,500-------------- 52.8 71.1 38.3 53.5 73.2 37.7 50.0 62.1 40.6
2>501-3,000-------------- 12.6 16.7 9.5 12.2 16.1 9.2 15.1 19.7 11.33,001-3,500-------------- 6.7 8.1 5.3 6.2 7.6 4.9 9.5 10.7 8.43,501-4,000-------------- 5.6 6.4 4.6 4.9 5.6 4.0 10.4 12.1 8.44,001-4,5W 7.4 7.6 7.2 6.7 6.8 6.5 12.3 1.3.o 11.24,501 or more 14.2 13.7 L5.1 12.1 10.8 14.7 20.3 23.2 16.0
2,500 or less 173..4 215.6 137.1 176.7 222.1 137.1 1.59.5 167.2 135’.o2,501 or more------------ 7.7 9.0 6.3 7.1 8.3 5.8 11.7 13.7 9.6
2&01-3,000-------------- 12.6 16.6 9.5 12.0 15.9 9.1 15.4 19.9 11.8 3,001-3>500-------------- 6.7 8.1 5.3 6.2 7.6 4.9 9.7 10.9 8.4 3,501-4,000 5.6 6.4 4.6 4.9 5.6 4.1 10.5 12.2 8.4 4,00L4,500-------------- 7.5 7.7 7.2 6.7 6.9 6.4 12.5 13.1 lL4 4,501 or more------------ 14.2 13.7 15.1 12.0 10.8 14.7 20.2 23.1 16.0
2,500 or less 173.7 213.9 138.9 175.8 218.8 138.4 164.7 192.8 141.3 2,501 or more------------ 7.8 9.1 6.4 7.1 .9.3 5.8 11.9 13.9 9.7
RATES AMONG SIItG13BIRTHS ‘T
All weights 18.3 20.9 15.6 17.3 20.0 14.5 24.4 26.9 21.8
1 TrRATES AMONG BIRTHS INPLUFW SETS
I II 11 f I IiAll weights 98.6 I 107.9 88.9 94.4 103.6 85.2 118.0 3.28.2 107.1
1,000 or less 871.5 890.2 853.4 898.0 910.8 886.2 7s4.0 808.8 689.7 1,001-1,500-------------- 503.7 585.8 434.1 507.1 615.6 418.8 409.0 472.5 505.5 1,501-2,000-------------- 145.4 200.4 100.8 129.5 179.3 90.6 218.4 287.7 1.52.5 2,001-2,5C0-------------- 32.9. 43.1 23.3 30.2 42.7 18.4 45.6 245.0 46.2
2>501-3>000-------------- 11.3 13.7 8.6 8.5 11.8 24.9 25.8 223.9 227.8 3,001-3,500-------------- 10.4 ‘%0.7 29.8 28.0 26.9 29.4 222.4 229.5 %2.1 3,50L4,000--------------4,001-4,500--------------4,501 or more
218.7 =13.3 238.1 (3) (3) (3)
227.8
(3) (3) I
%6.6
(3) r’)
28.8
r) (3)
230.1
r) (=) ,
225.0
(=) (s) r
f~ (:.)
[9]
2,500 or less 2,501 or more------------
175.6 I 204.4 11.8 13.2 149.7 10.0
171.0 9.0
199.9 10.5
145.3 7.2
196.9 25.3
224.5 26.6
170.5 23.8
.— lIn~l~di~ data for Massachusetts,the over-all rates become: All races} 19.9; white, 18.8; nonwhite,
26.6.2This rateis sub$ecttowide variability. It is basedonmore than 100 birthsj but less than20 dea~.?Rate not computedfor this group because of small numbers of births (less than 100] and deaths (1.eso
than 20) occurring in the interval.

16 VITAL STATISTICS-SPECIAL REPORTS
FIGURE 2
NEONATAL MORTALITY RATES BY BIRTH WEIGHT,
UNITED STATES, JANUARY I TO MARCH 31, 1950
(Rates per 1,000 live births)
Rote A-Race 1,000
600
400
200
lca
60
\40
20
Wti te 10 — —-
6
! 1 , 1 I I 1
lb 1,001. 1,501- 2,001 - 2*01- 3JKl~ 4,001- 4,501 or less (,500 2,000 2,500 3,CC.J &% 4,500 ., mm
B-Plurality !,000
200
I00
.~ 1,000 1,001- 1,50!. 2,001- 2,501- 3pol. 4,501
.x 1,, s 1,500 2,000 2,500 3,000 3,500 4:000 4:500 or mm
‘“t------’\-\ I
BIRTH WEIGHT (in grams)
NoTE. Weight scale may be viewed as being continuous with the fOteS
plotted at midpoints of the weight intervols.
For both white and nonwhite babies, the risk of mortality was reduced markedly with increasing weight until well past the prematurity level. The sharpest relative reductions in mortality in each race group, however, occurred at weight intervals 2,001-2,500 and 2,501-3,000 grams. At these levels the addition of 500 grams meant cutting mortality by two-thirds to three-fourths.
Among white children, the group weighing 3,501-4,000 grams had the lowest mortality. The neonatal rate at this optimum level, 4.9 per 1,000 was only a fourth the figure for all weights, 18.9. For the non-white races, children weighing somewhat less (3,001-3,500 grams) experienced the lowest mortality. While the rate for this optimum group (9.7) did not compare quite as favorably with the over-all rate as in the case of white births, it was also far below the neonatal ‘ rate for all weights combined (26.7).
Plurali~-Because of the heavy preponderance of plural births at the low weights, the neonatal mortality rate for babies born in multiple sets was five to six times the rate for single births. On a weight-specific basis, the mortality risk among plural births was actually lower than among single births between 1,001 and 3,000 grams. Above this point, however, single births had a major advantage (figure 2B).
The relationships observed between rates in the’ case of total births also hold for single events for the white and nonwhite groups. For plural births, however, the situation was not at all the same. White children at all weights above 1,500 grams experienced lower mortality than the nonwhite at comparable weights. The differential was most marked between 2,501 and 3,500 grams, where the mortali~ risk among the white was about a third of the nonwhite.
&.-During the neonatal peribd, the mortality risk for males and females differed greatly at almost every weight level, and the over-all mortality rat e among females was only three-quarters of that among males.
The prognosis was considerably better for girls thsn for boys at most weights in both the white and nonwhite groups (figure 2C ). In the white. race, the neonatal mortality rates for females at weights behveen 1,501 and 3,500 grams were one-half to two-thirds of the rates for males. Only in the highest weight group (4,501 grams or more) was the rate lower for males. Sex differences in mortality in the nonwhite races were %lightly less pronounced than in the white at most premature weight levels and also at weights between 2,501 and 3,500 grams. h the weight group 4,501 grams or more, the rate for the nonwhite female was less than that for the male.
Table G gives mortality rates for both single and plural births by race and sex as welLas rates for the two groups combined. Compariso~ based on single births do not change the relationships already discussed. It will also be noted that for this group race differentials among males weighing betxveen 1,001 and 2,500 grams were larger than those among

--------
------------------------
--------
-----------
-----------
-----
---------
-----------------
----------------
Vol. 39,. No. 1 WEIGHT AT BIRTH 17
females. In fact, for single immature births, as a group, there was no difftience bel?weenwhite and non-white female mortality, but the rate among white males was 19 percent above that for nonwhite males. Tnthe weights above 2,500 grams, race differences for each sex were large, with the white groups having the hwer rates.
By treatfng the mortality experience of males and females in the same weight cla.i%as comparable, no account is taken of developmental differences that may exist. An evaluation of these differences is needed, but will require more detailed data than are amilable from the present study. In this comection, it is of interest, however, to compare the weight levels at which male and female mortality correspond. For this purpose, the mortality rates per 1,000 live births for sfngle white males and females by 250 gram inter-’ tis are shown below. These rates indicate that at many points in the range 1,001 to 3,000 grams (the highest weight for which data in this detafl sre avail-5ble) males had to weigh about 250 grams more than females to have Somewhat the same chance of Survfval.
W~igll Male Female——
1,001-1,250 $jTSInS-------- 731.7 589.3 1,251-1,500 grams 579.4 412.3 1,501-1,750 glW.XIS--------383.0 246.0 1,751-2,000 g’I’S.mS 246.0 147.7 2,001-2,250 grams il’7.l 59.5 2,251-2,500 grams 55.8 30.2 2,501-2,750 gIYWkS 23.8 13.2 2,751-3,000 gl%illlS--------11.6 6.8
There fs evidence, however, of a basic differential in mortality Liehveenthe sexes that ts not taken care of by this approach. This arises from the fact that at no point fn the weight scale does mortality for males reach the low recorded for females.
Gestation
Inadequate as we gestation data are for exact measurements, they do demonstrate the sharp changes in the mortality risk with increasing gestatton age. About l“out of eyerj 3 infahts born at 28-31 weeks of gestation died in the neonatal period, as compsrqi with 1 in 8 at 32-35 weeks, and less than 1,tn 100 at 37 weeks and over (table H).
At gestations through 35 weeks, mortality was about 10 percent lower among nonwhite than among white children in single births. For infants born after the completion of 37 weeks of gestation, how-ever, neonatal mortality was about two-thirds htgher for nonwhite siingle births than for white. h-plural births, the experience among the nonwhttes was better only in the gestation group under 28 weeks. Major differentials in relative loss were also found between the sexes at each cf the broad gestation levels given.
788-637O-65—3
TABLE H. NEONATAL MORWUZL’YRATES BY WEEKB OF GESTATION,IWE, SEX, AND PmRAU!m Uml!EO STATES, JANUARY 1 TO MARCH 31, 1950
(Basedondeathswithinthe first 28 days after birth-W childrenborn Jan.llm M. 31, 1.850.Ratesper 1,000 liva births. Births aud deaths withgastationnot statedare disbrilwtecl.Excluaesdata for Massachusetts)
RATES AMONG TOTAL BIRTHS
I I 1 I All races-- 788.4 379.4 121.3 18.4 8.8
Male 811.9 419.6 140.3 22.2’ 10.1 Female--------- 76L4 334.0 101.0 14.4 7.5
White-----=-- 803.6 387.9 122.4 18.1 8.1
Male 825.9 429.5 142.1 22.4 9,.2Female--------- 777.6 339.1 100.5 13.5 6.8
Nonwhite 724.4 346.5 115.4 19.7 X5.8
Male----------- 21.5 15.9Female 17.8 11.7 -
RATES AMOIiG SINGIZ BISTHS
I I I I All races-- 779.1 365.4 118.0 17.2 8.6
White 793.5 374.3 119.7 17.1 7:9Nonwhite 718.3 332.4 108.9 17.9 13.1
RATES AMONGBIRTHS IN PLURAL SX!l!S
I I I I
All races-- S47.2 484.8 148.4 55.1 24.5
White 868.9 484.6 144.3 48.9 19.1
Nonwhite - 760.9 486.1 175.5 80.1 49.6
Female infants experienced considerably lower nmrtality than dfd the male in all groups.
Gestation and bfrth weigh~ /’
Mortality varied greatly by weight within each gestation group and by gestation wfthfn each weight ‘ group. At each gestation level, mortality dropped off sharply as .weigbt increasec$ and reached a low pofnt at the more +ture weights. Sfmdlarly, among children fallfng in the same weight group, the mortality

---
------
---
---
18 VITAL STATISTICS-SPECIAL REPORTS
rate declined as the gestation age approached term~ For an intensive study of the separate and joint influence of gestation age and birth weight, it would be necessary to use smaller intervals for both of these characteristics than was warranted by the information available for this report. Despite this shortcoming, the data in table I give come indication of the important effect that both gestation and birth weight have on the survival of the newborn. For example, the loss during the neonatal period among white babies weighing
TABLE I. NEONATALMQRTALITYBATES BY BIRTS WEIOHT, - OF GESTATION,ANO RACE: UNITZYlSTATES,JAN-UARY 1 TO MARCH 31, 1950
(Basedon deathswithintl.wfirst 2S days afterbirth amons childrenborn Jan.1b Mar. 31, 1950. Rates per 1,000 live births. Births and deaths with birth weight or gestationnot stated are distributed. lIkcludesdata for Massachusetts)
37RACE AND Under 28-31 32-35 36 weeks
BIRTH WEIGHT 2s weeks weeks weeks and
(IN omfs) weeks over
WHITE
1,000 or less- 914.7 828.8 787.0 1428.6 485.3 1,oo1-1,500--- 762.2 560.0 416.6 377.5 353.1 1,501-2,000 593.9 345.8 204.8 142.6 119.5 2,001-2,500--- 400.0 187.6 92.7 49.9 33.5
2,501-3,000 (2) 108.4 51.3 18.1 10.1 3,001-3,500 (2) 136.5 23.Q 8.3 5.9 3,501-4,0co--- (:) ’48.0 111.3 6.1 4.8 4,00 L4,500--- (2) 190.5 9.6 5.9 4,501 or niore- H (2) (2) %.3.9 11.5
NONWHITE
1,000 or lea6- 865.9 800.0 766.7 1500.0 ~419.4 1,oo1-1,500--- 743.3 467.8 383.7 1383.0 347.5 1,501-2,000 566.7 284.9 155.7 143..4 134.9 2,00 L2,500--- (2) 190.6 S6.1 54.9 32.9
2,50L3,000--- (2) (2) 144.9 1.3.3 14.4 3,001-3,500--- (2) (2) 126.8 11.3 9.2 3,501-4,000--- (2) ~:] 140.0 9,4 10.4 4,001-4,500 (2) (2) ~lo.1 11.9 4,501 or more- (2) (2) (2) 116.3 20.7
%This rate is subjectto wide variability. Itis based on more than 100 births, but less than 20deaths.
%ate not computedforthis group becauseof smallnumbers of birtha (lessthan 100) and deaths (lessthan 20) occurringin the interval.
3SUpDlementarYdata not shown here ~dicate an
upturn in mortalityas gestationage extended muchbeyond term.
3,001-3,500 grams and born at gestations of 32-35 weeks, was considerably smaller than that among tnfants weighing between 2,001 and 2,500 grams and born after the completion of at least 37 weeks of gestation, but it greatly exceeded the rate for those weighing 2,501-3,000 grams who were born at or near term. Similar relations, emphasizing the need,to consider both gestation and birth weight in evaluating mortality experience, may be noted in the data for nonwhite births.
The differences bebueen the rates for males and females according to birth weight within a gestation group (table J) were generally greater than in the” gestation group as a whole (especially among white births). This apparent contradiction can be explained by the previously discussed differences ‘m the weight distributions of male and female births within each geststion group. It is worth noting that the rate among males in the optimum weight-gestation class was above the minimum recorded for females. The same situation held when more detailed data than shown in table J were examined. Thus, it would appear that an explanation of the sex, differential in mortaliw, at least among the more favorable risk groups, would have to be sought among factors other than weight or gestation.
ATTENDANT AT BIRTH
The discussion in this section distinguishes between births that occurred in hospitals and those that were delivered at home4 either by a physician or nonmedical person. While both race groups shared in the marked increase in the use of hospital facilities that took place during the 1940-50 decade, almost 45 percent of the nonwhite births in Janusry-kfarch 1950 were delivered at home (table 4). A substantial pro-portion of these were to rural residents in the Sout!I with midwives as the attendants. In the white race 8 percent of the births occurred out of ahospital, with a large fraction of these having a physician in attendance.
In interpreting the relationships presented below, it should be borne in mind that the attendant data do not take into account subsequent hospitalization of some of the infants delivered at home or the medical care received by others soon after delivery by a nonphysician. The effect of these factors could be appreciable in communities where special programs for the care of prematurely born tnfants existed.
A more significant factor for “attendant” statistics is the possible selection of obstetrical cases presenting complications for referral to hospitals, where ordinarily the mother would have remained at
4The phrase ‘ ‘at home ‘ ‘ refers to all deliveries occurring out of hospitals or Institution.

-------------------
-------------------------------------------------------------
----------------------------------------
----------------
-------------------------------------------------------------
---------------------
-------------------
Vol. 39, No. 1 WEIGHT AT BIRTH 19
TABLE J. NEONATALMORTALITYRAT!ESBY BIR5 WEIGET, WEEKS OF GESTATION,RACE, ANO SEX: UNITED STATES, JANUARY 1 ‘TOMARCH 31, 1950
(Basedon deathswithin the first 28 days after birth among childrenborn Jan. 1 to Mar. 31, 1950. Ratesper 1,000 live births. Births and deaths with birth weight or gestationnot stated are distributed.Excludes data for Massachusetts)
I
w ..
I I IFACE W BIRTH WEIGET 37 37
(IN GRAMS) Under 28-31 32-35 weeks Under
28-31 32-35 weeks28 28
weeks weeks and weeks weeks endweeks weeks
over over
825.9 429.5White -1- 142.1 9.2 777.6 339.1 100.5 6.8
1,500 or less 8s5.7 699.4 517.3 449.4 S44.1 556.7 403.9 326.1 1,501-2,000 2,001-2,500
640.2 (1)
389.4 214.4
251.7 115.7
161.8 45.9
51.5.5 (1)
294.2 150.3
1.58.3 66.9
87.4 24.7
2,50L3,000---------------------3,001-3,500 3,501 or more
(1) (1)(.1)
1.38.6 263.1 276.9
63.3 29.7
232.4
13. o 7.2 5.9
(1) (1) (1)
276.4 29.3 (=)
37.1 216.2 233.0
8.0 4.7 4.6
Nonwhite 3.28.7 1.5.9 695.0 316.1 103.5 11.7
I 1,500 or less 860.8 617.4 421.1 342.9 785.5 508.5 457.9 379.7 1,501-2,000 600.0 288.5 211.9 162.B 533.3 281.5 108.7 13.2.0 2,001-2,500 (1) 242.0 77.7 43.5 (1, 2133.8 93.5 25.1
2,501-3,000 252.1 18.5I (1)(1) .0 Il..=’39 o3,001-3>500--------------------- 246.4 10.4 (=) [:; =6.8 8.13,501 or more (=) X5.3 (=) (=) 9.8
I I I
+/ate n~ ~mputed for &iE group because Of small numbers of births (less ~~ 100) ~ dea~ fless .
than 20) occurri~ in the inter%il.-2mia rate is subJect to wide variability. Itisbasedm more than 100 births,but less than 20 deatis.
home for the delivw, also, the calling in of physicians by come midwives to handle difficult deliveries. In the nonwhite group, where midwives had a critical role, this selectivity may have been a particularly importit factor. Duing the 1940’s, tie Underst=ding of the midwife about the need for medical intervention in certain cases had increased greatly as a result of contacts by public health nurses snd their success in having midwives bring patients to prenatal clinics.
Several qualitative factors also enter into the consideration of birth weight statistics for the various attendantcategories. ‘f’he most accurate infor=tion is unquestionably obtained for the births occurring in hospitals. Many of the attendants who weighed infants born at home used fairly crude scales, calibrated by quarter pounds. In addition, whether or not a &kiwife, for example, made a correct allowance for the diaper, blanket, or other material in which the newborninfantwas wrw would have an appreciable effect on thebirth weight distribution.
Still another factor that may be qn?rating differentially smong births at home and in the hospital, is
underreporting 01 infantswho die shortly after birth or misreporting them as fetal deaths. Although no objective measures are available, tie general level of registration completeness alone, which is greatly in favor of the latter group, would make it reasonable to assume that this biasing situation is far more apt to occur auwng births at home.
These qualifications tmpose heavy restrictions on the inferences that can be drawn from current statistics on deliveries occurring out of hospitals. However, a number of the relationships found are highly suggestive and could be used as the framework for more intensive investigations.
Weight distribution and neonatal mortality—
Babies born in hospitals generally weighed less at birth than those delivered at home. Tnfantsdelivered by nonphysicians were on the average the heaviest, weighing about 140 grams more thsn the babies ‘de-livered by physicians at home and 260 grams more than the hospital births (table K).

------
-------------------------------------------------
----------------------------
------------
------------------------
------
------------------------------------------------------
--------------------------------------------------------------------
------------------------
20 VITAL STATISTICS-SPECIAL REPORTS
TAPLE K. PERCENTDISTR~ION OF LIVE BIRTHS AND NEONATALMORTALITYBATES, BY BIRTH WEIGRT,RACE, AND A!M!ENDANPAT BIRTH: UNI!CEOSTATES,JANUARY1 TO MARCH 31, 1950
(Neonatalmortalityratee based on deathswithin the first 28 days after birth among childrenborn Jan. Lto Mar. 31, 1950. Rates per 1,000 live births. Birthsanddeathswith birth weight not statedare,dis.tributed. Excludes data for Massachusetts)
ALL RACES II WHI’I!E I NONWHITE
BIRTH WEIGHT 1Physi- Physi- Midwife, Physi- Physi- Midwife, Physi- Physi- Midwife,(IN GRAMS) cIan cian other, cIan cian other, cian Cian other,
in not in and not in not in and not in not in and nothos hos- speci- hoa- hos- speci- hos- hos- specipitall pital fied pital~ pital fied pitall pital fied
1
PERCENTDISIRmUTION OF B~TELS2
All weights 100. c 100.0 100.0 100.0 100.0 100.0 100.0 100.0 100.0.
1,000 or less o.~ 0.5 0.3 0.4 0.5 0.4 0.9 0.5 0.2 l,ooi-l,500 ---”- 0.6 0.7 0.5 0.6 0.6 0.8 1.0 1,1 0.4 1,501-2,000 1.4 1.2 1.2 1.3 1,1 1.4 2.2 1.6 1.2 2,001-2,500 5.0 4..5 4.4 4.7 4.0 4.9 7.8 5.7 4.2
2,501-3,000-------------- 18.8 14.8 12.0 18.1 X5.3 12.1 25.8 18.7 12.0 3,001-3,500 38.7 33.7 28.0 58.6 33.3 28.0 39.0 34.9 28:0 3,501-4,000 26.6 29.1 31.6 27.4 30.2 31.1 18.3 26.3 31.7 4,W14,500-------------- 7.1 10.6 1.3.1 7.4 11.7 13.o 4.0 7.6 1.3.1 4,501 or more 1.4 4.9 8.9 1.4 5.3 8.4 1.0 3.7 9,1
2,500 or lesa 7.5 6.9 6.4 7.0 6.2 7.4 11.9 8.8 6.1 2,501 or more 92.5 93.1 93.6 93.0 93.8 92.6 88.1 91.2 93..9
Median weight (in grems)g 3,300 3,420 3,560 3,320 3,460 3,540 3,150 3,320 3,560
KSONATAL MCIRTALITY RATES
I I All weights 19.1 25.6 26.4 18.2 23.7 35.9 27.4 30.6 23.6
1 1 1 1
1,000 or leas 882.4 793.0 766.7 890.8 796.5 833.3 839.4 784.1 730.8 1,001-1,500 549.5 556.7 572.0 558.1 577.3 677.8 500.8 524.3 51.2.5 1,501-2,000 203.7 265.2 263.1 211.5 255.6 246.7 158.5 283.6 268.9 2,001-2,500 45.7 78.9 91.7 46.7 94.6 115.7 39.8 48.7 63.2
I I
2,501-3,000 11.2 23.5 27.4 11.2 22.4 35.2 11.2 25.6 24.7 32001-3,500 6.0 10.9 14.9 5.8 10.5 21.5 7.8 12.1 12.9 3,501-4,000 5.0 7.1 11.5 4.7 5.7 12.6 9.5 11.7 11.2 4,001-4,500 6.7 6.7 1.3.O 6.3 7.5 16.8 13.0 13.6 11.8 4,501 or more 1.3.o 15.3 16.4 10.8 13.7 20.5 44,1 21.5 1.5.2
2,500 or leas 169.5 211.6 191.3 171.6 223.6 238.4 157.5 188.5 173.72,501 or more 6.9 11.7 15.2 6.7 10.5 19.7 9.8 15.2 X5.9
lit ~~ assaed t~t all bi~~ in hospitalsor i~titutio~ .re attendedby physicianS.
. .2Percentsfor aUISWWY =OUPS were independentlycomputedand thereforedo not necessarilyequal exactlythe sum of the indlviduil-c~onent groupe.
‘Computedto nearest 10 grams on basis of originalreporti?igunits of pounds and ounces.

----------
-------
-----
Vol. 39, No. 1 WEIGHT AT BIRTH 21
The divergence in the weight distribution among white births did not become large until the upper level of immaturity (2,500 grams) was passed. But important differences from one attendant group to the other were observed starting with the lowest weight group for nonwhite births. Here the proportion of hospital births weighing 2,500 grams or less (11.9) was almost twice the figure for midwife deliveries (6.1).
Although some of the biases mentioned previously could have produced the cliffer ence in incidence of immaturity noted for the nonwhite birtbs, it is unlikely that they could account for the entire amount. A full explanation would have to cover such things as birth order of the children involved, and the distribution of fetal loss from the earliest stage of pregnancy.
At the other end of the birth weight scale, i. e., in the group weighing 4,501 grams or more, was concentrated a substantial proportion of both the white and nonwhite infants delivered by midwives. These cases were relatively less frequent among the de-liveries taken care of by physicians at home, and formed a very smali percentage of the hospitai births. A@@ the magnitude of the vsrisbiiity suggests that it is not entirely due to “artificial” factors but that other causes must be sought.
The record of survival among white births was greatly in favor of hospital events. The advantage over the nomnedically +tended births was especially marked in weight groups above 2,000 grams. In each of these weight intervals, the mortality rate among infants delivered by nomnedical persons was tio to four times that found among hospital deliveries. The ex&rience in the group handled by physicians at home fell between that in hospitals and that of midwives in most weight intervals.
In the nonwhite races, the neonatai mortality rate for all of the midwife deliveries was lower than the rates for deliveries in the other two attendant categories. The higher rate for hospital births is not entirely unexpected, in view of the relatively small proportion of midwife deliveries that fell at the low weights where the mortality risk was highest.
Actually, in the weights between 2,001 and 3,000 grams, within which the mortality rate declined precipitously, the neonatai loss among nonwhite babies delivered by midwives was twice that among the events in hospitals. It was only at weights above 4,500 grams that hospital births had a much higher rate. Births attended by physicians at home had a lower mortality rate than the nomriedically attended only in the weight gi’OUpS 2,001-2,500 and 3,001-3,500 grams.
Considering the weight specific rates, it is not surprising that among nonwhite births the over-all
neonstsl mortaiity rate standardized for weight is ,far more favorable for hospital births than for either of the other two categories.5 A comparison of standardized and unstandardized rates for the nonwhite birtis by attendant foiiows:
Attendant Standardized Unstandardized
Physician in hospital 24.6 27.4
Physicisa not in hospital 31.5 30.6
Midwife, other, and not specified 32.7 23.6
One of the interesting features of the weight specific rates among nonwhite births that occurred in hospitals was the exceptionally sharp increase as the babies’ weights entered the interval 4,501 grams or more. The rate for infants weighing this much (44.1) was even above the level for the weight interval 2,001-2,500 grams. Furthermore, the figure was much higher than the comparable rate in any other attendant group handling either white or nonwhite deliveries.
This situation more than any other relationship revealed by the data suggests a selectivity of difficult cases by both midwives and physicians for referral to ,hospitals. There is a distinct possibility that a sufficiently large number of attendants called for hospital aid when faced with difficulties in the delivery of the very large babies to affect seriously the rate for non-white hospitai births at this weight. The differences between doctors and midwives, in rates among home-deliveries, might also refiect the operation of a selectivity factor in favor of the midwife group.
Within each race, about the same proportion of the births delivered at home and in a hospital were members of plural sets. The advantage, previously discussxi, that went with hospitalization at time of birth held for both the single and the plural birth groups (table L). In view of the special problems that arise in the delivery of multiple births and in their care @er parturition, Mspi-on woulcl be expected to be a more important factor for these births than for single births. This is borne out by the experience in several of the weight groups-especially, among the nonwhite babies weighing 2,501 grams or more. How-ever, the+attern was not consistent throughout the weight range.
5For the white race there was virtually nd
difference between the standardized and unstandardized rates.

--------
--------
-----
--------------------
--------------------------------------------
-------------------------------------------------------
22 VITAL STATISTICS—SPECIAL REPORTS
TABLE L. NEONATALMORTALIti RATES AMONG BIRTHS IN HOSPITAISAND NOT IN HOSPITAIS, BY BIRTH WEIGHT, RACE, AND PLURALITY:UNITED STATES, JANUARY 1 90 MARCR 31, 1950
(Basedon deathswithinthefirst 28 days after birthamong childrenborn Jan.1toMar. 31, 1950. Ratesper 1,000 live births. Births and deaths withbirth weight not statedaredistributed. Excludesdata for Massachusetts)
WHITE NONWRITE
BIRTE WEIG6T(IN GRAMS) In Not in In Not In
hos- hos- hos- hospital pital pital pital
AMONG S NGLE BII !Rs
1,000 or less-- 887.7 796.3 853.2 772.1 1,oo1-1,500---- 571.3 610.2 510.1 512.8 1,501-2,000 235.9 269.S 154.2 271.5 2,001-2,500 49.3 106.4 40.9 69.1
2,500 or less-- 172.3 229.9 153.7 172,12,501 or more-- 6.6 12.1 9.8 14.0
RATES AMONG BIR!I!SSIN PLURAL SETS
1,000 or less-- 905.3 e26.9 770.8 700.0 1,oo1-1,500---- 502.1 558.8 454.5 541.7 1,501-2,000 124.5 194.4 177.8 2s4.s 2,001-2,500 27.9 130.5 72.1
2,500 or less-- 167.5 210.2 le2.8 221.8 116.5 110.12,501 or more-- 8.2
155.1 L40.s
%his rate is sub~ectto wide variability. Itis based on more than LOO births,but less than 20deaths.
SINGLE BIRTHS IN HOSPITALS
The birth weights considered thus far have been principally in 500 gram intervals, or slightly more than 1 pound. This was selected as the measuring unit to reduce the effect on comparisons of the errors associated with the weight information for births that occurred at home. Class intervals of 250 grams for single births in hospitals are introduced in this section for the weight range between 1,001 and 3,000 grams to discern more clearly the points atwhich marked changes in the rate of decline in mortality occur. While it would undoubtedly be desirable to measure in finer intervals, lack of control and specific knowledge about the errors that exist even in hospital data would make this highly questionable. Also, many of the
frequencies would be too low for close study. In emmining mortality differences between white
and nonwhite births that are delivered in hospitals, it should be kept in mind that the data are for all hospitals combined. The heterogeneity among hospitals in types of services availshle for handling prematurely born infants is probably reflected differentially in the figures for white and nonwhite hospital births.
The mortality data by race for single births in hospitals, shown in table M and figure 3, clearly indicate. the significance of relatively small increases in weight on the mortality rate. Among white babies, the addition of 250 grams to the birth weight of an in-. fant meant a large reduction in the mortality risk. From one 250 gram group to the next, over the range of weights between 1,751 and 3,000 grams? the mortality rate was cut approximately in half. It is” particularly noteworthy that at this stage of development in the special efforts to save the immature infant, the rate of decline in the neomtal loss was about the same over an interval which ticludes both prematurely born and mature babies. In the lower weights, percentage reductions were important ~t not as large.
A slowing down in the rapid rate of decline in mortality occurred when the weight group 3,001-3,500 grams was reached. As in the case for all births combined, the optimum weight interval among single white births in hospitals was 3,501-4,000 grams.
The downward sweep in the nonwhite mortality rate as ‘birth weight increased had a number of points
r~~ M. NEONATAL MORTALITY RATES AMONG SINGLEBIRTHS IN HOSPITALS,BY DETAILEDBIRTH WEIGHT ANDRACE: UNXCED STATES,JANUARY 1 5?0MARCH 31, 1950 “
(Basedon deathswithinthe first 28 days afterbirthemong childrenborn J&m.1to Mar. 31, 1950. Rateaper i,000 live births. Births and deaths withbirth weightnot stated are distributed. Excludesdata for Massachusetts)
BIRTH WEIGET All Non-White(IN GW) races white
All weights
1,000 or less 1,001-1,250 l/251-l jam-----------1,501-1,7501,751-2,0002,001-2,2502,251-2,500
2,501-2,750 2,751-3,030 3,001-3,500 3,501-4,000 4,001-4,500 4,501 or more---------
17.5 16.7 25.1
882.0 e87.7 853.2 660.2 668.1 614.4 480.1 489.5 430.9 297.6 315.4 203.1 181.6 191.6 3-25.5 81.9 84.2 67.4 35.5 36.0 32.4
16.2 16.6 13.8 8.4 8.3 9.5 6.0 5.8 7.8 5.0 4.7 9.5 6.6 6.3 ‘12.7
1.3.O 10.8 44.1

Vol. 39, No. 1 WEIGHT AT BIRTH. 23
-..
NEONATAL MORTALITY RATES AMONG SINGLE BIRTHS Ihi HOSPITALS, BY DETAILED BIRTH WEIGHT AND RACE:
UNITED STATES, JANUARY I TO MARCH 31, 1950
1,000
800
600 —
400
\\
~ 200 I + g m Nonwhite >’>
* w = 100 J
80
Elo–- , 66
a uCL /
40 /
w i-a K
20 /
10 J
8
6
4 I I I I I I I I I I I
I,CXM (ool- lj?51- 1,501- [,75 1- 2,001 - 2,251- 2#01- 2,751 - 3,001 - 3,501 - 4,001- 4,501 Or I*SS 1,250 1,500 1,750 2,000 2~50 2300 2,750 3,OOO 3300 4,000 4,500 or mort
BIRTH WEIGHT (in warns)
See note on figure 2,.
of similarity to the pattern shown by the rates for white births. However, it will be noted that the gap between the ltnes representing white and nonwhite rates in figure 3 widens as the weights increase from 1,000 grams or less to 1,501-1,750. In view of the semilogarithmic scale used, this indicates a relatively steeper rate of decltie h“ nonwhite mortality over the wei@t interval. The drop in mortality among nonwhite btrths was so sharp that the rate in the weight group 1,501-1,750 was approximately the same’ as for white babies in the next higher 250 gram interval. After 2,000 grams, however, the rate of decline was generally in favor of the white births, and the mortality curves for white and nonwhtte single btrths occurring in hospitals cross fn the neighborhood of 2,75o grams. The curves then diverged rapidly.
The influence of gestation age on neonatal mortality was examtned for as at-curate a set of detailed data as is now available on a nationwide basis. These
statistics relate to single white births delivered in hospitals. To avoid irregularities tn the series due to small frequencies and known deficiencies, consideration was limited to three gestation-age intervals (23-31, 32-35, and 37 weeks and over) over the weight span 1,501 to 3,500 grams.
Figure 4 illustrates how important a factor gestation age was, particularly when the birth weight approached the upper weight level of immaturity. In the we:ght group 1,501-1,750, the loss among infants of gestations of 37 weeks and over was about two-thirds the mortality tn the 28-31 weeks group. With increasing weight, the mortality rate declined sharply in each of the gestation groups. But, the decrease was so much more rapid among the babies who were mature according to the gestation criterion tht the rate for thts group at weight 2,251-2,500 grams was only one -ftfth the corresponding figure for babies of 23-31 weeks. of gestatiom In fact, mortalitg among

------------------------
24 VITAL STATISTICS-SPECIAL REPORTS
FIGURE 4
SUMMARY NEONATAL MORTALITY RATES AMONG SINGLE WHITE
BIRTHS IN HOSPITALS, BY DETAILED BIRTH WEIGHT Statistics on maturi~ at birth derived from vital
AND SPECIFIED GESTATION GROUPS: UNITED STATES, records relating to babies born in the United States JANUARY I TO MARCH 31, 1950 durhg the first 3 months of 1950 and neonatal deaths
among this group, provided the following information;400
‘h
.. 1. Of tie total number of children born, 7.4 per-cent weighed 2,500 grams or less. Nonwhite
%. babies weighed on the average 50 grams less ..
“i than the white, and greater proportions of non
.. ... white infants were born at the very low and
g 100 — %—1-
%. very high weights where the mortality risk isIx 80
%. greatest. Over one-half of the liveborn chilz %.. dren in plural deliveries weighed 2,500 gramsu 60 \ or less as compared with only 6.4 percent in~ ...J %. single births. Female babies weighed on the 0 40 average 130 grafns less than male. 0 _.
c
... %.
% ..% 37 weeks ond over
2. Median weights for children in single births were less than 2,500 grams at gestation age
u c1
%../ groups under 36 weeks, and were over 2,500 grams at gestations of 3’7 weeks and over. However, appreciable. proportions of the chil-dren at some of the gestation ages considered premature weighed over 2,500 grams, and about half of the infants below this weight were reported as born at or near full term.
6 =..%..%.
%; 3. The neonatal mortality rate among infant$
weighing 2,500 grams or less at birth was 173.7 per 1,000 as compared with 7.8 per 1,000 among all other children. Mortality
0
1,501 - I,75L 2,001. 2,251- 2,501 - 2,751- 3,001. declined sharply with relatively small in-1,750 2,000 2,250 2,500 2,750 3,090 3,500
creases in weight until well past the pre-BIRTH WEIGHT (i. grad maturity weight level with the optimum weight ,
See no?e on figure 2. for survival falling at 3,501-4,000 grams. Marked increase in weight beyond this point was an important liability. At the low weights where the risk of mortalitj is great, nonwhite
the latter group of infants was as high as the rate infants had a somewhat better chance for for infants of gestation ages of 37 weeks and over survival than the white. However, at almost who weighed 500 grams or less at birth. The same all of the mature weights the risk among non-disparity continued well into the mature weight groups white births was considerably higher. Moras indicated by the following: tality among plural births was below that
among single births at the weights between 1,001 and 3,000 grams but higher at weights
28-31 32-35 37 weeks above 3,000 grams. At all “but the very high weeks weeks and over andvery low weights, the mortality risk was far
greater for male births than for female. The 1,501-1,750 grams . ..- 382.9 253.8 243.9 over-all neonatal mortality rate among males 1,751-2,000 grams 315.3 192.8 115.2 was about one-third above the rate for fe-2,001-2,250 grams 195.5 108.2 57.7 males. 2,251-2,500 grams 125.4 71.9 27.0 4. Children born in hospitals weighed on the .aw 2,501-2,750 grams 103.4 52.3 13.9 erage less at birth than those delivered at 2,751-3,000 grams 76.1 44.4 7.4 home (part of this difference may be due to 3,001-3,500 grams 40.5 23.1 5.5 biases in reporting in the nonhospital group).

------------------------
-----------------
Vol. 39, No. 1 WEIGHT AT BIRTH
Mortality among white infants delivered by nonmedical persons was two to four times 5. hat for hcspital deliveries at all weights above 2,000 grams. Among nonwhite births, the rates for hospkd deliveries were substantially lower than those for midwife deliveries at weights of 1,501 to 3,000 grams, but were much higher at weights above 4,500 grams. The latter suggests a selectivity of difficult
REFERENCES
25
cases for referral to hospitals.Gestation age as well as birth weight has aconsiderable influence on the survival of thenewborn. Generally, the heavier babies ateach gestation age level fared better thanthe lighter ones; and sfmilarly among children falling in the same weight group, thoseat gestations at or near term bad the mostfavorable mortality experience.
The most completeset of referencesavailabletoday on studiesrelatedto birth weight and gestationageisfoundinDr. Ethel C. Dunham’sbook, “PrematureM-t” (Edition2,Paul B. Hoeber, Lnc., Publishers,in Press). A selectedgroup of referencesvhich are particularlyrelevantto a number of the statementsmade in this ccrticlefollows:
(1)
(2)
(3)
(4)
(5)
(6)
(7)
(8)
McKeown,Thomas, and Gibson, J. R., “Observations on AU Births (23,970)in Birmingham,1947,”British JournalaF SocialMedicine,vol. 4(4), pp. 221-233,October 1950; vol. 5(2), pp. 98-112,April 1951; vol. 5(3), pp. 177-183,July.1951; also, British Medical Journal,pp. 513-517, September 1951.l!aback,Matthew, “BirthWeight ad Length of GestationWith Relationto Prematurity,” The Journal of the AmericanMecllcalAssociation,vol. 146, pp. 897-901,July 7, 1951.Bunfiesen, et al., ‘!Progressin the Preventionof Needless NeonatalDeaths,” AnnualHerman l’?.,Report of the ChicagoHealth Department,1951.Potter,Edith L., anclFuller, HarolFi, “MultiplePregnancies at the Chicago Lying-InHospital1941to 1947,” American Journalof Obstetricsand G~ecology, vol. 58(1), pp. 139-146,July 1949.Eastman,Nicholson J., “Prematurity From the Viewpoint of the Ob’ztetrician,” Americen Practitioner,vol. 1(7), pp. 343-352,March 1947.Amierson,Nina A., Brown, Estelle W., anfiLyon, R. A., “Causes of Prematurity,” American Journal of Diseases of children,vol. 65(4), pp. 523-534,April 1943.Public Health Conferenceon Records anfiStatistics,AssociationcfMaternal.and Child Health anfi
Children Directors,FeileralSecurity Agency-Ohild.ren’Cripplefi a Bureau anfiNational Office ofVital Statistics,“Recommendationsfor DevelopingComparableStatisticson PrematurelyBorn In- ,,fants =tl NeonatalMortality,” National Office Vital Statistics,1950.—9—— “SuggesteclTabulationsd!Statisticsm Birth Weight anfiRelatefiCEaracteristics for Live Birt~s amilNeonatalDeaths,” National Office of Vital %atistics, 1952.
SYMBOLS USEO IN SPECIALREPORTS
Class or item not applicable(threefiots)----------------------------...Data not available (threedashes)------------------------------------QuantityIs zero, in frequencytables (one dash) -Quantityis zero, in rate or percent tables (one cipher)------------- oIf rate or percent is more than O but less than 0.05 0.0If both frequencyemfipopulationbase are zero in rate or percenttables (one aash)---------------------------------------------------

-----------------------
------------------------------------------------
--------------------------------------------------
-----------------------
-----------------------
2,6 VITAL STATISTICS-SPECIAL REPORTS
TASLE 1. LIVE BIRTHS AND NEONATAL DEATHS, BY BIRTH WEIGHT, RACE, SEX, AND PLUFALITY: UNITED STATES, JANUARY 1 TO K4.RCS31, 1950
(Neonatal deaths include deaths within the first 28 days after birth among children born Jan. 1 to M&. 31, 1950.Births and deaths with birth weight not stated are distributed. Excludes data for Massaohusetts)
BIRTS WEIGHT(IN GR4MS)
All weights-----------------
000 or less 1 001-1,500-------------------------1,501-2,000-------------------------2,001-2,500-------------------------
2,501-3,000-------------------------3,031-3,500-------------------------3,501-4,000-------------------------4,001-4,5004,501 or more
All weights-----------------
1,000 or less-----------------------1,001-1,500-------------------------1,501-2,000-------------------------2,001-2,500-------------------------
\2,501-3,000-------------------------3,001-3,500-------------------------3,501-4,0004,001-4,5004,501 or more-----------------------
All weights-----------------
1,000 or less 1,001-1,500-------------------------1,501-2,000--------------------------2,001-2,500-------------------------
2,501-3,000-------------------------3,001-3,500-------------------------3,501-4,000-------------------------4,001-4,500-------------------------4,501 or more
BIRTSS NEONATAL DEATHS
White Nonwhite White Nonwhite
Male Female Male Female Male Female Male Female
TOTAL
368,37S 348,755 61,128 59,525
1,621 1,568 393 346 2,121 1,958 465 537 4,480 4,726 1,021 1,161 15,034 18,426 3,433 4,347
54,833 72,073 11,211 13,691 133,719 139,566 21,149 21,195 112,366 86,023 15,561 12,789 35,564 20,189 5,172 3,583 8,640 4,226 2,723 1,876
7,952 I 5,569 1,799 I 1,4211
I I 1,4671,3641,2181,039
8731,02153324493
1,350 334 273 929 244 264 758 240 187 654 206 179
655 223 161 682 231 17s 349 190 108 130 68 41 62 63 30
4,971 1,601 1,265
1,093 279 233 751 201 218 656 179 153 615 187 158
645 213 150 674 224 176 345 188 107 130 67 40 62 63 30
I
598 198 156
257 55 40 178 43 46 102 61 34 39 19 21
10 10 11 8 7 2 4 2 1
1 1
SINGI.E
361,233 341,733 59,583 I 58,069 I 7,212
1,352 1,278 325 288 1,222 1,775 1,533 374 446 1,151 3,599 3,600 809 938 1,060 13,018 16,304 3,011 3,892 953
52,630 70,033 10,793 13,295 $47 132,559 138,715 20,912 21,030 1,013 112,138 85,890 15,488 12,742 631 35,528 20,155 5,154 3,566 242 8,634 4,225 2,717 1,872 93
IN PLUPAL SETS
I
7,145 7,022 1,545 1,456 740
269 290 68 58 245 346 425 91 91 213 881 1,126 212 223 158
2,016 2,122 422 455 86
2,203 2,040 418 396 2s 1,160 851 237 165 8 228 133 73 47 2 36 34 18 17 2 6 1 61 41 -1 -1 -1 -

----
----
-------------
------------------
-------------
-------------
-------------
-------------
------------------
-------------
Vol. 39, No. 1 .=WEIGHT AT BIRTH 27
TABLE 2. LIVE BIRTHS BY BISTS WEIGHT, WEEKS OF G2S9XCION, RACE, SEX, AND PLURALITY: UNIIEIlSTATESJANUARY 1 TO MARCH 31, 1950
(Births with birth.weight or gestation not stated are distributed. Excludes births to residents of Massachusetts)
BISTB WEIGET(IN GRAMS)AND SEX
Both sexes--------
1,000 or less-------------1,001-1,500---------------1,501-2,000---------------2,001-2,500---------------
2,501-3,000---------------3,001-3,500---------------3,501-4,000---------------4,001-4,500---------------4,501 or mOre
Male
1,000 or less 1,001-1,500---------------1,501-2,000---------------2,001-2,500---------------
2,501-3,000---------------3,001-3,500---------------3,501-4,000---------------4,001-4,500---------------4,501 or mOre
Female----------------
1,000 or less-------------1,001-1,500---------------1,501-2,000---------------2,001-2,500---------------
2,501-3,000---------------3,001-3,500---------------3,501-4,000---------------4,001-4,500---------------4,501 or mOre
> Both sexes--------
1,000 or less-------------1,001-1,500---------------1,501-2,000---------------2,001-2,500---------------
2,501-3,000---------------3,001-3,500---------------3,501-4,000---------------4,001-4,500---------------4,501 or mOre
Male
1,000 or less-------------1,001-1,500---------------1,501-2,000---------------2,001-2,500---------------
2,501-3,000---------------3,001-3,500---------------3,501-4,000---------------4,001-4,500---------------4,501 or mOre
WHITE NONWHITE
37 37Under Under
28-31 32-35 36 weeks 28-31 32-35 36 weeks28 28
weeks weeks weeks and weeks weeks weeks endweeks weeksover over
!lY3TAL BIRTES —-
4,064 6,024 14,537 55,796 636,712 965 1,564 2,522 15,039 100,563
2,415 584 108 14 68 507 155 30 16 31 1,123 1,616 869 151 320 261 404 172 47 118
261 1,975 3,232 1,262 2,476 90 530 591 304 667 65 1,098 4,8S5 5.,507 21,905 26 299 848 1,384 5,223
56 323 2,902 10,579 113,046 19 79 423 2,636 21,745 83 219 1,684 18,753 252,546 19 50 299 4,615 37,361 44 1%5 619 14,039 183,562 31 28 100 3,837 24,354 15 68 199 4,270 51,201 3 15 44 1,403 7,290 2 16 39 1,221 11,5ss 9 4 15 797 3,774
2,1S9 3,255 7,“641 28,597 326,696 506 770 1,189 7,627 51,036
1,242 289 49 10 31 267 86 16 9 ls 647 862 413 72 127 128 178 79 25 55 164 1,071 1,609 567 1,069 45 260 269 146 301 38 639 2,584 2,708 9,065 15 157 399 630 2,232
24 166 1,581 4,880 48,182 16 45 192 1,253 9,705 44 111 942 9,165 123,457 9 26 151 2,267 18,696 21 67 328 7,731 104,219 19 13 51 2,037 13,441 s 41 111 2,676 32,728 3 4 26 794 4,345 1 9 24 7ss 7,818 4 1 6 466 2,246
1,875 2,769 6,896 27,199 310,016 459 794 1,333 7,412 49,527
1,173 295 59 4 37 240 69 14 7 16 476 754 456 79 193 133 226 93 22 63 97 904 1,623 695 1,407 45 270 322 158 366 27 459 2,301 2,799 12,840 11 142 449 754 2,991
32 157 1,321 5,699 64,864 3 34 231 1,383 12,040 39 X08 742 9,588 129,089 10 24 148 2,348 18,665 23 58 291 6,308 79,343 12 15 49 1,800 10,913 7 27 88 1,594 18,473 u 18 609 2,945 1 7 1.5 433 3,770 5 3 9 331 1,52S
SINGLE BIRTHS
3,515 5,277 12,929 54,056 627,189 827 1,420 2,277 14,602 98,526
2,029 449 82 11 59 419 127 25 14 28 998 1,337 666 97 210 22d 364 137 28 67 236 1,716 2,621 923 1,703 85 468 4s5 241 458 60 1,037 4,340 4,788 19,097 20 290 773 1,227 4,593
53 313 2,723 10,153 109,421 17 77 397 2,523 21,074 80 ’218 1,646 18,593 250,737 19 50 293 4,558 37,022 43 124 616 14,009 183,236 31 26 99 3,818 24,256 14 67 196 4,261 51,145 3 14 43 1,398 7,262 2 16 39 1,221 11,581 9 4 1.s 795 3,766
1,909 2,869 6,823 27.728 321,904 429 695 1,068 7.399 49,992
1,060 218 39 7 28 221 70 11 9 14 574 732 322 47 100 108 160 62 13 31 148 935 1,334 428 754 42 227 226 112 202 35 599 2,2S3 2,332 7,769 9 151 363 549 1,939
22 i59 1,471 4,661 46,317 14 43 174 1,199 9,363 42 111 914 9,083 122,409 9 26 149 2,236 18,492 20 66 326 7,711 104,015 19 13 51 2,023 13,382 7 40 110 2,671 32,700 3 4 26 793 4,328 1 9 24 788 7,812 4 1 6 465 2,241

----------------
---------------
----------------------------
----------------------------
---------------
-------------
------------------
----------------------------
-------------
-------------
28 VITA L STATISTICS—SPECIAL REPORTS
TABLE 2. LIVE BIRTHS BY BIRTH WEIGHT, WEEKS OF GESTATION, RACE, SEX, AND PLURALITY: UNITED STATES, JANUARY 1 TO MARCH 31, 1950—Cent inued
(Births with birth weight or gestation not stated me distributed. Excludes births to residents of Massachusetts)
WHITE NONWHITE
BIRTS WEIGET37 37(IN Gm4s ) Under
2S-31 32-35 36 weeks Under
28-31 32-35 3s weeksAND SFX 2s 2sweeks weeks weeks and weeks weeks weeks endweeks weeks
over over
SINGLE BIRTHS—Continued
2,501-3,000--------------- 31 154 1,252 5,492 63,104 3 34 223 1,324 11,711 3,001-3,500--------------- 38 107 732 9,510 128,328 10 24 144 2,322 18,530 3,501-4,000--------------- 23 58 290 6,29S 79,221 12 13 48 1,795 10,874 4,001-4,500 7 27 86 1,590 18,445 10 17 605 2,S34 4,501
Female 1,606 2,408 6,106 26,328 305,285 398 725 1,209 7,203 48,534
1,000 or less------------- 969 231 43 .4 31 198 57 14 5 14 1,001-1,500 424 605 344 50 110 116 204 75 15 36 1,501-2,000--------------- 8S 781 1,2S7 495 949 43 241 269 129 256 2,001-2,500--------------- 25 43s 2,057 2,456 11,32S 11 139 410 678 2,654
or more T7 15 433 3,769 5 3 9 330 1,5251
BIRTHS IN PLUBAL SETS
Both sexes-------- 549 747 1,608 1,740 9,523 138 144 245 437 2,037
1,000 or less 3S6 135 26 3 9 8S 28 5 2 3 1,001-1,500 125 279 203 54 110 37 40 35 19 51 1,501-2,000--------------- 25 259 611 339 773 5 62 96 63 209 2,001-2,500 5 61 545 719 2,808 6 9 75 157 630
2,501-3,000--------------- 3 10 179 426 3,625 2 2 26 113 671 3,001-3,500--------------- 3 1 38 160 1,809 6 57 359 3,501-4,000--------------- 1 1 3 30 326 2 1 19 S8 4,001-4)500--------------- 1 1 3 9 56 1 1 5 28 4,501 or mOre 7 2 8
Male 280 386 818 869 4,792 77 75 121 228 1,044
1,000 or less 182 71 10 3 3 46 16 5 1 1,001-1,500 73 130 91 25 27 20 18 17 12 24 1,501-2,000--------------- 16 136 275 139 315 3 33 43 34 99 2,001-2,500--------------- 3 40 301 376 1,296 6 6 36 81 293
2,501-3,000--------------- 2 7 110 219 1,865 2 2 18 54 342 3,001-3,500--------------- 2 28 82 1,048 2 31 204 3,501-4,000--------------- 1 1 2 20 204 14 59 +,001-4,500--------------- 1 1 1 5 28 ~. - 1 17 4,501 or mOre 6 1 5
Female---------------- 269 361 790 871 4,731 61 69 124 209 993
1,000 or k=s------------- 204 64 16 6 42 12 2 2 1,001-1,500--------------- 52 149 112 29 83 17 22 18 7 27 1,501-2,000--------------- 9 123 336 200 458 2 29 53 29 110 2,001-2,500--------------- 2 21 244 343 1,512 3 39 76 337
2,501-3,000--------------- 1 3 69 207 1,760 8 59 329 3,001-3,500--------------- 1 1 10 7s 761 4 26 135 3,501-4,000--------------- 1 10 122 2 1 5 39 4,001-4,500--------------- 2 4 28 1 1 4 11 4,501 or more 1 1 3
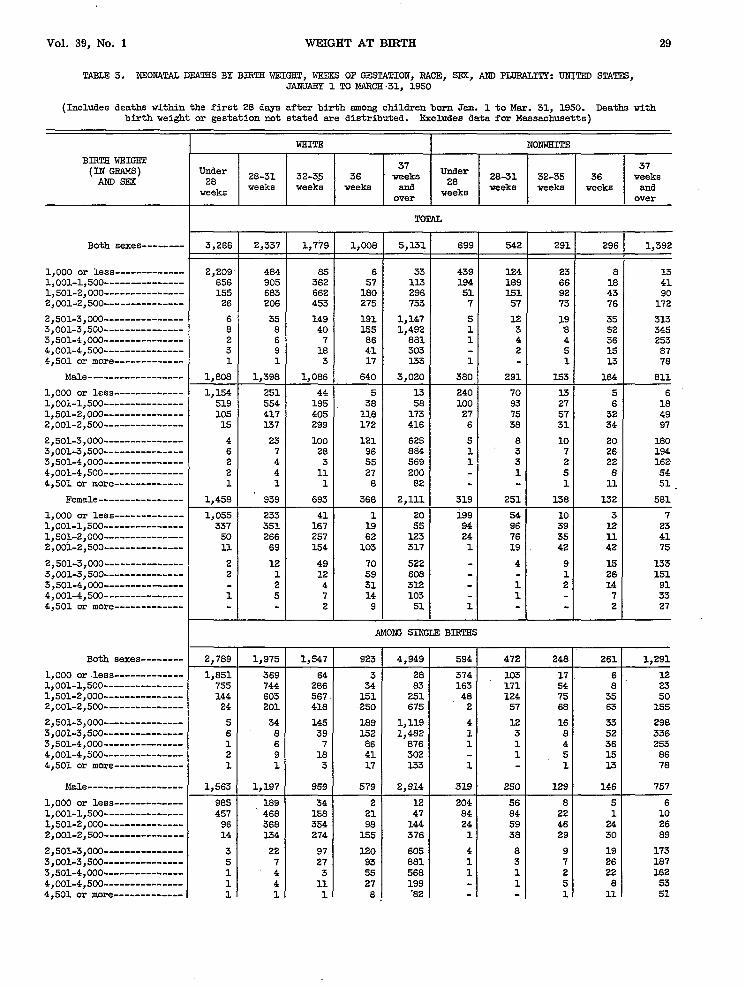
-------------
------------------------------
---------------
-------------
---------------
-------------
---------------
-------------
---------------------------------------------
-------------
-------------
---------------
---------------
-------------
Vol. 39, No. 1 WEIGHT AT BIRTH 29
TmIal 3. NEOMW’ALDEATSS BY B16TE WEIGHT, NEXKS OF GELYLATION,RACE, Sl!x, AND TmRAmrY: UNITELI STATES, JANUARY 1 TO MARCH .31, 1950
(Includes deaths within the first 2S days after birth among children born San. 1 to Mar. 31, 1950. Deaths withbirth veight or gestation not stated ere distributed. ExcludeB data for Massachusetts)
WHITE! NONWHITE
BIRTE WEIGST37 37(IN GRAMS) Under
28-31 32-3.5 36 weeks Under 2831 32-35 36 weeks
AND SEX 28 28weeks weeks weekB alla veeka weeks weeke Snaweeks weeks
Both sexes--------
1,000 or less1,001-1,500---------------1,501-2,0002,001-2,500
2,501-3,000---------------3,001-3,500---------------3,501-4,0004,001-4,500---------------4,501 or more
Male------------------
1,000 or less-------------1,001-1,500---------------1,501-2,000---------------2,001-2,500
2,501-3,000---------------3,0013,500---------------3,501-4,000---------------4,001-4,500---------------4,501 or more
Female----------------
1,000 or less-------------1,001-1,500---------------1,501-2,0002,00!i-2,500---------------
2,501-3,000---------------3,001-3>500---------------3,501-4,000---------------4,001-4,500---------------4,501 or more
Both sexes--------
1,000 or less-------------1,001-1,5001,501-2,0002,001-2,500
2,501-3,000---------------3,001-3,500---------------3,501-4,0C&--------------4,001-4,s00----------------4,501 or more
Male------------------
1,000 or lef3s1,001-1,500---------------1,501-2,0002,001-2,500---------------
2,501-3,0003,001-3,500---------------3,501-4,COB---------------4,001-4,500---------------4,501 or mOre
over
3,266 2,337 1,779 1,008 5,3.31 699 542
2,209 484 S5 656 905 362 155 683 662 26 206 453
6 35 149 8 8 40 2 6 7 3 9 1s 1 1 3
1,808 1,398 1,086
1,154 251 44 519 554 195 105 417 405 15 137 299
4 23 100 6 -1 28 2 4 3 2 4 11 1 1 1
1,458 939 693
1,055 233 41 337 351 167 50 266 257 11 69 X54
2 12 49 2 1 L2
2 4 1 5 7
2
2,7S9 1,975 1,547
1,851 369 64 755 744 206 144 603 567. 24 201 4X8
5 34 145 6 8 39 1 6 7 2 9 18 1 1 3
1,563 1,197 959
9s5 189 34 457 468 158 96 3S8 354 14 134 274
3 22 97 5 7 27 1 ‘4 3 1 4 11 L 1 1
6 33 439 124 .37 11.3 184 189 180 29S 51 151 275 733 7 57
191 1,147 5 12 155 1,492 1 3 86 881 1 4 4’1 303 2 17 133 1
640 3,020 380 291
5 n 240 70 38 58 100 93 118 173 27 75 172 416 6 38
121 625 5 8 96 8S4 1 3 55 569 1 3 27 200 1 8 82
368 2,111 319 251
1 20 129 54 19 55 94 96 82 123 24 76 103 317 1 19
70 522 4 59 608 31 312 1 14 103 1 9 51 1
AMONS SINGLE Bml!ss
923 4,949
3 2834 83El 251250 675
189 1,119152 1,48286 87641 30217 133
579 2,914
2 1221 4798 144
1.55 376
120 60593 88155 ,5ss27 1998 ’82
594 I 472
T374 103163 17148 L242 57
4 121 31 1
11
319 I 250
T204 5684 8424 591 38
4 81 31 1
1
over
291 296 1,392
23 8 13 66 18 41 92 43 90 73 76 172
L9 35 313 a 52 345 4 36 253 5 15 87 1 13 78
153 164 811
13 5 6 27 6 18 57 32 49 31 34 97
10 20 180 7 26 194 2 22 162 5 8 54 1 11 51.
138 132 581
10 3 7 39 12 23 35 11 41 42 42 75
9 13 133 1 26 151 2 14 91
7 33 2 27
248 2s1 1,291
17 6 12 54 8 23 75 35 50 68 63 155
16 33 298 8 52 336 4 36 253 5 I-5 86 1 13 78
129 146 757
8 5 6 22 1 10 4s 24 26 29 30 89
9 19 173 7 26 187 2 22 162 5 8 53 1 11 51

----------------
-------------------------------------------
-------------
---------------
------------------------------
------------------
---------------
---------------
---------------
-------------
30 VITAL STATISTICS-SPECIAL REPORTS
TABLE 3. NZOit4TAL DEATSS BY BIRTH WEIGHT, WEEKS OF GESTATION, BACE, SEX, AND PLURALIIZ: UNITED STATES, JANUARY 1 TO MARCH 31, 1950-Continued
(Eke headnote on p. 29)
WHI!EZ NONWHITEI 1 1 #BIRTH WEIGST
37 37(IN GRAMS) Under 28-31 32-35 36
Un6er 28-31 32-35 36AND SEX 28 weeks
2s weeks
weeks weeks weeks weeke and
weeks weeks weeks weeks and
over over
MOW SIICLE BISTHS-Cent inued
4’--= 1,000 or less S66 180 30 1 16 170 47 9 1 6 1,001-1,500 298 276 128 13 36 79 07 32 7 13 1,501-2,000 48 235 213 53 107 24 65 29 11 24 2,001-2,500--------------- 10 67 144 95 299 1 19 39 33 66
Female 7-IS 58s 344 2,035 27’5 222 119
2,501-3,0CK3--------------- 2 12 48 69 514 4 7 14 125 3,001-3,500--------------- 1 1 12 59 601 1 26 149 3,501-4,000---------------
1,226
T4 31 30s
1 r2 I
27
2 2 14 914,001-4,500--------------- 1 5 7 14 103 -
2 T51 L . 7 33 4,501 or more 9
AMONG BIRTHS IN PLURAL SETS
Both sexes-------- 477 362 232 1s2 7( 101
1,000 or les8------------- 35E 115 21 ~ 65 2: 2 1 l,ool-l,5m 101 161 76 3C 31 1< lC 1s 1,501-2,”000--------------- 11 80 95 45 3 2; e 40 2,001-2,500--------------- 2 5 35 5s 5 13 17
2,501-3,000--------------- 1 1 4 28 1 2 15, 3,001-3,500--------------- 2 1 10 9 3,501-4,000 1 5 :
4,001-4,500 1 1 1 1 4,501 or more------------- -
Male 245 201 127 106 61 41 18 54
1,000 or le8s------------- 169 62 10 3 1 36 14 5 1,001-1,5G0--------------- 62 86 37 17 11 16 9 5 5 8 1,501-2,000--------------- 9 49 51 20 29 3 16 11 8 23 2,001-2,500--------------- 1 3 25 17 40 5 . 2 4 8
2,501-3,000--------------- 1 1 3 1 20 1 1 1 7 3,001-3,500--------------- 1 1 3 3 7 3,501-4,000 1 1 . 2 4,001-4,500--------------- 1 - 1 1 4,501 or more------------- - -
Female---------------- 232 161 105 24 76 44 29 19 17 47
1,000 or less------------- 189 53 11 4 29 7 1 2 1 1,001-1,500 39 75 39 6 19 15 9 7 5 10 1,501-2,000--------------- 2 31 44 9 16 11 6 17 2,001-2,500--------------- 1 2 10 8 18 3 9 9
2,501-3,COB--------------- 1 1 s 2 1 0 3,ml-3,500--------------- 1 - 7 . 2 3,501-4,000 4 1 4,001-4,500--------------- 1 4,501 or more -

10T
Vol. 39, No. 1 WEIGHT AT BIRTH 31
TABE3 4. LIVE BIRTSS AND NEONATAL ‘DEA~S,,BY BIRTE WEIGST, RACE, AND ATPENOANT AT BISTE: UNTTEO STATES,JAIK7ARY1 TO MARCH 31, 19S0
(Neonatal deaths include deaths within the first 28 days after birth SISOIISchildren born Jan. 1 to Mar. 31, 1950.Births and deaths with birth weight not stated are distributed. Excludes data for Massachusetts)
Am BACES II WHITE NoNwHIm
BIRTE WEISHTrnys 2(IN GRAMS) Physician Physician M:~ ‘ Physician -’---’cian “:=’ Physicieu Physician
Midwife,
in not in in n’ in in not in other,and not and not and not
hospitall hospital specified
hospitall nospital specified
hospitall hospital specified
BIRTHS
All weights- 725,226 65,406 47,154 65S.295 47.846 10,992 36.162
1,000 or less--- 3,494 314 1.20 2,921 226 42 573 S8 76 1,001-1,500----- 4,355 476 250 3,698 291 90 657 1s3 160 l,501-2,0CM3----- 10,007 807 574 8,524 532 150 1,483 275 424 2,001-2,500----- 36,238 2,940 2,062 30,990 1,934 536 5,246’ 1,006 1,526
2,501-3,000----- 136,481 9,663 5,664 119,198 6,383 1,325 17,283 3,260 4)339 3,001-3,500----- 280,371 22,052 13,206 254,291 15,919 3,075 26,0S0 6,133 10,131 3,501-4,000----- 192,607 19,041 14,891 180,548 14,426 3,415 12,259 4,615 11,476 4,001-4,500----- 51,437 6,904 6,167 48,746 5,576 1,431 2,691 1,328 4,736
.,4,501or more--- 10,036 3,209 4,220 9,379 2,559 928 657 650 3,292
NEONATAL DEATSS
I I I
==4== 1
I I
I
1,000 or less--- 3,083 249 92 2,602 180 35 481 69 57 1,oo1-1,500----- 2,393 265 143 2,064 168 61 329 97 82 1,501-2,000----- 2,038 214 151 1,803 136 37 235 78 114 2,001-2,500----- 1,657 232 189 1,448 183 62 209 49 127
2,501-3,000----- 1,530 227 155 1,337 143 48 193 84 107 3,001-3,500----- 1,674 241 197 1,470 167 66 204 74 131 3,501-4,000----- 973 136 171 857 82 43 116 54 126 4,001-4,500----- 343 60 80 308 42 24 35 18 56 4,501 or mOre--- 130 49 69 101 35 19 29 14 50
All weights- 1,247 11,990 1.X56 395 I 1.831 537 852
lIt is assumed that all births in hospitals or institutions are attended by physicians.

---------------------------------------
----------------------------------------------------------------------------
---------------------------------------
---------------------------------------
-------------------------------------
----------------------------------------------------------------------------
32 VITAL STATISTICS-SPECIAL REPORTS
TABIE 5. LIVE BISTSS ANO NEONATAL DEATSS, BY BIRTH WEIGRT, RACE, A’T&ZNDANTAT “BIRTH,AND PLUP.AUTI:UNITEIlSTATES, JANUARY 1 TO MARCH 31, 1950
(Neonatal deaths include deaths within the first 28 days after birth among children born Jan. 1 to Mar. 31, 1950.Births and deaths with birth weight not stated are distributed. Excludes data for Maeeachusetts)
WHITE NONWHITE
BIRT6 KEIGWi7(IN GRAMS) Physician Physician
Midwife, Physician Physician
Midwife,
in not in other,
in not.in other,
end not and nothospitall hospital specified
hospitall hoepital specified
SING~ BIRTHS
All weighte-------------------------------
1,000 or lees------------------------------------l,ool-l,5001,501-2,OOO---------------------------------------2,001-2,500---------------------------------------
2,501-3,OOO---------------------------------------3,001-3,500--------------------------------------3,501-4,ooo-------------------------*------------4,001-4,5004,501 or more
All weighte -------------------------------
1,000 or less------------------------------------l,ool-l,5m 1,501-2,OOO---------------------------------------2,001-2,500---------------------------------------
2,501-3;OOO---------------------------------------3,001-3;500--------------------------------------3,501-4,ooo---------------------------------------4,001-4)500---------------------------------------4,501 or more--------------------------------—---
All weights-------------------------------
1,000 or less------------------------------------l,ool-l,5001,501-2,OOO---------------------------------------2,001-2,500---------------------------------------
2,501-3,OOO---------------------------------------3,001-3,500--------------------------------------3,501-4,ooo---------------------------------------4,001-4,500---------------------------------------4,501 or more
All weights-------------------------------
1,000 or less------------------------------------l,ool-l,500--------------------------------------1,501-2,OOO---------------------------------------2,OOl-2,5OO-------------------------------------a-
2,501-3,OOO---------------------------------------3,001-3,500--------------------------------------3,501-4,ooo---------------------------------------4,001-4,5004,501 or more
645.343 46,831 10,792—
2,414 180 36 2,995 231 S2 6,661 41.5 123 27,197 1,642 485
115,266 6,113 1,284 252,489 15,754 3,031 180,253 14,379 3,’396 48,692 5,561. 1,430
2,5569,376 T927
65,202 17,094
477 72547 151
1,213 2024,690 8S2
16,800 3,15325,902 6,06412,233 4,5952,683 1)325657 650
NEONATAL DEATESAMONGSINGIKlBIRTHS
10,790 1,023 370 1,635 478
2,143 143 29 407 59 1,711 135 56 279 76 1,571 114 31 167 64 1,342 169 57 192 43
1,306 =8 48 189 77 1,459 165 63 202 72 851 62 43 116 53 306 42 24 34 18 101 35 19 I29 14
BIRTSS IN PIURAL SETS
12,952 1,015 200 1,729 466
507 46 6 96 i6 703 60 8 110 34
1,863 117 27 270 73 3,793 292 53 558 124
3,932 270 41 4.S3 127 1,802 165 44 178 69 295 47 19 26 20 54 15 1 8 3 3 3 1
IC30NA!FALDEMES AMONG BIRTBS IN PLURAL SETS
1,200 113 25 196 59/
459 37 6, 74 10 353 33 5 5Cl 19 232 22 6 48 14 106 14 5 17 6
31 5 4 7 11 2 3 2 2 6 1 2 1
35,356
64122332
1,331
4,1559,97611,4024,7123,282
753
466281110
971261265550
606
143892195
204155742410
99
11203317
1052,1
lIt is assumed that all births in hospitals or institutions are attended by physiciene.

--------------------------------------------------------------------------------------------------------------------------
------------------------------------------------------------
Vol. 39, No. 1 WEIGHT AT BIRTH 33
TABLE 6. SINGLE LIVE B16TES IN EOSPITAIS AND NEONATAL DEATHS AMONG THIS GROUP, BY DETAIIED BIRTH WEIG3T AND RA.m”:UNITED STATES, JANUARY 1 ‘IDMARCH 31, 1950
(Neonataldeaths include deaths within the first 28 days after birth amons children born Jan. 1 to Mm. 31, 1950.Births and deaths with btrth weight not stated are distributed. Excludes data for Massachusetts )
BIRTHS BIRTH WEIGET (IN G8AMS)
111 races Nonwhite
All weights-----------------------
1,000 or less1,001-1,2501,251-1,5001,501-1,7301,751-2,000-------------------------------2,001-2,250-------------------------------2,251-2,500-------------------------------
2,50i-2,750-------------------------------2,751-3,000-------------------------------3,001-3,500-------------------------------3,501-4,000-------------------------------4,001-4,5004,591 or more
710,545 645,343 65,202
2,891 2,414 477 1,607 1,371 236 1,935 1,624 311 2,829 2.381 448 5,045 4;280 765 8,664 7,521 1,143 23,223 19,676 3,547
49,035 42,310 6,725 83,031 72,956 1o,075 278,391 252,489 25,902 192,486 189,253 12,233 51,375 48,692 2,683 10,033 9,376 657
NEONATAL DEATSS
U1 races White
12,425 10,790 1,635
2,550 2,143 407 1,061 916 3.45 929 795 1.34 842 751 91 916 820 96 [ 710 633 77 824 709 115
795 702 93 700 604 96
1,661 1,459 202 967 851 116 340 306 34 130 101 29
U.S. GOVERNMENT PRINTING OFFICE : 196S 0—188-637

REPORTS FROM THE NATIONAL CENTER FOR HEALTH STATISTICS
PuDlic Health Service Publication No. 1000
Series 1. Programs and collection procedures
,Y0. 1. Origin, Program, and Operation of the U.S. National Health Survey. 35 cents.
so. ?. Health Survey Procedure: Concepts. fhestionnaire Developtnent, and flefinitions in the Heaith Intcr>icu Survey. 45 vents.
No. 3. Development and Maintenance of a National Inventory of Hospitals and Institutions. 25 cents. No. 4. Plan and Initial Program of the Health Examination Sur%ey.
Smies 2. Data evaluation and methods research
No. 1.Comparison of Two-Vision Testing Devices. 30 cents. No, 2.
No. 3.
so. 4. x0. 5.
so. 6.
x0. 7.
Xo. s.
No. 9.
No. 10.
Seines 3,
so, 1.
No. 2.
Series 4.
Series 10.
No. 1.
!iO. 2.
so. 3.
Xo. 4,
Xo. 5.
so. 6.
so. 7.
\O. s. !(0. !)
No. 1(!,
x“. 11, ~o. 12.
No. 13.
No, 14,
No. 15.
No, 16.
No. 17.
Series Il.
No. 1.
No. !?.
No. 3.
No. 4. No. 5. No. 6.
No. 7. No. 8.
No. 9.
Series 12.
Series 20.
Series ZI,
Measurement of Personal Health Expenditures. 45 cents.
The One-Hour Glucose Tolerance Test. 30 cents.
Comparison of T~oh!ethods of COns~ucting .4bridged Life Tables. 15 cents4n Index of Health: Mathematical Models. 25 cents.Reporting of Hospitalization in the Health Interview Survey.Health Interview Responses Compared With Medical Records.
Comparison of Hospitalization Reporting in Three Survey Procedures.
Cooperation in Health Examination Surveys.Hospital Utilization in the Last Year of Life.
lnalvtical studies
The Change in Mortnl it!, Trend ]n the Unlled States. 3.5 cents.
Recent Mortality Trends in Chile. 30 cents
Vucument$ and commiltee reports
No reports to date.
Data Finn) thcliealth Interview Survey
lcwte (’onditiom., lncldence and +ssociated Disability, United States. July 196t-June 1962. .4(1cent>
Family[ncomein Relalion to Selected Health Characteristics, United States. 4iJ cents.
Length of Convalescence After Surgery, United State+. July 1960-June 1961, 35 cents.
Di..ahility Days, (~n!ted States, JUIJ 1961-June 1962. 40 centsCurrent Estimates From the Health Interview Survey .United States, July 1962 -June 196;3. 3.3cc.ts.[mp:tirmcnts Due tolnjury. by Class and Typcof .