Weibo Wang , Xiao Shu , Quanfa Zhang *, René Guénon · 21 René Guénon 22 [email protected] 23...
26
Effects of freeze-thaw cycles on the soil nutrient balances, infiltration and 1 stability of cyanobacterial soil crusts in northern China 2 Weibo Wang a,b , Xiao Shu a , Quanfa Zhang a, *, René Guénon b 3 a Laboratory of Aquatic Botany and Watershed Ecology, Wuhan Botanical Garden, Chinese 4 Academy of Sciences, Wuhan 430074, China 5 b School of Life Sciences, Arizona State University, Tempe, 85287, USA 6 7 Corresponding author 8 Quanfa Zhang 9 Laboratory of Aquatic Botany and Watershed Ecology 10 Wuhan Botanical Garden 11 Chinese Academy of Sciences 12 Wuhan 430074, China 13 Tel: +86 27 875 10702. 14 E-mail: [email protected] 15 16 Weibo Wang 17 [email protected] 18 Xiao Shu 19 [email protected] 20 René Guénon 21 [email protected] 22 23
Transcript of Weibo Wang , Xiao Shu , Quanfa Zhang *, René Guénon · 21 René Guénon 22 [email protected] 23...
Effects of freeze-thaw cycles on the soil nutrient balances, infiltration and 1
stability of cyanobacterial soil crusts in northern China 2
Weibo Wanga,b
, Xiao Shua, Quanfa Zhang
a,*, René Guénon
b 3
a Laboratory of Aquatic Botany and Watershed Ecology, Wuhan Botanical Garden, Chinese 4
Academy of Sciences, Wuhan 430074, China 5
b School of Life Sciences, Arizona State University, Tempe, 85287, USA
6
7
Corresponding author 8
Quanfa Zhang 9
Laboratory of Aquatic Botany and Watershed Ecology 10
Wuhan Botanical Garden 11
Chinese Academy of Sciences 12
Wuhan 430074, China 13
Tel: +86 27 875 10702. 14
E-mail: [email protected] 15
16
Weibo Wang 17
Xiao Shu 19
René Guénon 21
23

Abstract 24
Aims Freeze-thaw fluctuation is a natural phenomenon, which is frequently 25
encountered by biological soil crusts (BSCs) in late autumn and early spring in cold 26
deserts. The objective of our study was to investigate the effects of freeze-thaw cycles 27
(FTCs) on the soil nutrient balances, infiltration and stability of cyanobacterial soil 28
crusts (CSCs) in the temperate desert region. 29
Methods A controlled incubation experiment was carried out to study the effects of 30
diurnal freeze-thaw cycles (FTCs) on total soil carbon (TC), total soil nitrogen (TN), 31
soil TC/TN, hydraulic conductivity, and strength of light and dark cyanobacterial 32
crusts, respectively. Six successive diurnal FTCs were applied as three temperature 33
regimes (i.e., 6 successive mild FTCs (mild), 6 successive severe FTCs (severe), 3 34
successive mild FTCs followed by 3 successive severe FTCs (medium)). The 35
experiment intended to simulate natural temperature changes in one of the temperate 36
regions of northern China. 37
Results Compared with dark CSCs cores, light CSCs cores lost a greater proportion 38
of nitrogen. For both crust cores, Severe FTCs decreased TC and TN more than mild 39
FTCs. However, TC and TN remained relative constant when CSCs cores were 40
treated with severe FTCs after experiencing mild FTCs. TC and TN of both CSCs 41
cores decreased in the earlier FTCs and then remained stable in the later FTCs. 42
TC/TN increased significantly for light CSCs, but only changed slightly for dark 43
CSCs after successive FTCs. The effects of FTCs on the hydraulic conductivity and 44
strength of CSCs were not consistent with our expectations, that FTCs would increase 45

hydrological conductivity and decrease strength. These effects depended on crust type, 46
FTC number and freeze/thaw intensity. Increase in hydraulic conductivity and 47
decrease in strength only occurred in severe treatment in the dark CSCs during the 48
later FTCs. 49
Conclusions Light CSCs are more sensitive to FTCs than dark CSCs. Mild FTCs 50
decrease less TC and TN than severe FTCs and mostly increase the stability of the 51
CSCs. However, severe FTCs may decrease TC and TN drastically, thereby degrading 52
the BSCs. 53
Key words: Freeze-thaw cycles · Desert ecosystems· C and N 54
balances · Infiltration · Stabilization 55
56
Introduction 57
Freeze-thaw fluctuation is a natural phenomenon that is frequently encountered 58
by soils in the higher latitude and altitude regions in late autumn and early spring. 59
Climate change is expected to cause milder winters and a thinner and more unstable 60
snow cover in these regions (Cooley 1990), resulting in more frequent freeze-thaw 61
events and increasing depth and severity of soil frost during cold periods (Groffman et 62
al. 2001; Hardy et al. 2001; Mellander et al. 2007). Many studies have conducted to 63
investigate the effects of freezing and thawing on soil characteristics, and suggested 64
that freeze-thaw cycles (FTCs) could alter soil physical properties, microorganisms, 65
carbon and nutrient dynamics, trace gas losses and higher organisms associated with 66
soil (Priemé and Christensen 2001; Oztas and Fayetorbay 2003; Grogan et al. 2004; 67
Henry 2007; Vestgarden and Austnes 2009). 68
Biological soil crusts (BSCs), whose primary succession stage is cyanobacterial 69
soil crusts (CSCs), consist of cyanobacteria, lichens, mosses, microfungi and bacteria 70
(Belnap 2003a). They are usually distributed in the uppermost soil layer and have 71
distinguished boundaries with soils beneath them (Belnap 2003a). They play a dual 72
role as both constituents of mature arid and semiarid ecosystems, and as pioneers in 73
primary and secondary plant community succession (Belnap 2003a). Their ecosystem 74
functions include stabilizing the soil, fertilizing the soil, changing water regimes, and 75
promoting vascular plants establishment (Eldridge and Greene 1994; Belnap 2003b). 76
Since BSCs are usually located on the uppermost soil profile, they are more likely to 77
be influenced by freeze-thaw events. 78
Many studies have investigated freezing effects on photoautotrophs in the BSCs, 79
in particular the physiological changes of photoautotrophs (Hawes 1990; Tang and 80
Vincent 1999;Melick and Seppelt 1992; Lin et al. 2004), and few studies were 81

conducted on the whole BSCs, let alone investigated the effects of FTCs on the 82
biogeochemical cycle, water cycle and stability of BSCs. Recently, researches 83
recognize BSCs as a complicated micro ecosystem (Bowker et al. 2010), and those 84
studies based on the population level could not fully represent the characteristics of 85
BSCs. Besides, their biomass is mainly composed of photoautotrophs which can grow 86
and fix carbon or nitrogen in thawing conditions (Belnap 2003b; Tang and Vincent 87
1999). This makes changes of infiltration and stability, biogeochemical cycles of 88
BSCs during freeze-thaw periods more complicated. 89
In this study, a controlled incubation experiment was designed to study the 90
effects of diurnal FTCs on the soil nutrient balances, infiltration, and stability of two 91
types of CSCs, i.e., light CSCs (dominated by Microcoleus) and dark CSCs 92
(dominated by Scytonema and Nostoc). We hypothesized that FTCs would increase 93
hydrological conductivity and decrease stability due to their damage to CSCs integrity, 94
and lead to nutrient losses of CSCs. These effects would be aggravated by increasing 95
intensity of freezing and thawing, and dark CSCs were more resistant to FTCs than 96
light CSCs. The experiment was intended to test above hypotheses by simulating 97
natural temperature changes in one of the temperate regions in northern China. 98
99
Methods and materials 100
Site description, crust cores sampling and crust cores preparation 101
Two sampling sites were located in the central and eastern Kubuq Desert, Inner 102
Mongolia, China (N40°18′, E109°49′, and N40°12′, E110°11′), and samples of light 103
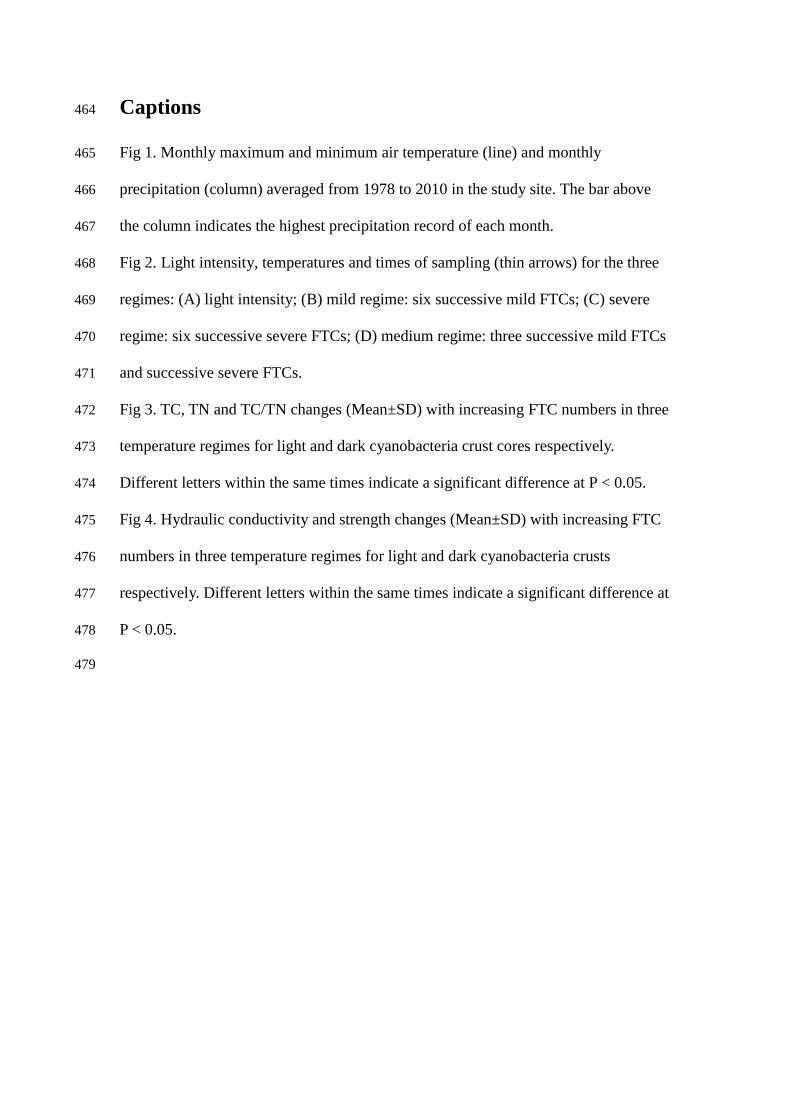
and dark CSCs were collected in the central and eastern site, respectively. Due to its 104
climatic characteristics, freeze-thaw events might occur every month from October to 105
the April of the next year, primarily in October, March and April (Fig. 1). Light CSCs 106

are dominated by the cyanobacterium Microcoleus, which first colonizes bare soils 107
and lives 1-4 mm below the soil surface. Microcoleus lacks UV protective pigments. 108
During wet periods, it can glide up to the soil surface, while it returns to the depths as 109
soils dry up (Wang et al. 2013). Dark CSCs usually occur in later succession stage 110
after light CSCs (Belnap 2003a). They are dominated by the cyanobacteria Scytonema 111
and Nostoc, both are small and relatively immobile species. They have a sunscreen 112
pigment in their filament sheaths, which protects them from damage by ultraviolet 113
radiation (Wang et al. 2013). 114
Samplings were conducted in late October, 2012. For measurements of soil TC 115
and TN changes and crust stability during FTCs, intact CSCs cores of 5cm deep and 116
5cm in diameter were collected using cutting rings with two end covers (6cm deep, 117
5cm in diameter). A total of 210 crust cores samples collected. For the measurements 118
of crust infiltration, crust cores (5cm deep, 15cm in diameter) were collected using 119
stainless steel tube with lower cover (6cm deep, 15cm in diameter) (separate 210 crust 120
samples). Those sampling sites were moistened with deionized water prior to coring. 121
To ensure the homogeneity of samples, sampling was carried out within a similar 122
microenvironment where surface microstructure appeared to be similar. After samples 123
were brought to the laboratory, they were watered with 20ml (≈10mm, 5cm deep, 5cm 124
in diameter) and 180ml (≈10mm, 5cm deep, 15cm in diameter) pH-adjusted (pH=7, 125
the average pH in precipitation from 2007-2009) sterile water respectively and 126
photographed after 30 minutes. For both light and dark CSCs, unbroken soil cores 127
were selected and air dried. This was done for samples taken with both the 5cm and 128
15cm diameter soil cores. These samples were kept in the dark at 10℃until start of 129
treatment. 130
Freeze-thaw treatment 131
For each crust type (light CSCs and dark CSCs), the crust cores (3 replicates per 132
FTC per regime) were allocated randomly to three different temperature regimes 133
which were designed according to realistic temperature fluctuation in the sampling 134
sites. Three temperature regimes were defined by an increasing intensity: 6 successive 135
mild FTCs (mild), 3 successive mild FTCs followed by 3 successive severe FTCs 136
(medium), 6 successive severe FTCs (severe) (Fig. 2). For one mild FTC, temperature 137
ranged from -5 to 10℃, while for one severe FTC, temperature ranged from -10 to 138
5℃. One freeze-thaw cycle was set for 24h with 8h thawing (70μE. m-2
.s-1
) and 16h 139
(dark) freezing. To force the freezing to go from the top to the bottom of the column, 140
as in the field, the columns were placed in blocks of expanded polyester, with holes 141
(5cm deep) fitting the columns (Vestgarden and Austnes 2009). Before the incubation, 142
19.6 ml (5cm in diameter) and 176.4 ml (15cm in diameter) of pH-adjusted (pH=7, 143
the average pH in precipitation from 2007-2009) water was added by mist sprayer to 144
different sized samples respectively. The addition was slow to prevent the edge effect 145
of water transport along the column walls. 146
TC and TN measurements 147
After being used to measure crusts’ strength, these cores were ground and used 148
for TC and TN measurements using a C/N analyzer (Flash, EA, 1112 Series, Italy). 149
Infiltration measurements 150
Hydraulic conductivity was used as a surrogate measure for crusts’ infiltration. It 151
gauges the rate of water movement through soil and accounts for soil’s ability to 152
transport water when subject to a hydraulic gradient. Hydraulic conductivity was 153
measured in laboratory conditions on dried samples in stainless steel tubes with lower 154
covers using a Mini Disk Tension Infiltrometer (Decagon Services, Inc., Pullman, 155
WA) with a suction range from 0.5 to 6 cm and a radius of 2.2 cm (Rossi et al. 2012). 156
The infiltrometer was placed on top of the sample and the height of the water column 157
was measured at equal time intervals as the water penetrated the soil using the 158
graduated cylinder of the instrument. For each sample, hydraulic conductivity was 159
measured at least in triplicate and the mean value recorded. 160
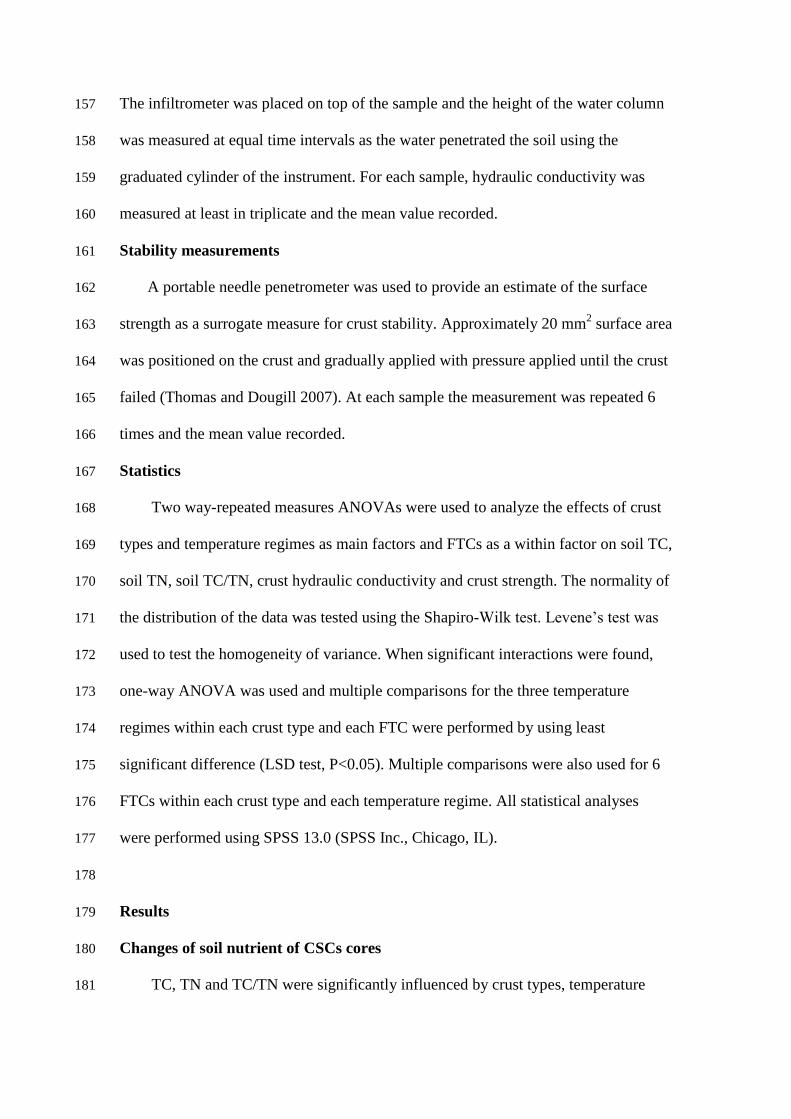
Stability measurements 161
A portable needle penetrometer was used to provide an estimate of the surface 162
strength as a surrogate measure for crust stability. Approximately 20 mm2 surface area 163
was positioned on the crust and gradually applied with pressure applied until the crust 164
failed (Thomas and Dougill 2007). At each sample the measurement was repeated 6 165
times and the mean value recorded. 166
Statistics 167
Two way-repeated measures ANOVAs were used to analyze the effects of crust 168
types and temperature regimes as main factors and FTCs as a within factor on soil TC, 169
soil TN, soil TC/TN, crust hydraulic conductivity and crust strength. The normality of 170
the distribution of the data was tested using the Shapiro-Wilk test. Levene’s test was 171
used to test the homogeneity of variance. When significant interactions were found, 172
one-way ANOVA was used and multiple comparisons for the three temperature 173
regimes within each crust type and each FTC were performed by using least 174
significant difference (LSD test, P<0.05). Multiple comparisons were also used for 6 175
FTCs within each crust type and each temperature regime. All statistical analyses 176
were performed using SPSS 13.0 (SPSS Inc., Chicago, IL). 177
178
Results 179
Changes of soil nutrient of CSCs cores 180
TC, TN and TC/TN were significantly influenced by crust types, temperature 181
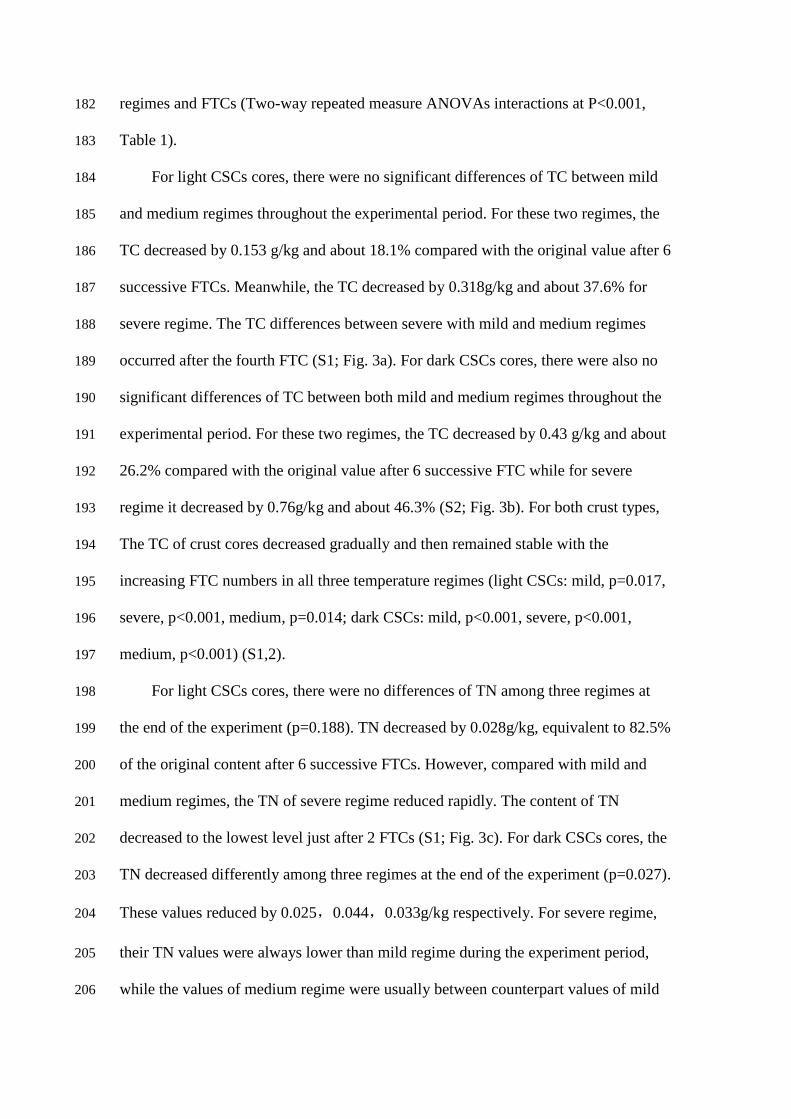
regimes and FTCs (Two-way repeated measure ANOVAs interactions at P<0.001, 182
Table 1). 183
For light CSCs cores, there were no significant differences of TC between mild 184
and medium regimes throughout the experimental period. For these two regimes, the 185
TC decreased by 0.153 g/kg and about 18.1% compared with the original value after 6 186
successive FTCs. Meanwhile, the TC decreased by 0.318g/kg and about 37.6% for 187
severe regime. The TC differences between severe with mild and medium regimes 188
occurred after the fourth FTC (S1; Fig. 3a). For dark CSCs cores, there were also no 189
significant differences of TC between both mild and medium regimes throughout the 190
experimental period. For these two regimes, the TC decreased by 0.43 g/kg and about 191
26.2% compared with the original value after 6 successive FTC while for severe 192
regime it decreased by 0.76g/kg and about 46.3% (S2; Fig. 3b). For both crust types, 193
The TC of crust cores decreased gradually and then remained stable with the 194
increasing FTC numbers in all three temperature regimes (light CSCs: mild, p=0.017, 195
severe, p<0.001, medium, p=0.014; dark CSCs: mild, p<0.001, severe, p<0.001, 196
medium, p<0.001) (S1,2). 197
For light CSCs cores, there were no differences of TN among three regimes at 198
the end of the experiment (p=0.188). TN decreased by 0.028g/kg, equivalent to 82.5% 199
of the original content after 6 successive FTCs. However, compared with mild and 200
medium regimes, the TN of severe regime reduced rapidly. The content of TN 201
decreased to the lowest level just after 2 FTCs (S1; Fig. 3c). For dark CSCs cores, the 202
TN decreased differently among three regimes at the end of the experiment (p=0.027). 203
These values reduced by 0.025,0.044,0.033g/kg respectively. For severe regime, 204
their TN values were always lower than mild regime during the experiment period, 205
while the values of medium regime were usually between counterpart values of mild 206
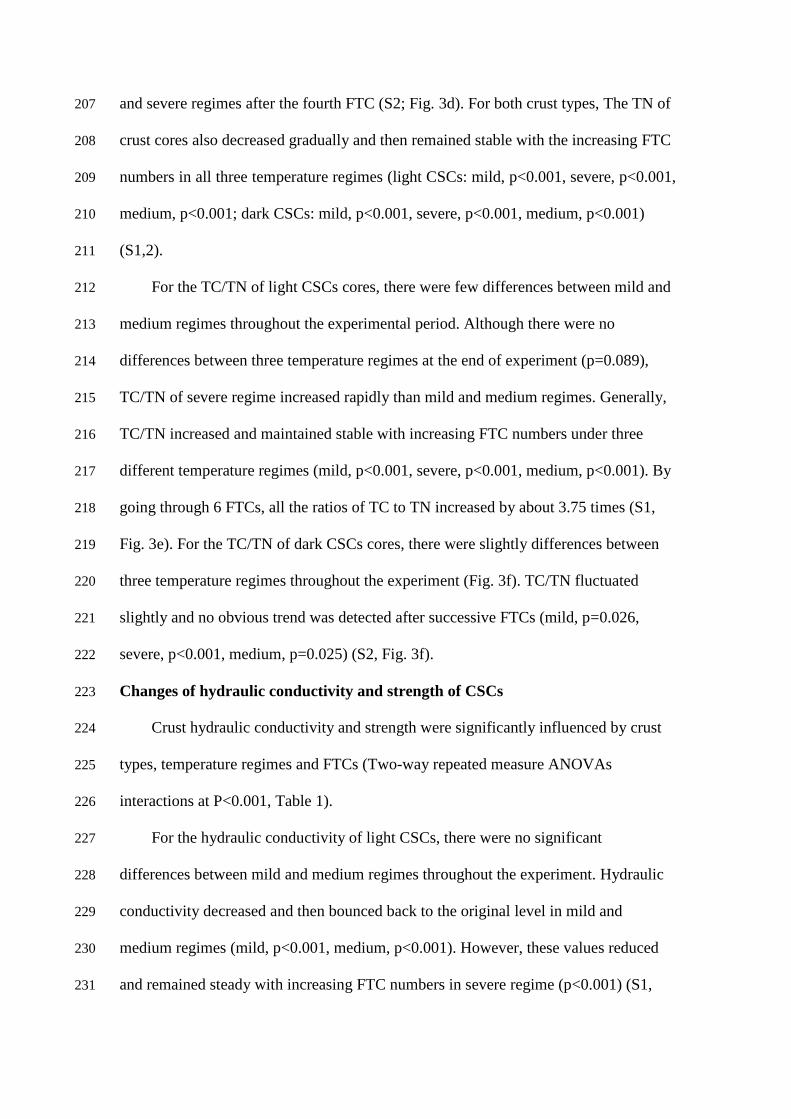
and severe regimes after the fourth FTC (S2; Fig. 3d). For both crust types, The TN of 207
crust cores also decreased gradually and then remained stable with the increasing FTC 208
numbers in all three temperature regimes (light CSCs: mild, p<0.001, severe, p<0.001, 209
medium, p<0.001; dark CSCs: mild, p<0.001, severe, p<0.001, medium, p<0.001) 210
(S1,2). 211
For the TC/TN of light CSCs cores, there were few differences between mild and 212
medium regimes throughout the experimental period. Although there were no 213
differences between three temperature regimes at the end of experiment (p=0.089), 214
TC/TN of severe regime increased rapidly than mild and medium regimes. Generally, 215
TC/TN increased and maintained stable with increasing FTC numbers under three 216
different temperature regimes (mild, p<0.001, severe, p<0.001, medium, p<0.001). By 217
going through 6 FTCs, all the ratios of TC to TN increased by about 3.75 times (S1, 218
Fig. 3e). For the TC/TN of dark CSCs cores, there were slightly differences between 219
three temperature regimes throughout the experiment (Fig. 3f). TC/TN fluctuated 220
slightly and no obvious trend was detected after successive FTCs (mild, p=0.026, 221
severe, p<0.001, medium, p=0.025) (S2, Fig. 3f). 222
Changes of hydraulic conductivity and strength of CSCs 223
Crust hydraulic conductivity and strength were significantly influenced by crust 224
types, temperature regimes and FTCs (Two-way repeated measure ANOVAs 225
interactions at P<0.001, Table 1). 226
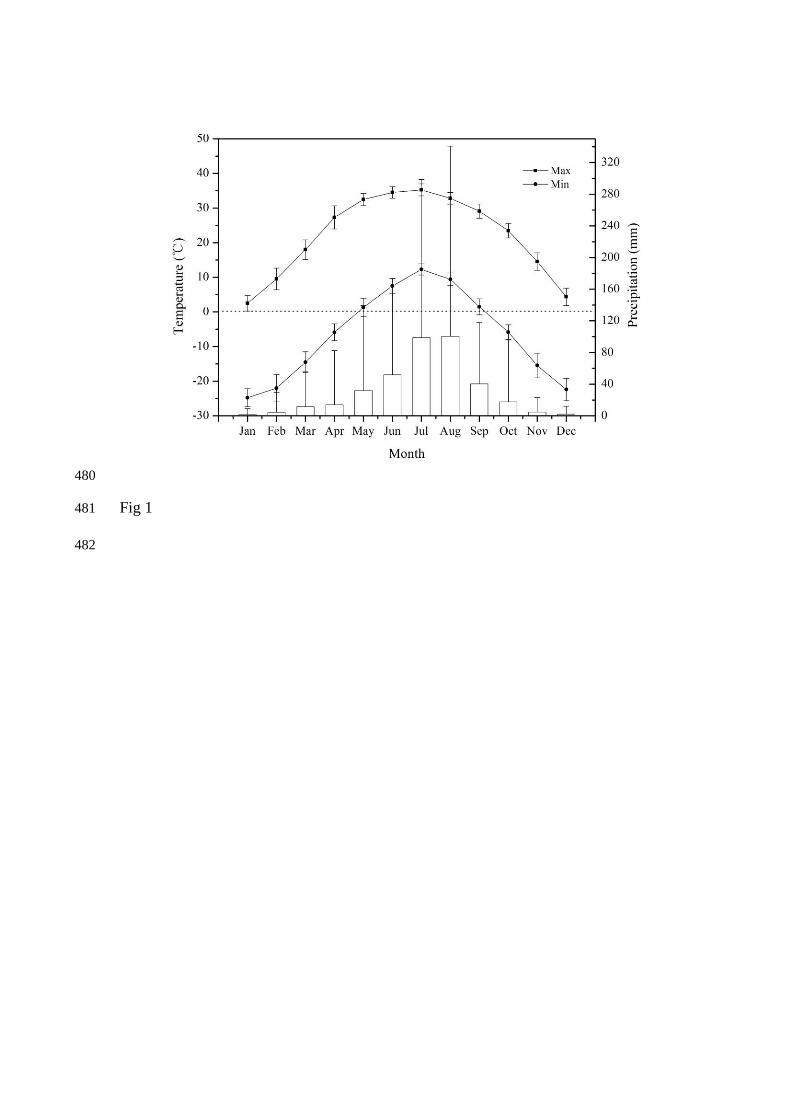
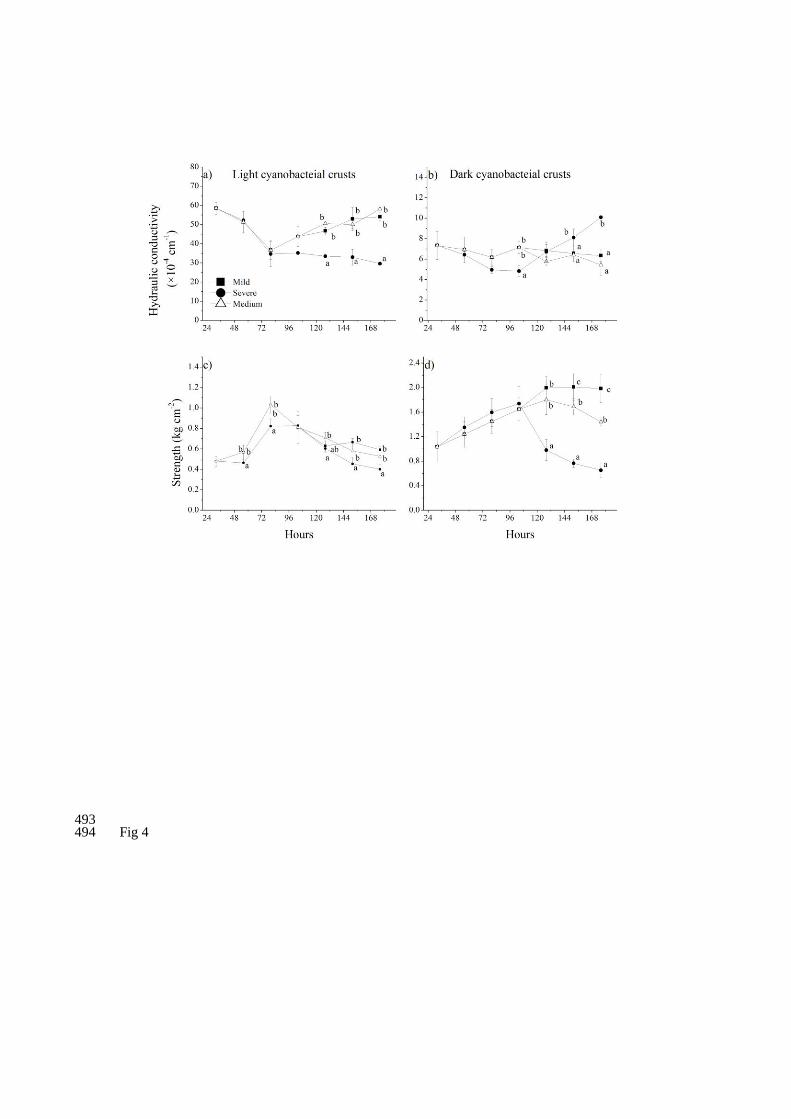
For the hydraulic conductivity of light CSCs, there were no significant 227
differences between mild and medium regimes throughout the experiment. Hydraulic 228
conductivity decreased and then bounced back to the original level in mild and 229
medium regimes (mild, p<0.001, medium, p<0.001). However, these values reduced 230
and remained steady with increasing FTC numbers in severe regime (p<0.001) (S1, 231
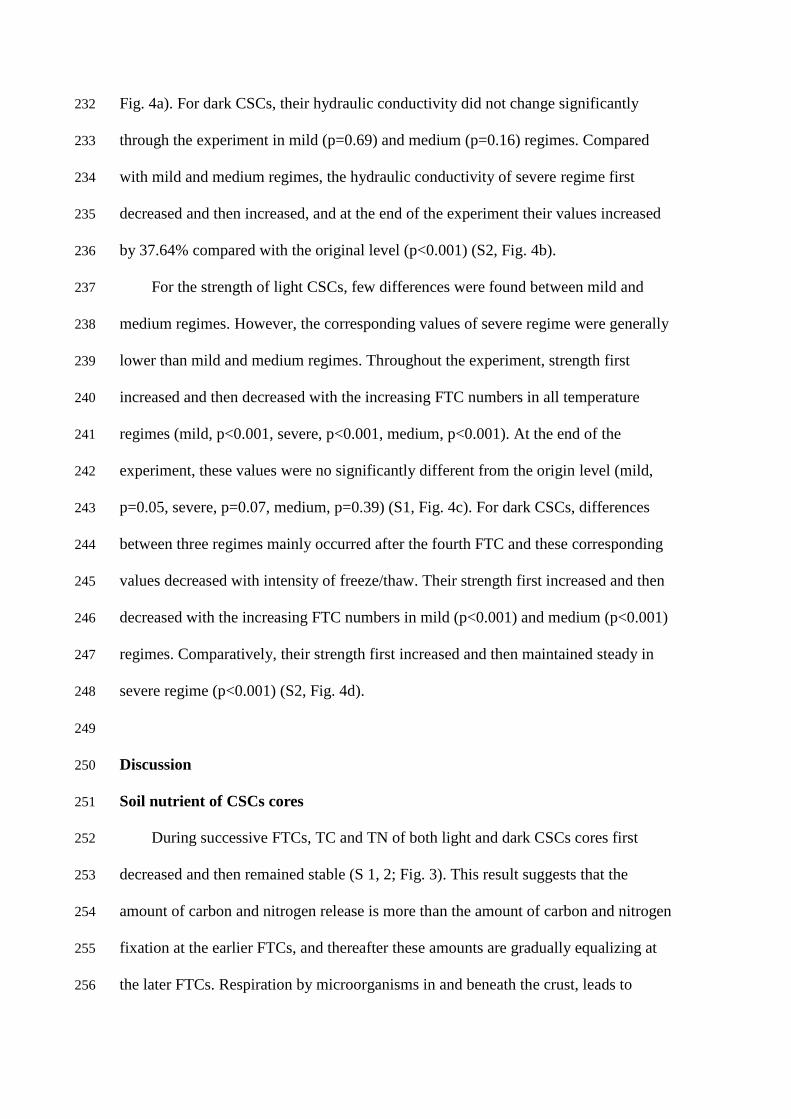
Fig. 4a). For dark CSCs, their hydraulic conductivity did not change significantly 232
through the experiment in mild (p=0.69) and medium (p=0.16) regimes. Compared 233
with mild and medium regimes, the hydraulic conductivity of severe regime first 234
decreased and then increased, and at the end of the experiment their values increased 235
by 37.64% compared with the original level (p<0.001) (S2, Fig. 4b). 236
For the strength of light CSCs, few differences were found between mild and 237
medium regimes. However, the corresponding values of severe regime were generally 238
lower than mild and medium regimes. Throughout the experiment, strength first 239
increased and then decreased with the increasing FTC numbers in all temperature 240
regimes (mild, p<0.001, severe, p<0.001, medium, p<0.001). At the end of the 241
experiment, these values were no significantly different from the origin level (mild, 242
p=0.05, severe, p=0.07, medium, p=0.39) (S1, Fig. 4c). For dark CSCs, differences 243
between three regimes mainly occurred after the fourth FTC and these corresponding 244
values decreased with intensity of freeze/thaw. Their strength first increased and then 245
decreased with the increasing FTC numbers in mild (p<0.001) and medium (p<0.001) 246
regimes. Comparatively, their strength first increased and then maintained steady in 247
severe regime (p<0.001) (S2, Fig. 4d). 248
249
Discussion 250
Soil nutrient of CSCs cores 251
During successive FTCs, TC and TN of both light and dark CSCs cores first 252
decreased and then remained stable (S 1, 2; Fig. 3). This result suggests that the 253
amount of carbon and nitrogen release is more than the amount of carbon and nitrogen 254
fixation at the earlier FTCs, and thereafter these amounts are gradually equalizing at 255
the later FTCs. Respiration by microorganisms in and beneath the crust, leads to 256

carbon loss within the crust cores (Garcia-Pichel and Belnap 1996). Denitrification by 257
these microorganisms leads to nitrogen losses within the crust cores (Marusenko et al. 258
2013). During the earlier FTCs, Microorganisms in the soil in or beneath the crusts 259
received sufficient carbon and nitrogen and became more active after thawing 260
(Schimel et al. 2006). Meanwhile, Carbon and nitrogen fixation were reduced or 261
stopped due to the decrease or restriction of photosynthesis by cyanobacteria during 262
the earlier FTCs period (Wang et al. 2013). With increasing numbers of FTC, carbon 263
and nitrogen release was reduced due to decreased available carbon. For dark CSCs 264
cores, nitrogen fixation might gradually recover with the physiological acclimation of 265
nitrogen fixing cyanobacteria and then N input and loss balanced again at the later 266
stage of the experiment. 267
Compared with light CSCs cores, dark CSCs cores lose more carbon likely to the 268
atmosphere. Carbon’s vertical distribution in dark crusts might be different from light 269
crusts. Most of the organic carbon of dark CSCs was distributed in the soil surface, 270
which experienced more extreme temperature changes affected by freeze-thaw stress. 271
In addition to differences in carbon distribution, dark CSCs might be thicker than light 272
CSCs with a greater proportion of microbial biomass distributed on the soil surface 273
(Hu et al. 2003). Temperature retention of dark CSCs would be greater than light 274
CSCs. Microorganisms in or beneath the dark CSCs would live in a relatively stable 275
temperature regime. They metabolize more actively than those in or beneath light 276
CSCs and lead to greater carbon losses. For light CSCs cores, TN decreased 277
remarkably after FTCs. Comparatively, a smaller proportion of TN was lost in the 278
dark CSCs cores. This implies that TN content of dark CSCs cores is more resistant to 279
temperature treatments. Previous studies (Delgado-Baquerizo et al. 2013; Reed et al. 280
2012) have found that N cycle under well-developed BSCs could be more resistant to 281
changes than poor-developed BSCs. The TC/TN of light CSCs cores changed 282
remarkably while for dark CSCs cores TC/TN fluctuated slightly during the process 283
of freezing and thawing. It could be inferred that light CSCs are easily disturbed by 284
FTC and this would lead to decrease in quality of light CSCs. This was also supported 285
by the fact that there were no significant differences between the three regime 286
treatments at the end of the experiment. The results showed that FTC led to a state of 287
nitrogen starvation in light CSCs. The tolerance capacity of these crusts to FTC was 288
consistent with the succession series of CSCs. 289
Compared with the mild and medium FTCs, severe FTCs decreased the soil TC 290
and TN more for both light and dark CSCs cores. This indicated that more TC and TN 291
were lost by increasing the intensity of freeze/thaw. Small differences between mild 292
and medium FTCs indicated that lower temperature acclimation might reduce the loss 293
of TC and TN of the crusts cores. For medium FTCs, with the slow freezing rate, 294
cyanobacteria would have enough time to adjust their physiological processes and 295
receive less damage than severe temperature treatment. The freezing point for soil 296
cyanobacteria is usually below -5℃ (Lin et al. 2004). For severe freezing, the liquid 297
water in the cyanobacterial cells might freeze and cause cells to crack and release 298
more materials from cells. Hence, more damage to cyanobacteria occurred in severe 299
FTCs treatment. However, cyanobacteria evolved a series of thermal adaptations and 300
acclimations for cold environments, including maintenance of membrane fluidity, 301
molecular adaptation of enzymes to compensate for the reduction of chemical reaction 302
rates at freezing, and adaptation and acclimation of the photosynthetic electron 303
transport and the energy balance (Tang and Vincent 1999; Tamaru et al. 2005; 304
Morgan-Kiss et al. 2006). 305
Compared with the effects of trampling disturbance (Barger et al. 2006), a 306

greater proportion of carbon and nitrogen was lost by FTCs in this study. For example, 307
it was reported that there were only 1% reduction and 1-3% reduction after trampling 308
for the TC and TN of CSCs, respectively (Barger et al. 2006). The large difference in 309
TC and TN loss might be a result from using a different CSC model. Barger et al. 310
measured the TC and TN of total CSCs rather than CSCs cores. It is supposed that 311
this enormous loss might be related to the death of CSC organisms induced by FTCs 312
and then carbon and nitrogen were released by microbial respiration (Maestre et al. 313
2013) and denitrification. As a result, more work examining the biogeochemical 314
process of CSCs would be needed, especially identifying changes during winter in the 315
temperate regions. Compared with the soils of agricultural or forest environment, 316
freezing and thawing also gave rise to much greater losses of TC and TN for CSCs 317
(Matzner and Borken 2008; Vestgarden and Austnes 2009). The reason for this might 318
be related to the presence of large amounts of mineralizable C in BSCs, especially in 319
higher moisture conditions for CSCs (Miralles et al. 2013). 320
Infiltration and stability of CSCs 321
Infiltration and strength of BSCs are influenced by many factors, such as texture, 322
phototrophic abundance, microbial composition, exopolysaccharides (EPS) content, 323
and crust thickness (Warren 2001; Belnap 2006). Freezing and thawing might 324
increase the thickness of crusts, which would result in decreased infiltration, and an 325
increase in strength for CSCs in sandy soils (Xie et al. 2007). Meanwhile, FTCs 326
decreased the microbial biomass, which might cause increase of infiltration and 327
decrease of strength (Xie et al. 2007). Alternatively, it might destroy the 328
microstructure of EPS, which results in a decrease of infiltration and an increase in the 329
crust strength (Rossi et al. 2012). Our results reveal that these effects depend on crust 330
type, FTC numbers and freeze/thaw intensity. Only the severe treatment, during later 331

FTCs, led to hydraulic conductivity increases and strength decreases. This finding 332
highlights the challenges in predicting the effects of freezing and thawing on the 333
infiltration and stability of CSCs. 334
FTCs, climate change, succession and degradation of CSCs 335
Mild FTCs slightly decreased the soil TC and TN, decreased or did not change 336
the infiltration and increased or did not change the stability of CSCs. This implies that 337
moderate FTCs may suppress the dominant crust species and provide more niches for 338
new species to occupy within the crusts. Therefore, mild FTCs may promote the 339
succession of BSCs. However, severe FTCs drastically decreased the soil TC and TN 340
of CSCs cores, and sometimes increased the infiltration and decreased the stability of 341
CSCs, implying that severe FTCs may degrade the BSCs. Presumably, increasing 342
precipitation and temperature in the region (Piao et al. 2010) may result in more 343
frequent freeze-thaw events. Consequently, more carbon and nitrogen loss would be 344
expected in the future and would accelerate the degeneration of BSCs in the arid and 345
semiarid ecosystems (Maestre et al. 2013). In addition, our results support the 346
conclusion that low temperature acclimation by BSCs would reduce the loss of carbon 347
and nitrogen of crusts. However, with more extreme weather patterns, acclimation by 348
BSCs may be slow, leading to long-term detriments to the BSCs. 349
350
Acknowledgements: We thank Yevgeniy Marusenko and Ferran Garcia-Pichel for 351
helpful comments on earlier versions of the manuscript. We thank Anita Antoninka 352
and Daniel Roush for their grammatical review of the manuscript. The research was 353
supported by the Natural Science Foundation of China (31000061;31130010) and the 354
China Scholarship Council. 355
356
References 357
Barger NN, Herrick JE, Van Zee JW, Belnap J (2006) Impacts of biological soil crust 358
disturbance and composition on C and N loss from water erosion. 359
Biogeochemistry 77: 247-263 360
Belnap J (2003a) The world at your feet: desert biological soil crusts. Front Ecol 361
Environ 1: 181-189 362
Belnap J (2003b) Biological soil crusts in deserts: A short review of their role in soil 363
fertility, stabilization, and water relations. Algological Studies 109: 113-126 364
Belnap J (2006) The potential roles of biological soil crusts in dryland hydrologic 365
cycles. Hydrol Processe 20: 3159-3178 366
Bowker MA, Maestre FT, Escolar C (2010) Biological crusts as a model system for 367
examining the biodiversity–ecosystem function relationship in soils. Soil Biol 368
Biochem 42: 405-417 369
Cooley KR (1990) Effects of CO2-induced climatic changes on snowpack and 370
streamflow. Hydrological Sciences Journal – Journal des Sciences 371
Hydrologiques 35: 511-522 372
Delgado-Baquerizo M, Morillas L, Maestre FT, Gallardo A (2013) Biocrusts control 373
the nitrogen dynamics and microbial functional diversity of semi-arid soils in 374
response to nutrient additions. Plant and Soil 372: 643-654 375
Eldridge DJ, Greene RSB (1994) Microbiotic crusts: A view of the roles in soil and 376
ecological processes in the rangelands of Australia. Aust J Soil Res 32: 389-415 377
Garcia-Pichel F, Belnap J (1996) Microenvironments and microscale productivity of 378
cyanobacterial desert crusts. J Phycol 32: 774-782 379

Groffman PM, Driscoll CT, Fahey TJ, Hardy JP, Fitzhugh RD, Tierney GL (2001) 380
Colder soils in a warmer world: a snow manipulation study in a Northern 381
Hardwood forest ecosystem. Biogeochemistry 56: 135-150 382
Grogan P, Michelsen A, Ambus P, Jonasson S (2004) Freeze-thaw regime effects on 383
carbon and nitrogen dynamics in sub-arctic heath tundra mesocosms. Soil Biol 384
Biochem 36: 641-654 385
Hardy JP, Groffman PM, Fitzhugh RD Henry K, Welman AT, Demers JD, Fahey 386
TJ, Driscoll CT, Tierney GL, Nolan S (2001) Snow depth manipulation and its 387
influence on soil frost and water dynamics in a northern hardwood forest. 388
Biogeochemistry 56: 151-174 389
Hawes I (1990) Effects of freezing and thawing on a species of Zygnema 390
(Chlorophyta) from the Antarctic. Phycologia 29: 326-331 391
Henry HAL (2007) Soil freeze-thaw cycle experiments: Trends, methodological 392
weaknesses and suggested improvements Soil Biol Biochem 39: 977-986 393
Hu C, Zhang D, Huang Z, Liu Y (2003) The vertical microdistribution of 394
cyanobacteria and green algae within desert crusts and the development of the 395
algal crusts. Plant and Soil 257: 97-111 396
Larsen K, Jonasson S, Michelsen A (2002) Repeated freeze–thaw cycles and their 397
effects on biological processes in two arctic ecosystem types. Appl Soil Ecol 21: 398
187-195 399
Lin YF, Hirai M, Kashino Y, Koike H, Tuzi S, Satoh K (2004) Tolerance to freezing 400
stress in cyanobacteria, Nostoc commune and some cyanobacteria with various 401
tolerances to drying stress. Polar Biosci 17: 56-68 402
Maestre FT, Escolar C, Guevara ML, Quero J, Lázaro R, Delgado-Baquerizo M, 403
Ochoa V, Berdugo M, Gozalo B, Gallardo A (2013) Changes in biocrust cover 404
drive carbon cycle responses to climate change in drylands. Global Change Biol 405
19: 3835-3847 406
Marusenko Y, Bates ST, Anderson I, Johnson SL, Soule T, Garcia-Pichel F. (2013) 407
Ammonia-oxidizing archaea and bacteria are structured by geography in 408
biological soil crusts across North American arid lands. Ecological Processes 2- 409
9 410
Matzner E, Borken W (2008) Do freeze-thaw events enhance C and N losses from 411
soils of different ecosystems? Eur J Soil Sci 59: 274-284 412
Melick DR, Seppelt RD (1992) Loss of soluble carbohydrates and changes in freezing 413
point of Antarctic bryophytes after leaching and repeated freeze-thaw cycles. 414
Antarct Sci 4: 399-404 415
Mellander PE, Lofvenius MO, Laudon H (2007) Climate change impact on snow and 416
soil temperature in boreal Scots pine stands. Climatic Change 85: 179-193 417
Miralles I, Trasar-Cepeda C, Leirós MC, Gil-Sotres F (2013) Labile carbon in 418
biological soil crusts in the Tabernas desert, SE Spain. Soil Biol Biochem 58: 1-8 419
Morgan-Kiss RM, Priscu JC, Pocock T, GudynaiteSavitch L, Huner N PA (2006) 420
Adaptation and acclimation of photosynthetic microorganisms to permanently 421
cold environments. Microbiol Mol Biol Rev 70: 222-252 422
Oztas T, Fayetorbay F (2003) Effect of freezing and thawing processes on soil 423
aggregate stability. Catena 52: 1-8 424
Piao S, Ciais P, Huang Y, Shen Z, Peng S, Li J, Zhou L, Liu H, Ma Y, Ding Y, 425
Friedlingstein P, Liu C, Tan K, Yu Y, Zhang T, Fang JY (2010) The impacts of 426
climate change on water resources and agriculture in China. Nature 467: 43-51 427
Priemé A, Christensen S (2001) Natural perturbations, drying-wetting and 428
freezing-thawing cycles, and the emission of nitrous oxide, carbon dioxide and 429
mechane from farmed organic soils. Soil Biol Biochem 33: 2083-2091 430
Reed, SC, Coe KK, Sparks JP, Housman DC, Zelikova TJ, Belnap J (2012) Increased 431
precipitation results in rapid moss mortality and altered fertility in a dryland 432
ecosystem. Nature Climate Change 2: 752-755 433
Rossi F, Potrafka RM, Garcia-Pichel F, De Philippis R (2012) The role of the 434
exopolysaccharides in enhancing hydraulic conductivity of biological soil crusts. 435
Soil Biol Biochem 46: 33-40 436
Schimel JP, Fahnestock J, Michaelson G, Mikan C, Ping CL, Romanovsky VE, 437
Welker J (2006) Cold-season production of CO2 in Arctic soils: can laboratory 438
and field estimates be reconciled through a simple modeling approach? Arctic, 439
Antarctic, and Alpine Research 38: 249-256 440
Tamaru Y, Takani Y, Yoshida T, Sakamoto T (2005) Crucial role of extracellular 441
polysaccharides in desiccation and freezing tolerance in the terrestrial 442
cyanobacterium Nostoc commune. Appl Environ Microbiol 71: 7327-7333 443
Tang EY, Vincent W (1999) Strategies of thermal adaption by high-latitude 444
cyanbobacteria. New Phytol 142: 315-323 445
Thomas AD, Dougill AJ (2007) Cyanobacterial soil crusts and disturbance in the 446
Kalahari: implications for soil surface properties. Geomorphology 85: 17-29 447
Vestgarden LS, Austnes K (2009) Effect of freeze-traw on C and N release from soils 448
below different vegetation in a montane system: a laboratory experiment. Global 449
Change Biol 15: 876-887 450
Wang W, Wang YC, Shu X, Zhang QF (2013) Physiological responses of soil 451
crust-forming cyanobacteria to diurnal temperature variation. J Basic Microb 452
53:72-80 453
Warren SD (2001) Synopsis: influence of biological soil crusts on arid land hydrology 454

and soil stability. In: J. Belnap and O.L. Lange (eds) Biological Soil Crusts: 455
Structure, Function, and Management. Springer-Verlag, Berlin, pp 351-362 456
Xie ZM, Liu YD, Hu CX, Chen LZ, Li DH (2007) Relationships between the biomass 457
of the algal crusts in field and their compressive strength. Soil Biol Biochem 39: 458
567-572459
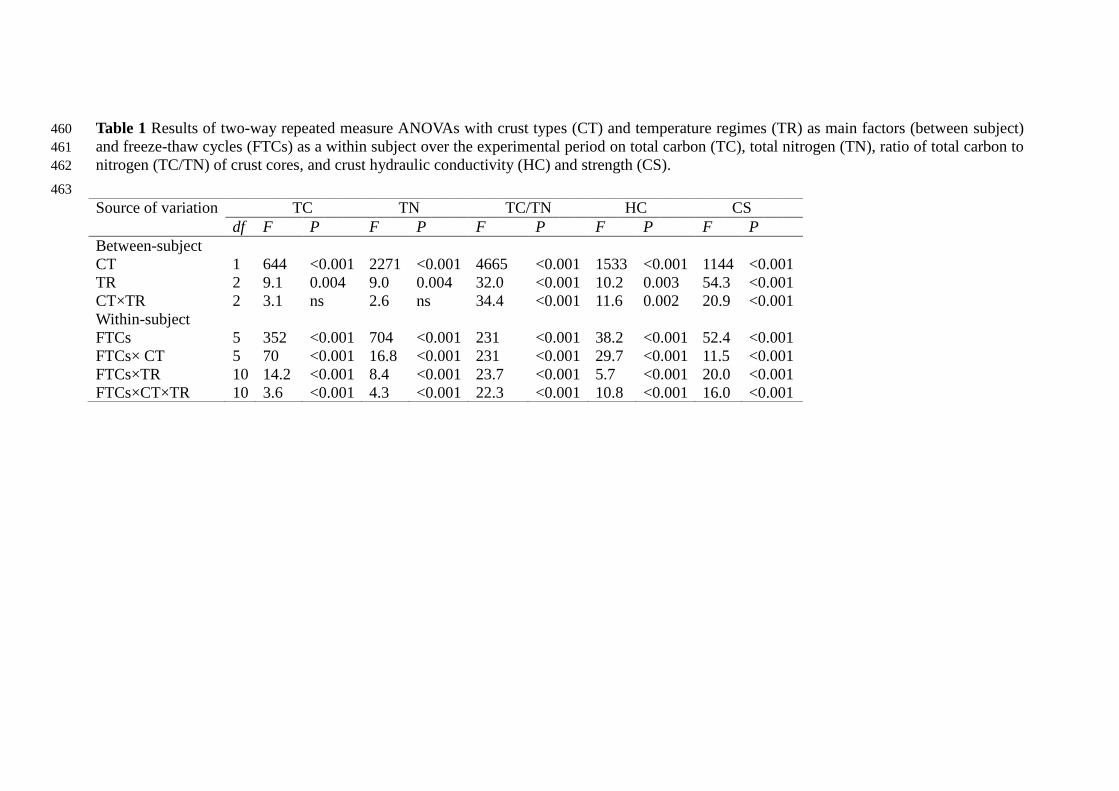
Table 1 Results of two-way repeated measure ANOVAs with crust types (CT) and temperature regimes (TR) as main factors (between subject) 460
and freeze-thaw cycles (FTCs) as a within subject over the experimental period on total carbon (TC), total nitrogen (TN), ratio of total carbon to 461
nitrogen (TC/TN) of crust cores, and crust hydraulic conductivity (HC) and strength (CS). 462
463
Source of variation TC TN TC/TN HC CS
df F P F P F P F P F P
Between-subject
CT 1 644 <0.001 2271 <0.001 4665 <0.001 1533 <0.001 1144 <0.001
TR 2 9.1 0.004 9.0 0.004 32.0 <0.001 10.2 0.003 54.3 <0.001
CT×TR 2 3.1 ns 2.6 ns 34.4 <0.001 11.6 0.002 20.9 <0.001
Within-subject
FTCs 5 352 <0.001 704 <0.001 231 <0.001 38.2 <0.001 52.4 <0.001
FTCs× CT 5 70 <0.001 16.8 <0.001 231 <0.001 29.7 <0.001 11.5 <0.001
FTCs×TR 10 14.2 <0.001 8.4 <0.001 23.7 <0.001 5.7 <0.001 20.0 <0.001
FTCs×CT×TR 10 3.6 <0.001 4.3 <0.001 22.3 <0.001 10.8 <0.001 16.0 <0.001
Captions 464
Fig 1. Monthly maximum and minimum air temperature (line) and monthly 465
precipitation (column) averaged from 1978 to 2010 in the study site. The bar above 466
the column indicates the highest precipitation record of each month. 467
Fig 2. Light intensity, temperatures and times of sampling (thin arrows) for the three 468
regimes: (A) light intensity; (B) mild regime: six successive mild FTCs; (C) severe 469
regime: six successive severe FTCs; (D) medium regime: three successive mild FTCs 470
and successive severe FTCs. 471
Fig 3. TC, TN and TC/TN changes (Mean±SD) with increasing FTC numbers in three 472
temperature regimes for light and dark cyanobacteria crust cores respectively. 473
Different letters within the same times indicate a significant difference at P < 0.05. 474
Fig 4. Hydraulic conductivity and strength changes (Mean±SD) with increasing FTC 475
numbers in three temperature regimes for light and dark cyanobacteria crusts 476
respectively. Different letters within the same times indicate a significant difference at 477
P < 0.05. 478
479
480
Fig 1
481
482

483
Fig 2 484
485

486 Fig 3 487
488
489
490
491
492
493 Fig 4 494