WEEKLY SHIPPING MARKET REPORT -...
18
WEEKLY SHIPPING MARKET REPORT WEEK 26 - 25 TH June – to 2 nd July 2012 - Legal Disclamer The information contained herein has been obtained by various sources. Although every effort has been made to ensure that this information is accurate, complete and up to date, Shiptrade Services S.A. does not accept any responsibility whatsoever for any loss or damage occasioned or claimed, upon reliance on the information, opinions and analysis contained in this report. Researched and compiled by: Shiptrade Services SA, Market Research on behalf of the Sale & Purchase, Dry Cargo Chartering and Tanker Chartering Departments. For any questions please contact: [email protected] Shiptrade Services SA Tel +30 210 4181814 [email protected] 1st Floor, 110/112 Notara Street Fax +30 210 4181142 [email protected] 185 35 Piraeus, Greece www.shiptrade.gr [email protected]
Transcript of WEEKLY SHIPPING MARKET REPORT -...
WEEKLY SHIPPING
MARKET REPORT WEEK 26
- 25TH June – to 2nd July 2012 -
Legal Disclamer
The information contained herein has been obtained by various sources. Although every effort has been made to ensure that this information is accurate, complete and up to date, Shiptrade Services S.A. does not accept any responsibility whatsoever for any loss or damage occasioned or claimed, upon reliance on the information, opinions and analysis contained in this report.
Researched and compiled by: Shiptrade Services SA, Market Research on behalf of the Sale & Purchase, Dry Cargo Chartering and Tanker Chartering Departments. For any questions please contact: [email protected]
Shiptrade Services SA Tel +30 210 4181814 [email protected] 1st Floor, 110/112 Notara Street Fax +30 210 4181142 [email protected] 185 35 Piraeus, Greece www.shiptrade.gr [email protected]
1
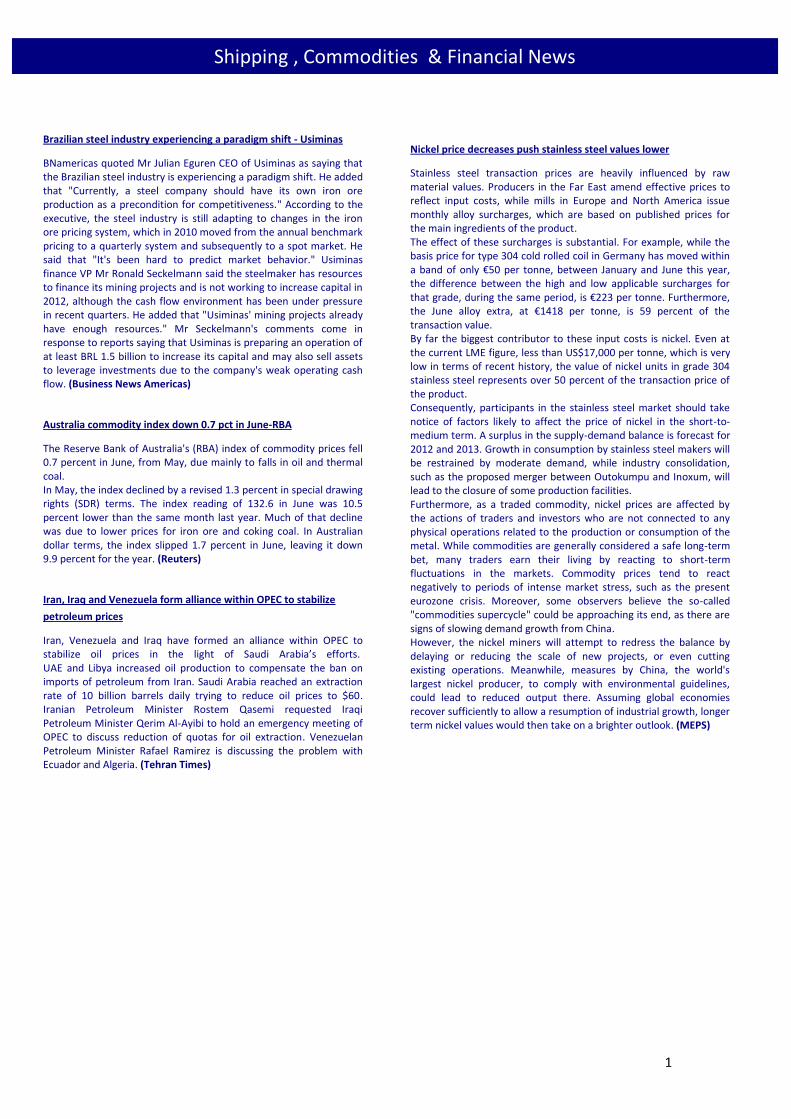
Brazilian steel industry experiencing a paradigm shift - Usiminas
BNamericas quoted Mr Julian Eguren CEO of Usiminas as saying that the Brazilian steel industry is experiencing a paradigm shift. He added that "Currently, a steel company should have its own iron ore production as a precondition for competitiveness." According to the executive, the steel industry is still adapting to changes in the iron ore pricing system, which in 2010 moved from the annual benchmark pricing to a quarterly system and subsequently to a spot market. He said that "It's been hard to predict market behavior." Usiminas finance VP Mr Ronald Seckelmann said the steelmaker has resources to finance its mining projects and is not working to increase capital in 2012, although the cash flow environment has been under pressure in recent quarters. He added that "Usiminas' mining projects already have enough resources." Mr Seckelmann's comments come in response to reports saying that Usiminas is preparing an operation of at least BRL 1.5 billion to increase its capital and may also sell assets to leverage investments due to the company's weak operating cash flow. (Business News Americas)
Australia commodity index down 0.7 pct in June-RBA
The Reserve Bank of Australia's (RBA) index of commodity prices fell 0.7 percent in June, from May, due mainly to falls in oil and thermal coal. In May, the index declined by a revised 1.3 percent in special drawing rights (SDR) terms. The index reading of 132.6 in June was 10.5 percent lower than the same month last year. Much of that decline was due to lower prices for iron ore and coking coal. In Australian dollar terms, the index slipped 1.7 percent in June, leaving it down 9.9 percent for the year. (Reuters)
Iran, Iraq and Venezuela form alliance within OPEC to stabilize
petroleum prices
Iran, Venezuela and Iraq have formed an alliance within OPEC to stabilize oil prices in the light of Saudi Arabia’s efforts. UAE and Libya increased oil production to compensate the ban on imports of petroleum from Iran. Saudi Arabia reached an extraction rate of 10 billion barrels daily trying to reduce oil prices to $60. Iranian Petroleum Minister Rostem Qasemi requested Iraqi Petroleum Minister Qerim Al-Ayibi to hold an emergency meeting of OPEC to discuss reduction of quotas for oil extraction. Venezuelan Petroleum Minister Rafael Ramirez is discussing the problem with Ecuador and Algeria. (Tehran Times)
Nickel price decreases push stainless steel values lower
Stainless steel transaction prices are heavily influenced by raw material values. Producers in the Far East amend effective prices to reflect input costs, while mills in Europe and North America issue monthly alloy surcharges, which are based on published prices for the main ingredients of the product. The effect of these surcharges is substantial. For example, while the basis price for type 304 cold rolled coil in Germany has moved within a band of only €50 per tonne, between January and June this year, the difference between the high and low applicable surcharges for that grade, during the same period, is €223 per tonne. Furthermore, the June alloy extra, at €1418 per tonne, is 59 percent of the transaction value. By far the biggest contributor to these input costs is nickel. Even at the current LME figure, less than US$17,000 per tonne, which is very low in terms of recent history, the value of nickel units in grade 304 stainless steel represents over 50 percent of the transaction price of the product. Consequently, participants in the stainless steel market should take notice of factors likely to affect the price of nickel in the short-to-medium term. A surplus in the supply-demand balance is forecast for 2012 and 2013. Growth in consumption by stainless steel makers will be restrained by moderate demand, while industry consolidation, such as the proposed merger between Outokumpu and Inoxum, will lead to the closure of some production facilities. Furthermore, as a traded commodity, nickel prices are affected by the actions of traders and investors who are not connected to any physical operations related to the production or consumption of the metal. While commodities are generally considered a safe long-term bet, many traders earn their living by reacting to short-term fluctuations in the markets. Commodity prices tend to react negatively to periods of intense market stress, such as the present eurozone crisis. Moreover, some observers believe the so-called "commodities supercycle" could be approaching its end, as there are signs of slowing demand growth from China. However, the nickel miners will attempt to redress the balance by delaying or reducing the scale of new projects, or even cutting existing operations. Meanwhile, measures by China, the world's largest nickel producer, to comply with environmental guidelines, could lead to reduced output there. Assuming global economies recover sufficiently to allow a resumption of industrial growth, longer term nickel values would then take on a brighter outlook. (MEPS)
Shipping , Commodities & Financial News
2
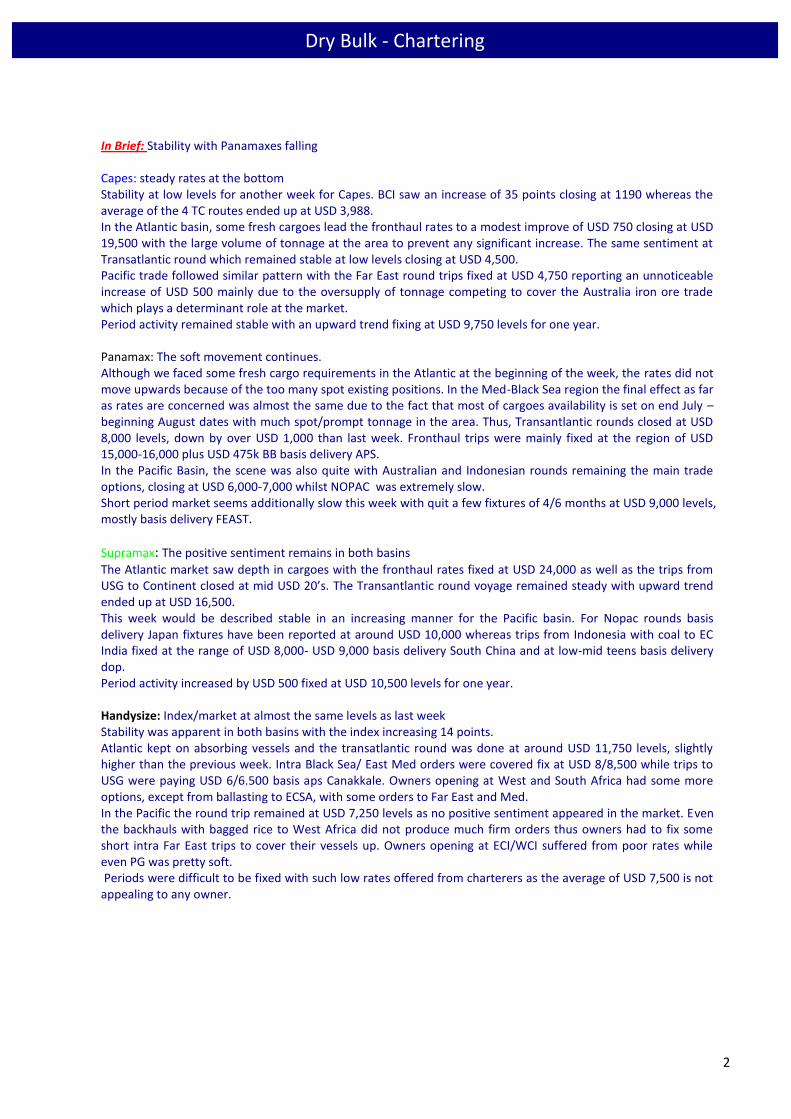
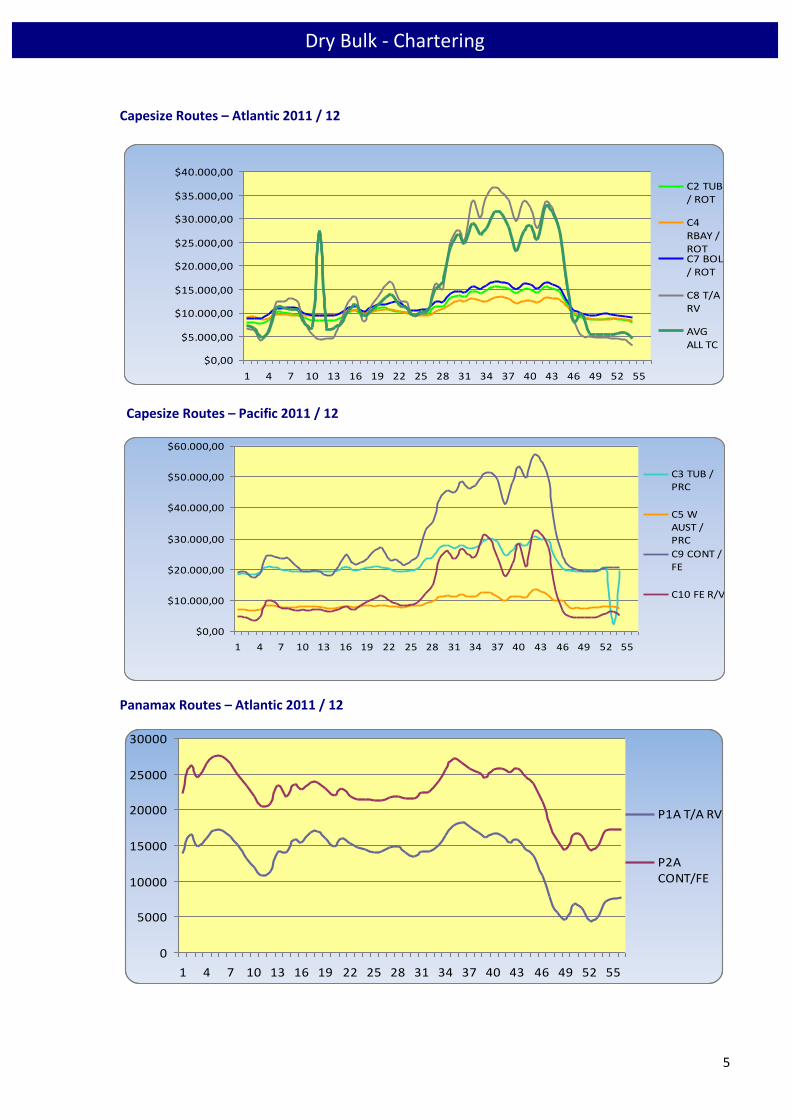
In Brief: Stability with Panamaxes falling Capes: steady rates at the bottom Stability at low levels for another week for Capes. BCI saw an increase of 35 points closing at 1190 whereas the average of the 4 TC routes ended up at USD 3,988. In the Atlantic basin, some fresh cargoes lead the fronthaul rates to a modest improve of USD 750 closing at USD 19,500 with the large volume of tonnage at the area to prevent any significant increase. The same sentiment at Transatlantic round which remained stable at low levels closing at USD 4,500. Pacific trade followed similar pattern with the Far East round trips fixed at USD 4,750 reporting an unnoticeable increase of USD 500 mainly due to the oversupply of tonnage competing to cover the Australia iron ore trade which plays a determinant role at the market. Period activity remained stable with an upward trend fixing at USD 9,750 levels for one year. Panamax: The soft movement continues. Although we faced some fresh cargo requirements in the Atlantic at the beginning of the week, the rates did not move upwards because of the too many spot existing positions. In the Med-Black Sea region the final effect as far as rates are concerned was almost the same due to the fact that most of cargoes availability is set on end July – beginning August dates with much spot/prompt tonnage in the area. Thus, Transantlantic rounds closed at USD 8,000 levels, down by over USD 1,000 than last week. Fronthaul trips were mainly fixed at the region of USD 15,000-16,000 plus USD 475k BB basis delivery APS. In the Pacific Basin, the scene was also quite with Australian and Indonesian rounds remaining the main trade options, closing at USD 6,000-7,000 whilst NOPAC was extremely slow. Short period market seems additionally slow this week with quit a few fixtures of 4/6 months at USD 9,000 levels, mostly basis delivery FEAST.
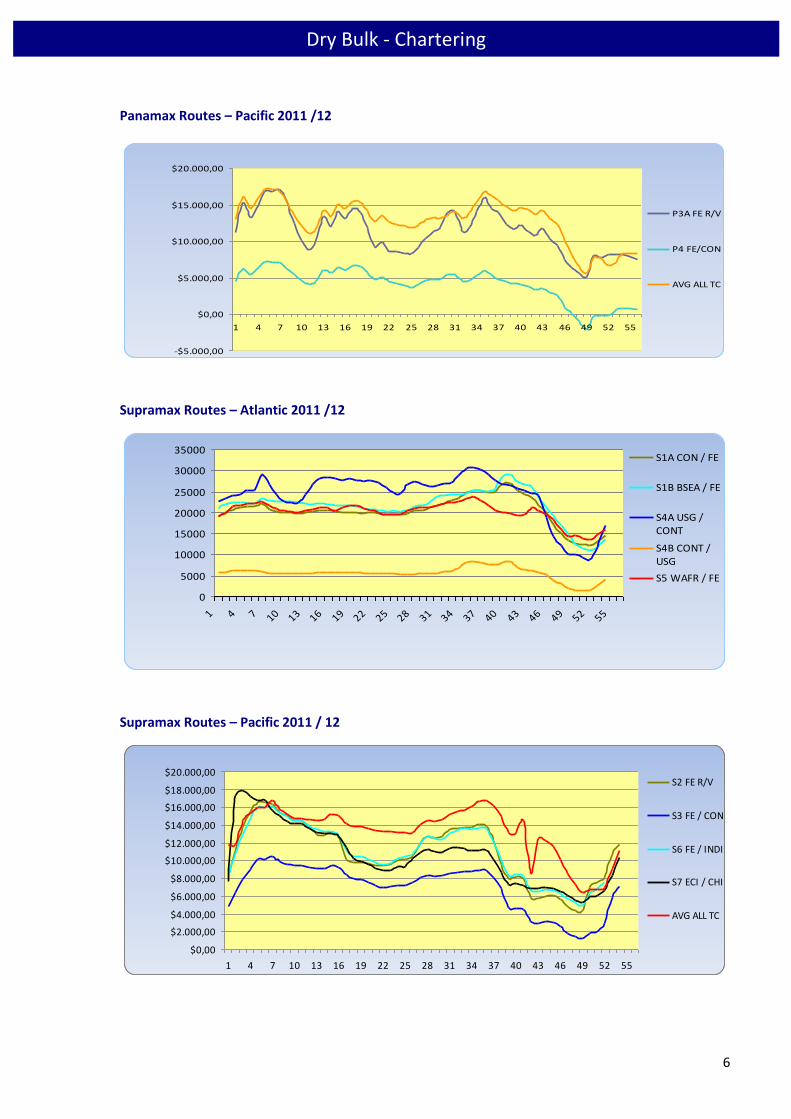
Supramax: The positive sentiment remains in both basins
The Atlantic market saw depth in cargoes with the fronthaul rates fixed at USD 24,000 as well as the trips from USG to Continent closed at mid USD 20’s. The Transantlantic round voyage remained steady with upward trend ended up at USD 16,500. This week would be described stable in an increasing manner for the Pacific basin. For Nopac rounds basis delivery Japan fixtures have been reported at around USD 10,000 whereas trips from Indonesia with coal to EC India fixed at the range of USD 8,000- USD 9,000 basis delivery South China and at low-mid teens basis delivery dop. Period activity increased by USD 500 fixed at USD 10,500 levels for one year.
Handysize: Index/market at almost the same levels as last week Stability was apparent in both basins with the index increasing 14 points. Atlantic kept on absorbing vessels and the transatlantic round was done at around USD 11,750 levels, slightly higher than the previous week. Intra Black Sea/ East Med orders were covered fix at USD 8/8,500 while trips to USG were paying USD 6/6.500 basis aps Canakkale. Owners opening at West and South Africa had some more options, except from ballasting to ECSA, with some orders to Far East and Med. In the Pacific the round trip remained at USD 7,250 levels as no positive sentiment appeared in the market. Even the backhauls with bagged rice to West Africa did not produce much firm orders thus owners had to fix some short intra Far East trips to cover their vessels up. Owners opening at ECI/WCI suffered from poor rates while even PG was pretty soft. Periods were difficult to be fixed with such low rates offered from charterers as the average of USD 7,500 is not appealing to any owner.
Dry Bulk - Chartering
3
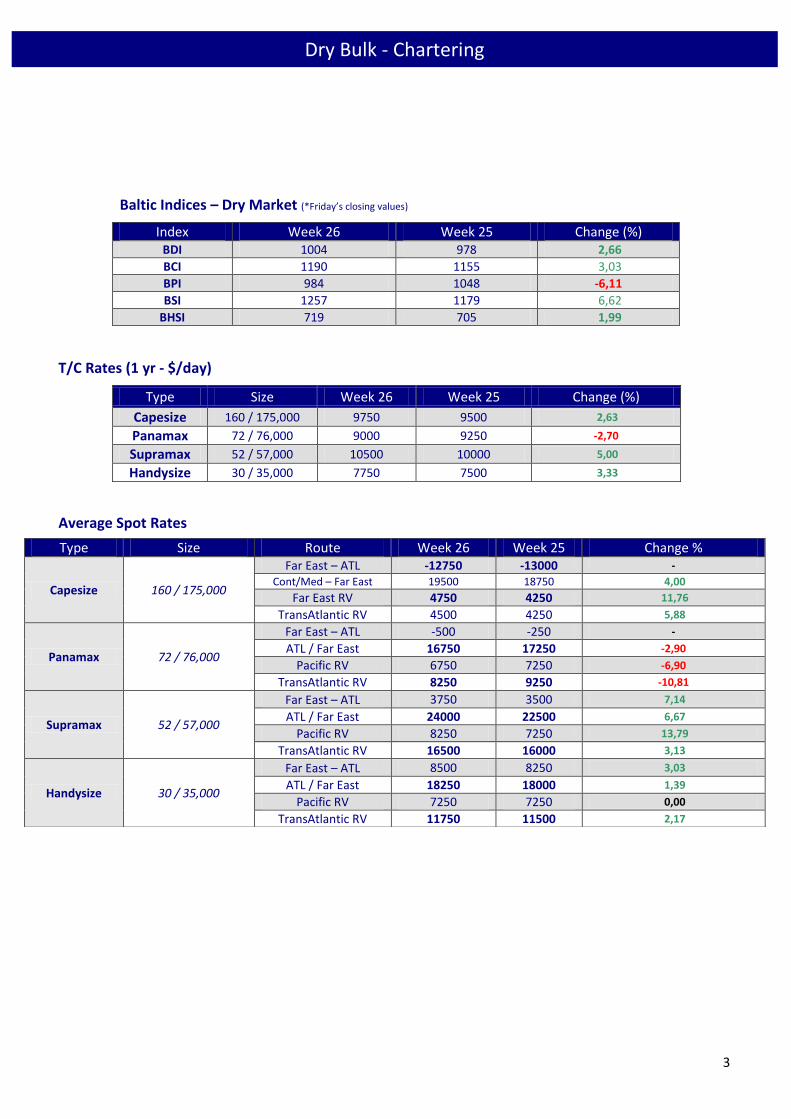
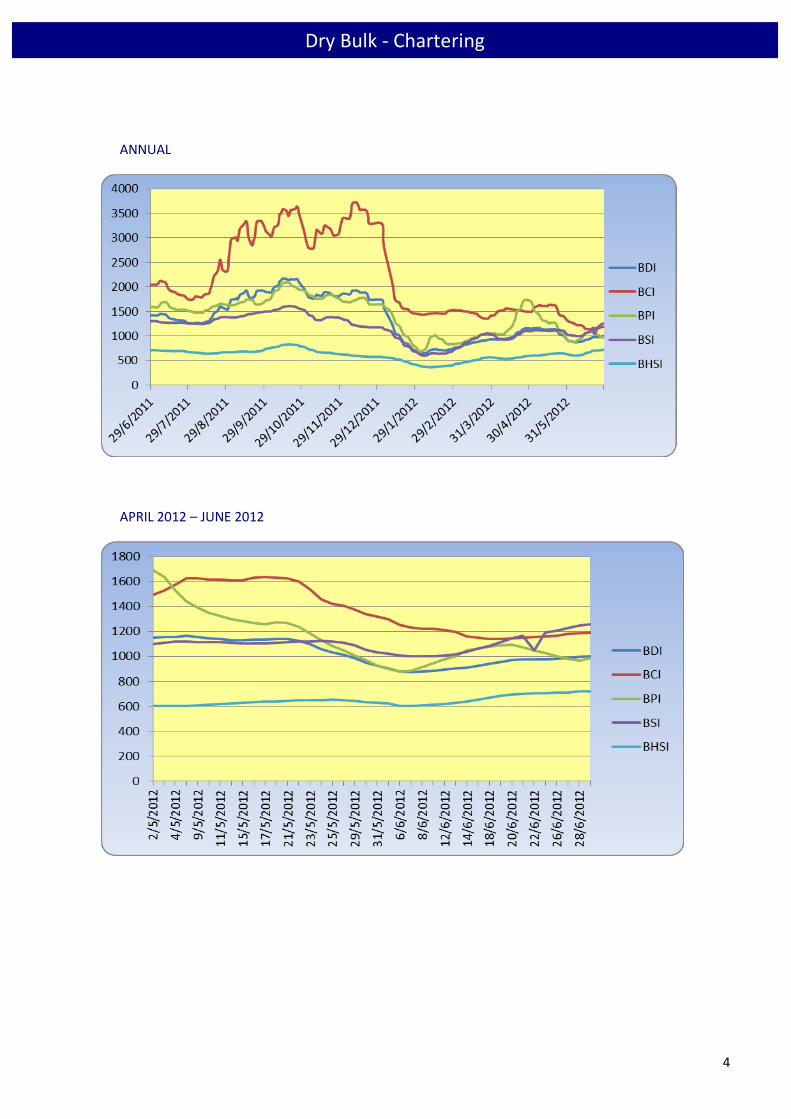
Baltic Indices – Dry Market (*Friday’s closing values)
Index Week 26 Week 25 Change (%) BDI 1004 978 2,66
BCI 1190 1155 3,03
BPI 984 1048 -6,11
BSI 1257 1179 6,62
BHSI 719 705 1,99
T/C Rates (1 yr - $/day)
Type Size Week 26 Week 25 Change (%)
Capesize 160 / 175,000 9750 9500 2,63
Panamax 72 / 76,000 9000 9250 -2,70
Supramax 52 / 57,000 10500 10000 5,00
Handysize 30 / 35,000 7750 7500 3,33
Average Spot Rates
Type Size Route Week 26 Week 25 Change %
Capesize 160 / 175,000
Far East – ATL -12750 -13000 -
Cont/Med – Far East 19500 18750 4,00
Far East RV 4750 4250 11,76
TransAtlantic RV 4500 4250 5,88
Panamax 72 / 76,000
Far East – ATL -500 -250 -
ATL / Far East 16750 17250 -2,90
Pacific RV 6750 7250 -6,90
TransAtlantic RV 8250 9250 -10,81
Supramax 52 / 57,000
Far East – ATL 3750 3500 7,14
ATL / Far East 24000 22500 6,67
Pacific RV 8250 7250 13,79
TransAtlantic RV 16500 16000 3,13
Handysize 30 / 35,000
Far East – ATL 8500 8250 3,03
ATL / Far East 18250 18000 1,39
Pacific RV 7250 7250 0,00
TransAtlantic RV 11750 11500 2,17
Dry Bulk - Chartering
4
ANNUAL
APRIL 2012 – JUNE 2012
Dry Bulk - Chartering
5
Dry Bulk - Chartering
Capesize Routes – Atlantic 2011 / 12
$0,00
$5.000,00
$10.000,00
$15.000,00
$20.000,00
$25.000,00
$30.000,00
$35.000,00
$40.000,00
1 4 7 10 13 16 19 22 25 28 31 34 37 40 43 46 49 52 55
C2 TUB/ ROT
C4RBAY /ROTC7 BOL/ ROT
C8 T/ARV
AVGALL TC
Capesize Routes – Pacific 2011 / 12
$0,00
$10.000,00
$20.000,00
$30.000,00
$40.000,00
$50.000,00
$60.000,00
1 4 7 10 13 16 19 22 25 28 31 34 37 40 43 46 49 52 55
C3 TUB /PRC
C5 WAUST /PRC
C9 CONT /FE
C10 FE R/V
Panamax Routes – Atlantic 2011 / 12
0
5000
10000
15000
20000
25000
30000
1 4 7 10 13 16 19 22 25 28 31 34 37 40 43 46 49 52 55
P1A T/A RV
P2ACONT/FE
6
Dry Bulk - Chartering
Panamax Routes – Pacific 2011 /12
-$5.000,00
$0,00
$5.000,00
$10.000,00
$15.000,00
$20.000,00
1 4 7 10 13 16 19 22 25 28 31 34 37 40 43 46 49 52 55
P3A FE R/V
P4 FE/CON
AVG ALL TC
Supramax Routes – Atlantic 2011 /12
0
5000
10000
15000
20000
25000
30000
35000
1 4 7 10 13 16 19 22 25 28 31 34 37 40 43 46 49 52 55
S1A CON / FE
S1B BSEA / FE
S4A USG /CONT
S4B CONT /USG
S5 WAFR / FE
Supramax Routes – Pacific 2011 / 12
$0,00
$2.000,00
$4.000,00
$6.000,00
$8.000,00
$10.000,00
$12.000,00
$14.000,00
$16.000,00
$18.000,00
$20.000,00
1 4 7 10 13 16 19 22 25 28 31 34 37 40 43 46 49 52 55
S2 FE R/V
S3 FE / CON
S6 FE / INDI
S7 ECI / CHI
AVG ALL TC
7
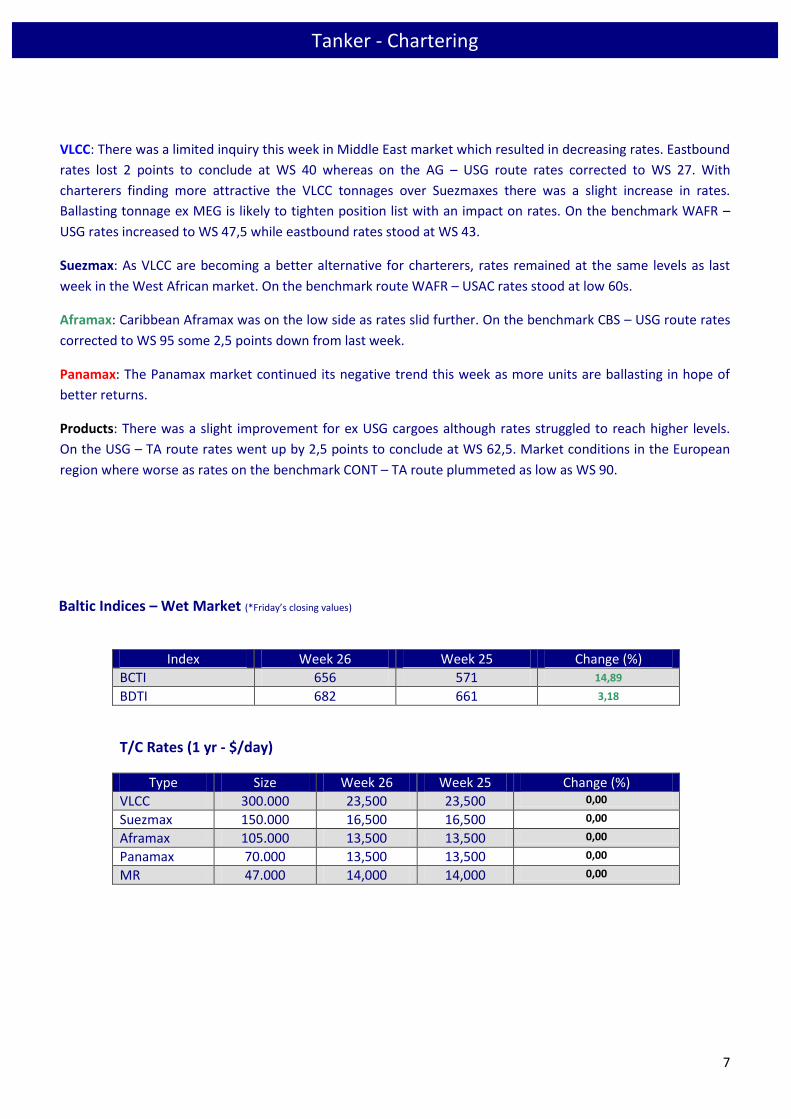
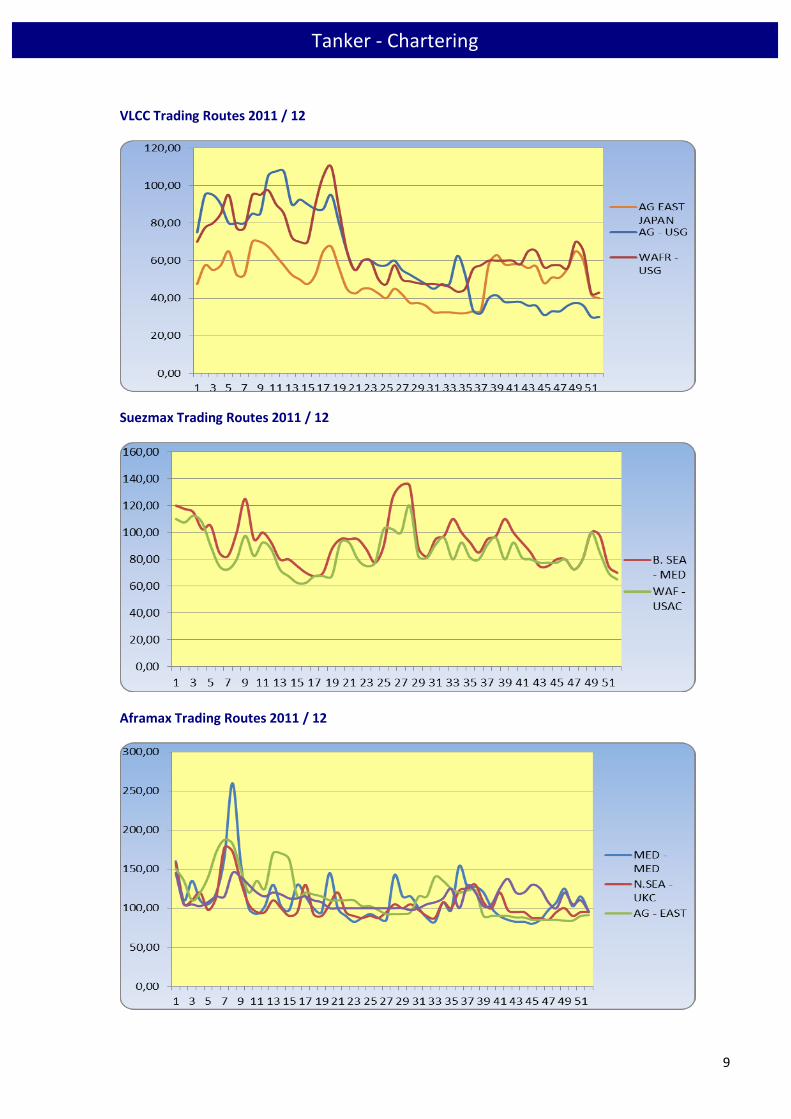
VLCC: There was a limited inquiry this week in Middle East market which resulted in decreasing rates. Eastbound
rates lost 2 points to conclude at WS 40 whereas on the AG – USG route rates corrected to WS 27. With
charterers finding more attractive the VLCC tonnages over Suezmaxes there was a slight increase in rates.
Ballasting tonnage ex MEG is likely to tighten position list with an impact on rates. On the benchmark WAFR –
USG rates increased to WS 47,5 while eastbound rates stood at WS 43.
Suezmax: As VLCC are becoming a better alternative for charterers, rates remained at the same levels as last
week in the West African market. On the benchmark route WAFR – USAC rates stood at low 60s.
Aframax: Caribbean Aframax was on the low side as rates slid further. On the benchmark CBS – USG route rates
corrected to WS 95 some 2,5 points down from last week.
Panamax: The Panamax market continued its negative trend this week as more units are ballasting in hope of
better returns.
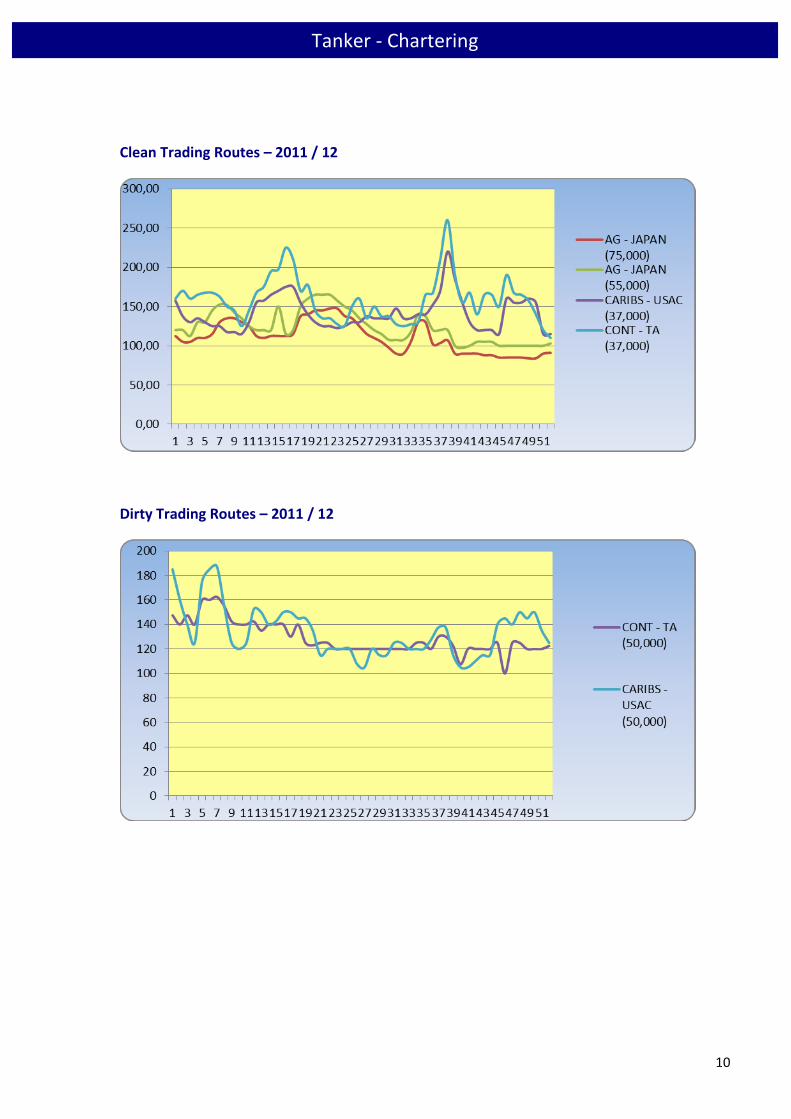
Products: There was a slight improvement for ex USG cargoes although rates struggled to reach higher levels.
On the USG – TA route rates went up by 2,5 points to conclude at WS 62,5. Market conditions in the European
region where worse as rates on the benchmark CONT – TA route plummeted as low as WS 90.
Baltic Indices – Wet Market (*Friday’s closing values)
Index Week 26 Week 25 Change (%)
BCTI 656 571 14,89
BDTI 682 661 3,18
T/C Rates (1 yr - $/day)
Type Size Week 26 Week 25 Change (%)
VLCC 300.000 23,500 23,500 0,00
Suezmax 150.000 16,500 16,500 0,00
Aframax 105.000 13,500 13,500 0,00
Panamax 70.000 13,500 13,500 0,00
MR 47.000 14,000 14,000 0,00
Tanker - Chartering
8
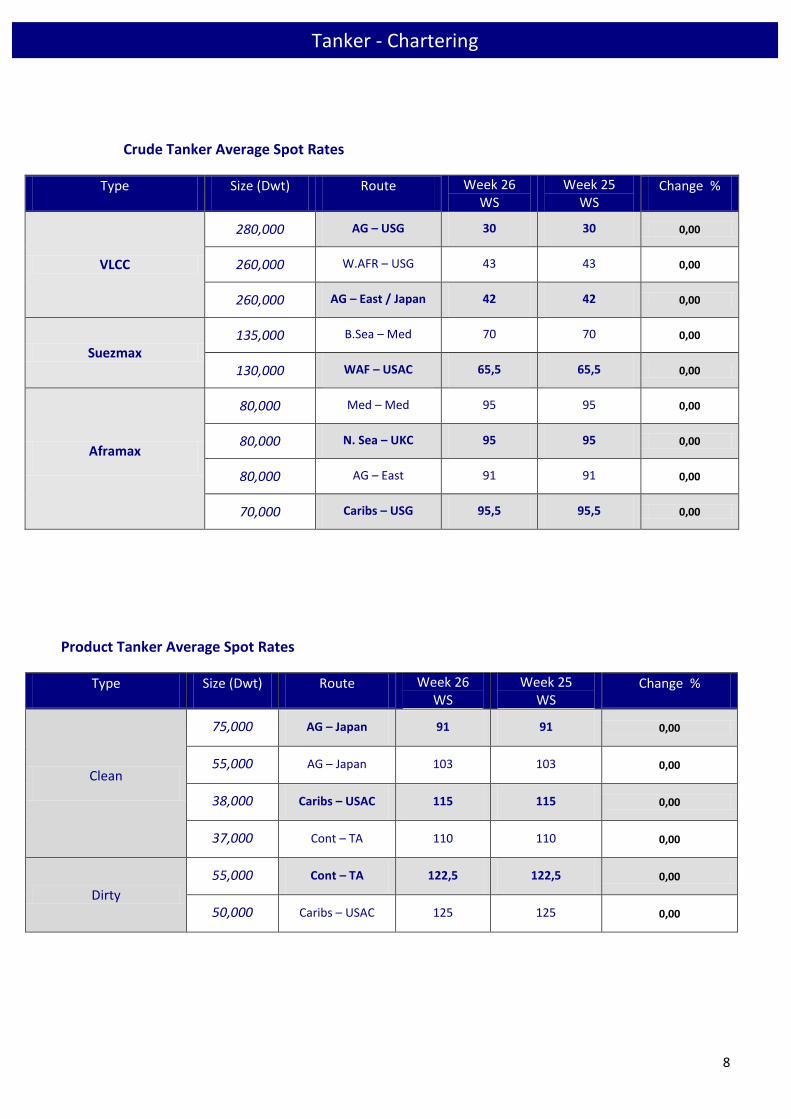
Crude Tanker Average Spot Rates
Type Size (Dwt) Route Week 26 WS
Week 25 WS
Change %
VLCC
280,000 AG – USG 30 30 0,00
260,000 W.AFR – USG 43 43 0,00
260,000 AG – East / Japan 42 42 0,00
Suezmax 135,000 B.Sea – Med 70 70 0,00
130,000 WAF – USAC 65,5 65,5 0,00
Aframax
80,000 Med – Med 95 95 0,00
80,000 N. Sea – UKC 95 95 0,00
80,000 AG – East 91 91 0,00
70,000 Caribs – USG 95,5 95,5 0,00
Product Tanker Average Spot Rates
Type Size (Dwt) Route Week 26 WS
Week 25 WS
Change %
Clean
75,000 AG – Japan 91 91 0,00
55,000 AG – Japan 103 103 0,00
38,000 Caribs – USAC 115 115 0,00
37,000 Cont – TA 110 110 0,00
Dirty
55,000 Cont – TA 122,5 122,5 0,00
50,000 Caribs – USAC 125 125 0,00
Tanker - Chartering
9
VLCC Trading Routes 2011 / 12
Suezmax Trading Routes 2011 / 12
Aframax Trading Routes 2011 / 12
Tanker - Chartering
10
Clean Trading Routes – 2011 / 12
Dirty Trading Routes – 2011 / 12
Tanker - Chartering
11
Buyers chasing Large bulkers
Numerous sales have been reported last week in the dry sector where buyers show willingness to seize current price levels.
Focus has been on vessels built in the nineties as well as modern tonnages. In the tanker sector, activity was significantly
lower with few reported transactions.
Capesize M/V “Gaia” (169,963 DWT built in 1999 in Daewoo, KRS) is reported sold for USD 15,5 Mill to Greek buyers.
Modern Panamax M/V “Oceanic Breeze” (77,075 DWT built in 2005 in Namura, JPN) is reported sold to Greek buyers as
well for USD 21,3 Mill.
The most notable tanker sale this week has been of Aframax M/T “Intrepid Reliance” (104,403 DWT built in 2002 in Namura,
JPN). The vessel was reported sold to European buyers to an undisclosed sum.
NEWBUILDINGS
In the newbuilding market, we have seen 6 vessels reported to have been contracted.
2 Tankers (Aframax)
4 Bulk carriers (Handysize, Supramax)
DEMOLITION
In Bangladesh end buyers have started to offer for various vessels in view of steel plate prices providing them with some
confidence. The Indian market has started seeing some signs of confidence after many weeks of depressed business.
Pakistan is showing its preference for tankers with buyers still there to acquire tonnages. Chinese market has slowed down
it activity with buyers simply being patient.
Sale & Purchase
12
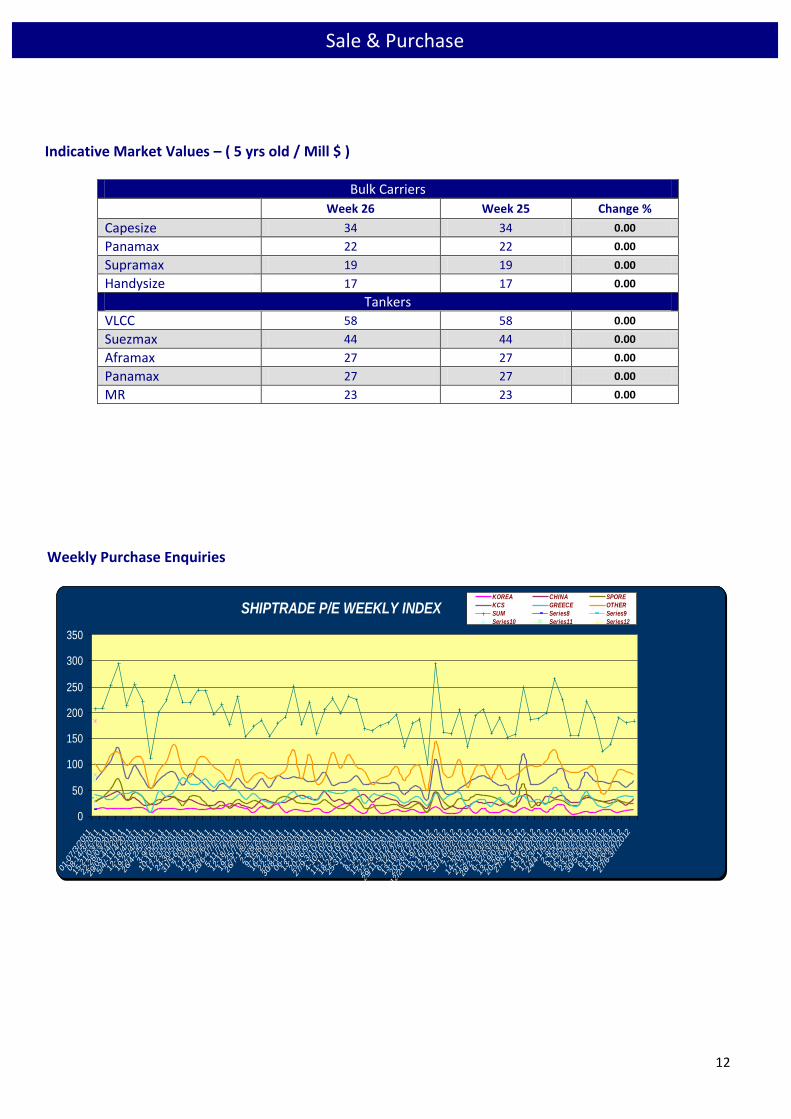
Indicative Market Values – ( 5 yrs old / Mill $ )
Bulk Carriers
Week 26 Week 25 Change %
Capesize 34 34 0.00
Panamax 22 22 0.00
Supramax 19 19 0.00
Handysize 17 17 0.00
Tankers
VLCC 58 58 0.00
Suezmax 44 44 0.00
Aframax 27 27 0.00
Panamax 27 27 0.00
MR 23 23 0.00
Weekly Purchase Enquiries
SHIPTRADE P/E WEEKLY INDEX
0
50
100
150
200
250
300
350
01-07/3/201
1
08-14/3/201
1
15-21/03/20
11
22-28/03/20
11
29/03
-4/4/201
1
5/4/-11/4/20
11
12-18/4/201
1
19-25/4/201
1
26/4-2/5/2011
3-9/5/2011
10-16/5/201
1
17-23/5/201
1
24-30/5/201
1
31/5-6/6/2011
7-13/6/2011
14-20/6/201
1
21-27/6/201
1
28/6-4/7/2011
5-11/7/2011
12-18/7/201
1
19-25/7/201
1
26/7-1/8/2011
2-8/8/2011
9-15/8/2011
16-21/8/201
1
22-29/8/201
1
30/8-05/9/201
1
06-12/9/201
1
13-19/9/201
1
20-26/9/201
1
27/9-3/10/201
1
4-10/10/201
1
11-17/10/20
11
18-24/10/20
11
25-31/10/20
11
1-7/11/2011
8-14/11/201
1
15-21/11/20
11
22-28/11/20
11
29/11
-5/12/20
11
6-12/12/201
1
13-19/12/20
11
20-26/12/20
11
27/12
/2011
-9/1/2012
10-16/1/201
2
17-23/1/201
2
24-30/1/201
2
31/1-6/2/2012
7-13/2/2012
14-20/02/20
12
21-27/02/20
12
28/2-5/03/201
2
6-12/03/201
2
13-19/03/20
12
20-26/03/20
12
27/3-2/4/2012
3-9/4/2012
10-16/4/201
2
17-23/4/201
2
24/4-1/5/2012
2-8/5/2012
9-15/5/2012
16-22/5/201
2
23-29/5/201
2
30/5-5/6/2012
6-12/6/2012
13-19/6/201
2
20-26/6/201
2
27/6-3/7/2012
KOREA CHINA SPORE
KCS GREECE OTHER
SUM Series8 Series9
Series10 Series11 Series12
Series13 Series14
Sale & Purchase
13
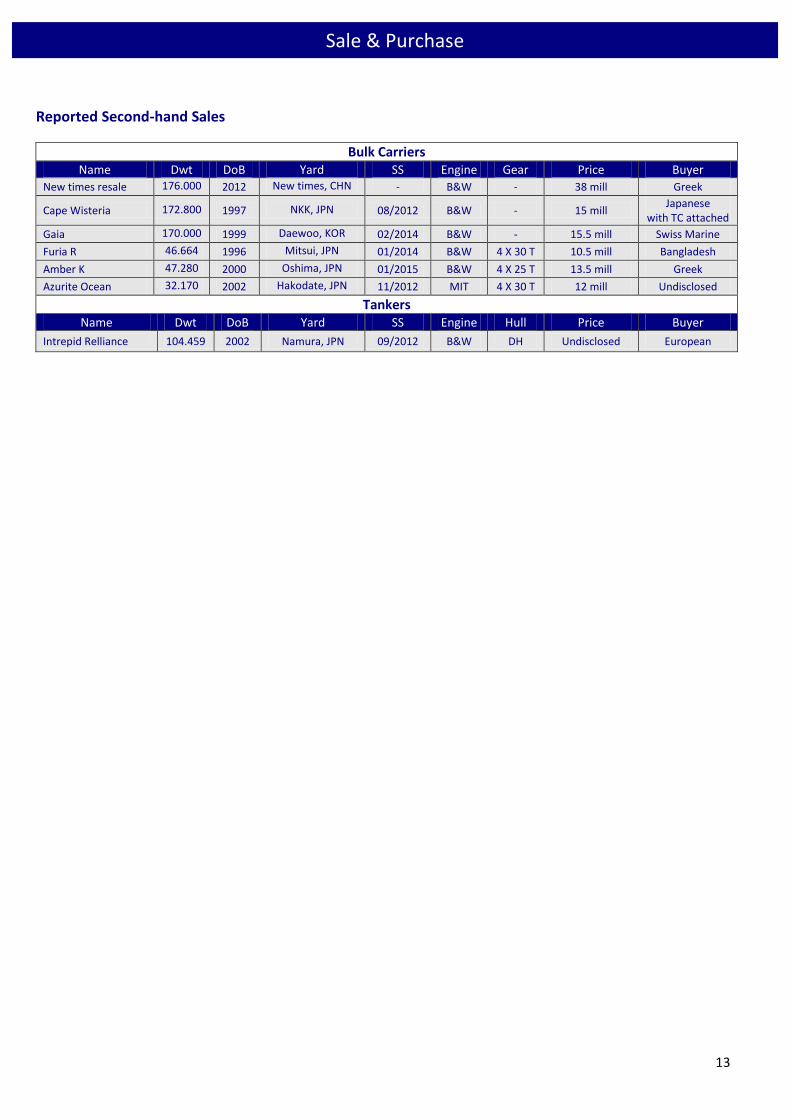
Reported Second-hand Sales
Bulk Carriers Name Dwt DoB Yard SS Engine Gear Price Buyer
New times resale 176.000 2012 New times, CHN - B&W - 38 mill Greek
Cape Wisteria 172.800 1997 NKK, JPN 08/2012 B&W - 15 mill Japanese
with TC attached
Gaia 170.000 1999 Daewoo, KOR 02/2014 B&W - 15.5 mill Swiss Marine
Furia R 46.664 1996 Mitsui, JPN 01/2014 B&W 4 X 30 T 10.5 mill Bangladesh
Amber K 47.280 2000 Oshima, JPN 01/2015 B&W 4 X 25 T 13.5 mill Greek
Azurite Ocean 32.170 2002 Hakodate, JPN 11/2012 MIT 4 X 30 T 12 mill Undisclosed
Tankers Name Dwt DoB Yard SS Engine Hull Price Buyer
Intrepid Relliance 104.459 2002 Namura, JPN 09/2012 B&W DH Undisclosed European
Sale & Purchase
14
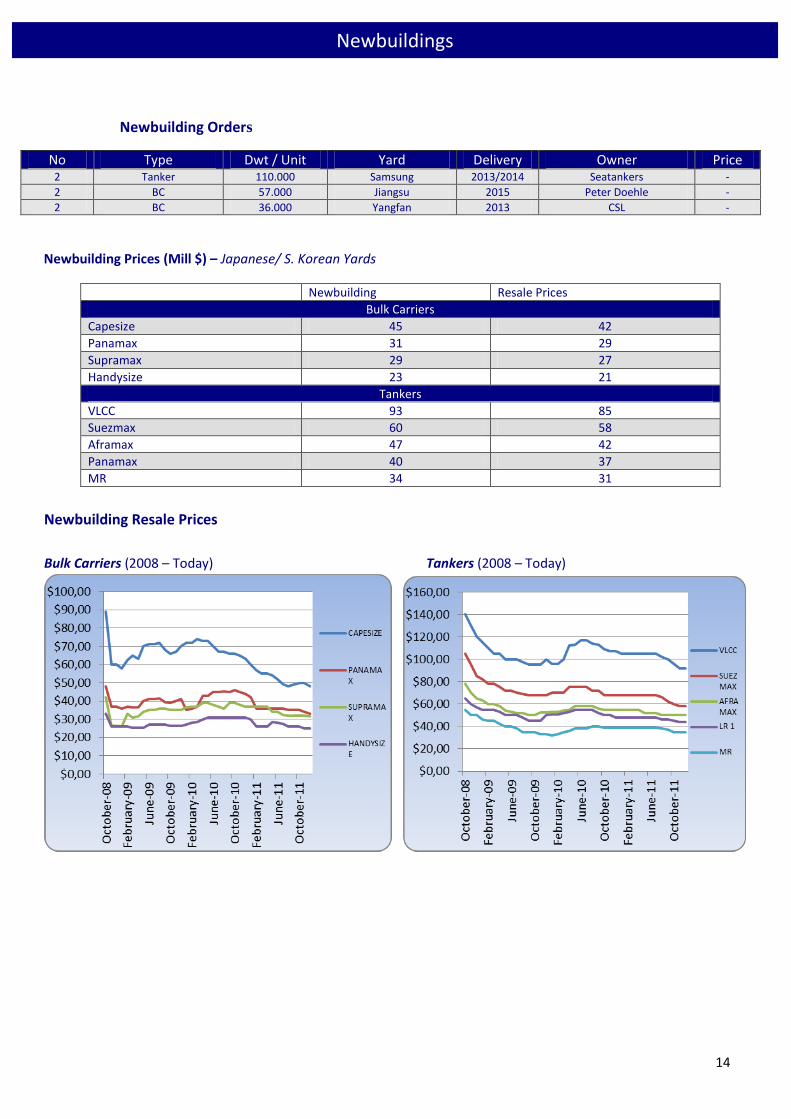
Newbuilding Orders
No Type Dwt / Unit Yard Delivery Owner Price 2 Tanker 110.000 Samsung 2013/2014 Seatankers -
2 BC 57.000 Jiangsu 2015 Peter Doehle -
2 BC 36.000 Yangfan 2013 CSL -
Newbuilding Prices (Mill $) – Japanese/ S. Korean Yards
Newbuilding Resale Prices
Bulk Carriers
Capesize 45 42
Panamax 31 29
Supramax 29 27
Handysize 23 21
Tankers
VLCC 93 85
Suezmax 60 58
Aframax 47 42
Panamax 40 37
MR 34 31
Newbuilding Resale Prices
Bulk Carriers (2008 – Today) Tankers (2008 – Today)
Newbuildings
15
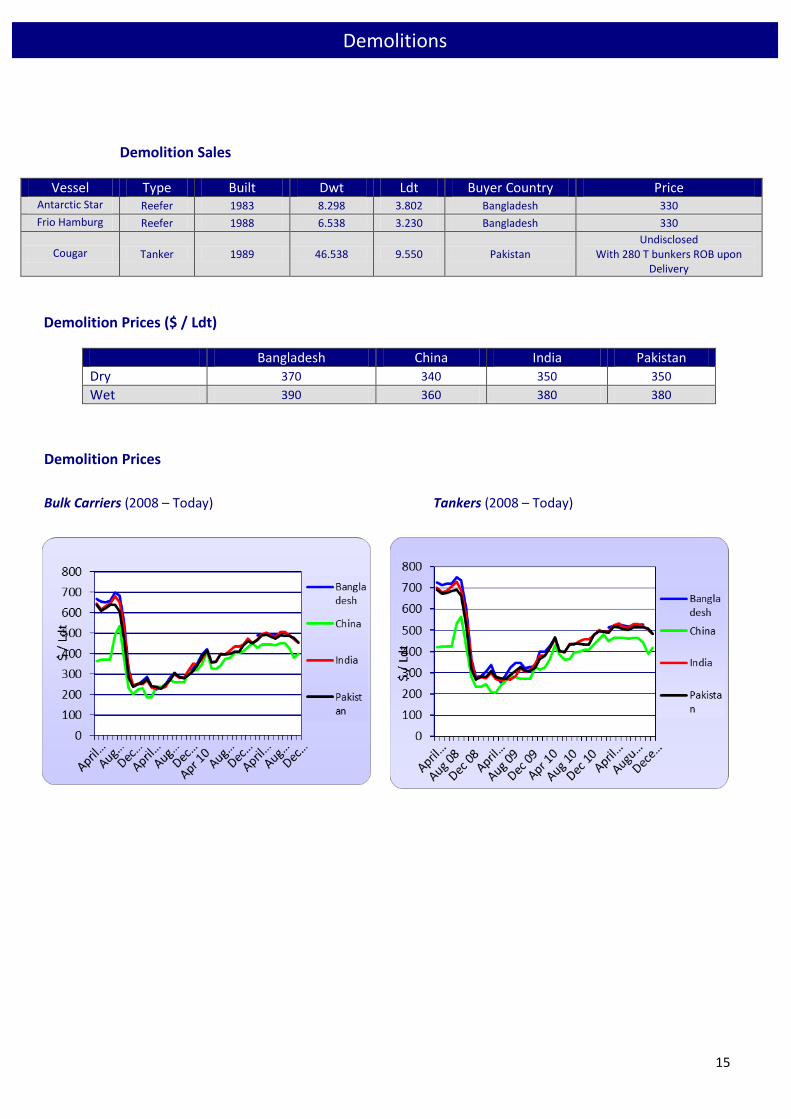
Demolition Sales
Vessel Type Built Dwt Ldt Buyer Country Price Antarctic Star Reefer 1983 8.298 3.802 Bangladesh 330
Frio Hamburg Reefer 1988 6.538 3.230 Bangladesh 330
Cougar Tanker 1989 46.538 9.550 Pakistan Undisclosed
With 280 T bunkers ROB upon Delivery
Demolition Prices ($ / Ldt)
Bangladesh China India Pakistan
Dry 370 340 350 350
Wet 390 360 380 380
Demolition Prices
Bulk Carriers (2008 – Today) Tankers (2008 – Today)
Demolitions
16
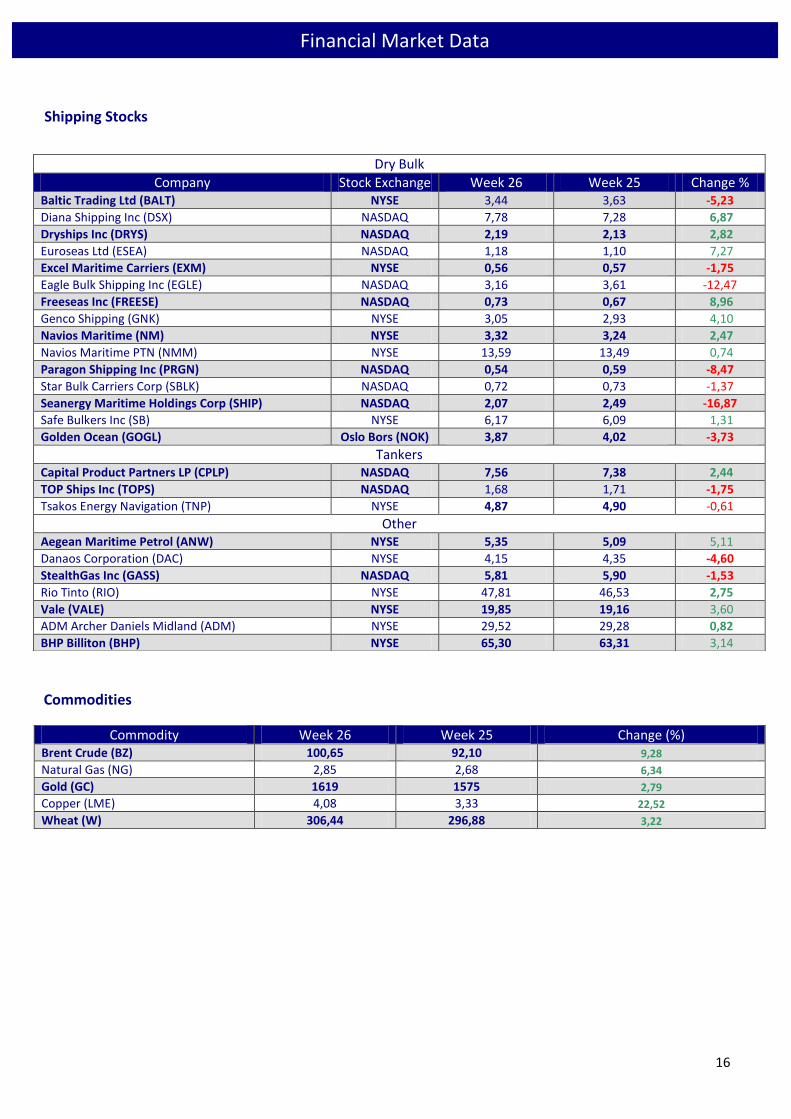
Shipping Stocks
Commodities
Commodity Week 26 Week 25 Change (%) Brent Crude (BZ) 100,65 92,10 9,28
Natural Gas (NG) 2,85 2,68 6,34
Gold (GC) 1619 1575 2,79
Copper (LME) 4,08 3,33 22,52
Wheat (W) 306,44 296,88 3,22
Dry Bulk
Company Stock Exchange Week 26 Week 25 Change % Baltic Trading Ltd (BALT) NYSE 3,44 3,63 -5,23
Diana Shipping Inc (DSX) NASDAQ 7,78 7,28 6,87
Dryships Inc (DRYS) NASDAQ 2,19 2,13 2,82
Euroseas Ltd (ESEA) NASDAQ 1,18 1,10 7,27
Excel Maritime Carriers (EXM) NYSE 0,56 0,57 -1,75
Eagle Bulk Shipping Inc (EGLE) NASDAQ 3,16 3,61 -12,47
Freeseas Inc (FREESE) NASDAQ 0,73 0,67 8,96
Genco Shipping (GNK) NYSE 3,05 2,93 4,10
Navios Maritime (NM) NYSE 3,32 3,24 2,47
Navios Maritime PTN (NMM) NYSE 13,59 13,49 0,74
Paragon Shipping Inc (PRGN) NASDAQ 0,54 0,59 -8,47
Star Bulk Carriers Corp (SBLK) NASDAQ 0,72 0,73 -1,37
Seanergy Maritime Holdings Corp (SHIP) NASDAQ 2,07 2,49 -16,87
Safe Bulkers Inc (SB) NYSE 6,17 6,09 1,31
Golden Ocean (GOGL) Oslo Bors (NOK) 3,87 4,02 -3,73
Tankers Capital Product Partners LP (CPLP) NASDAQ 7,56 7,38 2,44
TOP Ships Inc (TOPS) NASDAQ 1,68 1,71 -1,75
Tsakos Energy Navigation (TNP) NYSE 4,87 4,90 -0,61
Other
Aegean Maritime Petrol (ANW) NYSE 5,35 5,09 5,11
Danaos Corporation (DAC) NYSE 4,15 4,35 -4,60
StealthGas Inc (GASS) NASDAQ 5,81 5,90 -1,53
Rio Tinto (RIO) NYSE 47,81 46,53 2,75
Vale (VALE) NYSE 19,85 19,16 3,60
ADM Archer Daniels Midland (ADM) NYSE 29,52 29,28 0,82
BHP Billiton (BHP) NYSE 65,30 63,31 3,14
Financial Market Data
17
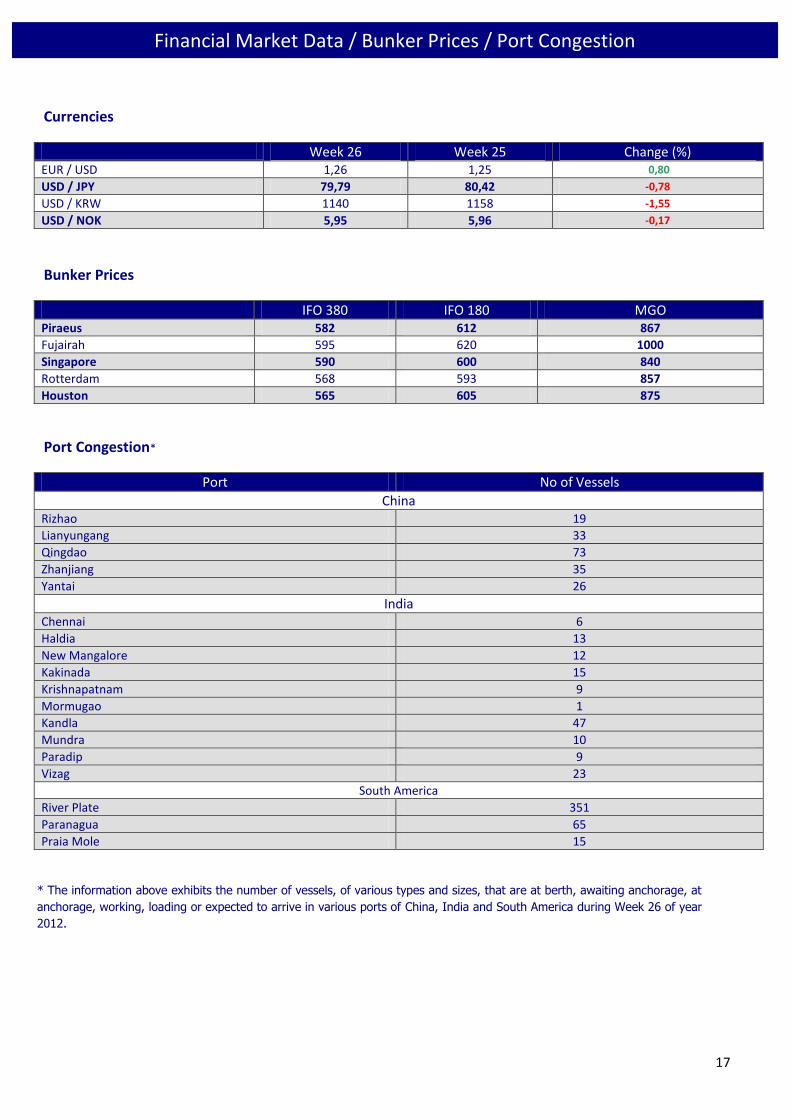
Currencies
Week 26 Week 25 Change (%) EUR / USD 1,26 1,25 0,80
USD / JPY 79,79 80,42 -0,78
USD / KRW 1140 1158 -1,55
USD / NOK 5,95 5,96 -0,17
Bunker Prices
IFO 380 IFO 180 MGO Piraeus 582 612 867
Fujairah 595 620 1000
Singapore 590 600 840
Rotterdam 568 593 857
Houston 565 605 875
Port Congestion*
Port No of Vessels
China Rizhao 19
Lianyungang 33
Qingdao 73
Zhanjiang 35
Yantai 26
India
Chennai 6
Haldia 13
New Mangalore 12
Kakinada 15
Krishnapatnam 9
Mormugao 1
Kandla 47
Mundra 10
Paradip 9
Vizag 23
South America
River Plate 351
Paranagua 65
Praia Mole 15
* The information above exhibits the number of vessels, of various types and sizes, that are at berth, awaiting anchorage, at
anchorage, working, loading or expected to arrive in various ports of China, India and South America during Week 26 of year
2012.
Financial Market Data / Bunker Prices / Port Congestion