
Weekly Report Drought Monitor / Snowpack Update€¦ · Web viewWeekly Snowpack and Drought...
27
Natural Resources Conservation Service P.O. Box 2890 Washington, D.C. 20013 _________________________________________________________________________________________________ ____ Weekly Report - Snowpack / Drought Monitor Update Date: 22 December 2011 SNOTEL SNOWPACK AND PRECIPITATION SUMMARY Snow: Snow Water-Equivalent : The Northern Tier States continue to decline while Arizona and New Mexico continues to gain (Fig. 1). 7- Day Snow Depth Change ending this morning shows generally light accumulation over much of the West except over Arizona and the peripheral of the Great Basin where accumulation decreased (Fig. 1a). Wet snows that occurred over this region earlier this week melted somewhat; thus the reason for increased SWE of the remaining snow while actual snow depth decreased. Temperature: SNOTEL and ACIS 7-day temperature anomaly shows a mixed pattern of temperature departures. Generally, temperatures fell within ±5°F of the typical value for this time of year (Fig. 2). ACIS 7-day average temperature anomalies show the greatest positive temperature departures over northern Montana (>+10°F) and the greatest negative departures over southwest Wyoming, south-central Colorado, southwest Utah, and southwest Arizona (<-6°F). This pattern is opposition of a typical La Niña (Fig. 2a). Precipitation: ACIS 7-day average precipitation amounts for the period ending yesterday shows the greatest amounts over the Pacific NW Coast and Cascade Ranges (Fig. 3). However, in terms of percent of normal, the Southwest got hammered with storms driven by the sub-tropical jet stream (Fig 3a). Thus far since, the start of the 2012 Water-Year that began on 1 October 2011, the seasonal moisture has favored the Southwest while the Great Basin and Cascades have seen significant deficits (Fig. 3b). Weekly Weather Summary: During the past week, the active storm track across the 48 contiguous states was oriented from the southwest to the northeast, passing over the Middle Mississippi River and Ohio River Valleys. The first storm system moved from the Central High Plains to the Great Lakes in two days, spreading precipitation along most of the The Natural Resources Conservation Service provides leadership in a partnership effort to help people conserve maintain and improve our natural resources and environment An Equal Opportunity Employer
Transcript of Weekly Report Drought Monitor / Snowpack Update€¦ · Web viewWeekly Snowpack and Drought...

Natural Resources Conservation ServiceP.O. Box 2890Washington, D.C. 20013_____________________________________________________________________________________________________
Weekly Report - Snowpack / Drought Monitor Update Date: 22 December 2011
SNOTEL SNOWPACK AND PRECIPITATION SUMMARY
Snow: Snow Water-Equivalent: The Northern Tier States continue to decline while Arizona and New Mexico continues to gain (Fig. 1). 7-Day Snow Depth Change ending this morning shows generally light accumulation over much of the West except over Arizona and the peripheral of the Great Basin where accumulation decreased (Fig. 1a). Wet snows that occurred over this region earlier this week melted somewhat; thus the reason for increased SWE of the remaining snow while actual snow depth decreased.
Temperature: SNOTEL and ACIS 7-day temperature anomaly shows a mixed pattern of temperature departures. Generally, temperatures fell within ±5°F of the typical value for this time of year (Fig. 2). ACIS 7-day average temperature anomalies show the greatest positive temperature departures over northern Montana (>+10°F) and the greatest negative departures over southwest Wyoming, south-central Colorado, southwest Utah, and southwest Arizona (<-6°F). This pattern is opposition of a typical La Niña (Fig. 2a).
Precipitation: ACIS 7-day average precipitation amounts for the period ending yesterday shows the greatest amounts over the Pacific NW Coast and Cascade Ranges (Fig. 3). However, in terms of percent of normal, the Southwest got hammered with storms driven by the sub-tropical jet stream (Fig 3a). Thus far since, the start of the 2012 Water-Year that began on 1 October 2011, the seasonal moisture has favored the Southwest while the Great Basin and Cascades have seen significant deficits (Fig. 3b).
Weekly Weather Summary: During the past week, the active storm track across the 48 contiguous states was oriented from the southwest to the northeast, passing over the Middle Mississippi River and Ohio River Valleys. The first storm system moved from the Central High Plains to the Great Lakes in two days, spreading precipitation along most of the Ohio and Tennessee River Valleys. The cold front associated with that system cleared the east coast during the weekend. The next storm system developed over the southwest and moved eastward, spreading rain and snow to the southern Rockies and Great Plains. The heaviest precipitation fell over the central Great Plains, Midwest, and Lower Great Lakes. Dry conditions were generally observed over the southeast, Intermountain West and Northern Great Plains.
Southwest: Multiple storm systems have brought drought relieving precipitation to much of Arizona, especially southern Arizona. Rainfall totals ranged from 0.5 – 2.8 inches during the past week. Thirty day precipitation totals are in excess of 150 percent of normal across much of the region with isolated areas receiving more than 200 percent of normal over the past 60 days. Beyond 90 days in the past, dry conditions are evident in the data, so a 1-category improvement is depicted.
The same weather systems that brought the much needed rains to Arizona and Texas also brought some rain and snows to New Mexico. Drought relief indicated in last week’s Drought Monitor was continued this week as more rains and snows (0.5 to 2.8 inches) fell mostly across southern New Mexico.
The Natural Resources Conservation Service provides leadership in a partnership effort to help peopleconserve maintain and improve our natural resources and environment
An Equal Opportunity Employer

Weekly Snowpack and Drought Monitor Update Report
West: Abnormal dryness was expanded across portions of California, Nevada, and Oregon. Precipitation deficits continue to mount as a dry pattern has been in place across the Intermountain West for the past 90 days. The depiction was based on a combination of SPI blends, Objective Drought Indicator Blends, soil moisture models and percent of normal precipitation (where precipitation during the past 30-, 60-, and 90-day periods was less than 50 percent of normal). The area around Redding, CA has received little rain, with one observer reporting .11 inch during the month of December. Additionally, ski resorts are being impacted due to the lack of natural snow. Author: Matthew Rosencrans, NOAA/NWS/NCEP/Climate Prediction Center
A comprehensive narrative describing drought conditions for the nation can be found at the end of this document.
Drought Impacts Definitions The possible impacts associated with D4 (H, A) drought include widespread crop/pasture losses and shortages of water in reservoirs, streams, and wells creating water emergencies. The possible impacts associated with D3 (H, A) drought include major crop/pasture losses and widespread water shortages or restrictions. Possible impacts from D2 (H, A) drought are focused on water shortages common and water restrictions imposed and crop or pasture losses likely. The possible impacts associated with D1 (H, A) drought are focused on water shortages developing in streams, reservoirs, or wells, and some damage to crops and pastures (Figs. 4 through 4b).
Soil MoistureSoil moisture (Figs. 5a and 5b), is simulated by the VIC macroscale hydrologic model. The detailed, physically-based VIC model is driven by observed daily precipitation and temperature maxima and minima from approximately 2130 stations, selected for reporting reliably in real-time and for having records of longer than 45 years (and various other criteria). Another good resource can be found at: http://www.emc.ncep.noaa.gov/mmb/nldas/drought/.
Soil Climate Analysis Network (SCAN)
Figure 6 provides supplemental data on soil conditions (moisture and temperatures at various depths from 2 inches to 80 inches. For more information about SCAN see (brochure).
U.S. Historical Streamflow
This map, (Fig. 7) shows the 7-day average streamflow conditions in hydrologic units of the United States and Puerto Rico for the day of year. The colors represent 7-day average streamflow percentiles based on historical streamflow for the day of the year. Thus, the map shows conditions adjusted for this time of the year. Only stations having at least 30 years of record are used. Sub-regions shaded gray indicate that insufficient data were available to compute a reliable 7-day average streamflow value. During winter months, this situation frequently arises due to ice effects. The data used to produce this map are provisional and have not been reviewed or edited. They may be subject to significant change.
State ActivitiesState government drought activities can be tracked at the following URL: http://drought.unl.edu/mitigate/mitigate.htm. NRCS SS/WSF State Office personnel are
12/22/2011 Page 2 of 21

Weekly Snowpack and Drought Monitor Update Report
participating in state drought committee meetings and providing the committees and media with appropriate SS/WSF information - http://www.wcc.nrcs.usda.gov/cgibin/bor.pl. Additional information describing the products available from the Drought Monitor can be found at the following URL: http://drought.unl.edu/dm/ and http://www.drought.gov.
For More InformationThe National Water and Climate Center Homepage provide the latest available snowpack and water supply information. Please visit us at http://www.w c c.nrcs.usda.gov . This document is available from the following location on the NWCC homepage -http://www.wcc.nrcs.usda.gov/water/drought/wdr.pl. Reports from 2007 are available on-line while ones from 2001-2006 can be acquired upon request.
This report uses data and products provided by the Interagency Drought Monitor Consortium members and the National Interagency Fire Center.
/s/ Douglas LawrenceDeputy Chief, Soil Survey and Resource Assessment
12/22/2011 Page 3 of 21

Weekly Snowpack and Drought Monitor Update Report
Fig. 1: Snow Water-Equivalent: The Northern Tier States continue to decline while Arizona and New Mexico continues to gain.
12/22/2011 Page 4 of 21

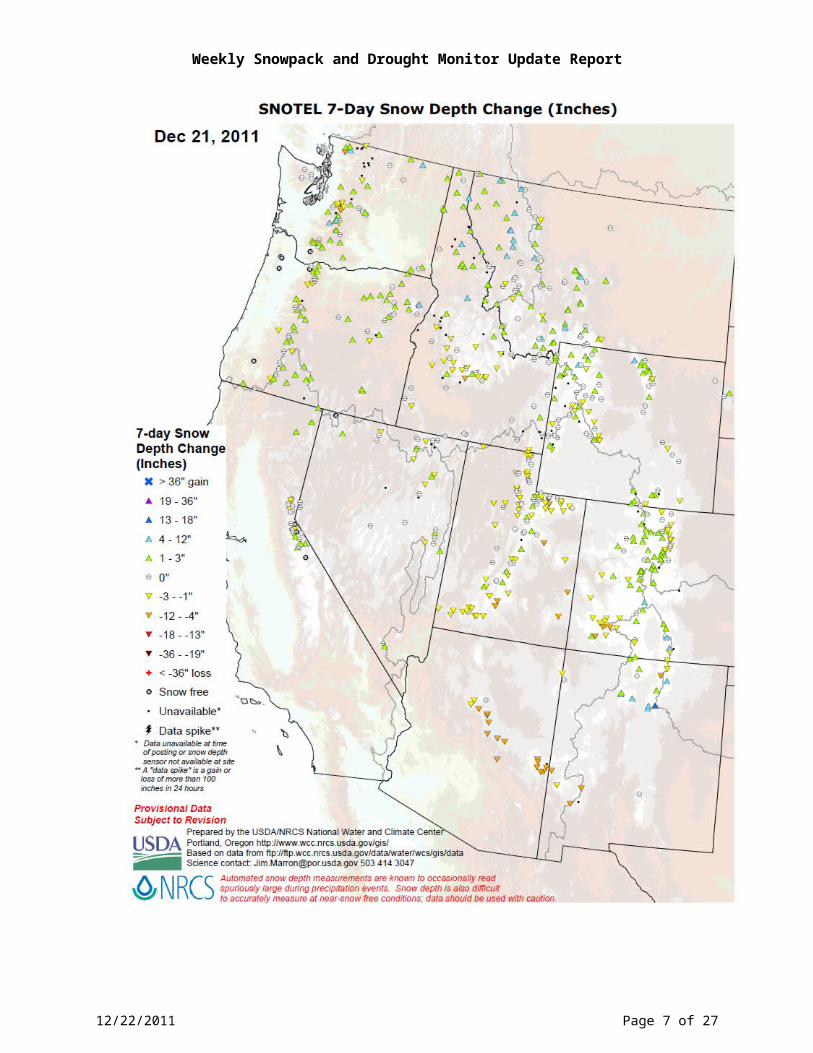
Weekly Snowpack and Drought Monitor Update Report
Fig. 1a: 7-Day Snow Depth Change ending this morning shows generally light accumulation over much of the West except over Arizona and the peripheral of the Great Basin.
12/22/2011 Page 5 of 21

Weekly Snowpack and Drought Monitor Update Report
Fig. 2: SNOTEL and ACIS 7-day temperature anomaly shows a mixed pattern of temperature departures. Generally, temperatures fell within ±5°F of the typical value for this time of year.
12/22/2011 Page 6 of 21
Weekly Snowpack and Drought Monitor Update Report
Fig. 2a: ACIS 7-day average temperature anomalies show the greatest positive temperature departures over northern Montana (>+10°F) and the greatest negative departures over southwest Wyoming, south-central Colorado, southwest Utah, and southwest Arizona (<-6°F). This pattern is opposition of a typical La Niña.
12/22/2011 Page 7 of 21

Weekly Snowpack and Drought Monitor Update Report
12/22/2011 Page 8 of 21
Fig. 3 and 3a: ACIS 7-day average precipitation amounts for the period ending yesterday shows the greatest amounts over the Pacific NW Coast and Cascade Ranges (Fig. 3). However, in terms of percent of normal, the Southwest got hammered with storms driven by the sub-tropical jet stream (Fig 3a).

Weekly Snowpack and Drought Monitor Update Report
12/22/2011 Page 9 of 21
Fig. 3. and 3a. ACIS 7-day average precipitation amounts for the period ending 10 February shows the bulk of the heaviest precipitation fell over parts of the Sierra. Areas with significant deficits occurred over the remainder of the high country across the West. In terms of percent of normal,
Fig 3b: Thus far since, the start of the 2012 Water-Year that began on 1 October 2011, the seasonal moisture has favored the Southwest while the Great Basin and Cascades have seen significant deficits.

Weekly Snowpack and Drought Monitor Update Report
12/22/2011 Page 10 of 21
Fig. 4. Current Drought Monitor weekly summary. Ref: National Drought Mitigation Center (NDMC) - http://www.drought.unl.edu/dm/monitor.html
Fig. 4a. Drought Monitor for the Western States with statistics over various time periods. Note no change since last week’s map. Ref: http://www.drought.unl.edu/dm/DM_west.htm

Weekly Snowpack and Drought Monitor Update Report
12/22/2011 Page 11 of 21
Fig. 4: Current Drought Monitor weekly summary. The exceptional D4 levels of drought are found over New Mexico, Texas, Oklahoma, extreme SW Kansas, and southwestern Louisiana. For more drought news see: Drought Impact Reporter.
Agriculture
Disasters doom Texas oyster crop Dec 14, Gulf Coast of Texas. The closure of the coastal oyster beds has hurt the oyster industry, putting fishermen and oyster processors and shippers out of work and cutting into area businesses’ bottom lines.
Shortages mean mistletoe gets the kiss-off this year Dec 14, Texas. Drought in Texas has reduced the growth of mistletoe, which is a parasitic plant that grows on trees.
Texas drought takes cow numbers down by 600K Dec 16, Texas. The decline in cattle numbers occurred since the start of 2011. Beef prices are expected to rise about 5.5 percent in 2012, according to the U.S. Department of Agriculture, after an increase of 9 percent this year.

Weekly Snowpack and Drought Monitor Update Report
Fig. 4a: Drought Monitor for the Western States with statistics over various time periods. Regionally there was a slight improvement in D3 and D4 drought conditions this week.
12/22/2011 Page 12 of 21

Weekly Snowpack and Drought Monitor Update Report
Fig. 4b(1): Currently, ~41% of Texas is experiencing “Exceptional” D4 drought. 76% of the state is in D3 and D4 drought! Overall, this represents a 2% improvement in D4 this week.
Fig. 4b(2): Currently, over 3% of Oklahoma is experiencing “Exceptional” D4 drought. Over 27% of the state is in D3 and D4 drought! This week saw a 1% increase in D4 but a 4% improvement in D3.
12/22/2011 Page 13 of 21

Weekly Snowpack and Drought Monitor Update Report
Fig. 4b(3): Currently, ~18% of New Mexico is experiencing “Exceptional” D4 drought. Nearly 38% of the state is in D3 and D4 drought. Overall, this represents little change this week.
Fig. 4b(4): Currently, ~7.5% of Louisiana is experiencing “Exceptional” D4 drought. Over 32% of the state is in D3 and D4 drought. Overall, this represents no change the week.
12/22/2011 Page 14 of 21

Weekly Snowpack and Drought Monitor Update Report
Fig. 4b(5): Currently, ~1.5% of Kansas is experiencing “Exceptional” D4 drought and 13% of the state is in D3 and D4 drought. Overall, this represents little change this week.
12/22/2011 Page 15 of 21

Weekly Snowpack and Drought Monitor Update Report
Figs. 5a and 5b: Soil Moisture ranking in percentile as of 20 December (top) shows a wet Ohio Valley to New England pattern. Dryness is noted over Minnesota, Oregon, northern Texas, and northern Florida. During the week, moisture increased in a narrow band across Iowa to Arizona (bottom). Drying occurred expanded across much of the eastern third of the Country.
12/22/2011 Page 16 of 21

Weekly Snowpack and Drought Monitor Update Report
Soil Climate Analysis Network (SCAN)
Fig. 6a: This NRCS resource shows a site over northern Missouri with rapid responses in soil moisture to recent precipitation events.
Fig. 6b: This SCAN station is located in northern Texas shows low moisture values.
12/22/2011 Page 17 of 21

Weekly Snowpack and Drought Monitor Update Report
Fig. 7: Map of below normal 7-day average streamflow compared to historical streamflow for the day of year. Extreme conditions exist over the Florida Panhandle and southeastern Alabama. Worsening conditions are developing over the Coastal region of Oregon and Washington.
12/22/2011 Page 18 of 21

Weekly Snowpack and Drought Monitor Update Report
National Drought Summary -- December 20, 2011
The discussion in the Looking Ahead section is simply a description of what the official national guidance from the National Weather Service (NWS) National Centers for Environmental Prediction is depicting for current areas of dryness and drought. The NWS forecast products utilized include the HPC 5-day QPF and 5-day Mean Temperature progs, the 6-10 Day Outlooks of Temperature and Precipitation Probability, and the 8-14 Day Outlooks of Temperature and Precipitation Probability, valid as of late Wednesday afternoon of the USDM release week. The NWS forecast web page used for this section is: http://www.cpc.ncep.noaa.gov/products/forecasts/.
Weekly Weather Summary: During the past week, the active storm track across the 48 contiguous states was oriented from the southwest to the northeast, passing over the Middle Mississippi River and Ohio River Valleys. The first storm system moved from the Central High Plains to the Great Lakes in two days, spreading precipitation along most of the Ohio and Tennessee River Valleys. The cold front associated with that system cleared the east coast during the weekend. The next storm system developed over the southwest and moved eastward, spreading rain and snow to the southern Rockies and Great Plains. The heaviest precipitation fell over the central Great Plains, Midwest, and Lower Great Lakes. Dry conditions were generally observed over the southeast, Intermountain West and Northern Great Plains.
Northeast and Mid-Atlantic: Dry conditions continued for most of the northeast and Mid-Atlantic. Abnormal dryness (D0) was added to portions of northern New York, Vermont, and New Hampshire where the 30-, 60-, and 90- day rainfall totals were less than 50 percent of normal. Further south, across the southeastern portions of North Carolina, the coverage of moderate drought (D1) was expanded as rains continued to skirt the area, favoring the western portions of the state. SPI values out through 24 months continue to support the depiction as do soil moisture models from NASA.
Southeast: A lack of recent rains prompted expansion of abnormal dryness across portions of central and southern Florida. Since November 1, Fort Lauderdale International Airport (FLL) has measured 1.75 inches of rain, 35 percent of normal. Similarly, Palm Beach International (PBI) and Miami International (MIA) have reported precipitation totals that are below normal since November 1 (26 percent and 62 percent, respectively). Total Soil Moisture Percentile from NASA showed that most of South Florida was running near normal levels, except Glades and Hendry Counties, where the model showed the soil moisture value ranging between 10 and 30 percent of normal with some isolated areas in Glades County at less than 10 percent of normal.
A reassessment of the drought conditions across Georgia and the continued dry conditions prompted an expansion of D3 (extreme drought) and D2 (severe drought) across southeastern Georgia. Rainfall deficits for the past year range from 16 to 20 inches along coastal Georgia, SPI blends indicate that exceptional drought (D4) status is warranted, and some soil moisture models (Leaky Bucket Model from Climate Prediction Center and NLDAS) indicate D2 status, so the area is indicated as D3.
Great Plains: Improvements are made across northern and central Texas as rain and snow (0.5 – 2.4 inches, liquid equivalent of snow included) fell there as a result of the storm earlier in the week and storm just near the data cutoff at 12Z on Tuesday, December 20. Widespread
12/22/2011 Page 19 of 21

Weekly Snowpack and Drought Monitor Update Report
rains (0.5 – 2.7 inches) contributed to improving conditions are also indicated across Missouri, Kansas and Arkansas. Recent rains prompted the removal of D1 and D0 from western Missouri and portions of eastern Kansas.
According to the Oklahoma Climatological Survey, across the eastern 2 tiers of counties in Oklahoma, reservoirs are now full, so runoff is occurring with rains. Further west, rains have helped but the length and intensity of the current drought is hard to overcome in a short period. Central and most of western Oklahoma saw no change in lake levels. Canton Lake remained virtually unchanged at 29 percent of capacity; while Thunderbird Lake was steady at 75 percent of capacity and Altus-Lugert is at 18 percent of capacity.
A lack of precipitation for at least the past 60 days contributed to the expansion of moderate drought conditions across North Dakota and Minnesota. According to the preliminary data, Fargo, ND has experienced the second driest September - December period.
Southwest: Multiple storm systems have brought drought relieving precipitation to much of Arizona, especially southern Arizona. Rainfall totals ranged from 0.5 – 2.8 inches during the past week. Thirty day precipitation totals are in excess of 150 percent of normal across much of the region with isolated areas receiving more than 200 percent of normal over the past 60 days. Beyond 90 days in the past, dry conditions are evident in the data, so a 1-category improvement is depicted.
The same weather systems that brought the much needed rains to Arizona and Texas, also brought some rain and snows to New Mexico. Drought relief indicated in last week’s Drought Monitor was continued this week as more rains and snows (0.5 to 2.8 inches) fell mostly across southern New Mexico.
West: Abnormal dryness was expanded across portions of California, Nevada, and Oregon. Precipitation deficits continue to mount as a dry pattern has been in place across the Intermountain West for the past 90 days. The depiction was based on a combination of SPI blends, Objective Drought Indicator Blends, soil moisture models and percent of normal precipitation (where precipitation during the past 30-, 60-, and 90-day periods was less than 50 percent of normal). The area around Redding, CA has received little rain, with one observer reporting .11 inch during the month of December. Additionally, ski resorts are being impacted due to the lack of natural snow.
Hawaii: Across Kauai, rainfall (0.5 – 3.6 inches) fell during the week and ranchers working pastures on the southeast portions have had pastures improving, even though the rainfall total at Lihue AP for December is less than 50 percent of normal. On Oahu, water levels at the Waimanalo Reservoir have come up a bit over the last week in response rains measuring up to 3.6 inches, but there's still a mandatory 20 percent water use restriction in place. Across the Big Island, pastures on the north tip (near Upolu Point) received enough rainfall recently to carry them through the wet season. The area from Kawaihae to Waimea has also received rainfall so the existing D3(S) was pared back away from the coastal section. Conditions across the interior and southeast slope of the Big Island remained dry. Macadamia nut growers have had to irrigate heavily and ranchers have had to supplement feed.
Looking Ahead: During the ensuing 5 days (December 22-26), a cold front is expected to linger across the southeast. A cold front is expected to move across the northern portions of contiguous 48 states later this week and settle along the southeast coast. The western portions
12/22/2011 Page 20 of 21

Weekly Snowpack and Drought Monitor Update Report
of the cold front are expected to move southward along the Rockies and bring rain and snow to the mountains. Two low-pressure systems are expected to move along the over the southeast, bringing significant rains from the Central Gulf Coast to the Ohio Valley to the Mid-Atlantic before high pressure builds in from the west.
The Climate Prediction Center (CPC) 6-10 day precipitation forecasts indicate enhanced probabilities for above-average precipitation across the southeast, Pacific Northwest, and the Alaskan Panhandle. The anticipated pattern would likely support drier than average conditions from the southwest to the Tennessee Valley during the period from December 27-31.
Author: Matthew Rosencrans, NOAA/NWS/NCEP/Climate Prediction Center
Dryness Categories
D0 ... Abnormally Dry ... used for areas showing dryness but not yet in drought, or for areas recovering from drought.
Drought Intensity CategoriesD1 ... Moderate Drought D2 ... Severe Drought D3 ... Extreme Drought D4 ... Exceptional Drought
Drought or Dryness TypesS ... Short-Term, typically <6 months (e.g. agricultural, grasslands)L ... Long-Term, typically >6 months (e.g. hydrology, ecology)
Updated December 21, 2011
12/22/2011 Page 21 of 21


![Weekly Report Drought Monitor / Snowpack Update€¦ · Weekly Report - Snowpack / Drought Monitor Update Date: 29 December 2011 [End of Year Edition] SNOTEL SNOWPACK AND PRECIPITATION](https://static.fdocuments.in/doc/165x107/5f14161a6565b54157769b36/weekly-report-drought-monitor-snowpack-update-weekly-report-snowpack-drought.jpg)


