WEEKLY NEWS LATTER -EQUITY FOR 30 JULY
8
Weekly New EQUITY AN wsletter-Equity 3 0 Ju NALYSIS - WEEK u ly 2012 KL Y
-
Upload
geet-sharma -
Category
Documents
-
view
215 -
download
0
description
Indian markets had another bad week amid a plethora of quarterly earnings, with FMCG being the only sector that managed to close positive, even as concerns prevailed over the precarious state of the euro-zone and its negative fallout on the global economy. Sensex was down 1.9% and Nifty lost 2% over the week. Technically Nifty is drifting near its 200DMA & is in correction mode, it may range 4950-5250 this week with price action most of the time turning into indecision having support at lower levels.
Transcript of WEEKLY NEWS LATTER -EQUITY FOR 30 JULY

Weekly Newsletter
EQUITY ANALYSIS
ly Newsletter-Equity
30 Ju
EQUITY ANALYSIS - WEEKL
July2012
WEEKLY
Weekly Newsletter
Contents
Market Wrap
Market Performance
NSE Gainers
NSE Losers
Volume Toppers
World Indices
Indian Equity Market
Technical Analysis
Nifty Spot
Bank Nifty Future

MARKET WRAP
Nifty and Sensex both ended with significant losses this week down 2%.
U.S. Unemployment claims came at 353K; New home sales m/m came at 350K.
U.S. & Euro markets were almost flat while Asian markets were negative.
Indian markets had another bad week amid a plethora of quarterly earnings, with
FMCG being the only sector that managed to close positive, even as concerns prevailed
over the precarious state of the euro-zone and its negative fallout on the global
economy. Sensex was down 1.9% and Nifty lost 2% over the week. Technically Nifty is
drifting near its 200DMA & is in correction mode, it may range 4950-5250 this week with
price action most of the time turning into indecision having support at lower levels.
India is mainly facing lack of revival in southwest monsoon coupled with the
Government’s constant dithering over pending reforms also dampened the sentiment.
The persistent weakness in the rupee and FII outflows added to the jitters. This week
RBI policy review will be announced, central bank most probably won’t tinker with policy
rates with inflation (both WPI and CPI) proving to be sticky. Weak monsoon, large twin
deficits & depressed domestic fuel prices are other factors that will play on RBI’s minds.
European Central Bank (ECB) will take necessary measures to protect the euro
common currency, President Mario Draghi said on Thursday. His comments sparked a
global rally in risky assets amid expectations that the ECB will intervene in markets to
rein in spiraling borrowing costs. Markets rallied across Europe and US after Draghi
said central bank would do to take necessary steps to protect eurozone from collapse,
raising hopes to ease strains for highly indebted member states like Spain and Italy.

MARKET PERFORMANCE
NSE GAINERS
COMPANY NAME CURRENT PREV. CLOSE(RS) CANG.(RS) CHAG.(%)
OMDC 41599.50 31251.50 10348.00 33.11
Ashapura Mine 20.10 15.85 4.25 26.81
The United Nilgiri 181.00 155.00 26.00 16.77
Geometric 83.75 72.10 11.65 16.16
MTNL 29.25 25.20 4.05 16.07
NSE LOSERS
COMPANY NAME CURRENT PREV. CLOSE(RS) CANG.(RS) CHAG.(%)
Glodyne Tech 219.40 364.00 -144.60 -39.73
Gokul Refoils 49.65 81.40 -31.75 -39.00
Sumeet Inds 12.60 20.00 -7.40 -37.00
Amar Remedies 88.45 140.10 -51.65 -36.87
Parsvnath Dev 37.00 58.00 -21.00 -36.21
VOLUME TOPPERS
COMPANY NAME CURRENT PREV. CLOSE(RS) CHAG.(%) Volume in
(‘000s)
Lanco Infratech 12.20 12.10 0.83 31280.05
Pipavav Defence 55.75 62.25 -10.44 30308.03
HDIL 75.70 73.10 3.56 23307.45
Reliance Comm 54.05 56.10 -3.65 15507.50
Parsvnath Dev 37.00 46.20 -19.91 14819.66

SECTORIAL INDICES
Indices Country Date Index Net Change Change (%)
Hang Seng Hong Kong 27-Jul-2012 19274.96 182.33 0.95
Jakarta Composite
Indonesia 27-Jul-2012 4084.21 64.54 1.61
Nikkei 225 Japan 27-Jul-2012 8566.64 -157.48 -1.81
KLSE Composite
Malaysia 27-Jul-2012 1624.94 -1.44 -0.09
Seoul Composite
South Korea 27-Jul-2012 1829.16 16.27 0.90
Strait Times Singapore 27-Jul-2012 2998.49 2.93 0.10
FTSE 100 United
Kingdom 27-Jul-2012 5627.21 -38.92 -0.69
Nasdaq United States
27-Jul-2012 2958.09 49.62 1.71
DJIA United States
27-Jul-2012 13075.66 298.57 2.34
S&P 500 United States
27-Jul-2012 1362.66 5.88 0.43
INDIAN EQUITY MARKET
INDICES VALUE CHANGE % CHANGE
NIFTY 5099.85 -105.25 -2.02
BANK NIFTY 10206.50 -303.45 -2.89
SENSEX 16839.19 -319.25 -1.86
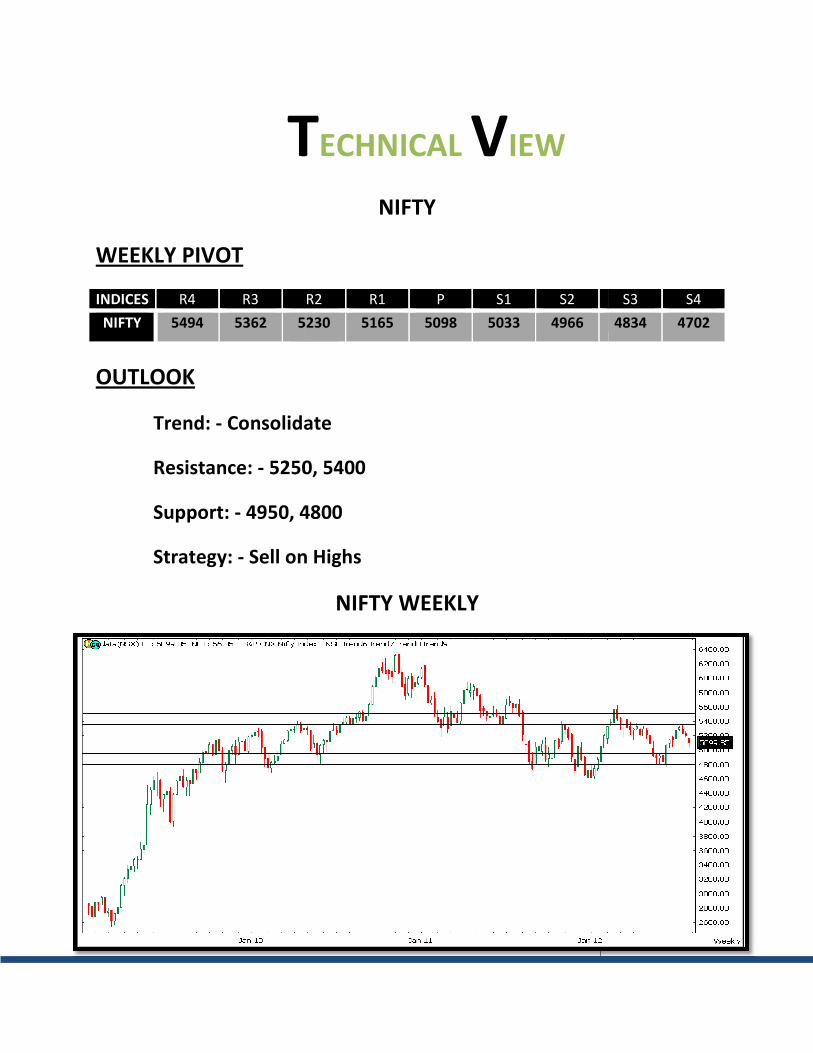
T
WEEKLY PIVOT
INDICES R4 R3
NIFTY 5494 5362 5230
OUTLOOK
Trend: - Consolidate
Resistance: - 5250
Support: - 4950, 4
Strategy: - Sell on Highs
TECHNICAL VIEW
NIFTY
R2 R1 P S1 S2
5230 5165 5098 5033 4966
Consolidate
0, 5400
4800
Sell on Highs
NIFTY WEEKLY
S3 S4
4834 4702
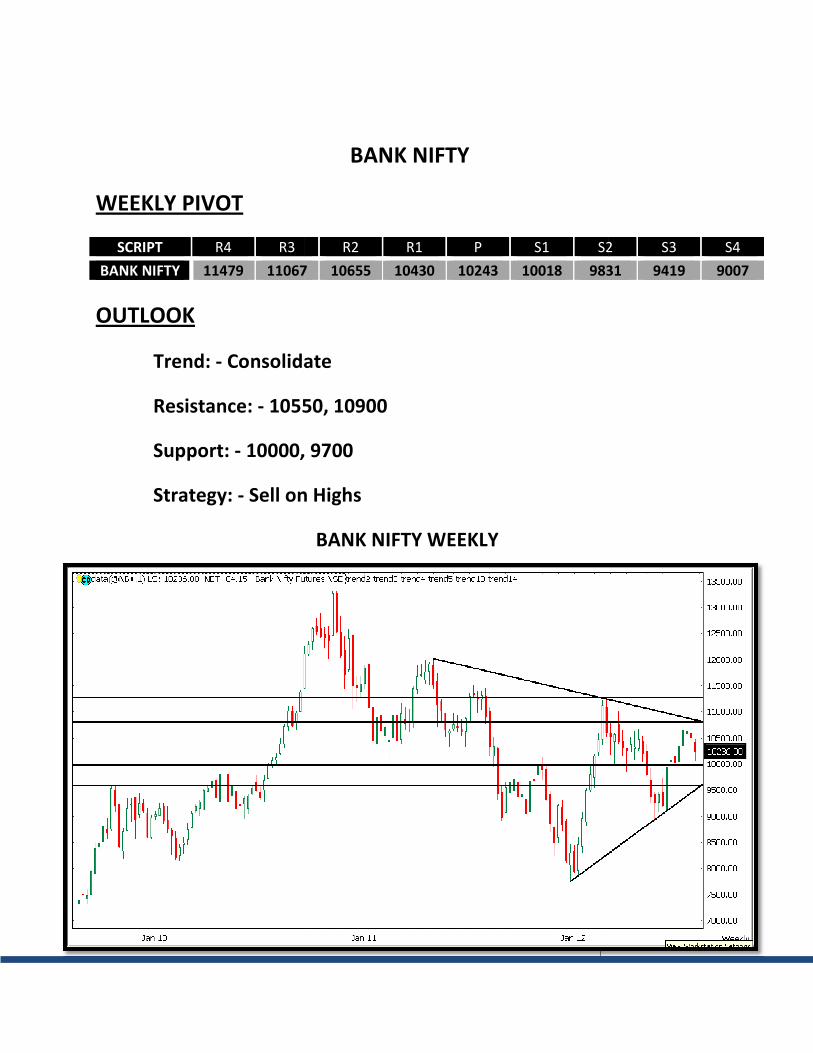
WEEKLY PIVOT
SCRIPT R4 R3
BANK NIFTY 11479 11067
OUTLOOK
Trend: - Consolidate
Resistance: - 1055
Support: - 10000,
Strategy: - Sell on Highs
BANK NIFTY
R2 R1 P S1 S2
11067 10655 10430 10243 10018 9831
Consolidate
550, 10900
, 9700
Sell on Highs
BANK NIFTY WEEKLY
S2 S3 S4
9831 9419 9007

Disclaimer
The information and views in this report, our website & all the service we provide are believed to be reliable, but we do not
accept any responsibility (or liability) for errors of fact or opinion. Users have the right to choose the product/s that suits
them the most.
Sincere efforts have been made to present the right investment perspective. The information contained herein is based on
analysis and up on sources that we consider reliable.
This material is for personal information and based upon it & takes no responsibility
The information given herein should be treated as only factor, while making investment decision. The report does not
provide individually tailor-made investment advice. TheEquicom recommends that investors independently evaluate
particular investments and strategies, and encourages investors to seek the advice of a financial adviser. TheEquicom shall
not be responsible for any transaction conducted based on the information given in this report, which is in violation of rules
and regulations of NSE and BSE.
The share price projections shown are not necessarily indicative of future price performance. The information herein,
together with all estimates and forecasts, can change without notice. Analyst or any person related to TheEquicom might be
holding positions in the stocks recommended. It is understood that anyone who is browsing through the site has done so at
his free will and does not read any views expressed as a recommendation for which either the site or its owners or
anyone can be held responsible for . Any surfing and reading of the information is the acceptance of this disclaimer.
All Rights Reserved.
Investment in Commodity and equity market has its own risks.
We, however, do not vouch for the accuracy or the completeness thereof. we are not responsible for any loss incurred
whatsoever for any financial profits or loss which may arise from the recommendations above. TheEquicom does not
purport to be an invitation or an offer to buy or sell any financial instrument. Our Clients (Paid Or Unpaid), Any third party or
anyone else have no rights to forward or share our calls or SMS or Report or Any Information Provided by us to/with anyone
which is received directly or indirectly by them. If found so then Serious Legal Actions can be taken.