Weekly Market Review€¦ · Weekly Market Review July 10, 2016 ... Steel rebar prices rallied by...
10
Weekly Market Review July 10, 2016 – July 16, 2016 July 17, 2016
Transcript of Weekly Market Review€¦ · Weekly Market Review July 10, 2016 ... Steel rebar prices rallied by...

Weekly Market Review July 10, 2016 – July 16, 2016
July 17, 2016

Page I 2
CONTENTS
International Equity Markets
GCC Equities
Currencies
Commodities
Interest Rates
Equity Markets - Top Most & Bottom Most
Commodity Markets - Top Most & Bottom Most

Page I 3
Americas
The IMF kept unchanged US’ growth forecasts at 2.2% in 2016 & 2.5% in 2017 citing negligible impact of Brexit
Retail sales grew 0.6% in Jun after edging up 0.2% in May; better than forecasts
Consumer prices inched up 0.2% in Jun (same as in May), driven partly by increase in energy prices
Europe
Eurozone’s GDP is expected to grow by 1.6% in 2016, driven by consumption, according to Insee, Istat and Ifo
Eurozone’s consumer prices edged up 0.1% YoY in Jun after sliding 0.1% in May
Industrial production declined 1.2% MoM in May (vs. +1.4% in Apr). However, it grew 0.5% on YoY basis
Bank of France left unchanged France’s 2Q16 GDP growth forecast at 0.2%
Germany’s consumer prices increased 0.3% YoY in Jun (vs. +0.1% in May); matches preliminary estimates
Theresa May formally appointed as 13th PM as well as 2nd female PM of the UK, replacing David Cameron
Rest of the World
China’s 2Q16 GDP expanded 6.7% YOY, same as in 1Q16 and marginally above consensus forecasts of 6.6%
Exports, in USD terms, slipped 4.8% YoY in Jun whereas imports fell 8.4%
Cabinet office slashed Japan’s FY17 growth forecast to 0.9% (vs. +1.7% predicted in January)
S&P 500 – 1 year performance Euro Stoxx 600 – 1 year performance
Source: Bloomberg, Mashreq Private Banking; *Current
INTERNATIONAL EQUITY MARKETS
Last Close 5 Day % YTD % P/E (2015) *Div. Yield
S&P 500 2,161.74 1.49 5.76 18.38 2.12
DJI 18,516.55 2.04 6.26 17.25 2.50
Nasdaq Comp 5,029.59 1.47 0.44 21.83 1.29
Euro Stoxx 600 337.92 3.23 -7.62 15.96 3.69
FTSE 100 6,669.24 1.19 6.84 17.20 4.16
Dax 10,066.90 4.54 -6.29 12.80 3.08
CAC 40 4,372.51 4.34 -5.71 14.78 3.84
Nikkei 225 16,497.85 9.21 -13.32 16.64 1.93
Hang Seng 21,659.25 5.33 -1.16 11.98 3.78
Brazil - Bovespa
55,578.24 4.59 28.21 14.42 3.09
Russia - Micex 1,940.85 2.45 10.19 7.24 4.47
BSE Sensex 27,836.50 2.62 6.58 17.35 1.48
Shanghai Comp 3,054.30 2.22 -13.70 14.00 1.92
Source: Bloomberg, Mashreq Private Banking
Page I 4
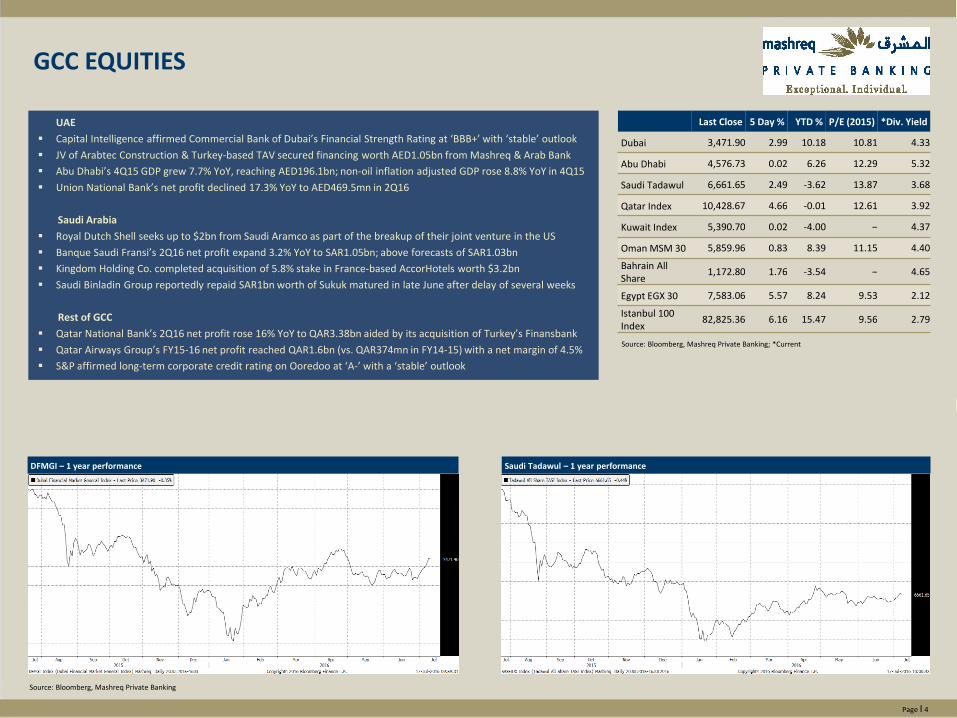
UAE
Capital Intelligence affirmed Commercial Bank of Dubai’s Financial Strength Rating at ‘BBB+’ with ‘stable’ outlook
JV of Arabtec Construction & Turkey-based TAV secured financing worth AED1.05bn from Mashreq & Arab Bank
Abu Dhabi’s 4Q15 GDP grew 7.7% YoY, reaching AED196.1bn; non-oil inflation adjusted GDP rose 8.8% YoY in 4Q15
Union National Bank’s net profit declined 17.3% YoY to AED469.5mn in 2Q16
Saudi Arabia
Royal Dutch Shell seeks up to $2bn from Saudi Aramco as part of the breakup of their joint venture in the US
Banque Saudi Fransi’s 2Q16 net profit expand 3.2% YoY to SAR1.05bn; above forecasts of SAR1.03bn
Kingdom Holding Co. completed acquisition of 5.8% stake in France-based AccorHotels worth $3.2bn
Saudi Binladin Group reportedly repaid SAR1bn worth of Sukuk matured in late June after delay of several weeks
Rest of GCC
Qatar National Bank’s 2Q16 net profit rose 16% YoY to QAR3.38bn aided by its acquisition of Turkey’s Finansbank
Qatar Airways Group’s FY15-16 net profit reached QAR1.6bn (vs. QAR374mn in FY14-15) with a net margin of 4.5%
S&P affirmed long-term corporate credit rating on Ooredoo at ‘A-’ with a ‘stable’ outlook
Last Close 5 Day % YTD % P/E (2015) *Div. Yield
Dubai 3,471.90 2.99 10.18 10.81 4.33
Abu Dhabi 4,576.73 0.02 6.26 12.29 5.32
Saudi Tadawul 6,661.65 2.49 -3.62 13.87 3.68
Qatar Index 10,428.67 4.66 -0.01 12.61 3.92
Kuwait Index 5,390.70 0.02 -4.00 – 4.37
Oman MSM 30 5,859.96 0.83 8.39 11.15 4.40
Bahrain All Share
1,172.80 1.76 -3.54 – 4.65
Egypt EGX 30 7,583.06 5.57 8.24 9.53 2.12
Istanbul 100 Index
82,825.36 6.16 15.47 9.56 2.79
Source: Bloomberg, Mashreq Private Banking; *Current
DFMGI – 1 year performance Saudi Tadawul – 1 year performance
GCC EQUITIES
Source: Bloomberg, Mashreq Private Banking

Page I 5
The US dollar index increased against other major currencies by 0.29% this week, after strong US and China economic data drove the Japanese Yen lower as investors continued to focus on upcoming central bank meetings amid growing expectations for additional stimulus measures
British pound appreciated against the US dollar by 1.84%, as the Bank of England refrained from adding potentially currency-debasing stimulus and the appointment of Theresa May as Prime Minister eased concerns over leadership
Japanese yen depreciated against the greenback by 4.32%, following a string of strong US economic data and expectations of powerful monetary and fiscal stimulus from Japan
Canadian dollar rose against the US dollar by 0.54% after the Bank of Canada held its benchmark interest rate unchanged and downplayed the impact of the UK vote to leave the European Union and weaker US demand, stating export-driven growth is coming
Brazilian real appreciated against the US dollar by 0.6% in spite of the central bank’s efforts to limit gains, amid investor optimism that the interim government will win lawmakers’ support for measures to cut the budget deficit and stimulate growth
Russian ruble strengthened against the US dollar by 0.28%, with the economy recording current-account surplus in 1H2016 of $15.9bn amid prospects for stimulus in major economies even as oil prices stabilize
Last Close 5 Day % 1 Mth. % YTD % 1 Year %
USD Index 96.5800 0.29 2.08 -2.08 -1.11
EUR/USD 1.1035 -0.14 -2.00 1.59 1.47
GBP/USD 1.3192 1.84 -7.12 -10.48 -15.48
USD/JPY 104.8800 4.32 -1.07 -12.76 -15.52
USD/CHF 0.9827 -0.06 2.22 -1.94 2.60
USD/CAD 1.2974 -0.54 0.48 -6.25 0.13
USD/BRL 3.2802 -0.60 -5.58 -17.18 3.92
USD/RUB 63.6852 -0.28 -2.82 -12.18 11.79
USD/INR 67.0712 -0.44 -0.12 1.39 5.60
USD/CNY 6.6935 0.04 1.70 3.08 7.79
USD/AUD 1.3198 -0.11 -2.24 -3.83 -2.27
EUR/USD – 1 year performance GBP/USD – 1 year performance
Source: Bloomberg, Mashreq Private Banking
CURRENCIES
Source: Bloomberg, Mashreq Private Banking
Page I 6
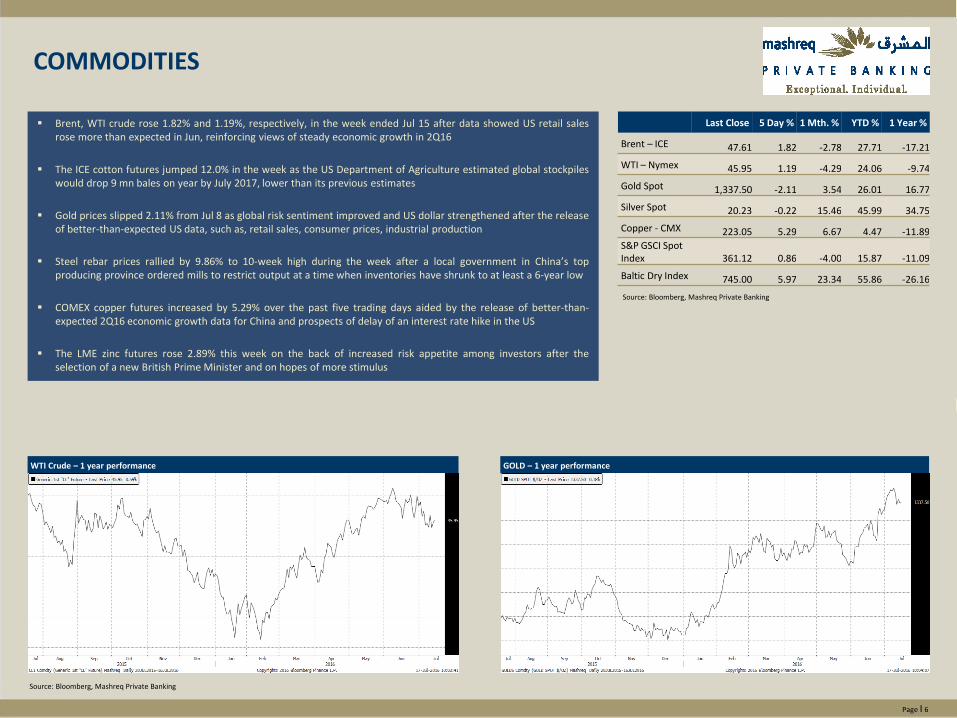
Brent, WTI crude rose 1.82% and 1.19%, respectively, in the week ended Jul 15 after data showed US retail sales rose more than expected in Jun, reinforcing views of steady economic growth in 2Q16
The ICE cotton futures jumped 12.0% in the week as the US Department of Agriculture estimated global stockpiles would drop 9 mn bales on year by July 2017, lower than its previous estimates
Gold prices slipped 2.11% from Jul 8 as global risk sentiment improved and US dollar strengthened after the release of better-than-expected US data, such as, retail sales, consumer prices, industrial production
Steel rebar prices rallied by 9.86% to 10-week high during the week after a local government in China’s top producing province ordered mills to restrict output at a time when inventories have shrunk to at least a 6-year low
COMEX copper futures increased by 5.29% over the past five trading days aided by the release of better-than-expected 2Q16 economic growth data for China and prospects of delay of an interest rate hike in the US
The LME zinc futures rose 2.89% this week on the back of increased risk appetite among investors after the selection of a new British Prime Minister and on hopes of more stimulus
Last Close 5 Day % 1 Mth. % YTD % 1 Year %
Brent – ICE 47.61 1.82 -2.78 27.71 -17.21
WTI – Nymex 45.95 1.19 -4.29 24.06 -9.74
Gold Spot 1,337.50 -2.11 3.54 26.01 16.77
Silver Spot 20.23 -0.22 15.46 45.99 34.75
Copper - CMX 223.05 5.29 6.67 4.47 -11.89
S&P GSCI Spot Index 361.12 0.86 -4.00 15.87 -11.09
Baltic Dry Index 745.00 5.97 23.34 55.86 -26.16
WTI Crude – 1 year performance GOLD – 1 year performance
Source: Bloomberg, Mashreq Private Banking
COMMODITIES
Source: Bloomberg, Mashreq Private Banking

Page I 7
10-year US yield jumped 19.3 basis points (bps) to 1.55% due to a broad wave of sell-off, suggesting sentiment in the financial markets is shifting away from gloom and doom that was heightened right after the UK’s vote in late June to quit the European Union
The Bank of England kept interest rates unchanged at 0.5% on Jul 14, as it refrained from injecting more money into the British economy, defying market expectations of an interest rate cut
Malaysia’s central bank cut its interest rate, for the first time in seven years, to 3.0% from 3.25% on Jul 13 to bolster a slowing economy amid fears of greater volatility in global growth following Britain's decision to leave the European Union
The Bank of Canada maintained its target for the overnight rate at 0.5%, as the overall balance of risks, including inflation, remains within the zone for the current monetary stance, according to the governing council
South Korea’s central bank held its benchmark interest rate at a record low of 1.25% on Jul 14, while cutting its projection for growth and inflation amid uncertainty to the economic outlook and hit to consumption anticipated from the implementation of an anti-corruption law
Chile’s central bank, on Jul 14, left its benchmark interest rate at 3.5% for the seventh consecutive month, as a weak economy gradually pulls inflation back toward the target range of 2-4% from an actual 4.2%, at present
Last Close 5 Day % 1 Mth. % YTD % 1 Year %
USD-10yr 1.55 14.21 -1.34 -31.66 -34.01
USD-2yr 0.67 10.31 -0.33 -36.30 1.86
Fed Funds Rate 0.40 0.00 8.11 100.00 185.71
USD-3m Libor 0.69 3.11 4.80 12.27 139.67
USD-6m Libor 0.99 6.02 5.40 17.45 118.08
German-10yr 0.01 -103.17 -160.00 -99.05 -99.28
UK-10yr 0.83 13.47 -25.54 -57.45 -59.83
Japan-10yr -0.23 -19.16 19.59 -189.23 -152.49
AED-3m EIBOR 1.12 -1.14 -1.91 5.81 47.69
AED-6m EIBOR 1.36 0.72 0.14 11.09 49.06
US 10 year Generic Yield – 1 year performance UK 10 year Generic Yield – 1 year performance
Source: Bloomberg, Mashreq Private Banking
INTEREST RATES
Source: Bloomberg, Mashreq Private Banking

Page I 8
Ref Country Weekly Change Weekly Change
(USD Adj.)
1 Kenya -1.92% -2.04%
2 Malta -1.55% -1.49%
3 Ghana -0.82% -1.60%
4 Botswana -0.75% 0.22%
5 Mauritius -0.44% -0.41%
6 Latvia -0.26% -0.20%
7 Bulgaria -0.20% -0.13%
8 Nigeria -0.17% -0.17%
9 Slovenia -0.13% -0.07%
10 Zambia -0.08% -0.71%
Ref Country Weekly Change Weekly Change
(USD Adj.)
1 Japan 9.21% 4.15%
2 Austria 6.99% 7.06%
3 Argentina 6.49% 4.89%
4 Czech Republic 6.45% 6.53%
5 Namibia 6.34% 7.61%
6 Turkey 6.16% 6.11%
7 Egypt 5.57% 5.58%
8 Hong Kong 5.33% 5.38%
9 Qatar 4.66% 4.71%
10 Kazakhstan 4.64% 4.42%
WEEKLY
Ref Country YTD Change YTD Change (USD Adj.)
1 Peru 46.34% 52.37%
2 Argentina 33.99% 16.04%
3 Brazil 28.21% 55.24%
4 Russia 27.30% 27.30%
5 Kazakhstan 19.80% 20.30%
6 Pakistan 19.42% 19.56%
7 Namibia 17.95% 27.30%
8 Colombia 16.11% 26.31%
9 Thailand 15.84% 19.34%
10 Philippine 15.51% 15.67%
YTD
Ref Country YTD Change YTD Change (USD Adj.)
1 Italy -21.80% -20.39%
2 Zambia -17.23% -9.97%
3 Venezuela -16.84% -47.61%
4 Ireland -14.73% -13.20%
5 Portugal -14.14% -12.59%
6 China -13.70% -16.32%
7 Japan -13.32% -1.16%
8 Greece -11.72% -10.13%
9 Ghana -10.72% -14.02%
10 Spain -10.62% -9.00%
EQUITY MARKETS - TOP MOST & BOTTOM MOST
Source: Bloomberg, Mashreq Private Banking
Page I 9
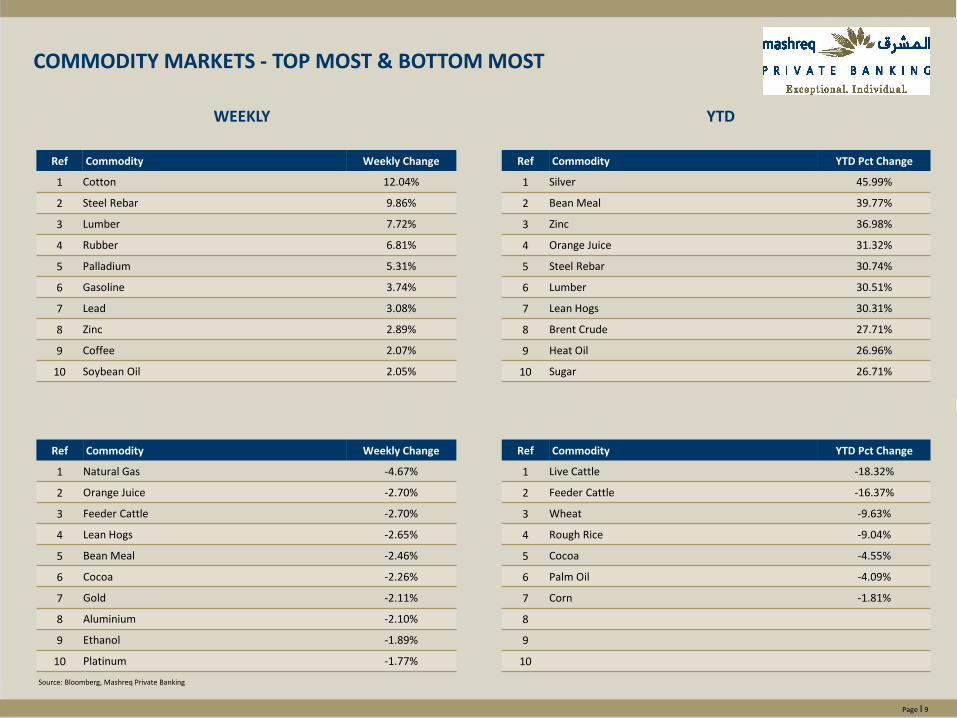
Ref Commodity Weekly Change
1 Natural Gas -4.67%
2 Orange Juice -2.70%
3 Feeder Cattle -2.70%
4 Lean Hogs -2.65%
5 Bean Meal -2.46%
6 Cocoa -2.26%
7 Gold -2.11%
8 Aluminium -2.10%
9 Ethanol -1.89%
10 Platinum -1.77%
Ref Commodity Weekly Change
1 Cotton 12.04%
2 Steel Rebar 9.86%
3 Lumber 7.72%
4 Rubber 6.81%
5 Palladium 5.31%
6 Gasoline 3.74%
7 Lead 3.08%
8 Zinc 2.89%
9 Coffee 2.07%
10 Soybean Oil 2.05%
WEEKLY
Ref Commodity YTD Pct Change
1 Silver 45.99%
2 Bean Meal 39.77%
3 Zinc 36.98%
4 Orange Juice 31.32%
5 Steel Rebar 30.74%
6 Lumber 30.51%
7 Lean Hogs 30.31%
8 Brent Crude 27.71%
9 Heat Oil 26.96%
10 Sugar 26.71%
YTD
Ref Commodity YTD Pct Change
1 Live Cattle -18.32%
2 Feeder Cattle -16.37%
3 Wheat -9.63%
4 Rough Rice -9.04%
5 Cocoa -4.55%
6 Palm Oil -4.09%
7 Corn -1.81%
8
9
10
COMMODITY MARKETS - TOP MOST & BOTTOM MOST
Source: Bloomberg, Mashreq Private Banking
Page I 10
IMPORTANT NOTICE
This report was prepared by the Private Banking Unit of Mashreqbank psc (“Mashreq”) in the United Arab Emirates (“U.A.E.”). Mashreq is regulated by the Central Bank of the U.A.E. This report is provided for informational purposes and private circulation only and should not be construed as an offer to sell or a solicitation to buy any security or any other financial instrument or adopt any hedging, trading or investment strategy. Prior to investing in any product, we recommend that you consult with a professional financial advisor, taking into consideration investment objectives, financial circumstances and tax implication. While based on information believed to be reliable, we do not guarantee and make no express or implied representation as to the accuracy of this report or complete description of the securities markets or developments referred to in this report. The information, opinions, forecasts (if any), assumptions or estimates contained in this report are as of the date indicated and are subject to change at any time without prior notice. The stated price of any securities mentioned in this report is as of the date indicated and is not a representation that any transaction can be effected at this price. The risks related to investment products described in this report are not all encompassing and investors should refer to the relevant investment offer document for detailed information and applicable terms and conditions. Investment products, including treasury products, are not guaranteed by Mashreq or any of its affiliates or subsidiaries unless stated otherwise and are subject to investment risk, including loss of principal. Investment products are not government insured. Past performance is not an indicator of future performance. US persons (US Citizens; US Green Card Holders; Resident Aliens subject to US income taxes for IRS purposes) are not eligible for any of the investment products introduced by Mashreq unless stated otherwise. This report is for distribution only under such circumstances as may be permitted by applicable law. Neither Mashreq nor its officers, directors or shareholders or other persons shall be liable for any direct, indirect, incidental or other damages including loss of profits arising in any way from the information contained in this report. This report is intended solely for the use by the intended recipients and the contents shall not be reproduced, redistributed or copied in whole or in part for any purpose without Mashreq’s prior express consent.