Weekly Market Report · growing MP, while interest for ... 140k BSEA-MED 65 5,891 70 6,749 -12.7%...
10
Market insight By Linos Kogevinas Commercial Execuve - Cotzias Intermodal Shipping US Shale producon connues to grow rapidly, hing new records and with projecons being revised upwardly at every turn. According to the Interna- onal Energy Agency, the US will overtake Russia as the world’s #1 crude oil producer by next year, having surpassed 10m bpd in late 2017 and slated to surpass 11m bpd by the end of 2018. Over the past two years US shale oil companies have managed to become more efficient, opmizing producon processes and ulizing new technolo- gies and pracces at lower costs. This is aributed in part to technological breakthroughs on the drilling side; Break-even points for US producon have been driven substanally downward. It remains to be seen if this increase will be sustainable but at this point most pundits do not see producon peaking before 2020. The booming producon has of course unnerved other producers and oil markets globally and comes at a me when other producers have voluntarily capped their own producon in order to prop up prices. During 2017, we witnessed the spike in prices due to OPEC producon cuts with prices steadi- ly correcng upwards since November 2016. Oil is currently trading in the low $60s, aſter peaking at a 3-year high of ~$66pb. OPEC and its allied producers are seeing their market shares eroded by the increasing US producon. At the same me, US oil imports are also drop- ping, further shrinking profits from OPEC established markets. With this in mind, it will be very interesng to see how the commodity price will fare under these new condions. US shale producon will be extremely important to watch over the next 5 years. It is almost certain that producon will connue to grow in the next years. However, a number of factors will determine if this growth will be sustainable long term and how the market will balance itself under a future - potenally different- status quo. On the tanker side a growing US producon is good news as exports from the country could be offering more and more support to rates in the future as apart from Europe and Lan America, the long haul trips to the Far East and parcularly to China is gaining increasing momentum. Thomson Reuters data reveals that US shipments specifically to China that were non-existent prior to 2016 have now reached a new record of around 2.01 million metric tonnes or 474,450 barrels/day during last month. Sinopec, the biggest oil refiner in China, expects to import 10 million metric tonnes of crude oil from the US during 2018. As the producon cap from OPEC and Russia connues, the fairly new and quickly increasing flow of the commodity from the US to S. Korea, Japan and China is definitely something to watch out for. Addionally as a growing US producon will almost certainly keep under- mining OPECs efforts to boost oil prices, this means that the price of the commodity will keep moving – at least for the short to medium term- within a specific range that is sll considered aracve for consuming countries maybe not compared to early 2016 levels but certainly when compared to mid-2014 levels of around $ 100/barrel. Chartering (Wet: Soſt - / Dry: Firm + ) The dry bulk market managed an impressive turnaround last week, with gains noted across the board and senment firming quickly. The BDI today (27/02/2018) closed at 1,188 points, down by 3 points compared to Monday’s levels (26/02/2018) and increased by 71 points when com- pared to previous Tuesday’s closing (20/02/2018). The crude carriers market seems unable to catch a break, with further losses noted last week and a parcularly quiet VL middle East market signaling further losses ahead. The BDTI today (27/02/2018) closed at 658, increased by 17 points and the BCTI at 621, an increase of 8 points compared to pre- vious Tuesday’s (20/02/2018) levels. Sale & Purchase (Wet: Stable + / Dry: Soſt -) During the quietest week of the year so far in terms of dry bulk acvity, containers sales stole the spotlight with help from the connuously growing MPC, while interest for tanker candidates also picked up. On the tanker side we had the sale of the “FRONT CIRCASSIA” (306,009dwt- blt ‘99, Japan), which was sold to Indian owner, Foresight, for a price in the region $18.5m. On the dry bulker side sector we had the sale of the “DA CHENG” (57,300dwt-blt ‘10, China), which was sold to Chinese own- er, Shanghai Changhang, for a price in the region of $13.3m. Newbuilding (Wet: Stable + / Dry: Stable +) Not much has changed on the newbuilding front where orders keep coming in plenty on a weekly basis. Following the VL orders of the week prior the tanker sector has seen further acvity with a quarter of metha- nol carriers being ordered in Hyundai against me charter to Waterfront Shipping , while the Capesize opon declared by the JV between Cargill and Mitsui is most probably stealing the spotlight. It’s been quite a while since we last saw a Capesize order indeed, while on the other hand we have seen plenty of VLOC orders instead, which is not parcularly posi- ve for the bigger bulkers altogether that have been baling with over- supply throughout the greater part of the past years and have only dur- ing the past months started enjoying a healthier market. In terms of recently reported deals, Japanese owner, NYK Line, placed an order for one firm MR tanker (50,000 dwt) at Hyundai Mipo, in S. Korea for a price in the region of $44.0m and delivery set in 2019 - 2020. Demolion (Wet: Stable + / Dry: Stable +) There is definitely a lot to take in from simply looking at the list of the most recent demolion sales below. As far as the demolion market is concerned, it is evident that prices are steady with no signs of weaken- ing for now, while as rumors for the re-opening of the market in Paki- stan for tankers keep on coming, this is expected to keep offering fur- ther support to price levels in the short term. What is probably more interesng though in regards to the acvity below has less to do with the demolion market and more with the tanker sector. The fact that in just a few days about 1.2 million dwt has been sold for demo is definite- ly reflecve of the disappoinng returns in the sector, but it is also an indicaon of what we should be expecng in regards to this year’s tank- er scrapping acvity that appears set to remain firm at least for as long as weak earnings keep coinciding with aracve demolion prices. Av- erage prices this week for tankers were at around $230-460/ldt and dry bulk units received about $220-450/ldt. Weekly Market Report Issue: Week 8|Tuesday 27 th February 2018
-
Upload
doannguyet -
Category
Documents
-
view
215 -
download
0
Transcript of Weekly Market Report · growing MP, while interest for ... 140k BSEA-MED 65 5,891 70 6,749 -12.7%...
Market insight
By Linos Kogevinas
Commercial Executive - Cotzias Intermodal Shipping
US Shale production continues to grow rapidly, hitting new records and with projections being revised upwardly at every turn. According to the Interna-tional Energy Agency, the US will overtake Russia as the world’s #1 crude oil producer by next year, having surpassed 10m bpd in late 2017 and slated to surpass 11m bpd by the end of 2018.
Over the past two years US shale oil companies have managed to become more efficient, optimizing production processes and utilizing new technolo-gies and practices at lower costs. This is attributed in part to technological breakthroughs on the drilling side; Break-even points for US production have been driven substantially downward. It remains to be seen if this increase will be sustainable but at this point most pundits do not see production peaking before 2020.
The booming production has of course unnerved other producers and oil markets globally and comes at a time when other producers have voluntarily capped their own production in order to prop up prices. During 2017, we witnessed the spike in prices due to OPEC production cuts with prices steadi-ly correcting upwards since November 2016. Oil is currently trading in the low $60s, after peaking at a 3-year high of ~$66pb.
OPEC and its allied producers are seeing their market shares eroded by the increasing US production. At the same time, US oil imports are also drop-ping, further shrinking profits from OPEC established markets. With this in mind, it will be very interesting to see how the commodity price will fare under these new conditions.
US shale production will be extremely important to watch over the next 5 years. It is almost certain that production will continue to grow in the next years. However, a number of factors will determine if this growth will be sustainable long term and how the market will balance itself under a future -potentially different- status quo.
On the tanker side a growing US production is good news as exports from the country could be offering more and more support to rates in the future as apart from Europe and Latin America, the long haul trips to the Far East and particularly to China is gaining increasing momentum. Thomson Reuters data reveals that US shipments specifically to China that were non-existent prior to 2016 have now reached a new record of around 2.01 million metric tonnes or 474,450 barrels/day during last month. Sinopec, the biggest oil refiner in China, expects to import 10 million metric tonnes of crude oil from the US during 2018. As the production cap from OPEC and Russia continues, the fairly new and quickly increasing flow of the commodity from the US to S. Korea, Japan and China is definitely something to watch out for.
Additionally as a growing US production will almost certainly keep under-mining OPECs efforts to boost oil prices, this means that the price of the commodity will keep moving – at least for the short to medium term- within a specific range that is still considered attractive for consuming countries maybe not compared to early 2016 levels but certainly when compared to mid-2014 levels of around $ 100/barrel.
Chartering (Wet: Soft - / Dry: Firm + )
The dry bulk market managed an impressive turnaround last week, with gains noted across the board and sentiment firming quickly. The BDI today (27/02/2018) closed at 1,188 points, down by 3 points compared to Monday’s levels (26/02/2018) and increased by 71 points when com-pared to previous Tuesday’s closing (20/02/2018). The crude carriers market seems unable to catch a break, with further losses noted last week and a particularly quiet VL middle East market signaling further losses ahead. The BDTI today (27/02/2018) closed at 658, increased by 17 points and the BCTI at 621, an increase of 8 points compared to pre-vious Tuesday’s (20/02/2018) levels.
Sale & Purchase (Wet: Stable + / Dry: Soft -)
During the quietest week of the year so far in terms of dry bulk activity, containers sales stole the spotlight with help from the continuously growing MPC, while interest for tanker candidates also picked up. On the tanker side we had the sale of the “FRONT CIRCASSIA” (306,009dwt-blt ‘99, Japan), which was sold to Indian owner, Foresight, for a price in the region $18.5m. On the dry bulker side sector we had the sale of the “DA CHENG” (57,300dwt-blt ‘10, China), which was sold to Chinese own-er, Shanghai Changhang, for a price in the region of $13.3m.
Newbuilding (Wet: Stable + / Dry: Stable +)
Not much has changed on the newbuilding front where orders keep coming in plenty on a weekly basis. Following the VL orders of the week prior the tanker sector has seen further activity with a quarter of metha-nol carriers being ordered in Hyundai against time charter to Waterfront Shipping , while the Capesize option declared by the JV between Cargill and Mitsui is most probably stealing the spotlight. It’s been quite a while since we last saw a Capesize order indeed, while on the other hand we have seen plenty of VLOC orders instead, which is not particularly posi-tive for the bigger bulkers altogether that have been battling with over-supply throughout the greater part of the past years and have only dur-ing the past months started enjoying a healthier market. In terms of recently reported deals, Japanese owner, NYK Line, placed an order for one firm MR tanker (50,000 dwt) at Hyundai Mipo, in S. Korea for a price in the region of $44.0m and delivery set in 2019 - 2020.
Demolition (Wet: Stable + / Dry: Stable +)
There is definitely a lot to take in from simply looking at the list of the most recent demolition sales below. As far as the demolition market is concerned, it is evident that prices are steady with no signs of weaken-ing for now, while as rumors for the re-opening of the market in Paki-stan for tankers keep on coming, this is expected to keep offering fur-ther support to price levels in the short term. What is probably more interesting though in regards to the activity below has less to do with the demolition market and more with the tanker sector. The fact that in just a few days about 1.2 million dwt has been sold for demo is definite-ly reflective of the disappointing returns in the sector, but it is also an indication of what we should be expecting in regards to this year’s tank-er scrapping activity that appears set to remain firm at least for as long as weak earnings keep coinciding with attractive demolition prices. Av-erage prices this week for tankers were at around $230-460/ldt and dry bulk units received about $220-450/ldt.
Weekly Market Report
Issue: Week 8|Tuesday 27th February 2018

© Intermodal Research 27/02/2018 2
2017 2016
WS
points$/day
WS
points$/day $/day $/day
265k MEG-JAPAN 36 9,506 37 10,025 -5.2% 20,658 41,068
280k MEG-USG 18 1,834 19 2,199 -16.6% 13,429 44,269
260k WAF-CHINA 41 10,618 42 11,843 -10.3% 19,815 41,175
130k MED-MED 53 5,460 65 9,904 -44.9% 17,617 29,930
130k WAF-USAC 48 4,774 53 6,236 -23.4% 12,917 23,591
140k BSEA-MED 65 5,891 70 6,749 -12.7% 17,617 29,930
80k MEG-EAST 85 7,832 88 8,570 -8.6% 11,560 20,111
80k MED-MED 105 13,787 90 8,789 56.9% 15,136 20,684
80k UKC-UKC 90 2,763 90 3,048 -9.4% 11,912 26,526
70k CARIBS-USG 108 11,139 110 12,302 -9.5% 14,479 20,501
75k MEG-JAPAN 102 11,879 85 7,012 69.4% 10,082 16,480
55k MEG-JAPAN 115 10,363 110 9,176 12.9% 8,262 12,891
37K UKC-USAC 160 11,815 153 11,012 7.3% 8,975 10,622
30K MED-MED 148 8,393 155 9,630 -12.8% 6,703 9,056
55K UKC-USG 100 7,356 105 9,264 -20.6% 10,421 15,726
55K MED-USG 100 7,190 105 8,674 -17.1% 9,613 14,879
50k CARIBS-USAC 115 8,124 100 5,574 45.7% 10,544 15,549
Vessel Routes
Week 8 Week 7$/day
±%
Dir
tyA
fram
axC
lean
VLC
CSu
ezm
ax
Feb-18
avg
Jan-18
avg±% 2017 2016 2015
300KT DH 63.0 63.6 -1.0% 61.8 68.9 81.2
150KT DH 42.0 42.6 -1.5% 41.1 50.0 59.7
110KT DH 31.5 32.0 -1.6% 30.1 37.0 45.5
75KT DH 28.0 28.0 0.0% 27.4 33.1 36.1
52KT DH 25.0 25.0 0.0% 23.1 25.3 27.6
Aframax
LR1
VLCC
Suezmax
Indicative Market Values ($ Million) - Tankers
Vessel 5yrs old
MR
Chartering
The crude carriers market remains in search of silver linings that remained non-existent throughout the winter season that is now almost over. Last week ended with yet another drop in rates for most key routes, while the positive reversal in the price of oil and consequently in bunker prices has added the pressure on TCE levels. The most recent EIA report that stressed a rather unexpected drawdown in US crude oil inventories has helped the price of the commodity to cover some of the ground recently lost, while if this trend resumes in the following months, the market should eventually receive a long awaited boost from an upswing in trading volumes.
Unable to put forth any resistance, VL owners in the Middle East accepted further discounts amidst thin demand and bad psychology, while an entire-ly muted West Africa market contributed further to worsening sentiment.
Despite healthier activity in the West Africa Suezmax market, tonnage com-peting for business in the region pushed rates further down, while Black Sea/Med levels moved down on softer enquiry. Healthy demand for a sec-ond week in a row finally managed to offer support to Aframax rates in the region, while the Caribs market kept cashing in on extended weather delays that offset most of the pressure that increasing tonnage supply started to generate.
Sale & Purchase
In the Aframax sector we had the sale of the “MAERSK PRIVI-LEGE” (105,483dwt-blt ‘03, Japan), which was sold to Singaporean owner, Winson Oil, for a price in the region $12.7m.
In the MR sector we had the sale of the “KIRIBORA” (50,044dwt-blt ‘13, S. Korea), which was sold to Danish owner, Navigare Capital Partners, for a price in the region $27.0m.
Tanker Market
- 6 mos - 'RBD GINO FERRETTI' 2011 107,500 dwt
- - $11,000/day+ p.s - Navig8
Indicative Period Charters
- 12 to 12 mos - 'RS AURORA' 2018 158,000 dwt
- - $16,000/day - $20,000/day - Norden
20
70
120
170
220
270
320
370
420
WS
po
ints
DIRTY - WS RATESTD3 TD6 TD9
Week 8 Week 7 ±% Diff 2017 2016
300k 1yr TC 24,250 25,000 -3.0% -750 27,524 38,108
300k 3yr TC 30,000 30,000 0.0% 0 28,830 34,379
150k 1yr TC 16,500 17,000 -2.9% -500 18,788 27,363
150k 3yr TC 20,000 20,000 0.0% 0 19,330 25,653
110k 1yr TC 14,500 14,500 0.0% 0 16,034 22,396
110k 3yr TC 17,500 17,500 0.0% 0 17,339 20,948
75k 1yr TC 12,500 12,500 0.0% 0 12,986 19,127
75k 3yr TC 14,500 14,500 0.0% 0 14,253 18,592
52k 1yr TC 14,500 14,500 0.0% 0 13,375 15,410
52k 3yr TC 14,750 14,750 0.0% 0 14,287 15,681
36k 1yr TC 13,000 13,250 -1.9% -250 12,053 14,380
36k 3yr TC 13,500 13,500 0.0% 0 13,200 14,622
Panamax
MR
Handy
TC Rates
$/day
VLCC
Suezmax
Aframax
60
90
120
150
180
210
240
270
WS
po
ints
CLEAN - WS RATESTC1 TC2 TC5 TC6
© Intermodal Research 27/02/2018 3
0500
1,0001,5002,0002,5003,0003,5004,0004,5005,000
Ind
ex
Baltic Indices
BCI BPI BSI BHSI BDI
0
5000
10000
15000
20000
25000
30000
35000$
/da
y
Average T/C Rates
Average of the 4 T / C AVR 4TC BPI AVR 5TC BSI AVR 6TC BHSI
Chartering
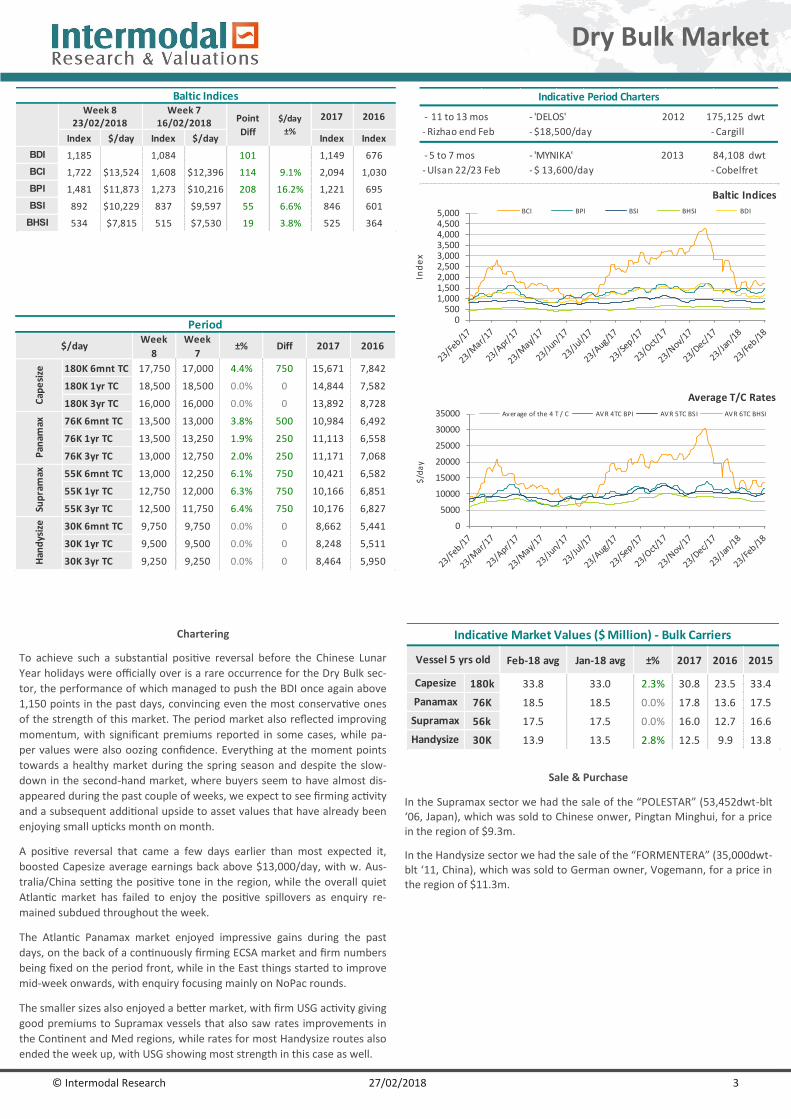
To achieve such a substantial positive reversal before the Chinese Lunar
Year holidays were officially over is a rare occurrence for the Dry Bulk sec-
tor, the performance of which managed to push the BDI once again above
1,150 points in the past days, convincing even the most conservative ones
of the strength of this market. The period market also reflected improving
momentum, with significant premiums reported in some cases, while pa-
per values were also oozing confidence. Everything at the moment points
towards a healthy market during the spring season and despite the slow-
down in the second-hand market, where buyers seem to have almost dis-
appeared during the past couple of weeks, we expect to see firming activity
and a subsequent additional upside to asset values that have already been
enjoying small upticks month on month.
A positive reversal that came a few days earlier than most expected it,
boosted Capesize average earnings back above $13,000/day, with w. Aus-
tralia/China setting the positive tone in the region, while the overall quiet
Atlantic market has failed to enjoy the positive spillovers as enquiry re-
mained subdued throughout the week.
The Atlantic Panamax market enjoyed impressive gains during the past
days, on the back of a continuously firming ECSA market and firm numbers
being fixed on the period front, while in the East things started to improve
mid-week onwards, with enquiry focusing mainly on NoPac rounds.
The smaller sizes also enjoyed a better market, with firm USG activity giving
good premiums to Supramax vessels that also saw rates improvements in
the Continent and Med regions, while rates for most Handysize routes also
ended the week up, with USG showing most strength in this case as well.
Sale & Purchase
In the Supramax sector we had the sale of the “POLESTAR” (53,452dwt-blt ‘06, Japan), which was sold to Chinese onwer, Pingtan Minghui, for a price in the region of $9.3m.
In the Handysize sector we had the sale of the “FORMENTERA” (35,000dwt-blt ‘11, China), which was sold to German owner, Vogemann, for a price in the region of $11.3m.
Feb-18 avg Jan-18 avg ±% 2017 2016 2015
180k 33.8 33.0 2.3% 30.8 23.5 33.4
76K 18.5 18.5 0.0% 17.8 13.6 17.5
56k 17.5 17.5 0.0% 16.0 12.7 16.6
30K 13.9 13.5 2.8% 12.5 9.9 13.8Handysize
Capesize
Panamax
Supramax
Indicative Market Values ($ Million) - Bulk Carriers
Vessel 5 yrs old
Indicative Period Charters
- 11 to 13 mos - 'DELOS' 2012 175,125 dwt
- Rizhao end Feb - $18,500/day - Cargill
- 5 to 7 mos - 'MYNIKA' 2013 84,108 dwt
- Ulsan 22/23 Feb - $ 13,600/day - Cobelfret
Dry Bulk Market
Index $/day Index $/day Index Index
BDI 1,185 1,084 101 1,149 676
BCI 1,722 $13,524 1,608 $12,396 114 9.1% 2,094 1,030
BPI 1,481 $11,873 1,273 $10,216 208 16.2% 1,221 695
BSI 892 $10,229 837 $9,597 55 6.6% 846 601
BHSI 534 $7,815 515 $7,530 19 3.8% 525 364
16/02/2018
Baltic IndicesWeek 8
23/02/2018Week 7
Point
Diff
2017 2016$/day
±%
180K 6mnt TC 17,750 17,000 4.4% 750 15,671 7,842
180K 1yr TC 18,500 18,500 0.0% 0 14,844 7,582
180K 3yr TC 16,000 16,000 0.0% 0 13,892 8,728
76K 6mnt TC 13,500 13,000 3.8% 500 10,984 6,492
76K 1yr TC 13,500 13,250 1.9% 250 11,113 6,558
76K 3yr TC 13,000 12,750 2.0% 250 11,171 7,068
55K 6mnt TC 13,000 12,250 6.1% 750 10,421 6,582
55K 1yr TC 12,750 12,000 6.3% 750 10,166 6,851
55K 3yr TC 12,500 11,750 6.4% 750 10,176 6,827
30K 6mnt TC 9,750 9,750 0.0% 0 8,662 5,441
30K 1yr TC 9,500 9,500 0.0% 0 8,248 5,511
30K 3yr TC 9,250 9,250 0.0% 0 8,464 5,950Han
dys
ize
Period
2016
Pan
amax
Sup
ram
ax
Week
8
Week
7
Cap
esi
ze
2017$/day ±% Diff

© Intermodal Research 27/02/2018 4
Secondhand Sales
Size Name Dwt Built Yard M/E SS due Hull Price Buyers Comments
AFRARIDGEBURY
SALLY B105,672 2003
SUMITOMO HI,
JapanSulzer Mar-18 DH $ 9.30m Greek
AFRAMAERSK
PRIVILEGE105,483 2003
SUMITOMO HM,
JapanSulzer DH $ 12.70m
Singaporean
(Winson Oi l )
MR KIRIBORA 50,044 2013 SPP, S. Korea MAN-B&W DH $ 27.00m
Danish
(Navigare
Capita l Partners )
5-yr BBB
MRBRITISH
SERENITY47,210 2005
HYUNDAI MIPO, S.
KoreaB&W Jul-20 DH $ 11.80m
MRBRITISH
TRANQUILLITY47,210 2005
HYUNDAI MIPO, S.
KoreaB&W Sep-20 DH $ 11.80m
MRBRITISH
COURTESY47,210 2005
HYUNDAI MIPO, S.
KoreaB&W Sep-20 DH $ 11.80m
MR HUASCAR 35,722 1992SHIN KURUSHIMA,
JapanMitsubishi Jun-20 DH $ 2.80m
Panama
regis tered
(Peninsula)
auction sa le, plus
$200,00 for bunkers
PROD/
CHEM
CHEMBULK KINGS
POINT19,928 2008 KITANIHON, Japan Mitsubishi DH high $ 13.0m undisclosed StSt, 12 tanks
South Korean
(Sinokor)incl . BB T/C back
Tankers
Size Name Dwt Built Yard M/E SS due Gear Price Buyers Comments
SMAX POLESTAR 53,452 2006 IMABARI, Japan MAN-B&W Feb-214 X 30,5t
CRANES$ 9.3m
Chinese
(Pingtan Minghui)
HANDY FORMENTERA 35,000 2011QIDONG DAODA,
ChinaMAN-B&W Dec-21
4 X 30t
CRANES$ 11.3m
German
(Vogemann)
Bulk Carriers
Name Dwt Built Yard M/E SS due Gear Price Buyers Comments
NEW LUCKY III 7,716 2000SHIN KURUSHIMA
IMABARI, JapanB&W Nov-20
4 X 25t
DERRICKS$ 1.8m Taiwanese
YEON AM 6,175 1997
SANYO
MUKAISHIMA,
Japan
Hanshin
2 X 30,7t
CRNS,1 X
30t DRCKS
$ 1.5m European
MPP/General Cargo
Type Name Dwt Built Yard M/E SS due Cbm Price Buyers Comments
LPG FLAMENGO 6,519 2011MURAKAMI HIDE,
JapanMAN-B&W 7,540 $ 14.2m
Greek
(Naftomar)
Gas/LPG/LNG

© Intermodal Research 27/02/2018 5
Secondhand Sales
Size Name Teu Built Yard M/E SS due Gear Price Buyers Comments
SUB
PMAXAS CARELIA 2,824 2006
HYUNDAI MIPO,
S. KoreaMAN-B&W
SUB
PMAXAS CYPRIA 2,824 2006
HYUNDAI MIPO,
S. KoreaMAN-B&W
SUB
PMAXAS PALATIA 2,602 2006 STX, S. Korea MAN-B&W
4 X 45t
CRANES
SUB
PMAXAS PATRIA 2,602 2006 STX, S. Korea MAN-B&W
4 X 45t
CRANES
FEEDER SEVILLIA 1,794 2008TAIZHOU KOUAN,
ChinaMAN-B&W
2 X 40t
CRANES
FEEDER SICILIA 1,794 2008TAIZHOU KOUAN,
ChinaMAN-B&W
2 X 40t
CRANES
FEEDER AS ROMINA 1,496 2009ZHEJIANG OUHUA,
ChinaMAN-B&W Jan-19
FEEDER AS ROSALIA 1,496 2009ZHEJIANG OUHUA,
ChinaMAN-B&W Aug-19
FEEDER AS RICCARDA 1,496 2011ZHEJIANG OUHUA,
ChinaMAN-B&W Feb-22
FEEDER AS RAGNA 1,496 2009ZHEJIANG OUHUA,
ChinaMAN-B&W Aug-19
FEEDER AS FELICIA 1,296 2006ZHEJIANG OUHUA,
ChinaMAN-B&W
2 X 45t
CRANES
FEEDER AS FABIANA 1,296 2007ZHEJIANG OUHUA,
ChinaMAN-B&W
2 X 45t
CRANES
FEEDER AS FEDERICA 1,284 2007ZHEJIANG OUHUA,
ChinaMAN-B&W
2 X 45t
CRANES
FEEDER AS FLORIANA 1,284 2008ZHEJIANG OUHUA,
ChinaMAN-B&W
FEEDERFPMC
CONTAINER 81,118 2007
JIANGSU EASTERN,
ChinaMAN-B&W Sep-22
2 X 40t
CRANES
FEEDERFPMC
CONTAINER 71,118 2007
JIANGSU EASTERN,
ChinaMAN-B&W Jul-22
2 X 45t
CRANES
FEEDERFPMC
CONTAINER 6880 2006
HAIDONG
SHIPYARD, ChinaMAN-B&W Dec-21
$ 139.5m
Oslo listed
(MPC Container
Ships)
xs $16.0mChinese
(Goto Shipping)
Containers

© Intermodal Research 27/02/2018 6
Secondhand Sales
Size Name Teu Built Yard M/E SS due Gear Price Buyers Comments
SUB
PMAXKOTA PURI 2,483 2008
NAIKAI ZOSEN,
JapanMAN-B&W Aug-22 xs $12.0m undisclosed
FEEDER MERKUR TIDE 1,608 1998AKER MTW,
GermanySulzer Mar-18
3 X 40t
CRANESundisclosed undisclosed for conversion
FEEDER IRIS BOLTEN 974 2008HEGEMANN
BERNE, GermanyMaK undisclosed German
Containers Continued.

© Intermodal Research 27/02/2018 7
Not much has changed on the newbuilding front where orders keep coming in plenty on a weekly basis. Following the VL orders of the week prior the tanker sector has seen further activity with a quarter of methanol carriers being ordered in Hyundai against time charter to Waterfront Shipping , while the Capesize option declared by the JV between Cargill and Mitsui is most probably stealing the spotlight. It’s been quite a while since we last saw a Capesize order indeed, while on the other hand we have seen plenty of VLOC orders instead, which is not particularly positive for the bigger bulkers alto-gether that have been battling with oversupply throughout the greater part of the past years and have only during the past months started enjoying a healthier market.
In terms of recently reported deals, Japanese owner, NYK Line, placed an order for one firm MR tanker (50,000 dwt) at Hyundai Mipo, in S. Korea for a price in the region of $44.0m and delivery set in 2019 - 2020.
Newbuilding Market
20
60
100
140
180
mil
lion
$
Tankers Newbuilding Prices (m$)
VLCC Suezmax Aframax LR1 MR
10
30
50
70
90
110
mil
lion
$
Bulk Carriers Newbuilding Prices (m$)
Capesize Panamax Supramax Handysize
Week
8
Week
7±% 2017 2016 2015
Capesize 180k 47.0 47.0 0.0% 43 43 50
Kamsarmax 82k 27.0 27.0 0.0% 25 25 28
Ultramax 63k 25.0 25.0 0.0% 23 23 25
Handysize 38k 22.3 22.3 0.0% 20 20 21
VLCC 300k 83.5 83.5 0.0% 80 88 96
Suezmax 160k 56.0 56.0 0.0% 54 58 64
Aframax 115k 45.0 45.0 0.0% 44 48 53
LR1 75k 43.0 43.0 0.0% 41 43 46
MR 50k 35.0 35.0 0.0% 33 34 36
180.0 180.0 0.0% 186 189 190
70.0 70.0 0.0% 71 74 77
63.0 63.0 0.0% 64 66 68
42.0 42.0 0.0% 42 43 45
LNG 174k cbm
LGC LPG 80k cbm
MGC LPG 55k cbm
SGC LPG 25k cbm
Gas
Bu
lke
rsTa
nke
rs
Vessel
Indicative Newbuilding Prices (million$)
Units Type Yard Delivery Buyer Price Comments
2 Tanker 50,000 dwtHyundai Mipo, S.
Korea2019-2020
Japanese (JV between WFS
and Marinvest)$ 44.0m
1 Tanker 50,000 dwtHyundai Mipo, S.
Korea2019-2020 Japanese (NYK Line) $ 44.0m
1 Tanker 50,000 dwtHyundai Mipo, S.
Korea2019-2020
Japanese (JV between IINO
and Mitsui)$ 44.0m
1 Tanker 4,500 dwtHyundai Mipo, S.
Korea2019
S.Korean
(Petro Plus Logistics)undisclosed
1 Bulker 180,000 dwt Yangzijiang, China 2018-2019Great Wave Navigation - JV
between Cargill and Mitsui$ 41.3m
Tier II, option declared,
total 4 on order
3 Bulker 52,000 dwt Oshima, Japan 2020 Japanese (MOL) undisclosed Tier III
2 Reefer 250,000 cbf Kyokuyo, Japan 2019 undisclosed undisclosed super eco
2 Gas 5,000 cbm Sasaki, Japan 2019 Japanese (Kumiai Senpaku) undisclosed under T/C to Statoil
methanol carriers,
dual fuelled, zinc
coated,
Newbuilding OrdersSize

© Intermodal Research 27/02/2018 8
There is definitely a lot to take in from simply looking at the list of the most recent demolition sales below. As far as the demolition market is concerned, it is evident that prices are steady with no signs of weakening for now, while as rumors for the re-opening of the market in Pakistan for tankers keep on coming, this is expected to keep offering further support to price levels in the short term. What is probably more interesting though in regards to the activi-ty below has less to do with the demolition market and more with the tanker sector. The fact that in just a few days about 1.2 million dwt has been sold for demo is definitely reflective of the disappointing returns in the sector, but it is also an indication of what we should be expecting in regards to this year’s tanker scrapping activity that appears set to remain firm at least for as long as weak earnings keep coinciding with attractive demolition prices. Average prices this week for tankers were at around $230-460/ldt and dry bulk units received about $220-450/ldt.
One of the highest prices amongst recently reported deals was paid by Bang-ladeshi breakers for the VLCC tanker “POROS” (281,050dwt-38,979ldt-blt ‘00), which received $480/ldt.
Demolition Market
100
175
250
325
400
$/ld
tDry Bulk Demolition Prices
Bangladesh India Pakistan China Turkey
100
175
250
325
400
$/l
dt
Tanker Demolition Prices Bangladesh India Pakistan China Turkey
Week
8
Week
7±% 2017 2016 2015
Bangladesh 440 440 0.0% 376 287 360
India 450 450 0.0% 374 283 361
Pakistan 460 460 0.0% 379 284 366
China 230 230 0.0% 251 176 193
Turkey 290 290 0.0% 250 181 225
Bangladesh 430 430 0.0% 358 272 341
India 440 440 0.0% 354 268 342
Pakistan 450 450 0.0% 358 267 343
China 220 220 0.0% 241 160 174
Turkey 280 280 0.0% 240 174 216
Indicative Demolition Prices ($/ldt)
Markets
Tan
ker
Dry
Bu
lk
Name Size Ldt Built Yard Type $/ldt Breakers Comments
KOS 305,870 43,178 2001 DAEWOO, S. Korea TANKER $ 440/Ldt undisclosed as-is Khor Fakkan
POROS 281,050 38,979 2000 MITSUBISHI, Japan TANKER $ 440/Ldt Bangladeshias-is Khor Fakkan incl. 500T
bunkers
KRITI BREEZE 134,441 21,642 1996HYUNDAI HI, S.
KoreaTANKER $ 430/Ldt undisclosed Indian Sub Continent, gas free
MOSCOW KREMLIN 106,521 16,321 1998 NKK, Japan TANKER $ 420/Ldt undisclosed as-is Singapore
MOSCOW 106,553 16,289 1998 NKK, Japan TANKER $ 420/Ldt undisclosed as-is Singapore
KUBAN 106,562 16,280 2000 NKK, Japan TANKER $ 420/Ldt undisclosed as-is Singapore
COTOPAXI 66,100 12,236 1999HYUNDAI HI, S.
KoreaTANKER $ 420/Ldt undisclosed as-is Singapore
KAKARIKI 46,724 11,916 1999SZCZECINSKA
STOCZNIA, PolandTANKER $ 438/Ldt undisclosed as-is Singapore
LIMAR 46,170 9,701 1996HALLA HI - SAMHO,
S. KoreaTANKER $ 435/Ldt undisclosed Indian Sub Continent, gas free
Demolition Sales

The information contained in this report has been obtained from various sources, as reported in the market. Intermodal Shipbrokers Co. believes such information to be factual and reliable without mak-ing guarantees regarding its accuracy or completeness. Whilst every care has been taken in the production of the above review, no liability can be accepted for any loss or damage incurred in any way whatsoever by any person who may seek to rely on the information and views contained in this material. This report is being produced for the internal use of the intended recipients only and no re-producing is allowed, without the prior written authorization of Intermodal Shipbrokers Co.
Written by Intermodal Research & Valuations Department | [email protected] Ms. Eva Tzima | [email protected]
Mr. George Panagopoulos | [email protected]
Market News
“Otto seeks to avoid collapse under $877m debt
Singapore OSV owner and shipbuilder Otto Marine is trying to avoid going under through a bid for court-led restructuring.
The company has $877m in liabilities, with a col-lapse imminent unless it receives protection from creditors, according to a high court application for judicial management obtained by Bloomberg.
In the application, executive chairman Yaw Chee Siew said: “I cannot be expected to continue shoul-dering the financial burden and injecting fresh capi-tal into the company."
The company will probably survive for another two months based on its cash reserves, Yaw said in the filing.
But he added: “There is a reasonable probability of rehabilitating the company,” as the oil and gas mar-ket slowly recovers.
Yaw took full control of Otto in 2016, delisting it from the Singapore exchange. He is the biggest creditor with $208m owed Investor lined up
The application was made on Friday in a closed hearing. Otto's lawyer said a statement would fol-low a court ruling on the matter.
Otto had $869m in assets at the end of last year, but most of them are unlikely to be recovered in full, according to the court papers...”(TradeWinds)
Commodities & Ship Finance
23-Feb-18 22-Feb-18 21-Feb-18 20-Feb-18 19-Feb-18W-O-W
Change %
10year US Bond 2.870 2.920 2.940 2.890 2.880 -0.3%
S&P 500 2,747.30 2,747.30 2,703.96 2,701.33 2,716.26 0.6%
Nasdaq 7,337.39 7,337.39 7,210.09 7,218.23 7,234.31 1.4%
Dow Jones 25,309.99 25,309.99 24,962.48 24,797.78 24,964.75 0.4%
FTSE 100 7,244.41 7,252.39 7,281.57 7,246.77 7,247.66 -0.7%
FTSE All-Share UK 3,991.50 3,992.40 4,007.43 3,991.90 3,988.33 -0.5%
CAC40 5,317.37 5,309.23 5,302.17 5,289.86 5,256.18 0.7%
Xetra Dax 12,483.79 12,461.91 12,470.49 12,487.90 12,385.60 0.8%
Nikkei 21,892.78 21,736.44 21,970.81 21,925.10 22,149.21 -1.2%
Hang Seng 31,267.17 31,267.17 30,965.68 31,431.89 30,873.63 0.5%
DJ US Maritime 250.95 250.95 247.83 247.34 248.98 0.7%
$ / € 1.23 1.23 1.23 1.23 1.24 -0.9%
$ / ₤ 1.40 1.40 1.39 1.40 1.40 -0.4%
¥ / $ 106.89 106.82 107.58 107.39 106.72 0.6%
$ / NoK 0.13 0.13 0.13 0.13 0.13 -0.9%
Yuan / $ 6.34 6.35 6.35 6.35 6.35 -0.2%
Won / $ 1,076.80 1,081.04 1,075.84 1,073.61 1,067.68 0.9%
$ INDEX 89.88 89.74 90.00 89.72 89.10 0.9%
Market Data
Cu
rre
nci
es
Sto
ck E
xch
ange
Dat
a
1,300
1,350
50
55
60
65
70
75
80
goldoil
Basic Commodities Weekly Summary
Oil WTI $ Oil Brent $ Gold $
23-Feb-18 16-Feb-18W-O-W
Change %
Rotterdam 557.0 545.0 2.2%
Houston 586.0 575.0 1.9%
Singapore 584.5 582.5 0.3%
Rotterdam 356.5 350.5 1.7%
Houston 354.5 342.5 3.5%
Singapore 373.5 371.5 0.5%
Bunker Prices
MG
O3
80
cst
CompanyStock
ExchangeCurr. 23-Feb-18 16-Feb-18
W-O-W
Change %
AEGEAN MARINE PETROL NTWK NYSE USD 2.50 4.45 -43.8%
CAPITAL PRODUCT PARTNERS LP NASDAQ USD 3.22 3.15 2.2%
COSTAMARE INC NYSE USD 6.25 6.43 -2.8%
DANAOS CORPORATION NYSE USD 1.35 1.35 0.0%
DIANA SHIPPING NYSE USD 3.65 3.79 -3.7%
DRYSHIPS INC NASDAQ USD 3.41 3.73 -8.6%
EAGLE BULK SHIPPING NASDAQ USD 4.86 4.76 2.1%
EUROSEAS LTD. NASDAQ USD 1.88 1.85 1.6%
GLOBUS MARITIME LIMITED NASDAQ USD 1.06 1.04 1.9%
NAVIOS MARITIME ACQUISITIONS NYSE USD 0.75 0.79 -5.1%
NAVIOS MARITIME HOLDINGS NYSE USD 1.28 1.28 0.0%
NAVIOS MARITIME PARTNERS LP NYSE USD 1.96 1.90 3.2%
SAFE BULKERS INC NYSE USD 3.81 3.57 6.7%
SEANERGY MARITIME HOLDINGS CORP NASDAQ USD 1.06 1.04 1.9%
STAR BULK CARRIERS CORP NASDAQ USD 12.09 11.76 2.8%
STEALTHGAS INC NASDAQ USD 4.42 4.50 -1.8%
TSAKOS ENERGY NAVIGATION NYSE USD 3.43 3.40 0.9%
TOP SHIPS INC NASDAQ USD 0.18 0.20 -10.0%
Maritime Stock Data

© Intermodal Shipbrokers Co
10
27/02/2018
Your Contact Details
Full Name: Title:
Company: Position:
Address:
Address:
If you wish to subscribe to our reports please contact us directly by phone or by e-mailing, faxing or posting the below form,
which can also be found on our website.
Tel: +30 210 6293 300 Intermodal Shipbrokers Co.
Fax:+30 210 6293 333-4 17th km Ethniki Odos Athens-Lamia & 3 Agrambelis St.
Email: [email protected] 145 64 N.Kifisia,
Website: www.intermodal.gr Athens - Greece
Telephone:
E-mail:
Company Website: