Weekly Comment Global
11
NOT FOR DISTRIBUTION INTO THE U.S. UBS 1 Equities Sales Trading Commentary Technical Analysis Weekly Comment Global Michael Riesner Marc Müller 22/01/2013 [email protected] [email protected] +41-44-239 1676 +41-44-239 1789 The Air is Getting Thin … Energy Breaking Out! US Trading: After just a few days of a consolidation in early January we saw further strength in the US, and the SPX broke its early September high at 1474. On the sector side cyclicals continue to lead. In energy we got our anticipated breakout in absolute and relative terms (buy the dips) and the transport sector broke to a new all-time high! Furthermore, in Q1 we see traditionally relative strength in small and mid caps and in line with this seasonal liquidity effect; the Russell-2000 is outperforming and hit a new all-time high, which is bullish structurally. Tactically, the market looks overbought and with a divergence forming in market breadth indicators and our sentiment work heading towards contrarian territory the SPX is getting vulnerable for a pullback. Given the fact that we still do not have a classic price top forming, let alone the high momentum breakouts in DJT and RUT, it is definitely too early to short or sell the market aggressively. From a cyclical perspective we cannot rule out a 4% to 5% setback into deeper February but we are sticking to our Q4 comments and our 2013 strategy report, that apart from minor weakness we continue to favor the market moving higher into a late Q1/early Q2 tactical top, which then in the larger context could be the beginning of a volatile and longer lasting distributive process. From a pure price point of view the early September high at 1474 represents a new key support. As long as the SPX trades above 1474 the market has more room towards 1500/1520. A break of 1474 would call for a pullback to 1450. A break of 1430 would suggest a re-test of the late December low at 1398, which has a pivotal character! European Trading: Europe is losing relative momentum versus the US and selectivity is increasing. The periphery, the FTSE, and the Swiss market are outperforming, whereas most other core European markets are just trading sideways since early January, which means these markets are effectively in a consolidation phase. On a short-term basis we cannot rule out a final overshoot but given the picture in the US and the overbought stance of financials we see Europe vulnerable for a pullback later this week. A break of 2685 in the Euro Stoxx would be short-term negative and suggest a pullback to 2620. From a cyclical perspective we see the risk of minor weakness into mid-February before starting the next rally attempt into late Q1/early Q2. Inter Market Analysis: From a cross-asset class perspective, the underlying trend in risk assets is bullish but we have nonetheless signs that are sending out warning signals. Despite a new tactical buy signal in the commodity segment we do not see any momentum in the price of copper, which fits the growing divergence between the lagging inflation expectations in the US versus the rising SPX as well as the inability of the AUD to break its obvious key resistance at 1.06. Last year in Q1 we had a very similar set-up, where after the LTRO induced reduction in risk premiums the real economy did not deliver and it was the leading indicator for the Q2 correction in risk assets! The underlying trend bias for the EURUSD remains bullish but on a short-term basis the pair is increasingly overbought as well as heading into resistance. We cannot rule out a final overshoot to 1.35 but we wouldn’t chase the EURUSD higher. From a cyclical perspective we favor a near-term pullback into mid-February towards 1.30/1.29 before starting the next bigger up leg into late Q1/early Q2. Since late September we have been bearish JPY. However, the December/January rally is near vertical and unsustainable from a momentum basis. On a short-term basis we expect a pullback into February before moving higher into a more significant late Q1/early Q2 top. Don’t chase USDJPY/EURJPY higher! In line with our pre-Christmas call we saw a significant trading low in gold in later December. However, the bounce is weak in momentum and so far corrective in shape. As long as we don’t see an impulsive break of $1710 we cannot rule out the risk of another re-test of the December bottom at $1630.
Transcript of Weekly Comment Global

NOT FOR DISTRIBUTION INTO THE U.S. UBS 1
Equities Sales Trading Commentary
Technical Analysis Weekly Comment Global
Michael Riesner Marc Müller 22/01/2013 [email protected] [email protected] +41-44-239 1676 +41-44-239 1789
h
The Air is Getting Thin … Energy Breaking Out! US Trading: After just a few days of a consolidation in early January we saw further strength in the US, and the
SPX broke its early September high at 1474. On the sector side cyclicals continue to lead. In energy we got our anticipated breakout in absolute and relative terms (buy the dips) and the transport sector broke to a new all-time high! Furthermore, in Q1 we see traditionally relative strength in small and mid caps and in line with this seasonal liquidity effect; the Russell-2000 is outperforming and hit a new all-time high, which is bullish structurally.
Tactically, the market looks overbought and with a divergence forming in market breadth indicators and our sentiment work heading towards contrarian territory the SPX is getting vulnerable for a pullback. Given the fact that we still do not have a classic price top forming, let alone the high momentum breakouts in DJT and RUT, it is definitely too early to short or sell the market aggressively. From a cyclical perspective we cannot rule out a 4% to 5% setback into deeper February but we are sticking to our Q4 comments and our 2013 strategy report, that apart from minor weakness we continue to favor the market moving higher into a late Q1/early Q2 tactical top, which then in the larger context could be the beginning of a volatile and longer lasting distributive process.
From a pure price point of view the early September high at 1474 represents a new key support. As long as the SPX trades above 1474 the market has more room towards 1500/1520. A break of 1474 would call for a pullback to 1450. A break of 1430 would suggest a re-test of the late December low at 1398, which has a pivotal character!
European Trading: Europe is losing relative momentum versus the US and selectivity is increasing. The periphery, the FTSE, and the Swiss market are outperforming, whereas most other core European markets are just trading sideways since early January, which means these markets are effectively in a consolidation phase. On a short-term basis we cannot rule out a final overshoot but given the picture in the US and the overbought stance of financials we see Europe vulnerable for a pullback later this week. A break of 2685 in the Euro Stoxx would be short-term negative and suggest a pullback to 2620. From a cyclical perspective we see the risk of minor weakness into mid-February before starting the next rally attempt into late Q1/early Q2.
Inter Market Analysis: From a cross-asset class perspective, the underlying trend in risk assets is bullish but we have nonetheless signs that are sending out warning signals. Despite a new tactical buy signal in the commodity segment we do not see any momentum in the price of copper, which fits the growing divergence between the lagging inflation expectations in the US versus the rising SPX as well as the inability of the AUD to break its obvious key resistance at 1.06. Last year in Q1 we had a very similar set-up, where after the LTRO induced reduction in risk premiums the real economy did not deliver and it was the leading indicator for the Q2 correction in risk assets!
The underlying trend bias for the EURUSD remains bullish but on a short-term basis the pair is increasingly overbought as well as heading into resistance. We cannot rule out a final overshoot to 1.35 but we wouldn’t chase the EURUSD higher. From a cyclical perspective we favor a near-term pullback into mid-February towards 1.30/1.29 before starting the next bigger up leg into late Q1/early Q2.
Since late September we have been bearish JPY. However, the December/January rally is near vertical and unsustainable from a momentum basis. On a short-term basis we expect a pullback into February before moving higher into a more significant late Q1/early Q2 top. Don’t chase USDJPY/EURJPY higher!
In line with our pre-Christmas call we saw a significant trading low in gold in later December. However, the bounce is weak in momentum and so far corrective in shape. As long as we don’t see an impulsive break of $1710 we cannot rule out the risk of another re-test of the December bottom at $1630.

Weekly Comment
NOT FOR DISTRIBUTION INTO THE U.S. UBS 2
US Equity Market Update:
SPX is Capped and Overbought…Don’t Chase! Based on an ongoing healthy sector rotation the US market remains pretty resilient on the downside. After just a few days of a sideways consolidation in early January we saw further strength and the SPX finally broke its early September high at 1474, which de facto opens the way towards the 1500/1520 handle. On the sector front we see banks taking a breather, whereas cyclical themes continue to lead the market, which is in line with our underlying bullish view on the market since August. Materials and the Morgan Stanley cyclical index (chart 6.) rallied aggressively. In late December we highlighted the energy sector as a next breakout candidate. Last week the OSX and the whole energy sector broke their 2011 long-term downtrend, which is bullish and suggests more outperformance medium-term. Last but not least, since its mid-November low we saw a very aggressive rally in the transport sector, which last week hit a new all-time high. Together with the Russell-2000 hitting a new all-time high and following its classic seasonal pattern of outperforming in Q1 as well as a new breakout in the defensive healthcare sector we can say that that despite being overbought, the underlying picture/structure in the US market remains bullish.
However, despite small and mid caps outperforming we see a gradually increasing selectivity in the US since the large and mega caps are latently underperforming. In our 2013 strategy we have highlighted the deteriorating technical background of the stocks, which we have labeled as the cheerleaders of the 2009 bull market in having a high correlation to the March 2009 bull cycle. Most of these stocks have broken already their 2009 bull trends and are underperforming and we continue to see this as one argument why, even if we should see another bounce in these stocks, the overall market should be finally capped on the upside although we think that all in all there is still something missing on the upside.
Conclusion: Last week’s new breakout in the SPX has not been confirmed by a new high in NYSE 52-week highs, which represents a growing divergence in market breadth. With hitting 53%, the bullish consensus of the Investor Intelligence is on the way into contrarian territory, which mirrors the risk chasing market environment of the last few weeks. Together with our overbought indicator work we see the market increasingly capped and vulnerable for a first pull back, which however we would still see as only the beginning of a potential short-term top building process. Keep in mind, given the recent momentum breakouts in DJT and the Russell as well as the non existence of any distributive pattern or classic price top in the SPX it is definitely still too early to be bearish on the US market. So even if we were to see a first pull back, we would still need to see at least one more failed rally attempt before we could anticipate a more meaningful pullback in the market.
From a pure cyclical perspective we have a more important low projection in mid/late February, which suggests that in the next two weeks we in fact could see this top building process. If so, we would expect this to be the basis for a 4% to 5% set back into deeper February but we are sticking to our Q4 comments and our 2013 strategy report, that apart from minor weakness we continue to favor the market moving higher into a late Q1/early Q2 tactical top, which then in the larger context could be the beginning of a volatile and longer lasting distributive process.
Chart 1. ) S&P-500 Daily Chart
Chart 2. ) S&P-500 with NYSE New 52-Week Highs

Weekly Comment
NOT FOR DISTRIBUTION INTO THE U.S. UBS 3
US Equity Market Update:
Sentiment: Since the mid November lows we have seen a very sharp sentiment change in the market and with week’s jump in the Investor Intelligence Bullish Consensus to 53% our sentiment work is more and more on the way into contrarian territory. On the one hand we are still convinced that we from a pure behavioral finance perspective we are still in the process where the gap between bullish talking and positioning has to be closed to get the real contrarian indication but with sentiment indicators hitting extreme levels the air on the upside is at least on a short-term basis definitely getting thin.
Mid Caps Strong! The new all-time high in the Russell-2000 is just the ultimate confirmation of the relative outperformance of mid caps versus mega caps that started after the mid November low. In the meantime the Russell-2000 has broken its 2011 downtrend versus the S&P-100, which suggests further outperformance of second row stocks versus these stocks which we highlighted in our 2013 strategy report as the cheerleaders of the March 2009 bull market. Keep in mind, most of these stocks have broken their 2009 bull trends during the Q4 correction, which we see as the first part of a bigger distribution pattern.
Conclusion: Tactically the place to be is the mid cap segment. However, this also means that at this point where small and mid caps are getting increasingly overbought and start a pullback, the US market will have a problem if we do not see a big rotation back into mega caps.
Chart 3. ) S&P-500 Weekly Chart with Investor Int. Bullish Consensus
Chart 4. ) Russell-2000 Weekly Chart
Chart 5. ) Russell-2000 versus S&P-100
21/1/13
J F M A M J J A S O N D J F M A M J J A S O N D J3.00
3.10
3.20
3.30
3.40
3.50
3.60
RUSSEL-2000/S&P-100
HIGH 3.56 5/4/11,LOW 3.02 1/8/12,LAST 3.30 18/1/13
3.00
3.10
3.20
3.30
3.40
3.50
3.60
Source: Thomson Reuters Datastream
mid caps breakout
versus large caps !!

Weekly Comment
NOT FOR DISTRIBUTION INTO THE U.S. UBS 4
US Equity Market Update:
Cyclicals Overbought! In November we highlighted the false breakout below 966 in the CYC as a buying opportunity as very often we are seeing quite aggressive moves on the other side after such a false breakout. Furthermore, our regular readers know that we use the ADX indicator more as a contrarian indicator than a trend measuring tool. So when we see extreme low ADX readings it is usually an indication of a trend breakout, whereas an ADX moving to extreme high reading suggests exactly the opposite, a maturing trend and therefore the risk of starting a pullback and/or longer lasting consolidation.
Conclusion: The Morgan Stanley Cyclical index is overbought and with the ADX is heading into extreme territory, we see the November rally maturing, which suggests that further upside should be limited. Maybe we see a test of the 2011 high at 1040 but given the current setup we do not expect a break through this pivotal resistance area.
Energy Breakout … Buy the Dips! In our December 11th weekly report we highlighted the lagging US energy sector as one of the next potential breakout candidates in the US market. After the long lasting underperformance we said that with our pre-Christmas call we could still be too early, but we highlighted a seasonal pattern where in crude oil we very often see an important seasonal bottom around February followed by seasonal strength into deeper summer. In this context the energy complex and the mining sector remain our late cyclical sector bets for 2013.
Last week the OSX broke its 2011 long-term downtrend and the energy ETF (XLE) broke its 2011 downtrend. Although the overall market looks overbought and could pull back we do not think that this represents a false breakout. On the contrary, last week’s breakout move is in our view just the beginning of a more important outperformance leg in US energy stocks into at least summer and in this context we would use any potential near-term weakness into February to buy/add.
Chart 6. ) Morgan Stanley Cyclical Index daily Chart
Chart 7. ) OSX Daily Chart
Chart 8. ) Energy Complex (XLE) versus S&P-500
U:XLE (Energy)/S&P
J F M A M J J A S O N D J F M A M J J A S O N D J
x10-2
4.60
4.80
5.00
5.20
5.40
5.60
5.80
6.00
6.20
Source: Thomson Reuters Datastream
breakout!!

Weekly Comment
NOT FOR DISTRIBUTION INTO THE U.S. UBS 5
Inter Market Update:
There’s Something Wrong in Paradise!! With the July trend reversal in the US dollar and in commodities and the bond market having topped out the underlying cross asset class trends are bullish since July 2012. However, we have signs that are sending out warning signals and it is déjà vu from last year Q1. Last week the commodity complex broke out and it is not just the strong oil price that pushes the commodity measures higher. In early December we highlighted the basing signals in soft commodities and in the meantime we have seen breakouts in coffee, cocoa, cotton and the grain sector as well as in the metals complex in platinum and silver. All this shows the strength in commodities is actually broad-based, but it is surprising to see that with copper we have one important factor missing to reflect a real and big rally in the commodity complex. Copper just continues to trade sideways, which is weak and this fits the growing divergence between the lagging inflation expectations in the US (chart 10.) versus the rising SPX, as well as the inability of the AUD to break its obvious key resistance at 1.06.
Conclusion: Last year in Q1 we had a very similar setup, where after the LTRO induced rally and reduction in risk premiums the real economy did not deliver and it was the leading indicator for the Q2 correction in risk assets! It seems we are in a very similar setup. With the rally of the last 5-6 months we saw a huge reduction in risk premiums. The next step in the markets will be to see whether the real economy delivers or not. This is at least one factor why near-term the market could take a breather before starting another rally attempt. If the real economy/lead indicators do not support the recent rally in later Q1 it is increasingly likely to see again a bigger correction starting into Q2!!
Chart 9. ) Copper Daily Chart
Chart 10. ) Spread US TIPS/US-Treasury versus S&P-500
Chart 11. ) AUD Daily Chart
Chart 12. ) CCI Index Future Daily Chart

Weekly Comment
NOT FOR DISTRIBUTION INTO THE U.S. UBS 6
Inter Market Update:
EUR Vulnerable for a Pull Back … USDJPY Toppish! Given last years July 4-year cycle peak in the USD and the head & shoulder pattern in the DXY, the underlying trend bias for the EURUSD remains bullish. However, with our weekly momentum approaching overbought extremes the EURUSD looks increasingly overbought on a short-term basis and with heading into resistance the likelihood to see a corrective pull back is increasing. We won’t rule out a final overshoot to 1.35 but we wouldn’t chase the EURUSD higher. From a cyclical perspective we favor a near-term pullback into mid-February towards 1.30/1.29 before starting the next bigger up leg into late Q1/early Q2, where we could see the EURUSD moving into a more important tactical top.
Since the September bottom we have been tactically bullish on the USDJPY (bearish JPY). Without any bigger pull back the USDJPY continued to rally to 90 into January, which was a surprise. Nonetheless, the December/January rally was near vertical and unsustainable from a momentum basis and with our daily trend work rolling over we have a first indication that a short-term top is forming. A break of 88 would be short-term bearish and call for a move to 87 worst case 85. From a cyclical perspective we see the risk of a corrective pullback into mid February before moving higher into a more significant late Q1/early Q2 top that should complete a bull cycle of a larger degree.
Short-term we would not chase USDJPY/EURJPY higher!
Chart 13. ) Trade Weighted US Dollar (DXY) Daily Chart
Chart 14. ) EURUSD Weekly Chart
Chart 15. ) USDJPY Daily Chart
Chart 16. ) EURJPY Daily Chart

Weekly Comment
NOT FOR DISTRIBUTION INTO THE U.S. UBS 7
Inter Market Update:
Gold Testing Key Resistance!! Tactically the December decline in gold was an extension of the October correction but looking at the shape the whole pattern the October/December decline has a classic a-b-c style, which suggests that it was just a corrective counter trend move after the impulsive May/October bull-run. In line with our pre-Christmas call gold has hit our anticipated trading low in later December and with an intact momentum buy signal in our daily and weekly momentum work we would favour more short-term upside. However, the bounce structure in gold is so far weak, which is suspicious. From a pure pattern standpoint gold is in a kind neutral position, where the bull interprets the recent trading action as a clear bottom, whereas for the bear gold is trading in a corrective (a-b-c) bounce. Looking at the patterns in the metal complex we can see that silver has completed a double bottom and in platinum we saw a big high momentum breakout, which is bullish and should give gold as well a more bullish note. Nonetheless, as long as we don’t see an impulsive break of $1710 we cannot rule out the risk of another re-test of the December bottom at $1630. Keep in mind, with the risk chasing sentiment environment gold has a sentiment problem, where short-term the yellow metal could be capped. This however does not change our underlying bullish sentiment, which means in particularly Q2 and in later summer we would expect bullish momentum coming back into gold and in H2 we continue to favour a test of the September 2011 all time high at $1920. In this context we also see the current price action in the mining sector as a bottom building process, where a break of 455 would complete a bigger price bottom in the HUI index.
Chart 17. ) Gold Daily Chart
Chart 18. ) Gold Weekly Chart
Chart 19. ) Platinum Daily Chart
Chart 20. ) HUI Daily Chart

Weekly Comment
NOT FOR DISTRIBUTION INTO THE U.S. UBS 8
European Equity Market Update:
Losing Momentum … Swiss Market Outperforming! Europe is losing relative momentum versus the US and selectivity is increasing. The periphery, the FTSE, and the Swiss market are outperforming, whereas most other core European markets and the broader STOXX-600 are just trading sideways since early January, which means these markets are effectively already in consolidation mode. On a short-term basis we cannot rule out a final attempt to overshoot but given the picture in the US and the overbought stance of European financials (SX7P is trading 22% above its 200-day moving average!!) we see Europe vulnerable for a pullback later this week. A break of 2685 in the Euro Stoxx would be short-term negative and suggest a pullback to 2620. From a cyclical perspective we see the risk of minor weakness into mid-February before starting the next rally attempt into late Q1/early Q2.
Euro Stoxx 50:
Apart form the sharp rally of the first trading day in 2013, the Euro Stoxx has been trading volatile sideway for more than 2 weeks now. Objectively seen sideways trading can be seen as a constructive pattern as long as we don’t see the break of last weeks reaction low at 2685, which represents a key support in our short-term trading.
On the upside a break of 2735 would call for another extension towards 2800, whereas a break of 2685 would complete a short-term price top with next support at 2685 and 2600.
STOXX Europe Oil & Gas:
From a seasonal perspective, the price of oil and energy stocks usually bottom out into February and tend to rise in absolute and relative terms into Q3. The break of the September downtrend is for the SXEP an initial improvement in absolute terms and the current consolidation is forming a healthy trading range. Given the tactical risk of a final February setback, we recommend to accumulate dips, whereas a daily close above 335 would generate a continuation signal for the emerging November uptrend.
Chart 21. ) Euro Stoxx-50 Daily Chart
Chart 22. ) STOXX Europe Oil&Gas Daily Chart (SXEP)

Weekly Comment
NOT FOR DISTRIBUTION INTO THE U.S. UBS 9
European Equity Market Update:
FTSE-100:
Despite a mixed market breadth, the FTSE-100 has been able to extend its November uptrend and the index has cleared the highs from 2011. This is bullish from a pure price point of view but one should bear in mind that the short-term uptrend is very steep which looks exhaustive. However, potential pullbacks should find good buying support by the former resistances at 6100 and at the latest at 6000.
The next medium-term price resistance is at 6377, defined by the May 2008 high.
DAX-30:
After the strong start into 2013, the DAX has been trading sideways. From a pure pattern point of view, this is a constructive consolidation pattern as long as the market holds its last week’s reaction low at 7635, which is a key support!! On the indicator front, our daily trend work has turned short, which suggests the risk to see further short-term weakness. On the upside we wont rule out another breakout attempt but given the losing relative momentum of the German market we do not expect a big new momentum breakout. , despite the risk of a marginal new reaction high, we expect further near-term consolidation work. A break of 7800 would call for a move towards 7900 as a next target, whereas taking out 7635 would complete a short-term price top with next support at 7600 and 7500/7471.
Swiss Market Index:
Thanks to new breakouts and big rallies in the heavy weighted defensive mega caps, the SMI has been among the biggest outperformers in Europe and the chart has gone vertical in the short-term picture. The breakout of the November 2012 trend channel above the upper trend channel line looks exhaustive and like a temporary overshooting, which will be difficult to hold during a potential pull back into February. An initial pullback slightly below the price projection at 7500 has started and is likely to extend in terms of price and time to work off the tactical overbought situation. A minor support is at 7200. Next major support is at 7000.
Generally, a high momentum top is not the way a market tops out, so after a short-term pull back and/or consolidation we can expect roe upside into late Q1/early Q2.
Chart 23. ) FTSE-100 daily Chart
Chart 24. ) DAX-30 Daily Chart
Chart 25. ) Swiss Market Index Daily Chart
Weekly Comment
NOT FOR DISTRIBUTION INTO THE U.S. UBS 10
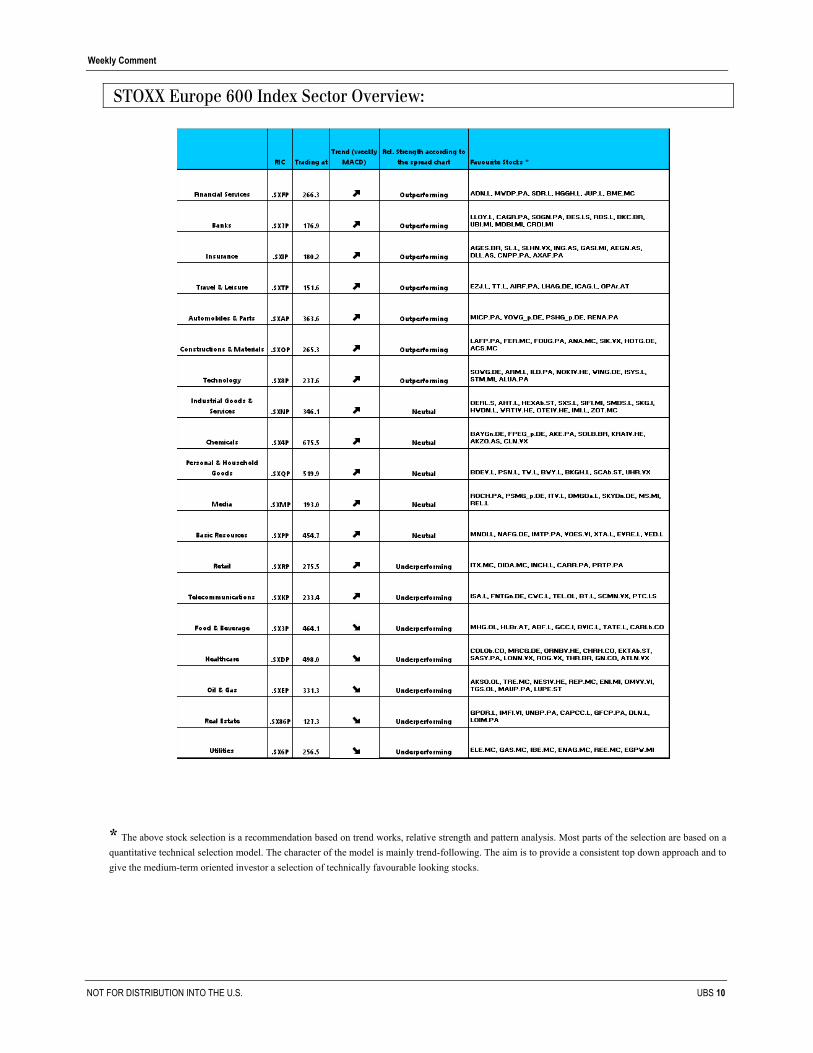
STOXX Europe 600 Index Sector Overview:
* The above stock selection is a recommendation based on trend works, relative strength and pattern analysis. Most parts of the selection are based on a
quantitative technical selection model. The character of the model is mainly trend-following. The aim is to provide a consistent top down approach and to
give the medium-term oriented investor a selection of technically favourable looking stocks.

Weekly Comment
NOT FOR DISTRIBUTION INTO THE U.S. UBS 11
Weekly Technical Indicators: (Source: Pinnacle Data, Datastream) Charts: Metastock
This communication is issued by UBS AG or an affiliate (“UBS”) by the Sales or Trading Department to institutional investors only and is not research. It is for informational purposes and is not an official confirmation of terms. It is not guaranteed as to accuracy, nor is it a complete statement of the financial products or markets referred to. Opinions expressed are subject to change without notice and may differ or be contrary to the opinions or recommendations of UBS Investment Research or the opinions expressed by other business areas or groups of UBS as a result of using different assumptions and criteria. UBS may, as principal or agent, have position in, underwrite, buy or sell, make a market in, or enter into derivatives transactions in relation to any financial instrument or asset referred to in this email. Unless stated specifically otherwise, this is not a recommendation, offer or solicitation to buy or sell and any prices or quotations contained herein are indicative only. UBS has policies and procedures designed to minimize the risk that that officers and employees are influenced by any conflicting interest or duty and that confidential information is improperly disclosed or made available. To the extent permitted by law, UBS does not accept any liability arising from the use of this communication. For additional information, please contact your local sales or trading contact. © 2013 UBS. All rights reserved. Intended for recipient only and not for further distribution without the consent of UBS.


![Second Revision No. 1040-NFPA 13-2017 [ Global Comment ]](https://static.fdocuments.in/doc/165x107/6169be7011a7b741a34adfa8/second-revision-no-1040-nfpa-13-2017-global-comment-.jpg)