Weekly Chart Analysis 24August
14
Weekly T echnical Analysis W eekly T echnical Analysis for week commencing 24 August 2014 for week commencing 24 August 2014 Prepared by Nicola uke Prepared by Nicola uke Page 2 !"P#$ page % &#'#$ Page 4 A##$ Page ( #$)P* Page + &#'!"P Page , #$-./ Page #$-A Page &#')P* Page 10 !old Page 11 WT 3il Page 12 A Page 1% $5P(00 Talking6/ore7 is uni8ue in that it is the only audio ser9ice in the world that is a9ailable 24 hours a day and e7clusi9ely for / traders: t is deli9ered by our highly skilled team of Talking6/ore7 analysts around the clock from $unday e9ening through to /riday e9ening : &9ery member of our team has a different market speciality and each one has a number of years e7perience working for an in9estment bank; hedge fund or financial news agency: <ost importantly Talking6/ore7 analysts are completely independent and neutral in their opinions:
-
Upload
nicola-duke -
Category
Documents
-
view
224 -
download
0
Transcript of Weekly Chart Analysis 24August

8/11/2019 Weekly Chart Analysis 24August
http://slidepdf.com/reader/full/weekly-chart-analysis-24august 1/13
Weekly Technical AnalysisWeekly Technical Analysisfor week commencing 24 August 2014for week commencing 24 August 2014
Prepared by Nicola ukePrepared by Nicola uke
Page 2 !"P#$page % &#'#$Page 4 A##$Page ( #$)P*Page + &#'!"PPage , #$-./Page #$-APage &#')P*Page 10 !old
Page 11 WT 3ilPage 12 A
Page 1% $5P(00
Talking6/ore7 is uni8ue in that it is the only audio ser9ice in the world that is a9ailable 24 hours a day and e7clusi9elyfor / traders: t is deli9ered by our highly skilled team of Talking6/ore7 analysts around the clock from $unday
e9ening through to /riday e9ening: &9ery member of our team has a different market speciality and each one has anumber of years e7perience working for an in9estment bank; hedge fund or financial news agency:<ost importantly Talking6/ore7 analysts are completely independent and neutral in their opinions:
8/11/2019 Weekly Chart Analysis 24August
http://slidepdf.com/reader/full/weekly-chart-analysis-24august 2/13
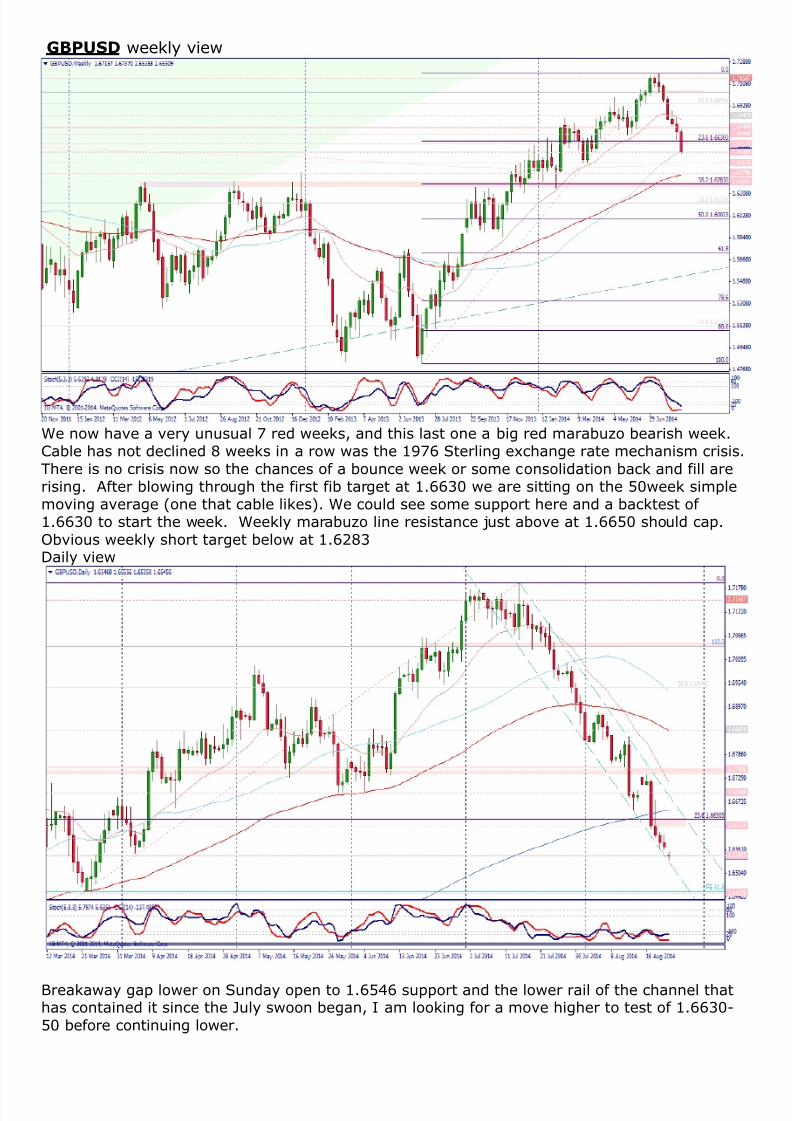
GBPUSD weekly 9iew
We now ha9e a 9ery unusual , red weeks; and this last one a big red marabu=o bearish week:-able has not declined weeks in a row was the 1,+ $terling e7change rate mechanism crisis:
There is no crisis now so the chances of a bounce week or some consolidation back and fill arerising: After blowing through the first fib target at 1:++%0 we are sitting on the (0week simplemo9ing a9erage >one that cable likes?: We could see some support here and a backtest of1:++%0 to start the week: Weekly marabu=o line resistance @ust abo9e at 1:++(0 should cap:
3b9ious weekly short target below at 1:+2%aily 9iew
"reakaway gap lower on $unday open to 1:+(4+ support and the lower rail of the channel thathas contained it since the )uly swoon began; am looking for a mo9e higher to test of 1:++%06
(0 before continuing lower:

8/11/2019 Weekly Chart Analysis 24August
http://slidepdf.com/reader/full/weekly-chart-analysis-24august 3/13
EURUSD Weekly 9iew
After three weeks of do@is then the market finally broke lower with a big marabu=o mo9e into1:%%4+ support: /ibonacci rules say ha9ing re9ersed at the +1:fib of the 2011high62012low weshould go to the %:2fib ne7t at 1:%14+ 5 this is also a good weekly support 5 resistance le9el:
aily 9iew
$unday gapped lower into 5 @ust through 1:%2 support: "etter support 5 weekly fib target is
lower at 1:%1(0: "elow that is all important 1:%01, >(0 retracement of rally from 2012 lows?1:%24, should hold as resistance on any retest:

8/11/2019 Weekly Chart Analysis 24August
http://slidepdf.com/reader/full/weekly-chart-analysis-24august 4/13
AUDUSD weekly 9iew
$till consolidating sideways abo9e April <ay lows: /ibonacci pattern fa9ours higher if we couldget some momentum going:
aily 9iew
August lows retested and bullish hammer keeps hope for the bullish gartley fibonacci pattern inplay: .a9e to clear pi9otal %2 resistance for this to go higher; until then this is a range tradeand we risk the range lows at 20+ retested:

8/11/2019 Weekly Chart Analysis 24August
http://slidepdf.com/reader/full/weekly-chart-analysis-24august 5/13
USDJPY weekly 9iew
.uge breakout week; broke abo9e <arch highs at 104:24 and confirms double bottom andtarget of 10,:42: "efore that we ha9e to clear the dark grey trendline on chart which is fromthe 1 5 200, highs and the 10(:+0 cluster of resistance
aily 9iew
/riday was a hugely 9olatile long legged do@i day and $unday night sees us gap abo9e those
e7treme highs:10%:0 should be good support on any retest:

8/11/2019 Weekly Chart Analysis 24August
http://slidepdf.com/reader/full/weekly-chart-analysis-24august 6/13

8/11/2019 Weekly Chart Analysis 24August
http://slidepdf.com/reader/full/weekly-chart-analysis-24august 7/13
USDCHF weekly 9iew
After three weekly shooting stars B do@is this pair ripped higher to make new highs for 2014 andflips the weekly trend to bullish: Weekly bullish marabu=o"igger picture this chart is bullish and #$-./ should hold the <ay low and rally back to0:2+(6,0 and then 0:46440
aily 9iew:
"ull flag pattern measure rule >using pole? pro@ects target of 0:%!ood $upport to buy at 0:00 and 0:11(

8/11/2019 Weekly Chart Analysis 24August
http://slidepdf.com/reader/full/weekly-chart-analysis-24august 8/13
USDCAD
Weekly 9iew
"ig picture 9iew is we reached the (0 retracement of the 200 high and sold off: We rallied tothe (0 of that sell off and are stuck there now: None of this is bullish yet unless we can breakup through these big fib le9els:
aily 9iew
$upport at 1:0( keeps the bull 9iew ali9e
1:0( keeps the bear 9iew ali9ewe need to break out of this range

8/11/2019 Weekly Chart Analysis 24August
http://slidepdf.com/reader/full/weekly-chart-analysis-24august 9/13
EURJPY weekly 9iew
o@i week; failure to close abo9e )uly highs: 3scillating and forming a wedge at 200 highs le9elkeeps bullish argument ali9e: Cery o9erbought #$)P* might ha9e an effect:
aily 9iew
Not the best looking yen trade out there <3:

8/11/2019 Weekly Chart Analysis 24August
http://slidepdf.com/reader/full/weekly-chart-analysis-24august 10/13
GOLD weekly 9iew
The middle of a wedge and between the +1: 5 %:2 fib is a hard place to trade 5 we are still sathere: Watching the trendline from ecember 201% low for a break or a long entry
aily 9iew
Watching the trend6line support

8/11/2019 Weekly Chart Analysis 24August
http://slidepdf.com/reader/full/weekly-chart-analysis-24august 11/13
OIL #$ WT crude weekly 9iew
"earish acceleration after 2 do@i weeks: .5$ target has been met but !artley fibonacci patternsays lower and the trendline from the 200 low:
aily Ciew
39ersold but the trend is lower: Ne7t support 1:+0:
4:+6(:00 good le9el to reload shorts:

8/11/2019 Weekly Chart Analysis 24August
http://slidepdf.com/reader/full/weekly-chart-analysis-24august 12/13
DAX weekly 9iew
"ullish continuation week: While #$ stock inde7es are making new highs the A is struggling
to retrace back to (0 of the decline from the )uly highs:
aily 9iew
$till looking for 2,0 and +20 ne7t

8/11/2019 Weekly Chart Analysis 24August
http://slidepdf.com/reader/full/weekly-chart-analysis-24august 13/13
S&P weekly 9iew
New high >marginal?: like to see buyers pile in when a market makes a new high; otherwise ifthe price @ust sits there its a flashing warning to get our to me:
aily 9iew
f you look left you will see the patterns seems to be that the market makes marginal new highsthen price rolls o9er and corrects before mo9ing higher:
$omething to watch out for this week as we head into Dabour ay holiday weekend:
66666666666666666