Weekly Cat Report -...
17
Aon Benfield Analytics | Impact Forecasting Risk. Reinsurance. Human Resources. Weekly Cat Report March 30, 2018
Transcript of Weekly Cat Report -...

Aon Benfield Analytics | Impact Forecasting
Risk. Reinsurance. Human Resources.
Weekly Cat Report March 30, 2018
Aon Benfield Analytics | Impact Forecasting
Weekly Cat Report 2
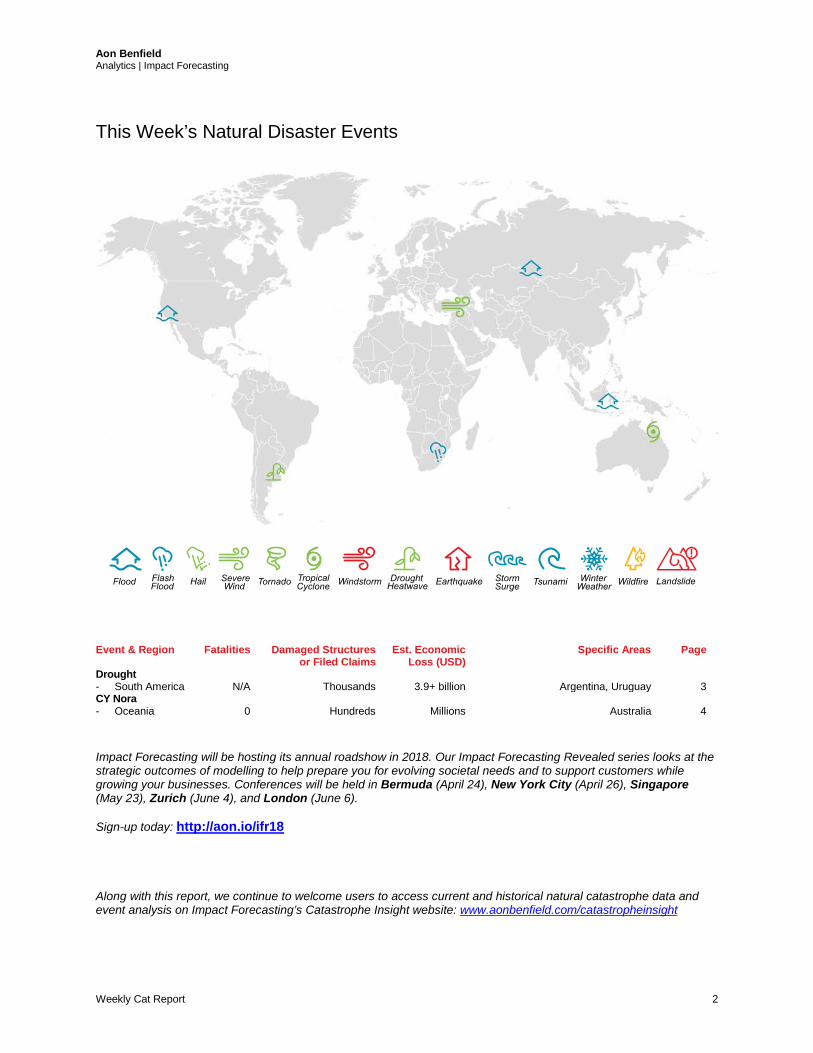
This Week’s Natural Disaster Events
Impact Forecasting will be hosting its annual roadshow in 2018. Our Impact Forecasting Revealed series looks at the strategic outcomes of modelling to help prepare you for evolving societal needs and to support customers while growing your businesses. Conferences will be held in Bermuda (April 24), New York City (April 26), Singapore (May 23), Zurich (June 4), and London (June 6). Sign-up today: http://aon.io/ifr18 Along with this report, we continue to welcome users to access current and historical natural catastrophe data and event analysis on Impact Forecasting’s Catastrophe Insight website: www.aonbenfield.com/catastropheinsight
Event & Region Fatalities Damaged Structures or Filed Claims
Est. Economic Loss (USD)
Specific Areas Page
Drought - South America
N/A
Thousands
3.9+ billion
Argentina, Uruguay
3
CY Nora - Oceania
0
Hundreds
Millions
Australia
4

Aon Benfield Analytics | Impact Forecasting
Weekly Cat Report 3
Worst drought in decades impacts parts of South America A severe lack of rainfall has led to some of the worst drought conditions in decades across parts of South America. Months of well-below normal precipitation during the summer months has had a major impact to the agricultural sector in Argentina and Uruguay. Among the worst-affected crops was soybean as seasonal harvests were poised to be reduced from 2017 totals. Combined economic damage to agriculture in the two countries was estimated by industry groups at near USD4.0 billion.
Meteorological Recap The extended drought across parts of southeast South America has been driven by a persistent blocking pattern by high pressure that has prohibited much moisture from triggering seasonal rainfall. This has led to parts of Argentina and Uruguay to receiving less than 50 percent of its average rainfall during the past 90 days. Much of the pattern can be attributed to the continuation of La Niña conditions.
While La Niña is showing signs of weakening with an expected transition back to ENSO-neutral conditions, this has yet to bring a return to more normal weather conditions in South America.
Event Details The drought was most severe in Argentina, where officials indicated it was the worst such event that the country has faced in at least 30 years. Among the hardest-hit areas included Buenos Aires, La Pampa, Cordoba, and Santiago del Estero. The tremendous lack of precipitation prompted a significant reduction in crop harvest, notably with soybeans. Several industry reports indicated that the 2018 harvest would total between 40 and 45 million metric tons. This would be nearly one-third less than initial projections made in early January, and bring the harvest in line with the previous drought in 2009. That year had a harvest of 39.9 million metric tons of soybean; a record low. Additional stress was reported to the corn crop.
A report by the Buenos Aires Grain Exchange indicated that the drought was poised to cause an economic loss of USD3.4 billion. This has forced economists to anticipate a 0.5 percent reduction in GDP.
Similar drought impacts were cited in bordering Uruguay. A severe lack of summer rainfall has led to the worst drought conditions in Uruguay since 2008/09. The government declared an agricultural emergency for the departments of Tacuarembó, Salto, Durazno, and the areas of Artigas, Paysandú, Rivera, and Río Negro. Local industry officials anticipated economic losses exceeding USD500 million.
Source: NOAA

Aon Benfield Analytics | Impact Forecasting
Weekly Cat Report 4
Cyclone Nora quickly strengthens, strikes N. Australia Cyclone Nora quickly developed into a Category 2 storm (Saffir-Simpson Scale) in the Gulf of Carpentaria before making landfall in northern Queensland in Australia. The system brought periods of heavy rainfall to several communities, prompting hundreds of distress calls by local residents due to flooding. However, the financial cost from the storm was expected to be minimal.
Event Details On March 24, Tropical Cyclone Nora made landfall in Queensland, Australia as a Category 2 cyclone (Category 3 on the local intensity scale) with maximum sustained wind speeds of 157 kph (98 mph). While over land, Nora downgraded to a tropical low while tracking southward. The slow moving system brought heavy rains to the region causing flash flooding in parts of Northern Queensland.
Minor property damage was reported in Cape York as the passage of Nora uprooted trees and power-lines. In Kowanyama, a high school and a few government buildings reportedly suffered some damage. The storm left the whole town of Pormpuraaw (about 230 buildings) without power. According to the State Emergency Service, there had been over 150 distress calls in Cairns and Port Douglas, both of which experienced flooding. Local media reported road closures in the region due to land slip, including Captain Cook Highway near Cairns and a 400m wide landslide near Port Douglas. Flash flooding also affected two caravan parks at Redlynch and Brinsmead where 42 people were rescued. There were reports of damage to trailers, caravans and personal belongings at these places. Flooding and road closures have delayed the damage assessment.
Preliminary estimates from local officials indicated that the final financial cost from Nora was likely to be minimal.
Queensland Rainfall Totals (mm) Week Ending March 28 2018
Australian Bureau of Meteorology

Aon Benfield Analytics | Impact Forecasting
Weekly Cat Report 5
Natural Catastrophes: In Brief Flooding (South Africa) Severe thunderstorms impacted eastern portions of South Africa on March 22-23, bringing significant rainfall accumulations and localized flash flooding. Multiple rivers burst their banks across the region. Seven people reportedly died in the enclaved country of Lesotho when a bus was swept off a bridge while crossing the Linakeng River. In South Africa, the worst situation was in Gauteng Province, where the highest 24-hour rainfall totals were observed; 145 millimeters (5.7 inches) were recorded in Pretoria. The South Africa Weather Service also observed 122 millimeters (4.8 inches) in Centurion. Significant traffic disruption ensued across the city of Johannesburg and parts of Pretoria. A large sinkhole damaged a portion of R55 road in Gauteng Province and dozens of bridges were closed. Urban flooding affected many streets and prompted evacuations. Financial impact of the event is yet unclear. Severe Weather (Turkey) Widespread wind-related damage occurred across Turkey on March 24 as a windstorm passed through the region from southwest. In general, the most affected region was Eastern Anatolia. Notable damage was reported in Erzurum Province, where at least 17 schools were damaged and dozens of other buildings were affected. The storms also impacted the province of Kastamonu in Northern Turkey, where the municipalities of Seydiler, Ağlı and Daday were hit the most. Strong winds blew roofs off buildings, downed trees and caused power outages. Further damage occurred in provinces Bolu, Niğde and others. Dozens of electricity poles and pylons across the country were downed. Total financial impact is yet to be determined, but the toll will likely end up in the millions USD. Further wind-related damage was also reported from Armenia and Azerbaijan. Flooding (United States) Heavy rainfall associated with a deep plume of moisture from the Pacific Ocean led to flooding and mudslides in California from March 21-22. No fatalities were reported, though the prospect of several inches of rain falling in areas with burn scars following significant wildfires in 2017 led to mandatory evacuations in Santa Barbara County. Damage was not as extensive as initially feared, though there were numerous instances of flooded structures and vehicles. Mudslides left some damage to local infrastructure. Total economic damage was estimated in the low millions (USD). Flooding (Russia) Severe flooding caused by melting snow hit the Altai Krai region of Russia this week. Ministry of Emergency Situations EMERCOM reported that 13 towns and 69 villages were flooded with over 1,224 houses affected as on March 28. According to reports from local media, two people had died and over 1600 people were evacuated from the flood affected region. The extent of damage is yet to be assessed. Flooding (Indonesia) Heavy March rainfall in Indonesia triggered flooding and landslides in several provinces of Indonesia. In West Sulawesi, major flooding on March 22 inundated 1,089 houses, injuring 7 people and affected 3,267. Flooding was also reported in East Kalimatan with emergency being declared in the city of Samarinda where over 9,300 people were affected. A landslide occurred on March 26 in Aek Manis village in Sibolga district of North Sumatra, killing 2 people, injuring 1 and severely damaging 3 houses. Flooding in Sibolga caused one more death by drowning.

Aon Benfield Analytics | Impact Forecasting
Weekly Cat Report 6
Global Temperature Anomaly Forecast
This product interprets an ensemble of 40 different numerical model forecasts to produce guidance for a probabilistic prediction of the mean surface air temperatures (2 meters above the surface). Probabilities indicate the percent of ensemble members that predict temperatures significantly above normal, near normal, or significantly below normal. Source: Climate Prediction Center

Aon Benfield Analytics | Impact Forecasting
Weekly Cat Report 7
Global Precipitation Anomaly Forecast
This product interprets an ensemble of 40 different numerical model forecasts to produce guidance for a probabilistic prediction of accumulated precipitation. Probabilities are derived from the fraction of ensemble precipitation forecasts exceeding various thresholds. Source: Climate Prediction Center
Aon Benfield Analytics | Impact Forecasting
Weekly Cat Report 8
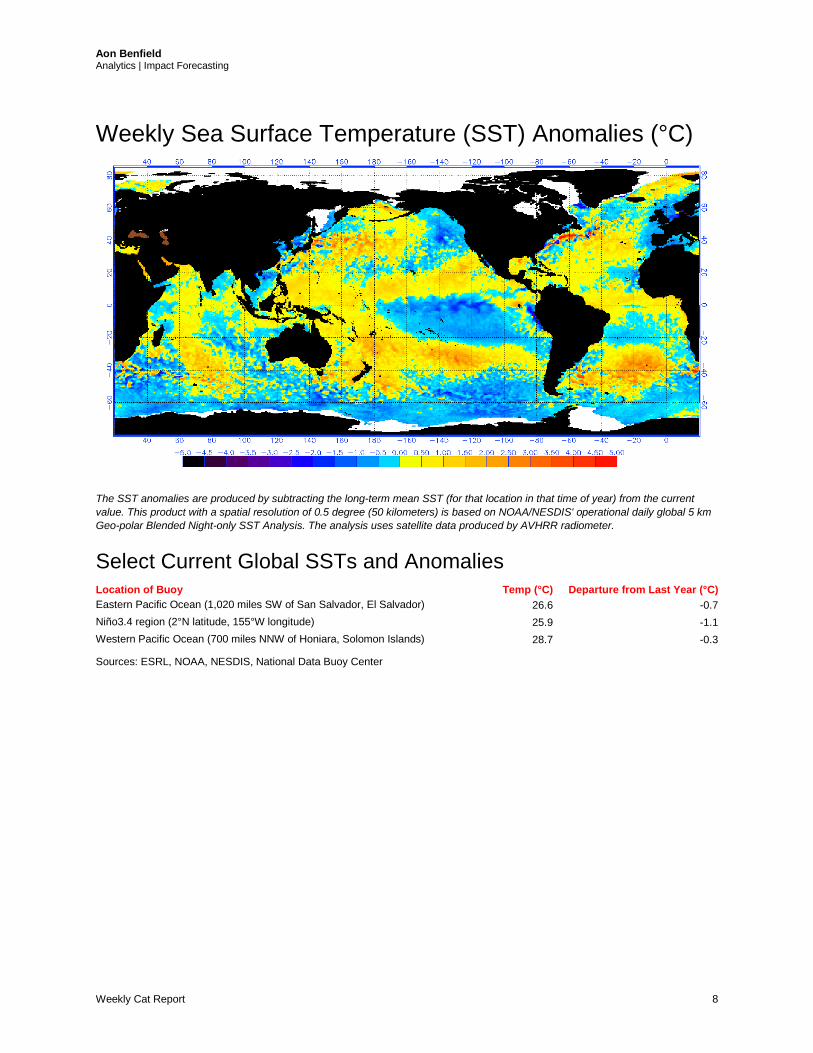
Weekly Sea Surface Temperature (SST) Anomalies (°C)
The SST anomalies are produced by subtracting the long-term mean SST (for that location in that time of year) from the current value. This product with a spatial resolution of 0.5 degree (50 kilometers) is based on NOAA/NESDIS' operational daily global 5 km Geo-polar Blended Night-only SST Analysis. The analysis uses satellite data produced by AVHRR radiometer.
Select Current Global SSTs and Anomalies Location of Buoy Temp (°C) Departure from Last Year (°C) Eastern Pacific Ocean (1,020 miles SW of San Salvador, El Salvador) 26.6 -0.7 Niño3.4 region (2°N latitude, 155°W longitude) 25.9 -1.1 Western Pacific Ocean (700 miles NNW of Honiara, Solomon Islands) 28.7 -0.3
Sources: ESRL, NOAA, NESDIS, National Data Buoy Center
Aon Benfield Analytics | Impact Forecasting
Weekly Cat Report 9
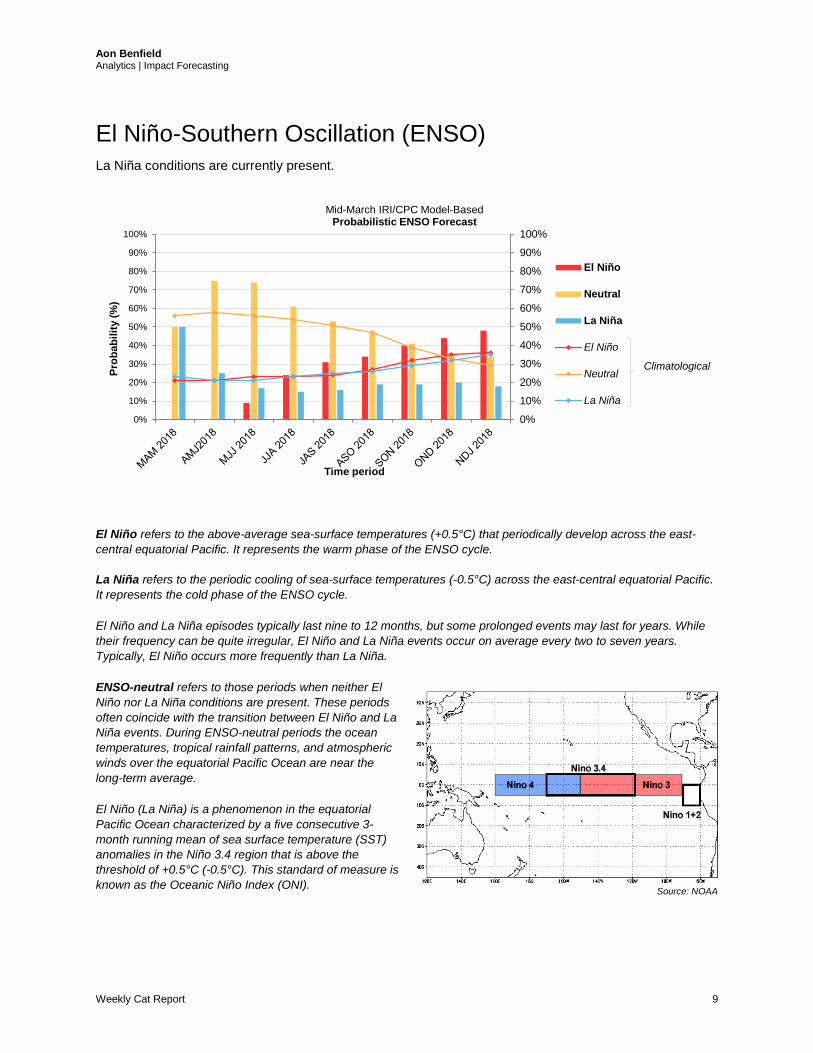
El Niño-Southern Oscillation (ENSO) La Niña conditions are currently present.
El Niño refers to the above-average sea-surface temperatures (+0.5°C) that periodically develop across the east-central equatorial Pacific. It represents the warm phase of the ENSO cycle. La Niña refers to the periodic cooling of sea-surface temperatures (-0.5°C) across the east-central equatorial Pacific. It represents the cold phase of the ENSO cycle.
El Niño and La Niña episodes typically last nine to 12 months, but some prolonged events may last for years. While their frequency can be quite irregular, El Niño and La Niña events occur on average every two to seven years. Typically, El Niño occurs more frequently than La Niña.
ENSO-neutral refers to those periods when neither El Niño nor La Niña conditions are present. These periods often coincide with the transition between El Niño and La Niña events. During ENSO-neutral periods the ocean temperatures, tropical rainfall patterns, and atmospheric winds over the equatorial Pacific Ocean are near the long-term average.
El Niño (La Niña) is a phenomenon in the equatorial Pacific Ocean characterized by a five consecutive 3-month running mean of sea surface temperature (SST) anomalies in the Niño 3.4 region that is above the threshold of +0.5°C (-0.5°C). This standard of measure is known as the Oceanic Niño Index (ONI).
0%
10%
20%
30%
40%
50%
60%
70%
80%
90%
100%
0%
10%
20%
30%
40%
50%
60%
70%
80%
90%
100%
Prob
abili
ty (%
)
Time period
Mid-March IRI/CPC Model-Based Probabilistic ENSO Forecast
El Niño
Neutral
La Niña
El Niño
Neutral
La Niña
Climatological
Source: NOAA

Aon Benfield Analytics | Impact Forecasting
Weekly Cat Report 10
Global Tropics Outlook
Source: Climate Prediction Center

Aon Benfield Analytics | Impact Forecasting
Weekly Cat Report 11
Current Tropical Systems
Location and Intensity Information
* TD = Tropical Depression, TS = Tropical Storm, HU = Hurricane, TY = Typhoon, STY = Super Typhoon, CY = Cyclone ** N = North, S = South, E = East, W = West, NW = Northwest, NE = Northeast, SE = Southeast, SW = Southwest Sources: National Hurricane Center, Joint Typhoon Warning Center
Name* Location Winds Center of Circulation Motion** TS Jelawat 15.4°N, 136.5°E 70 mph 1,175 kilometers (730 miles) SSW of Iwo To, Japan E at 6 mph

Aon Benfield Analytics | Impact Forecasting
Weekly Cat Report 12
Global Earthquake Activity (≥M4.0): March 23-29
Significant EQ Location and Magnitude (≥M6.0) Information
Source: United States Geological Survey
Date Location Magnitude Depth Epicenter 03/24/18 5.483°S 151.482°E 6.3 35.8 km 148 kilometers (92 miles) E of Kimbe, Papua New Guinea 03/24/18 45.830°S 96.099°E 6.3 10.0 km Southeast Indian Ridge 03/25/18 6.655°S 129.866°E 6.4 171.5 km 214 kilometers (133 miles) NW of Saumlaki, Indonesia 03/26/18 5.462°S 151.396°E 6.6 40.0 km 139 kilometers (86 miles) E of Kimbe, Papua New Guinea

Aon Benfield Analytics | Impact Forecasting
Weekly Cat Report 13
U.S. Weather Threat Outlook
Potential Threats Multiple cold fronts will pass through northern sections of the country during the next seven days,
leading to well below normal daytime temperatures in the northern Rockies, Plains and Midwest. Temperatures are expected to be 12 to 24 degrees below typical values for this time of year.
Heavy rainfall early next week will be possible in the Mid-Mississippi Valley. Recent heavy rainfall has led to elevated river levels in the Midwest, Southeast and Plains. Further rainfall could exacerbate the flood risk. Elsewhere, heavy precipitation is possible in the Pacific Northwest.
Well above normal temperatures are likely in Alaska as warm air wraps around the western edge of a ridge of high pressure.
Severe drought conditions persist across parts of the West, Rockies, Plains, and the Southeast.
Source: Climate Prediction Center

Aon Benfield Analytics | Impact Forecasting
Weekly Cat Report 14
Current U.S. River Flood Stage Status
Top 5 Rivers Currently Nearing or Exceeding Flood Stage
Source: United States Geological Survey
Location Flood Stage (ft) Current Stage (ft) % of Full Capacity Blanco River at Wimberley, Texas 13.00 21.28 164% Big Piney River near Big Piney, Missouri 8.50 13.74 162% Big Piney near Fort Leonard Wood, Missouri 8.00 12.08 151% Little Sugar Creek near Pineville, Missouri 6.00 8.81 147% Wabash River at Montezuma, Indiana 14.00 17.56 125%

Aon Benfield Analytics | Impact Forecasting
Weekly Cat Report 15
Source Information Worst drought in decades affects parts of South America: Estimate: Drought to shave 0.5% from GDP, The Bubble The worst drought in 30 years adds to Argentina’s economic woes, Bloomberg No change in La Nina drought grip, DTN Progressive Farmer NOAA
Cyclone Nora quickly strengthens, strikes N. Australia: Tropical Cyclone Nora crosses Queensland coast, The Australian Bureau of Meteorology, Australian Government
Natural Catastrophes: In Brief: Heavy rains, flooding cause chaos across Gauteng, Times Live Strong wind and storm in Eastern Anatolia, Haber Turk South Africa Weather Service Two Dead In Russian Region Hit By Massive Flooding, RadioFreeEurope Russia Floodlist

Aon Benfield Analytics | Impact Forecasting
Weekly Cat Report 16
Contact Information
Steve Bowen Director (Meteorologist) Aon Benfield Analytics Impact Forecasting +1.312.381.5883 [email protected] Michal Lörinc Catastrophe Analyst Aon Benfield Analytics Impact Forecasting +420.234.618.222 [email protected] Anwesha Bhattacharya Senior Analyst Aon Benfield Analytics Impact Forecasting + 91.80.6621.8575 [email protected]

Aon Benfield Analytics | Impact Forecasting
Weekly Cat Report 17
About Aon Benfield
Aon Benfield, a division of Aon plc (NYSE: AON), is the world’s leading reinsurance intermediary and full-service capital advisor. We empower our clients to better understand, manage and transfer risk through innovative solutions and personalized access to all forms of global reinsurance capital across treaty, facultative and capital markets. As a trusted advocate, we deliver local reach to the world’s markets, an unparalleled investment in innovative analytics, including catastrophe management, actuarial and rating agency advisory. Through our professionals’ expertise and experience, we advise clients in making optimal capital choices that will empower results and improve operational effectiveness for their business. With more than 80 offices in 50 countries, our worldwide client base has access to the broadest portfolio of integrated capital solutions and services. To learn how Aon Benfield helps empower results, please visit aonbenfield.com. Copyright © by Impact Forecasting® No claim to original government works. The text and graphics of this publication are provided for informational purposes only. While Impact Forecasting® has tried to provide accurate and timely information, inadvertent technical inaccuracies and typographical errors may exist, and Impact Forecasting® does not warrant that the information is accurate, complete or current. The data presented at this site is intended to convey only general information on current natural perils and must not be used to make life-or-death decisions or decisions relating to the protection of property, as the data may not be accurate. Please listen to official information sources for current storm information. This data has no official status and should not be used for emergency response decision-making under any circumstances. Cat Alerts use publicly available data from the internet and other sources. Impact Forecasting® summarizes this publicly available information for the convenience of those individuals who have contacted Impact Forecasting® and expressed an interest in natural catastrophes of various types. To find out more about Impact Forecasting or to sign up for the Cat Reports, visit Impact Forecasting’s webpage at impactforecasting.com. Copyright © by Aon plc.
All rights reserved. No part of this document may be reproduced, stored in a retrieval system, or transmitted in any form or by any means, electronic, mechanical, photocopying, recording or otherwise. Impact Forecasting® is a wholly owned subsidiary of Aon plc.


![KPS paper 20180330 Revision TC off - UZH · 2020. 8. 1. · Scale(KPS)of50. Theprimaryendpointwasin-hospitalmortality. Secondaryendpointswererateand type [Clavien-Dindo grade (CDG)]](https://static.fdocuments.in/doc/165x107/614271bdd9e4dc11f47f0e27/kps-paper-20180330-revision-tc-off-uzh-2020-8-1-scalekpsofa50-theprimaryendpointwasin-hospitalmortality.jpg)