Week 7 Targeting and Food Aid
31
FASID FASID Week 7 Targeting and Food Aid Development Issues in Africa Spring 2006
-
Upload
oscar-gordon -
Category
Documents
-
view
36 -
download
0
description
Development Issues in Africa Spring 2006. Week 7 Targeting and Food Aid. Contents. Targeting Public Transfer Self-targeting Causes of emergencies - PowerPoint PPT Presentation
Transcript of Week 7 Targeting and Food Aid

FASIDFASID
Week 7 Targeting and Food Aid
Development Issues in Africa
Spring 2006
FASIDFASID
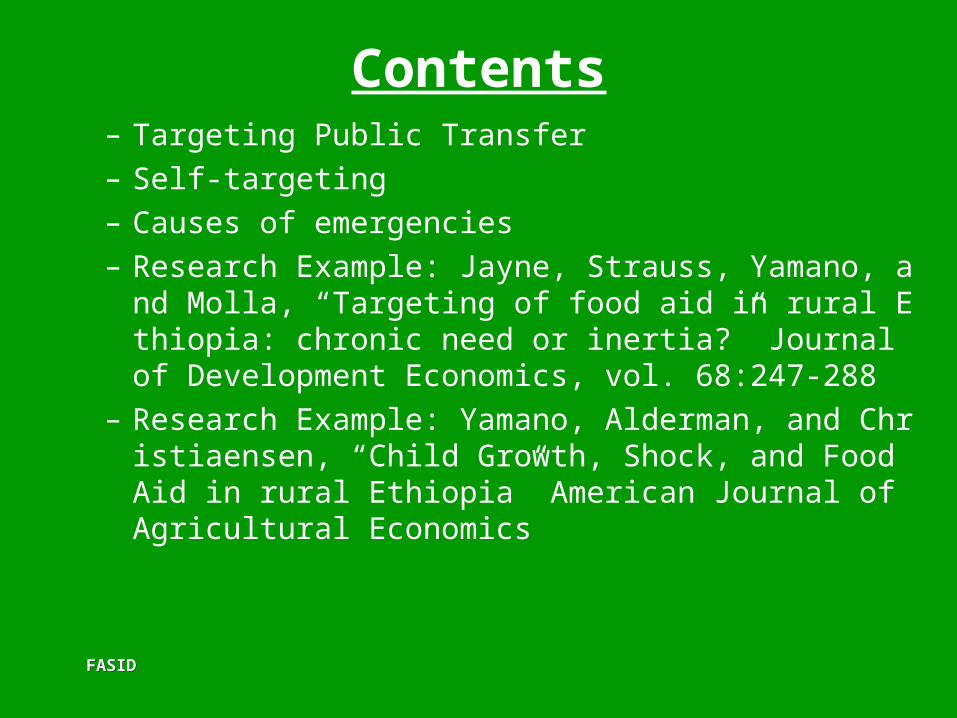
Contents– Targeting Public Transfer– Self-targeting– Causes of emergencies– Research Example: Jayne, Strauss, Yamano, and Moll
a, “Targeting of food aid in rural Ethiopia: chronic need or inertia?” Journal of Development Economics, vol. 68:247-288
– Research Example: Yamano, Alderman, and Christiaensen, “Child Growth, Shock, and Food Aid in rural Ethiopia” American Journal of Agricultural Economics
FASIDFASID
Targeting Public Transfers
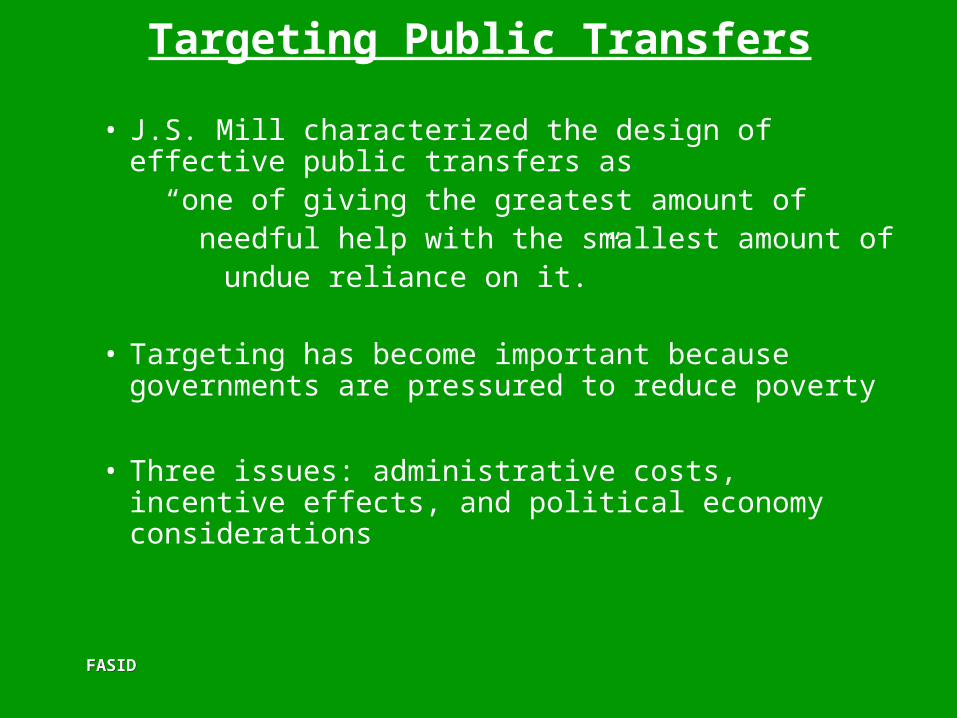
• J.S. Mill characterized the design of effective public transfers as
“one of giving the greatest amount of needful help with the smallest amount of undue reliance on it.”
• Targeting has become important because governments are pressured to reduce poverty
• Three issues: administrative costs, incentive effects, and political economy considerations
FASIDFASID
Final income
y
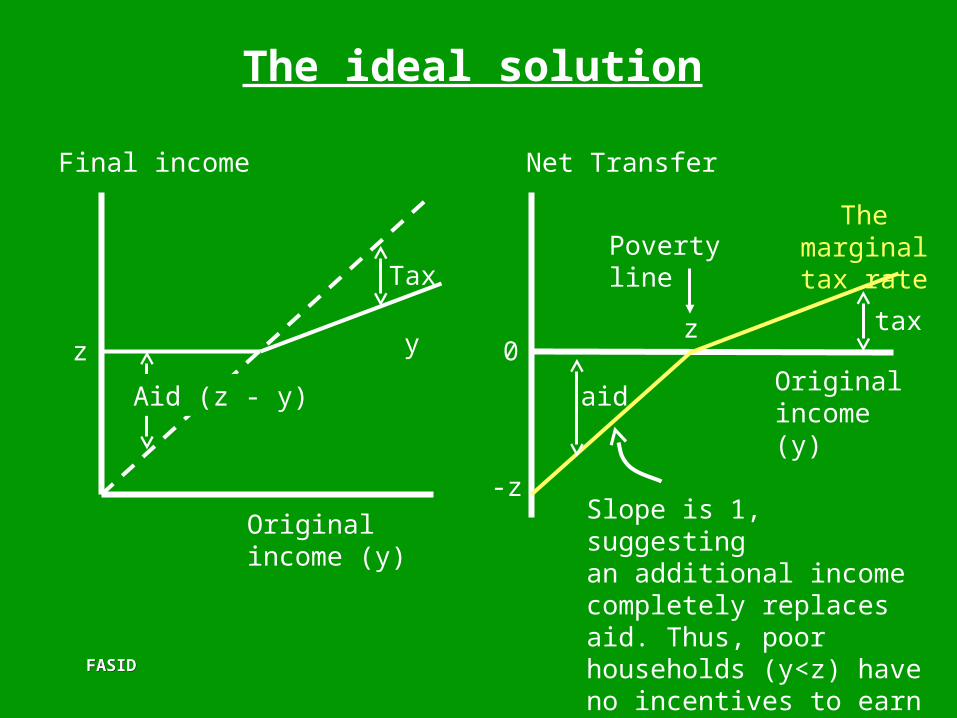
The ideal solution
z
Aid (z - y)
Tax
aid
tax
Original income (y)
Original income (y)
Net Transfer
-z
0z
Poverty lineThe marginal
tax rate
Slope is 1, suggestingan additional income completely replaces aid. Thus, poor households (y<z) have no incentives to earn income, while y <z.

FASIDFASID
Final income (y+z)
y
A uniform Transfer
zaid
tax
Original income (y)
Original income (y)
Net Transfer (z)
-z
0z
z Slope is 0, suggestingan additional income is an additional unit increase. Thus, poor households (y<z) have incentives to earn income.

FASIDFASID
Administrative costs• Targeting is not Free!• To target well, the provider needs to have good
information about potential recipients. • It is, however, costly to obtain good information about
who should be eligible and how much they should receive. R: the revenue required to implement a program
A: administrative costs NP: leakages to the non-poor P: the effective transfer to the poor
R = A + NP + P Targeting: F = P / (P + NP) The Administrative costs as a proportion of the revenues are
C = A / (A + NP + P)
C
F
10
FASIDFASID
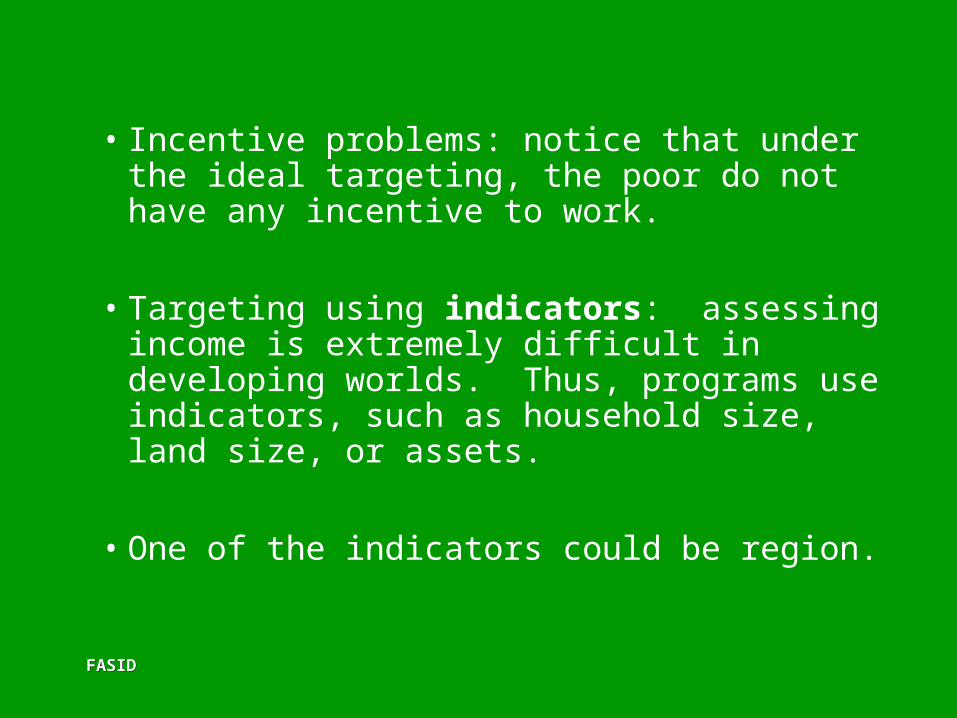
• Incentive problems: notice that under the ideal targeting, the poor do not have any incentive to work.
• Targeting using indicators: assessing income is extremely difficult in developing worlds. Thus, programs use indicators, such as household size, land size, or assets.
• One of the indicators could be region.

FASIDFASID
Regional Targeting• To reduce the targeting costs, while maintaining a certain level of
targeting, regional targeting is used:• Example: Suppose that there are two regions:
Region A: 80 percent poor, population size N Region B: 20 percent poor, population size N
• Scenario 1: Uniform distributions of aid in both regions A and B achieve 50 % targeting
• Scenario 2: Uniform distributions of aid in region A only achieve 80 % targeting
• Scenario 2: Uniform distributions of aid in region B only achieve 20 % targeting
Concentrating the distributions only in region A reduces the
administrative costs also.

FASIDFASID
Self-targeting• Workfare: a screening argument and a deterrent
argument• A screening argument: a work requirement can be
used to discourage the non-needy who have high opportunity costs
• A deterrent argument: imposing a work requirement may encourage certain kinds of behavior. Participants may invest in skill formation.
• Transfers in kind: by providing poor quality goods, the programs can select the poor who can not afford better quality goods.

FASIDFASID
Food-for-Work Program in Northern Ethiopia
FASIDFASID
Conflicts and Famine• Most of Africa’s recent famines occurred within the
context of armed conflicts (see handouts).
• Without conflicts, relief systems can prevent famines by using food aid and other means (e.g., food crisis in Southern Africa in 2002; flood in Mozambique in 2001).
• Thus, conflicts preventions and resolutions are among effective famine preventions and mitigation efforts.

FASIDFASID
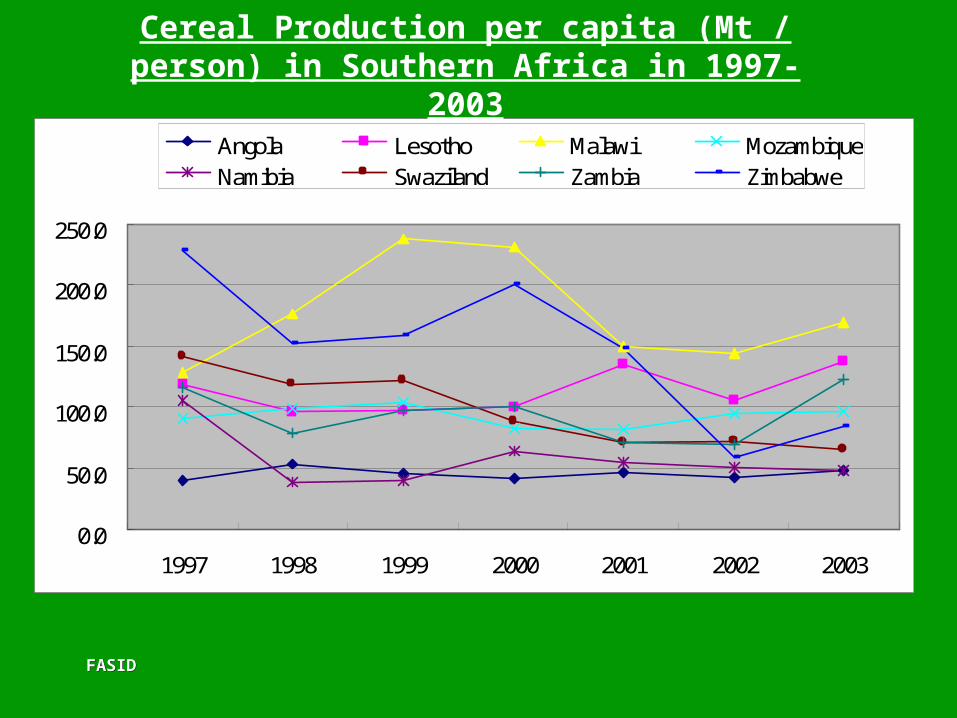
Food Aid: An Example of Food Crisis in Southern Africa
– USAID estimated that up to 14.4 million people in six southern African countries (Lesotho, Malawi, Mozambique, Swaziland, Zambia, and Zimbabwe) would need food aid between 2002 and 2003 because of droughts.
– This food crisis in Southern Africa was considered as worsened because farming system has been weakened by the HIV/AIDS epidemics.
– See handouts.– Some evidence in next slides.
FASIDFASID
0.0
50.0
100.0
150.0
200.0
250.0
1997 1998 1999 2000 2001 2002 2003
Angola Lesotho Malawi MozambiqueNamibia Swaziland Zambia Zimbabwe
Cereal Production per capita (Mt / person) in Southern Africa in 1997-2003

FASIDFASID
Food Aid per capita (Mt / person) in Southern Africa in 2000-2003
0.0
5.0
10.0
15.0
20.0
25.0
2000 2001 2002 2003
Angola Lesotho Malawi MozambiqueNamibia Swaziland Zambia Zimbabwe

FASIDFASID
0.0
50.0
100.0
150.0
200.0
250.0
2000 2001 2002 2003
Angola Lesotho Malawi MozambiqueNamibia Sqaziland Zambia Zimbabwe
Sum of crop production and Food Aid per capita in Southern Africa in 2000-2003

FASIDFASID
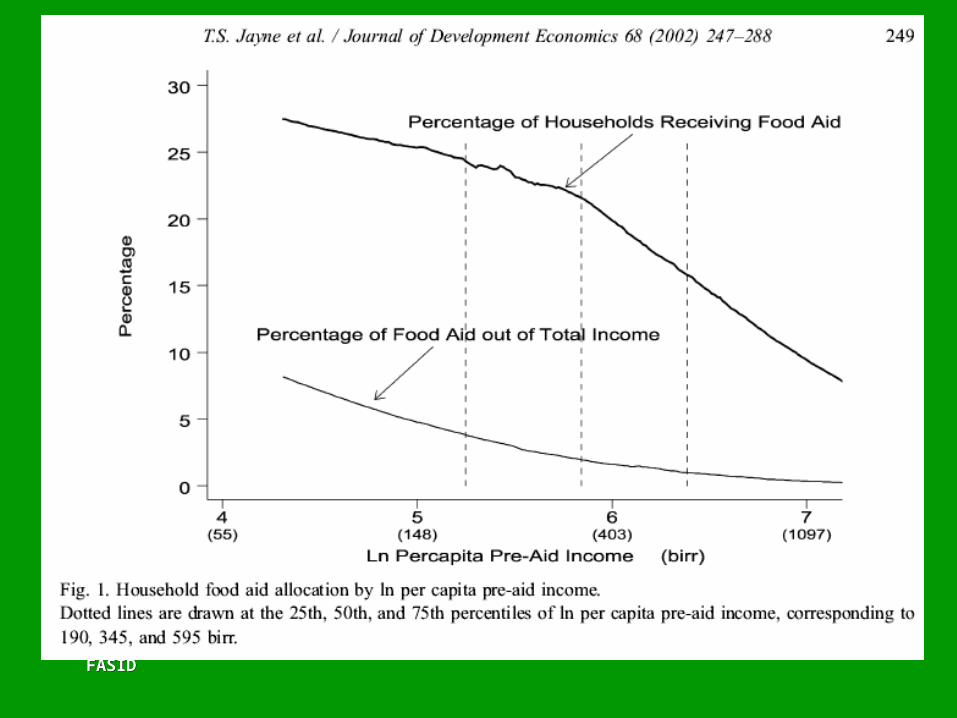
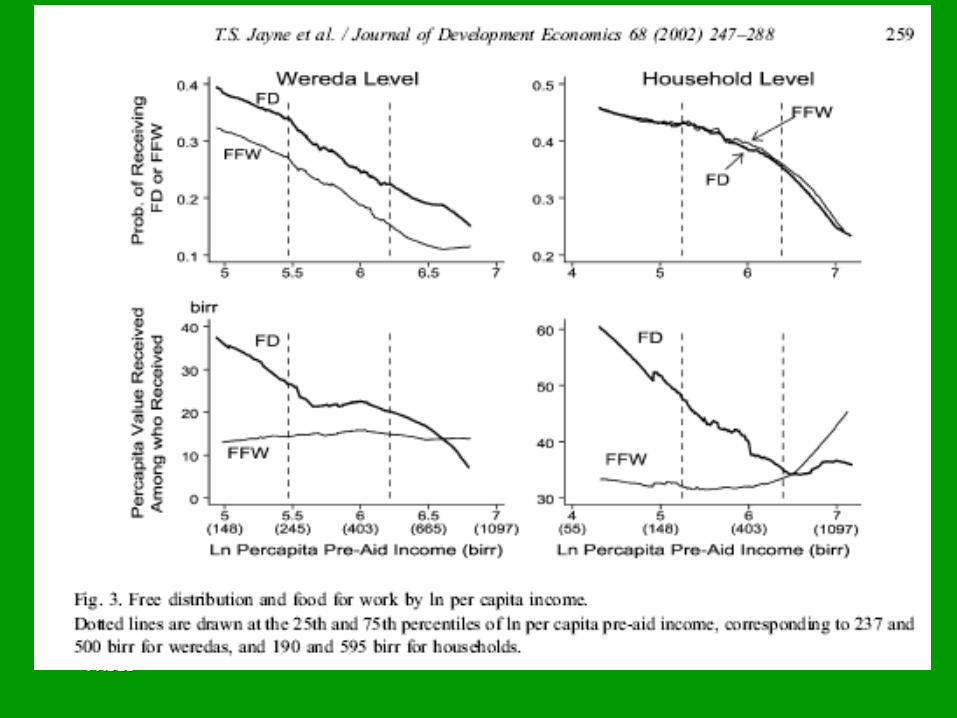
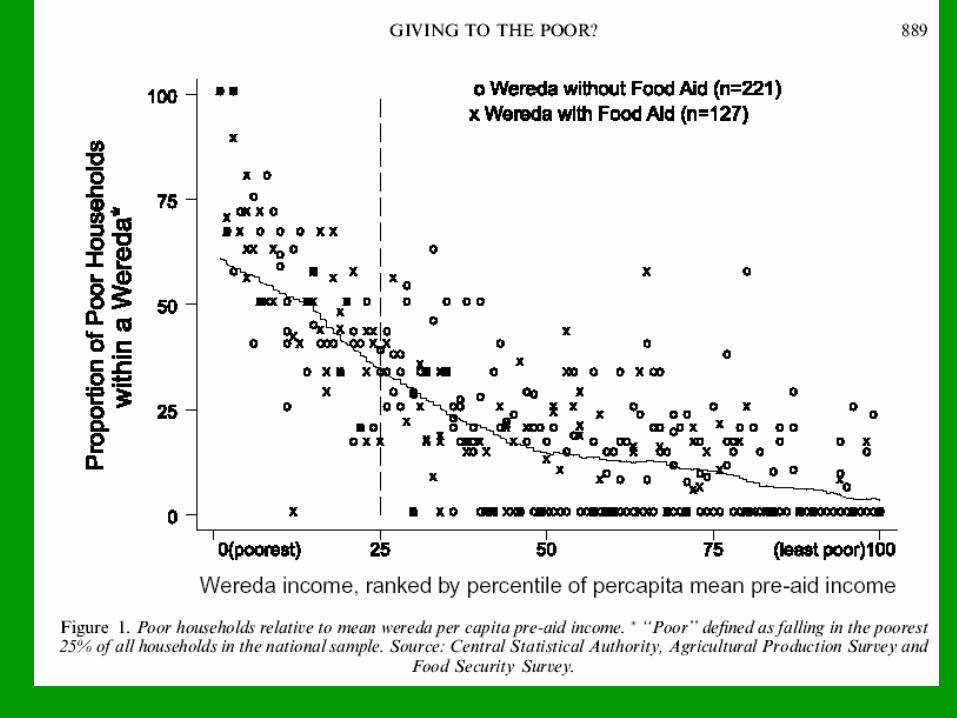
Research Example
“Targeting of food aid in rural Ethiopia: chronic need or inertia?” Journal of Development
Economics, vol. 68:247-288
• How well is food aid targeted to the poor?• Regional vs. Household targeting:
Simulation Results

FASIDFASID
05
00
10
00
Fo
od
Aid
40
00
60
00
80
00
10
00
01
20
00
Gra
in P
rod
uct
ion
1975 1980 1985 1990 1995 2000 2005Year
Grain Production Food Aid
Grain Production and Food Aid in Ethiopia
FASIDFASID
FASIDFASID
FASIDFASID

FASIDFASID
Food Aid Targeting
• Food aid is only weakly targeted to poor regions and households.
• Free Distribution is better targeted to the poor than Food For Work.
• Past food-aid reception matters: Chronic need or Inertia?
• Regional or Household Targeting?

FASIDFASID
Simulation: Various Targeting Scenarios
Targeting Scenarios
Total # of
Recipient Househol
ds
Per Capita Income Quartile
Poor Lower Middle
Upper Middle
Least Poor
Actual Targeting
570 177 180 134 79
Regional 581 245 155 116 65
Two stage A
590 259 163 114 54
Two stage B
610 279 167 113 51
Household 571 325 185 51 10
Total 2,867 717 717 717 716

FASIDFASID
Regional vs. Household Targeting
Regional Targeting: – Cost effective (information and
implementations)– But high degrees of errors
A combination of two with better targeting at both levels is recommended

FASIDFASID
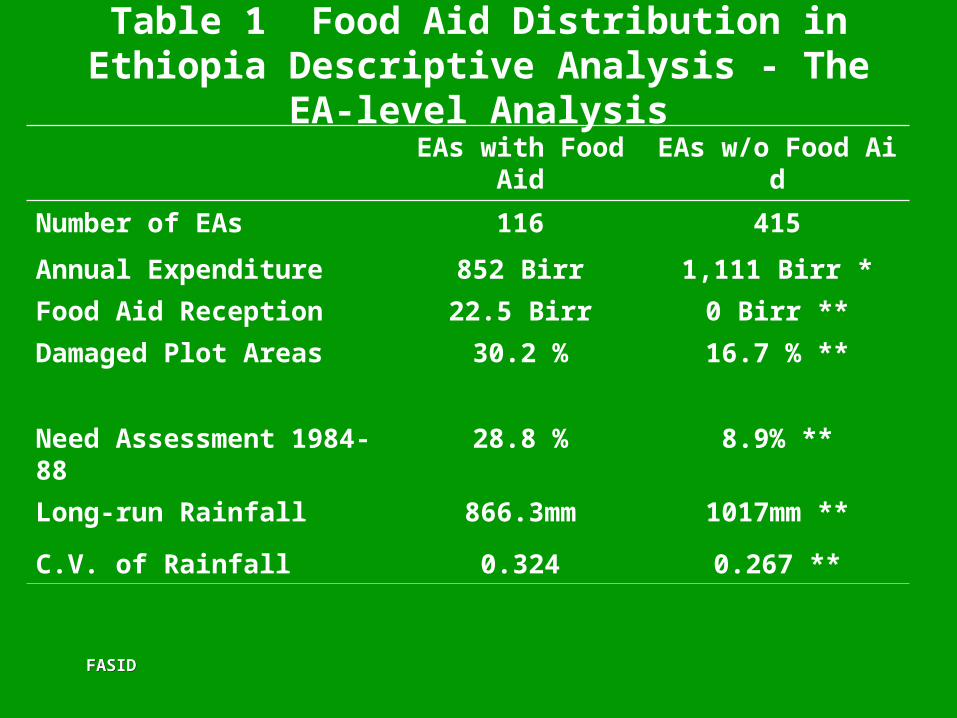
Food Aid Distribution
FASIDFASID
Table 1 Food Aid Distribution in Ethiopia Descriptive Analysis - The EA-level Analysis
EAs with Food Aid
EAs w/o Food Aid
Number of EAs 116 415
Annual Expenditure 852 Birr 1,111 Birr *
Food Aid Reception 22.5 Birr 0 Birr **
Damaged Plot Areas 30.2 % 16.7 % **
Need Assessment 1984-88 28.8 % 8.9% **
Long-run Rainfall 866.3mm 1017mm **
C.V. of Rainfall 0.324 0.267 **

FASIDFASID
Results on Food Aid Allocation (Tobit)
– Need Assessment 1984-88 Positive– C.V. of Long-run Rainfall Positive– EA-level Expenditure Negative– Peri-Urban Negative
– Damaged Plot Areas Positive
• Shocks account for only 13 percent of allocation• Inertia and long-run variables account for 87 percent
FASIDFASID
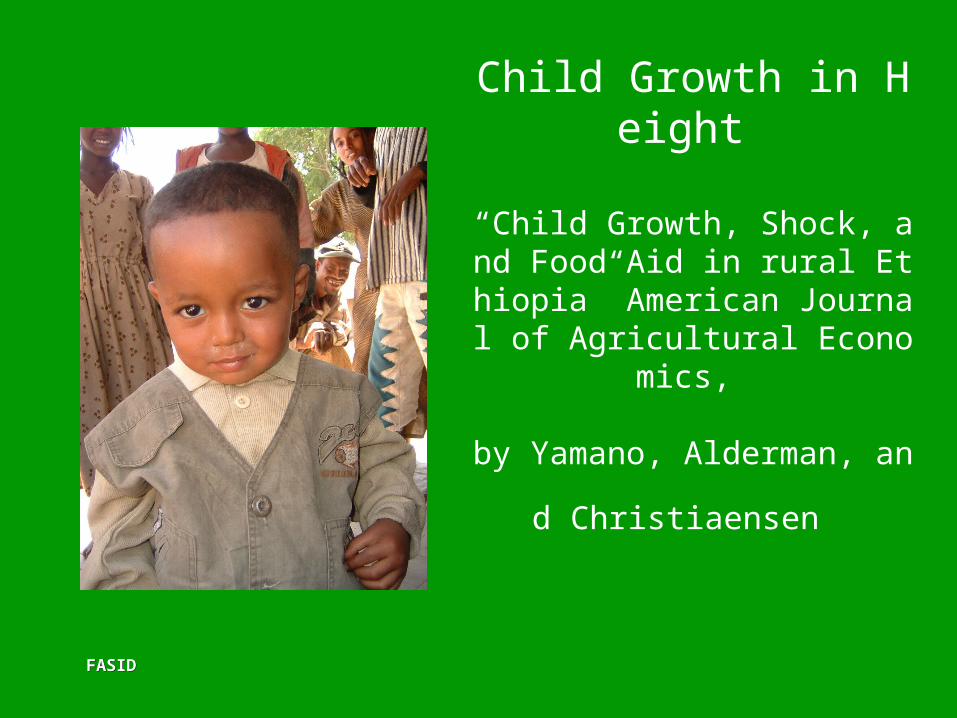
Child Growth in Height
“Child Growth, Shock, and Food Aid in rural Ethiopia” American Journal of Agricultural Economic
s,
by Yamano, Alderman, and Chri
stiaensen

FASIDFASID
Gro
wth
in H
eig
ht
(cm
)
Initial Age in Month12 24 36 48 60
4
5
6
in a
six
-mo
nth
pe
rio
d7
Without Food Aid
With Food Aid
Figure 1. Child Growth in a Six-Month Period and Food Aid

FASIDFASID
Table 5 Child Growth in Height: Children aged 6-24 months
OLS OLS IV
EA-level variables
P.C. Food Aid (Birr)A 0.028
(2.24)*
0.070
(2.23)*
Damaged Plot Areas (ratio)
-1.213
(1.84)
-1.433
(2.16)*
-1.763
(2.50)*
Child-level variables
Initial Height -0.261
(9.11)**
-0.255
(8.92)**
-0.248
(8.47)**
Female Education 0.166
(2.36)*
0.164
(2.34)*
0.161
(2.29)*
Number of children 1,083 1,083 1,083

FASIDFASID
Implications
• Plot damage has a negative impact on child growth– The average proportion of damaged plot areas in 1995/96 is
21 percent, indicating a 0.18 cm reduction (2.7%) – 50 percent >> 0.88 cm reduction (13%)
• Food aid has a positive impact on child growth– A 1.6 cm increase in a typical food-aid-receiving community
• A Simulation: 1% plot damage – 0.38 Birr more food aid, which increases growth by 0.027cm – 0.018 cm slower growth – Thus, food aid should be able to off-set the potential negative
impact of plot damage
FASIDFASID
Conclusions
• Shocks reduce child growth, especially among children aged 6 to 24 months
• Food aid has a positive impact on child growth and appears to be able to off-set the shocks
• Yet, the child stunning remains high• Further studies are needed to understand why this is the
case– Chronic factors (poor nutrition and health services)– Transitory factors (shocks and responses)