Week 4 Demand Analysis
27
Analyzing Demand gary gaumer
description
Supply and Demand
Transcript of Week 4 Demand Analysis

Analyzing Demand
gary gaumer

tonight
• Demand Analysis and Elasticity• Presentation on Makers Mark• Presentation on mCommerce in S. Korea• Quick summary of Getting Demand Data
and Forecasting

How Markets Work
• In spite of our unchanging price policy, Teavana profits begin to fall for their local mall store somewhat unexpectedly (symptom). What factors does our analysis need to rule out (make a list).
1. Reduced price of competitor 2. Increased price of complements, 3. Increased input prices (eg costs)4. Shift in demand because of other reason5. New competitor
• What if it had been stock price falling—how would this be different?

Business Problems Informed by Demand Theory and Estimation
What will happen to our revenue now that we see our main competitor cut price?
How do we know whether our reduced sales volume in 2008-10 will bounce back or not as we recover from the recession?
Can we follow the advice of our consultant who says that a price increase will lead to more revenue.
How would I measure the impact of a loyalty building program
If I sell a product into two separate market segments, how do I go about deciding whether I should sell at the same price in both?
Problem
The new budget for University X is built on assumptions that include a much higher undergraduate revenue, roughly half of which was due to higher expected undergraduate enrollment, and half due to a higher undergraduate tuition level.
What’s going on? How does this fit with what you’re learning about demand theory? When does it make sense?

Demand Relationships in Economics
• Individual Demand for Widgets by Sam• Market Demand for Widgets by all persons• Demand for ACME’s Widget product • Aggregate demand for all products by all
entities • Why all Slope Down?
Because of Substitution possibilities facing consumers (scarcity and opportunity costs) people individually and collectively will maximize their welfare by preferring to buy less of something if price goes up because they have to give up more in order to pay more. Firm demand curve’s generally flatter than market, because of competition from other firms (even more substitution possibilities). Airlines

Elasticity of Demand
• Steepness measure
• e = % change in Quantity
divided by
% change in our Price
= change in Quantity/ base Quantity
change in Price/ base Price • e = ____ for a corn farmer?

Steepness-----Elasticity measurement
• Price elasticity from a line; Q=17 – 2.3 Price
e= %change Q = Q x P = -2.3 P need a point so at that point elasticity
% change P P Q Q if P=1 Q= 14.7 = -2.3 / 14.7 = - .156
• Price elasticity from two data points
Q 26 P = 6
Q 21 P = 7
e= %change Q = Q / base Q = (26-21) / 23.5 = .213 = - 1.38
% change P P / base P (6-7 ) / 6.5 . 154
• If these were the demands for weekday golfers and weekend golfers, what strategy would we employ to increase our revenue (on our fixed
asset)


Demand Problem
• What are the Business Implications of having a steep or a flat demand curve facing the firm?
• Makers Mark Whiskey (group)
-Hess Gas Station Chain
-Chevrolet Motor Co.
• What is responsible for the steepness?

Revenue Implications of price elasticity
• Elastic (> 1.0 eg -1.3 -2.8 -25.6 )
when price falls, revenue increases
when price rises, revenue falls• Inelastic (<1.0 eg -0.15 -0.87 -0.99)
when price falls, revenue falls
when price rises, revenue rises
price
Quantity
Quantity
Peculiar situation of linear (constant slope) demand curves
Elastic region
inelastic region
Total revenue

Demand Problem spreadsheet

Measuring Shift Sensitivity---Income and Cross price Elasticity
• Income elasticity --- how much does quantity bought change when income changes
• Who cares?• % change in Q / % change in income• Normal, inferior goods• Cross price elasticity --- how much does
quantity bought change when some other price change (substitutes and complements)

Other elasticities (how much does demand change when drivers change?)
• Income elasticity % change in quantity
% change in income
If > 0 normal good, <0 an inferior good
• Cross price elasticity % change in one good’s quantity
% change in other good’s price
If > 0 substitutes , <0 complements

What price to charge?If you have control over price
• Say you’re charging $10, and some effective new competitors enter your market---- what’s going be your price response, other things constant?
• Say you’re charging $10 and your good is a normal one, and your customer’s income levels fall during a recession--- price response, other things the same?

Manipulating Demand]Advertising, Loyalty and Segmentation
• Advertising --- why do it?
• Loyalty programs--- why do it?
• Segmentation of customers--- why do it?
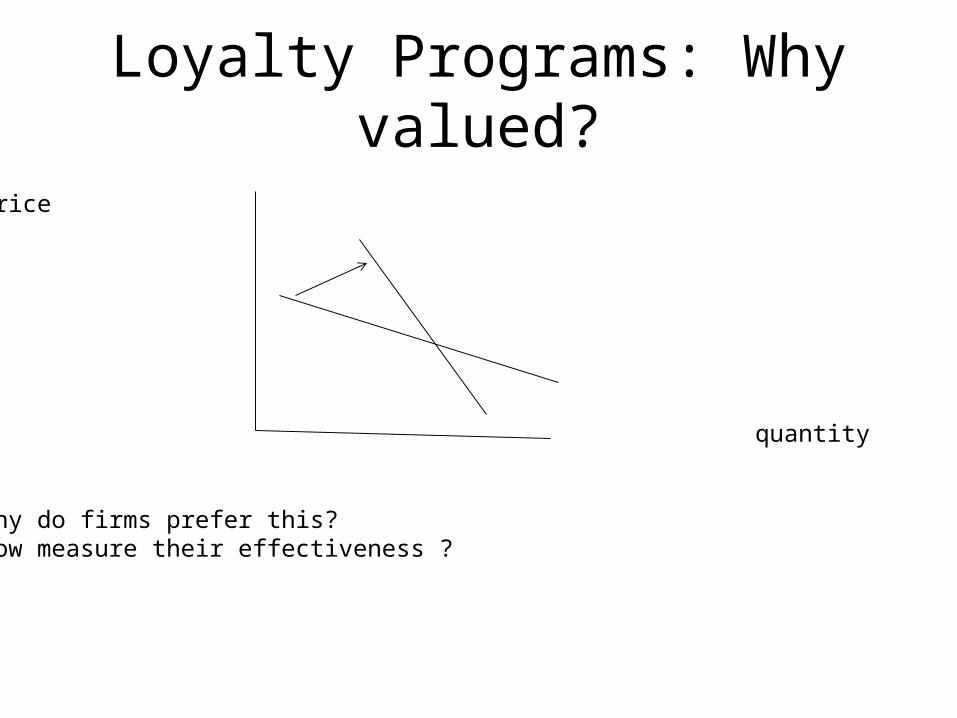
Loyalty Programs: Why valued?
Price
quantity
Why do firms prefer this?How measure their effectiveness ?

Market Segmentation• If two or more distinctive demand curves
exist, then average pricing leaves profit on the table (there should be a different optimum price in each segment)
• Why is profit greater with two or more prices? Why not charge the average to both?

What is the Explanation for the Price Increase Post Patent?

s. korea

Special Situations of Products
• Ignorance of consumers (makers mark)• Two segment pricing ?• Public goods• Merit and demerit goods• Giffin good• Demand for ‘Network products’ Dt= + f(Qt-1)
where scarcity seems to break down

Context Matters when Consumers Face Uncertainty of Result
• Limiting convenient options
-- Alexander fighting
-- Dieting Compliance• Asymmetric valuation of gains and losses
-- Overvaluing How much you save, versus how
much you spent (sales, product placement)
-- overvalue losses more than gains (risk aversion)
-- Businesses less willing to gamble with profit, than
with losses• Prospect theory and Behavioral economics
Value +
Losses gains
Value -
Asy
mmet
rical
sym
met
rical

How to get data to estimate demand sensitivity to price?
Historical data from sales records
Pilot studies with deliberate price and other variations
Focus groups using vignettes
Conjoint analysis (using CARDS to get data on preferences re product attributes, including price
Commissioned opinions and industry data collected by “consultants”

Regression to get Equations from Data
0 5 10 15 20 25 30 35 40 45 500
2
4
6
8
10
12
Series1
Q = 44.5 - 3.91 Price
quantity price SUMMARY OUTPUT
5 10
9 9 Regression Statistics
14 8 Multiple R 0.99554109
17 7 R Square 0.99110206
21 6Adjusted R Square 0.9901134
24 5 Standard Error 1.29490064
29 4 Observations 11
34 3
37 2
40 1
45 0
Coefficients Standard Error t Stat P-value
Intercept 44.5454545 0.73042247 60.9858763 4.3203E-13
X Variable 1 -3.90909091 0.12346393 -31.6618047 1.5352E-10
Best fitting straight line through a scatter plot
Excel method Data data analysis regression dependent vrbl series independent vrble series (multiple)
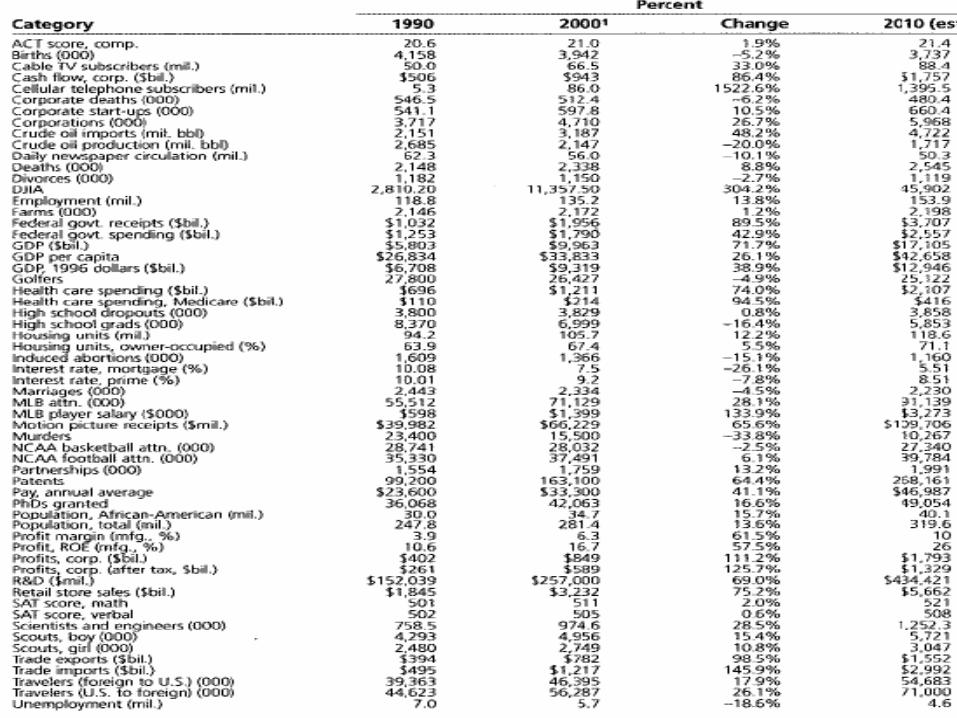
Demand data

Forecasting
• Projection (Time Series)• Analytic
• What’s Management Need the Most
• Time series PDF