

Webinar Series: Manufacturing Opportunities in Clean ... · 2/27/2013 · Improve planning and...
64
www.theCEMC.com Webinar Series: Manufacturing Opportunities in Clean Energy Markets Solar Industry Domestic Supply Chain Opportunities (PV)
Transcript of Webinar Series: Manufacturing Opportunities in Clean ... · 2/27/2013 · Improve planning and...

www.theCEMC.com
Webinar Series: Manufacturing
Opportunities in Clean Energy
MarketsSolar Industry Domestic Supply
Chain Opportunities (PV)
www.theCEMC.com
Agenda
• Introduction– Jacques Koppel, CEMC Director
• Solar Energy Industry in the U.S.– Alexander Winn, The Solar Foundation
• U.S. Department of Energy and Solar– Doug Hall, US DOE SunShot Initiative’s
Photovoltaic Manufacturing Initiative
• Solar Manufacturing Resources– Jim Haider, CEMC
– Dale Reckman, CEMC
• Questions and Answers – Submit using Chat
• Goal is to help MEP Centers provide their clients supply
chain opportunities in the clean energy manufacturing
economy to support growth & diversification strategies
• Services have expanded beyond wind sector to include
off-shore wind, solar, advanced transportation, natural
gas and geothermal markets.
• We offer market expertise that helps both the MEP
center/clients identify services/next steps needed to
approach the clean energy market with a higher
assurance of success. Our services include:
– Workshops/Webinars
– Technical assessments/assistance
www.theCEMC.com
For info contact [email protected] or call 612 466.4506

www.theCEMC.com
Webinar ScheduleJanuary 23rd
Offshore Wind Manufacturing Opportunities
February 27th
Solar Industry Domestic Supply Chain Opportunities (PV)
March 27th
U.S. Department of Energy Clean Energy Manufacturing Initiatives
April 24th
Manufacturing Opportunities in Mass Transit
May 22nd
Exploring Growth Opportunities in the Natural Gas Industry
June 26th
Financing Growth in Clean Energy Manufacturing
July 24th
Batteries for Electrical Energy Storage in Transportation
August 28th
Geothermal Market and Manufacturing Opportunities
September 25th
Utility-Scale Wind Manufacturing – State of the Market
*View archived webinars at
www.thecemc.com under “Latest News”

www.theCEMC.com
Alexander Winn
The Solar Foundation

Solar Industry Domestic Supply Chain Opportunities –
Market Overview
About The Solar Foundation
Founded in 1977 and based in Washington, DC, The Solar Foundation is an independent nonprofit working to demonstrate the global benefits of solar energy through research and education.
National Solar Jobs Census & SunShot Solar Outreach Partnership Resources: http://www.thesolarfoundation.org
8
� Increase installed capacity of solar in U.S. communities
� Streamline and standardize permitting and interconnection processes
� Improve planning and zoning codes/regulations for solar technologies
� Increase access to solar financing options
� Provide complimentary technical assistance
About the SunShot Solar Outreach Partnership
9

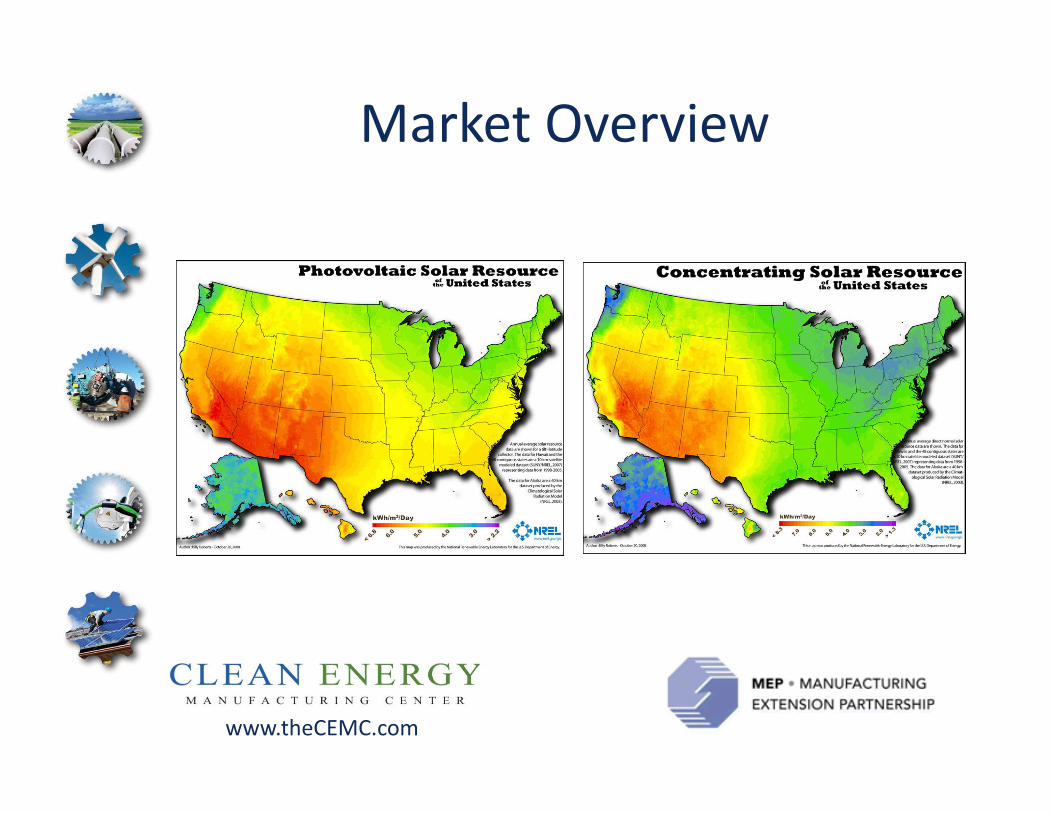
Fact: Solar works across the US
Source: National Renewable Energy Laboratory 10

Fact: The solar industry is growing
Source: Solar Energy Industries Association/ GTM Research. Solar Market Insight: 2011 Year-in-Review, 2012 Q1, 2012 Q2, & 2012 Q3
11
0
500
1000
1500
2000
2500
3000
3500
4000
2006 2007 2008 2009 2010 2011 2012
Inst
all
ed
Ca
pa
city
(M
W)
New U.S. Solar Electric Installations
Annual Q1 Q2 Projected

Fact: The solar workforce is growing
Source: The Solar Foundation, National Solar jobs Census 2012 (November 2012) 12
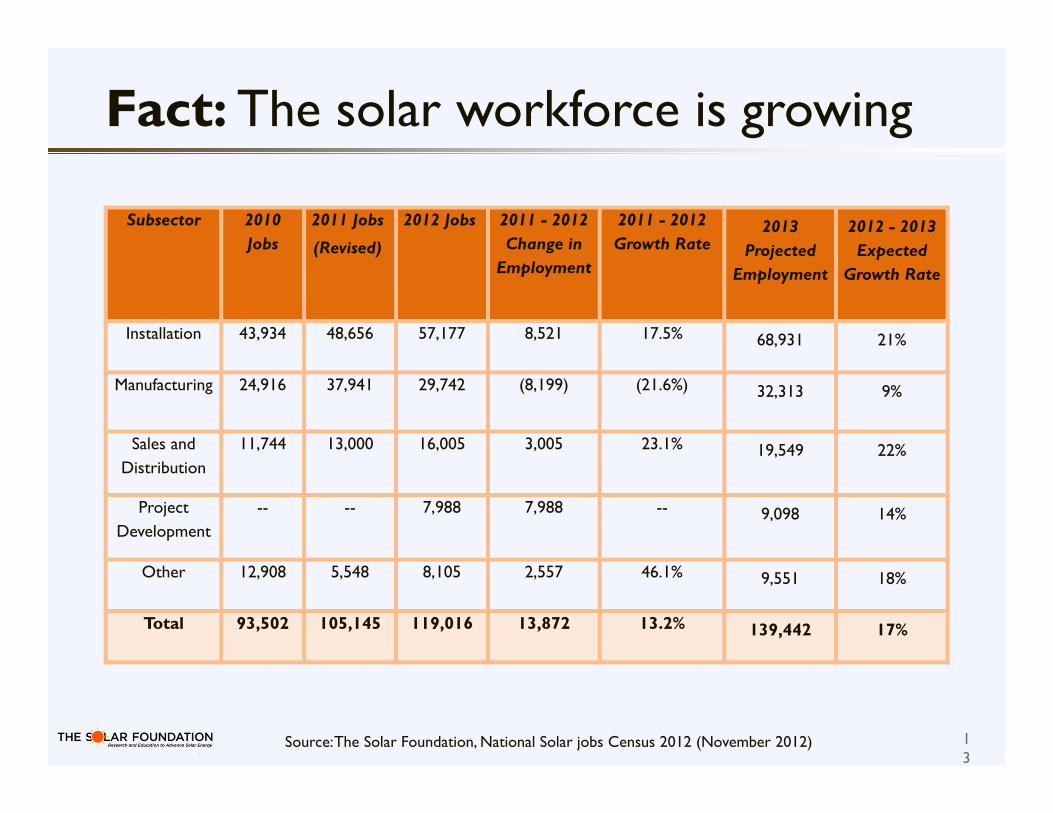
Fact: The solar workforce is growing
Source: The Solar Foundation, National Solar jobs Census 2012 (November 2012) 13
Subsector 2010
Jobs
2011 Jobs
(Revised)
2012 Jobs 2011 - 2012
Change in
Employment
2011 - 2012
Growth Rate2013
Projected
Employment
2012 - 2013
Expected
Growth Rate
Installation 43,934 48,656 57,177 8,521 17.5% 68,931 21%
Manufacturing 24,916 37,941 29,742 (8,199) (21.6%) 32,313 9%
Sales and
Distribution
11,744 13,000 16,005 3,005 23.1% 19,549 22%
Project
Development
-- -- 7,988 7,988 -- 9,098 14%
Other 12,908 5,548 8,105 2,557 46.1% 9,551 18%
Total 93,502 105,145 119,016 13,872 13.2% 139,442 17%

Fact: The cost of solar is falling
Source: Solar Energy Industries Association/ GTM Research. Solar Market Insight: 2011 Year-in-Review, 2012 Q1, 2012 Q2, & 2012 Q3
$0.00
$1.00
$2.00
$3.00
$4.00
$5.00
$6.00
$7.00
$8.00
Q1 2010 Q2 2010 Q3 2010 Q4 2010 Q1 2011 Q2 2011 Q3 2011 Q4 2011 Q1 2012 Q2 2012 Q3 2012
Inst
all
ed
Pri
ce (
$/W
DC)
Residential Commerical Utility
↓ 44%
14
AVERAGE
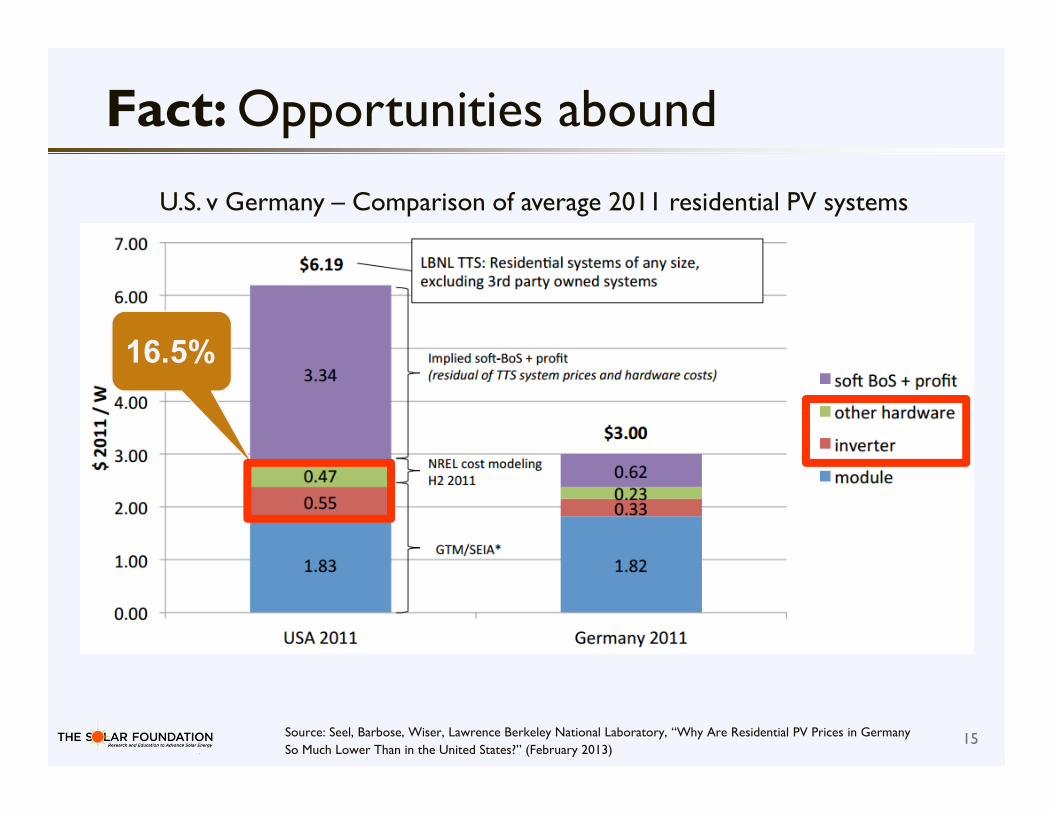
Fact: Opportunities abound
Source: Seel, Barbose, Wiser, Lawrence Berkeley National Laboratory, “Why Are Residential PV Prices in Germany
So Much Lower Than in the United States?” (February 2013)
↓ 25%
15
16.5%
U.S. v Germany – Comparison of average 2011 residential PV systems

Fact: Opportunities abound
Source: Seel, Barbose, Wiser, Lawrence Berkeley National Laboratory, “Why Are Residential PV Prices in Germany
So Much Lower Than in the United States?” (February 2013)
↓ 25%
16
16.5%
� Think about the whole system:
– Power electronics:
• Inverters
• Wiring
– Metal Racking (Other materials?)
– PV-grade glass
– Glass coatings
– Feedstcok
– Transportation

www.theCEMC.com
Doug Hall
US Department of Energy
SunShot Initiative’s Photovoltaic
Manufacturing Initiative

US DOE’s SunShot InitiativeCEMC Webinar
Doug HallPhotovoltaic Manufacturing Initiative Portfolio Manager
February 27, 2013
19

“We’re telling America’s scientists and engineers that if they assemble teams of the best minds in their fields, and focus on the hardest problems in clean energy, we’ll fund the Apollo projects of our time.”
- President Obama
2011 State of the Union

“Apollo project of our times”
SunShotMoon Shot
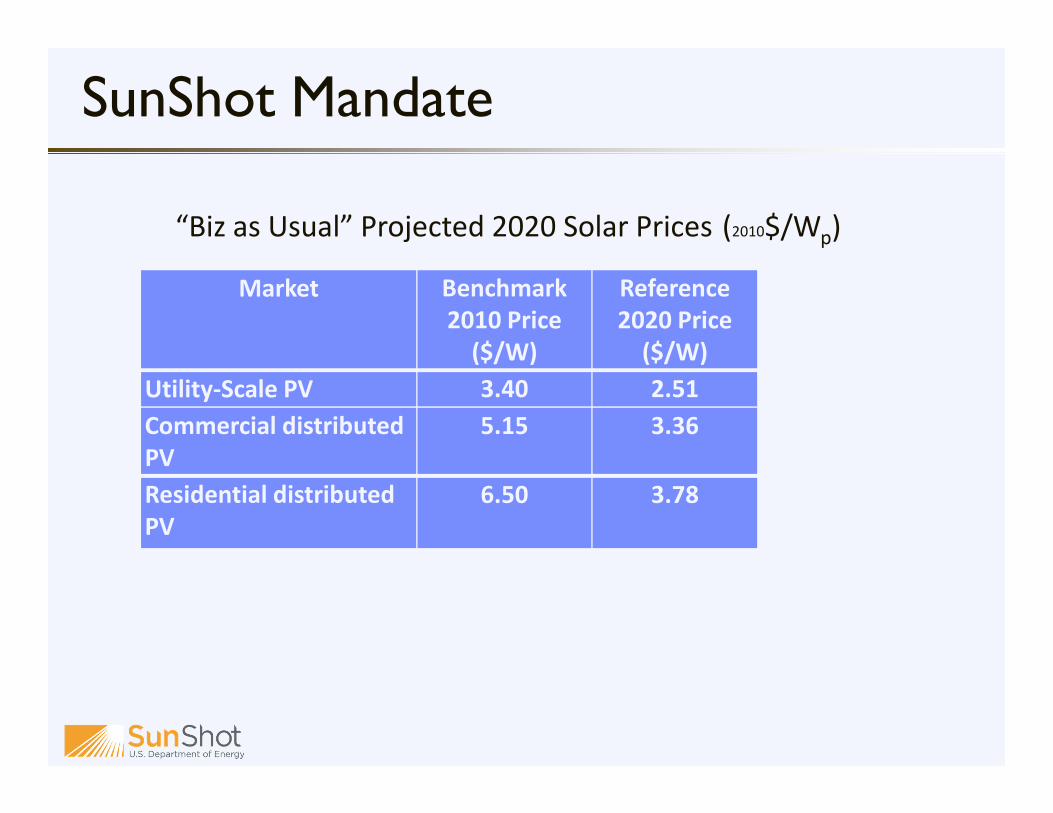
Market Benchmark
2010 Price
($/W)
Reference
2020 Price
($/W)
Utility-Scale PV 3.40 2.51
Commercial distributed
PV
5.15 3.36
Residential distributed
PV
6.50 3.78
“Biz as Usual” Projected 2020 Solar Prices (2010$/Wp)
SunShot Mandate

2030 Utility Scale PV Base Case
OR
ID
NV
MT ND
SD
NE
WY
UT
NM AR
MS
AZSC
OK
KS
ME
WA
CA CO
TX
MO
IL
IA
MN
WI
MI
OH
KY
TN
AL GA
VA
NY
PA
LA
NC
IN
Installed PV (GW)
< 0.1
0.1 - 1
1 - 5
5 - 10
10 - 20
20 - 30
> 30
OR
ID
NV
MT ND
SD
NE
WY
UT
NM AR
MS
AZ OK
KS
ME
WA
CA CO
TX
MO
IL
IA
MN
WI
MI
OH
KY
TN
AL GA
VA
NY
PA
LA
NC
IN
Installed Capacity: 30 GW
1.5% of electrical demand
modeled with Regional Energy Deployment System (ReEDS)
capacity-expansion model

SunShot Mandate
Market Benchmark
2010 Price
($/W)
Reference
2020 Price
($/W)
SunShot
2020 Price
($/W)
Utility-Scale PV 3.40 2.51 1.00
Commercial distributed
PV
5.15 3.36 1.25
Residential distributed
PV
6.50 3.78 1.50
SunShot Target 2020 Solar Prices (2010$/Wp)

WV
MD
NJ
CT
RI
MA
FLFL
VTVT NHNH
2030 Utility Scale PV with SunShot
OR
ID
NV
MT ND
SD
NE
WY
UT
NM AR
MS
AZSC
OK
KS
ME
DE
WA
CA CO
TX
MO
IL
IA
MN
WI
MI
OH
KY
TN
AL GA
VA
NY
PA
LA
NC
IN
Installed PV (GW)
< 0.1
0.1 - 1
1 - 5
5 - 10
10 - 20
20 - 30
> 30
OR
ID
NV
MT ND
SD
NE
WY
UT
NM AR
MS
AZSC
OK
KS
ME
WV
WA
CA CO
TX
MO
IL
IA
MN
WI
MI
OH
KY
TN
AL GA
VA
NY
PA
LA
MD
NC
IN
CT
RI
NJ
MA
DE
Installed Capacity: 302 GW
14% of electrical demand

Utility System with $1/W Price Goal
Estimates do not include the cost of land.
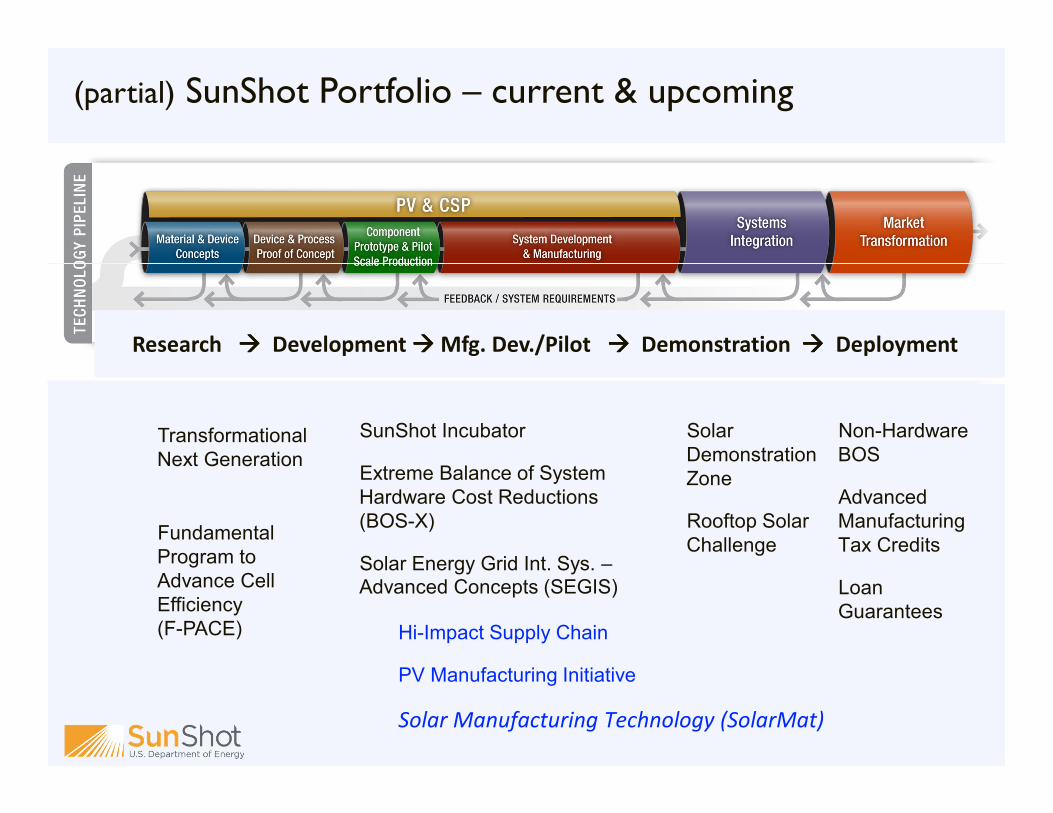
(partial) SunShot Portfolio – current & upcoming
Transformational
Next Generation
Fundamental
Program to
Advance Cell
Efficiency
(F-PACE)
SunShot Incubator
Extreme Balance of System
Hardware Cost Reductions
(BOS-X)
Solar Energy Grid Int. Sys. –Advanced Concepts (SEGIS)
Solar
Demonstration
Zone
Rooftop Solar
Challenge
Non-Hardware
BOS
Advanced
Manufacturing
Tax Credits
Loan
Guarantees
Research ���� Development ���� Mfg. Dev./Pilot ���� Demonstration ���� Deployment
Hi-Impact Supply Chain
PV Manufacturing Initiative
Solar Manufacturing Technology (SolarMat)
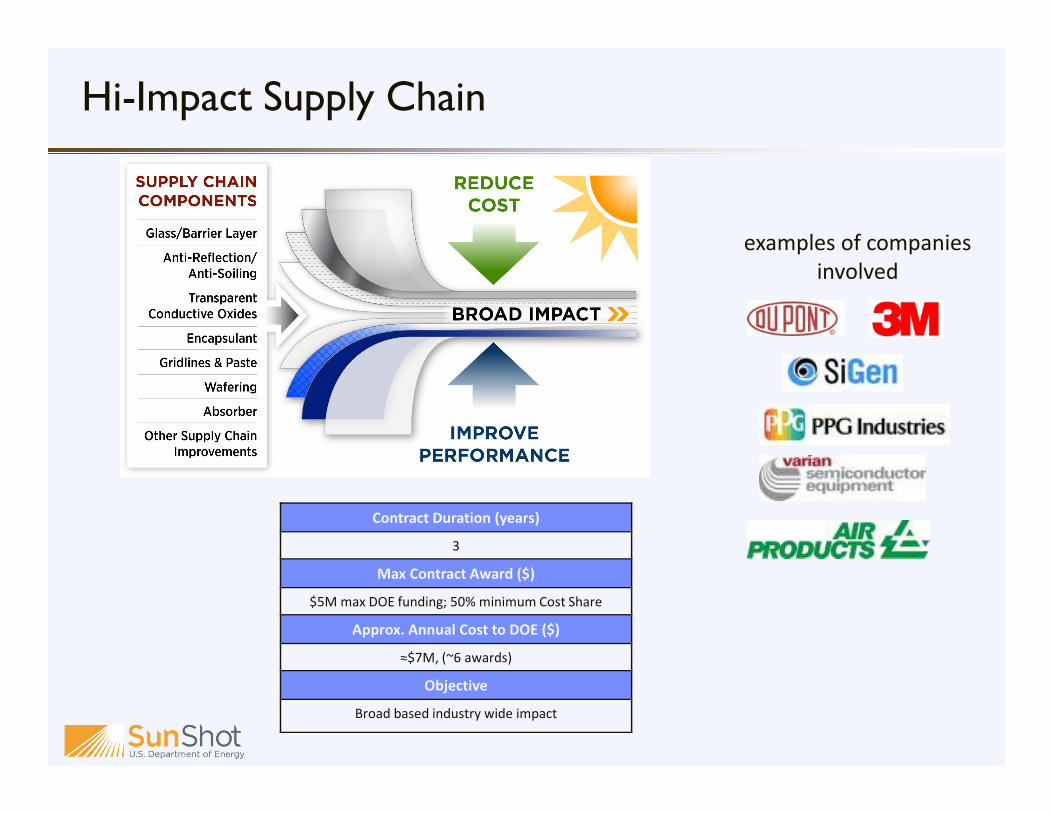
Hi-Impact Supply Chain
Contract Duration (years)
3
Max Contract Award ($)
$5M max DOE funding; 50% minimum Cost Share
Approx. Annual Cost to DOE ($)
≈$7M, (~6 awards)
Objective
Broad based industry wide impact
Sample Awardees
examples of companies
involved

PV Manufacturing Initiative Projects
US PV Manufacturing Consortium (PVMC)
Industry Consortium (modeled after SEMATECH)
Thin-Film Manufacturing Development Facility
Component, BOS, and System Reliability Testing
Volume Manufacturing Best Practices
Solar Rochester
c-Si Manufacturing Development Facility
Bay Area PV Consortium (BAPVC)
Industry-directed University research

� Development and demonstration of innovative, but commercially and technically viable, manufacturing technology that can achieve a significant market or manufacturing impact in 1 to 4 years.
� Must drive down the cost of manufacturing and/or implementing efficiency-increasing technology in manufacturing
� Addresses both PV and Concentrated Solar Power areas of solar technology
– CSP Topic Area must be for a hardware demonstration of manufacturing technologies and methodologies that reduce the solar field costs
– PV Topic Area must achieve significant demonstrated cost reductions in module, supply chain (tools and BOM), or BOS
Solar Manufacturing Technology (SolarMat)Funding Opportunity released 2/22/2013
Contract Duration (years)
2-4
Contract Award ($)
$5M max DOE funds, 50% minimum Cost Share
Approx. Annual Cost to DOE ($)
≈5 M
Objective
Move next generation manufacturing technology into
US factories

� SunShot homepage– http://eere1.energy.gov/solar/sunshot/index.html
� Financial Opportunities page– http://eere1.energy.gov/solar/sunshot/financial.html
� Current Opportunities page– http://eere1.energy.gov/solar/sunshot/fcurrent_opportunities.html
� also
� US DOE SBIR� http://science.energy.gov/sbir/funding-opportunities/
Information about SunShot and SunShot Funding Opportunities
31

www.theCEMC.com
Jim Haider and Dale Reckman
CEMC Energy Specialists

www.theCEMC.com
Solar Manufacturing Resources
Tools developed for the Solar
Industry by the Clean Energy
Manufacturing Center
www.theCEMC.com
The Goal of Our Work
To educate manufacturers, suppliers, MEP’s and other on clean
energy manufacturing opportunities and the available tools to help in the successful
diversification into these often times challenging market sectors.

www.theCEMC.com
The NIST MEP Program in Short
• Program started in 1988, with at least one center in all
50 states by 1996
• 59 centers with over 370 field locations
• System wide, Non-Federal staff is over 1,450
• Contracting with over 2,190 third party service providers
• Partnership Model –Federal/State/Industry
• Emphasis on performance – program and center –
measured based upon impact of center services on
client firms
www.theCEMC.com
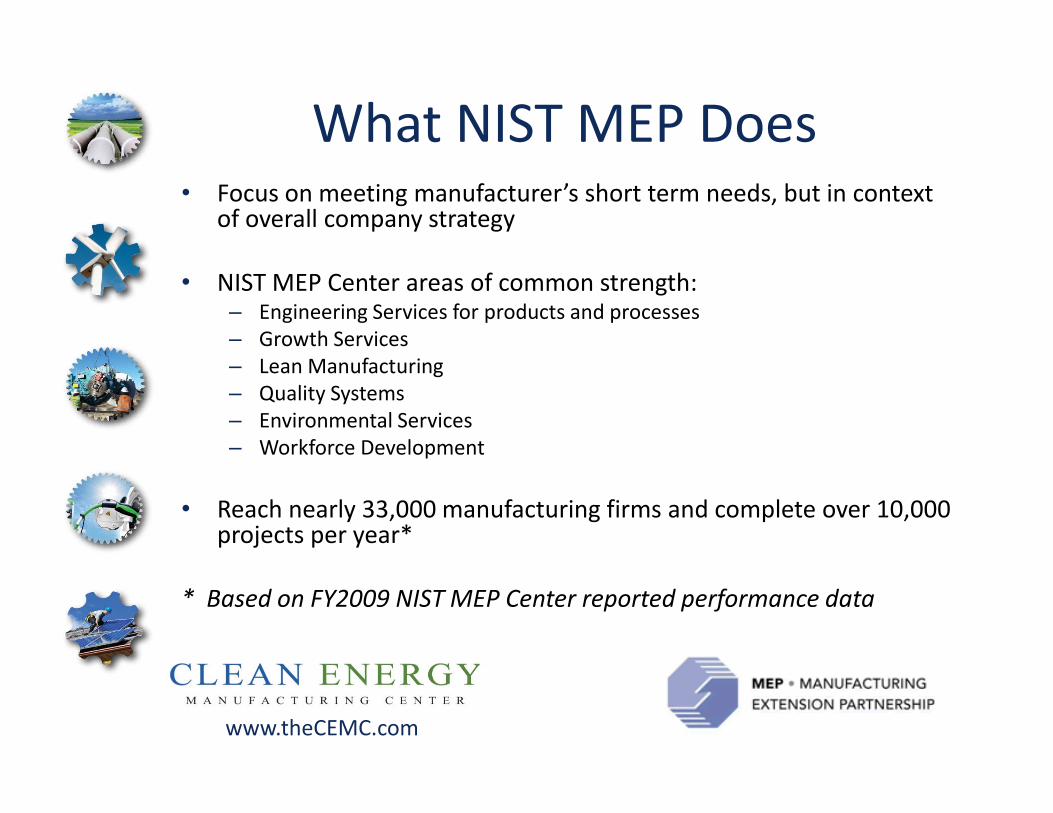
What NIST MEP Does• Focus on meeting manufacturer’s short term needs, but in context
of overall company strategy
• NIST MEP Center areas of common strength:– Engineering Services for products and processes
– Growth Services
– Lean Manufacturing
– Quality Systems
– Environmental Services
– Workforce Development
• Reach nearly 33,000 manufacturing firms and complete over 10,000 projects per year*
* Based on FY2009 NIST MEP Center reported performance data
www.theCEMC.com
Market Overview

www.theCEMC.com
Market Overview
0100020003000400050006000700080009000
10000
US PV installations (annual installations in MWdc)
US PV installations
(annual installations in
MWdc)

www.theCEMC.com
Market Overview
0
2
4
6
8
10
12
14
16
US PV global market share
US PV global market
share in %
www.theCEMC.com
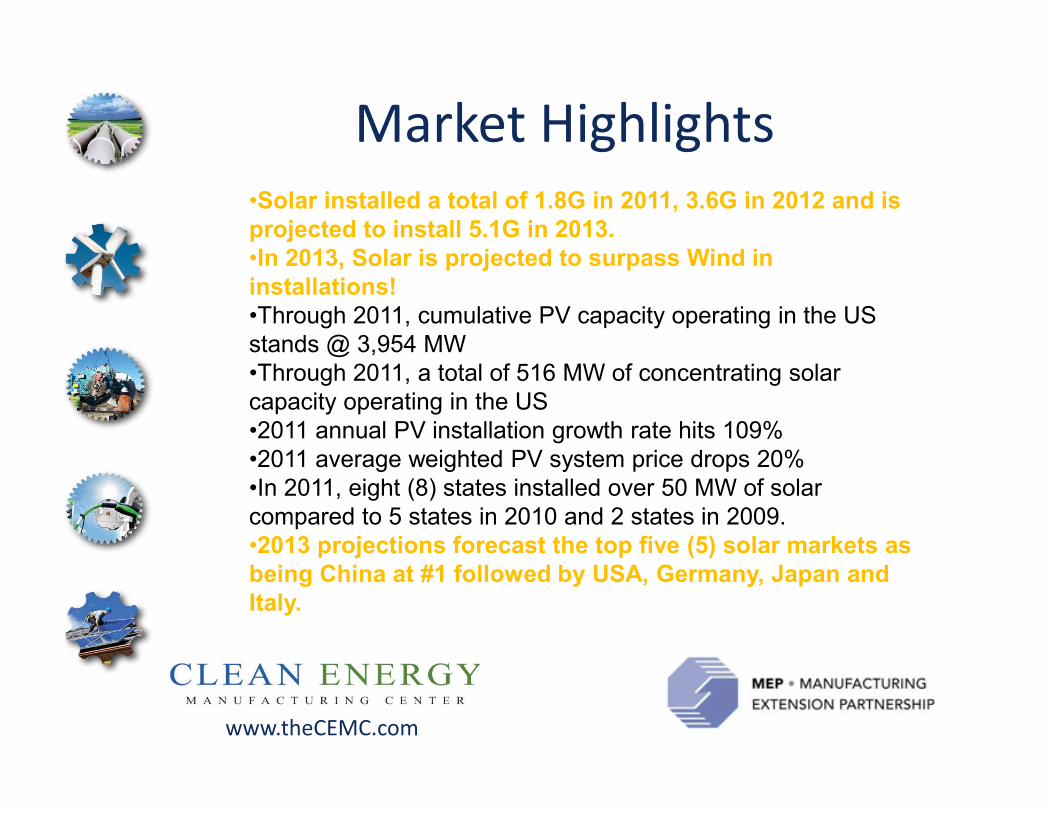
Market Highlights•Solar installed a total of 1.8G in 2011, 3.6G in 2012 and is
projected to install 5.1G in 2013.
•In 2013, Solar is projected to surpass Wind in
installations!
•Through 2011, cumulative PV capacity operating in the US
stands @ 3,954 MW
•Through 2011, a total of 516 MW of concentrating solar
capacity operating in the US
•2011 annual PV installation growth rate hits 109%
•2011 average weighted PV system price drops 20%
•In 2011, eight (8) states installed over 50 MW of solar
compared to 5 states in 2010 and 2 states in 2009.
•2013 projections forecast the top five (5) solar markets as
being China at #1 followed by USA, Germany, Japan and
Italy.
www.theCEMC.com
Unique Attributes of
Wind Industry
• Technology has matured in Wind industry
with the 1.25 – 3 MW tower mounted
turbines
• Several large European OEM’s drive the
market
• Warrantee requirements along with high
maintenance costs drive strict quality
requirements for industry

www.theCEMC.com
Solar Industry is Different
• Technology still developing
• Market is still evolving
• Suppliers and Solar companies enter and
exit the market continuously
• Cost / megawatt is still high relative to
wind

www.theCEMC.com
Market Overview
• Three (3) distinct Market Sectors
Residential – less than 10kW
Commercial – 10kW to 1MW
Utility – greater than 1MW
www.theCEMC.com
Key Industry Players(a partial list)
• Acciona
• Iberdrola
• ABB
• GE
• Ingeteam
• 3M
• Bosch
• Jinko Solar
• MAGE solar
• Mitsubishi
• SolarWorld
• tenKsolar
• Westinghouse
• AREVA solar
• Panasonic
• Samsung
• Siemens
• LG
• First Solar

www.theCEMC.com
Top 15 Solar PV Module Mfrs, 2011
www.theCEMC.com
Taxonomy
• Solar warranty structures are tiered in
nature. An example might be:• Guaranteed to produce 95% rated output for 5
years +
• A Guarantee to produce 90% rated output for 12
years +
• A Guarantee to produce 80% rated output for 25
years.
The industry demands quality if to dispel the
historic stereotype of being a bit gimmicky!

www.theCEMC.com
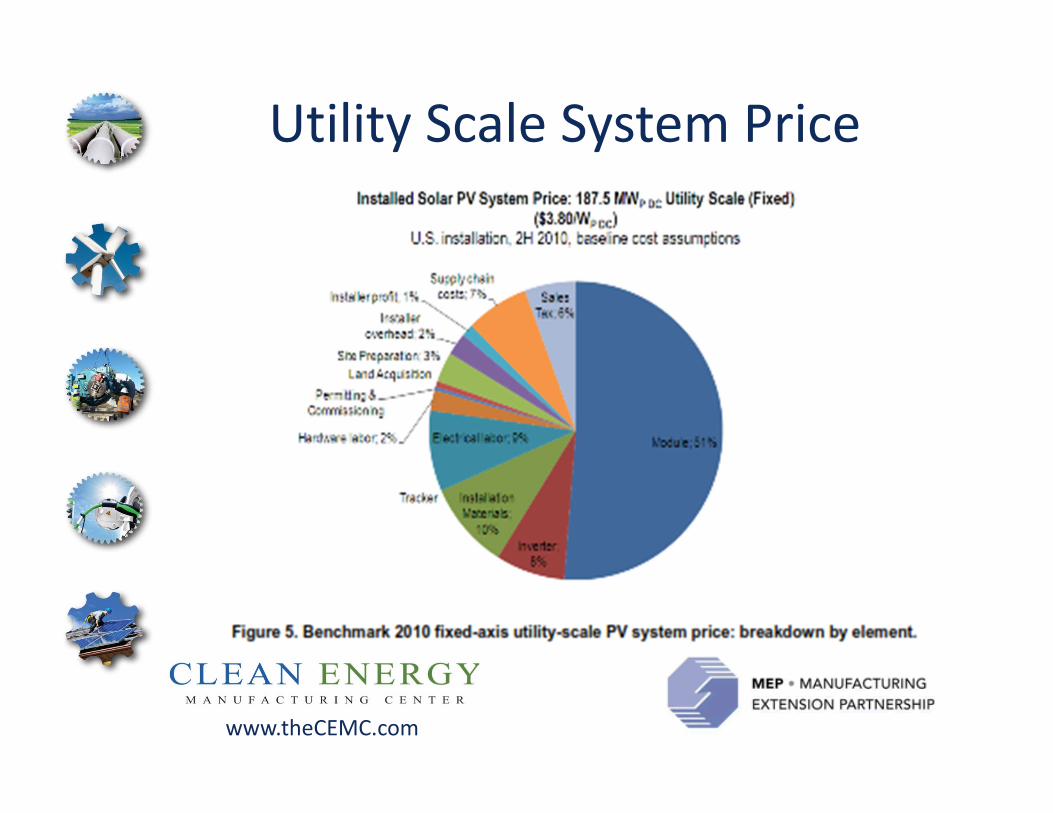
Solar Cost Breakdown
Poly Silicon
Production
Ingot / Wafer
Production
Cell /Panel
Manufacturing
System
Manufacturing
and Assembly Installation
Market Character Very Global Regional Local
Cost ~$0.80 per watt peak ~$4.20 per watt peak
• The manufacturing of panels may become more regional as freight
becomes larger portion of cost
• Cost pressure on the Poly / Ingot / Cell manufacturers has driven
costs to industry competitive point
• System assembly and installation costs still keep solar market from
being cost competitive
• This represents opportunity in the system assembly and
installation categories
www.theCEMC.com
Utility Scale System Price

www.theCEMC.com
Competitive Solar Prices
Something has to change
1. Cost of all other energy
options must rise to the level
of solar
2. Solar costs must come down
to the level of the market
3. Other…

www.theCEMC.com
Falling Cost of Solar, 2010-2012
www.theCEMC.com
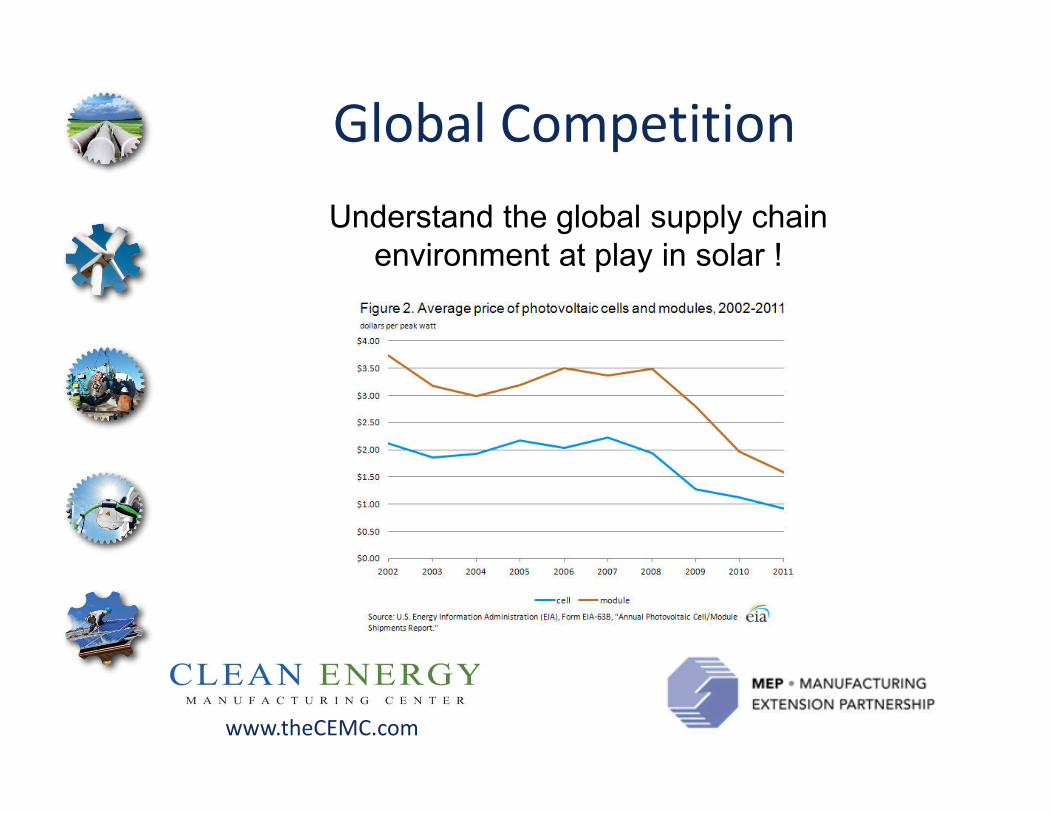
Global Competition
Understand the global supply chain
environment at play in solar !
www.theCEMC.com
World Class
• Solar warranty structures are tiered in
nature. An example might be:• Guaranteed to produce 95% rated output for 5
years +
• A Guarantee to produce 90% rated output for 12
years +
• A Guarantee to produce 80% rated output for 25
years.
The industry demands quality if to dispel the
historic stereotype of being a bit gimmicky!

www.theCEMC.com
Opportunities
• Raw Materials
– Materials such as structural’s are often
procured near the final installation site due to
the associated logistics costing.
• Installation Materials
– Fabrications associated with final installations
are often procured near the final installation
site.
www.theCEMC.com
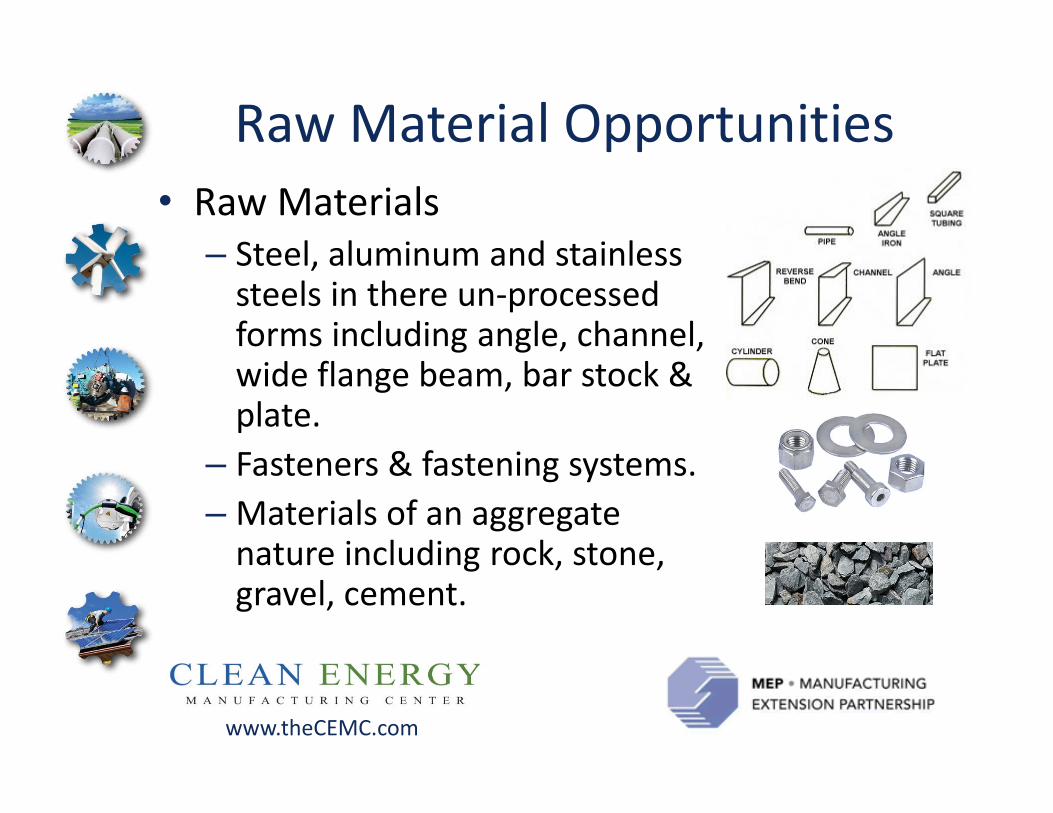
Raw Material Opportunities
• Raw Materials
– Steel, aluminum and stainless steels in there un-processed forms including angle, channel, wide flange beam, bar stock & plate.
– Fasteners & fastening systems.
– Materials of an aggregate nature including rock, stone, gravel, cement.

www.theCEMC.com
Installation Opportunities
• Installation Materials
– Fabrications including those completed on and off-site. ( typically AWS D01.1, D01.2 & D01.4 )
– Contract machining
– Processed Raw Material including punched / drilled structurals, formed / bent plate, threaded bar stock.

www.theCEMC.com
Opportunities
• Technology associated items such as
those associated with the rapidly
developing inverter or panel /
module markets where partially
completed product is imported and
final assembly is performed on US
soil.
www.theCEMC.com
Opportunities & Challenges
• American Manufacturers can enter Solar market with new and innovative solutions to lower total installed cost of Solar Systems
• However, American Manufacturers need to be able to find customers
• Installers, OEM’s and upper tier suppliers need to be able to find new technologies and new vendors
www.theCEMC.com
Moving Forward• A basic taxonomy was developed to help
manufacturers identify opportunities
• An assessment tool was developed to objectively critique a manufacture's strengths and weaknesses in the Solar Market and continues refinement to this day
• A Solar Manufacturing Capabilities matrix was developed to characterize a supplier’s position within the industry
• This matrix allows a manufacturer to easily identify areas of improvement and areas of strength
• The matrix also allows companies to characterize “good fit” vendors and customers
www.theCEMC.com
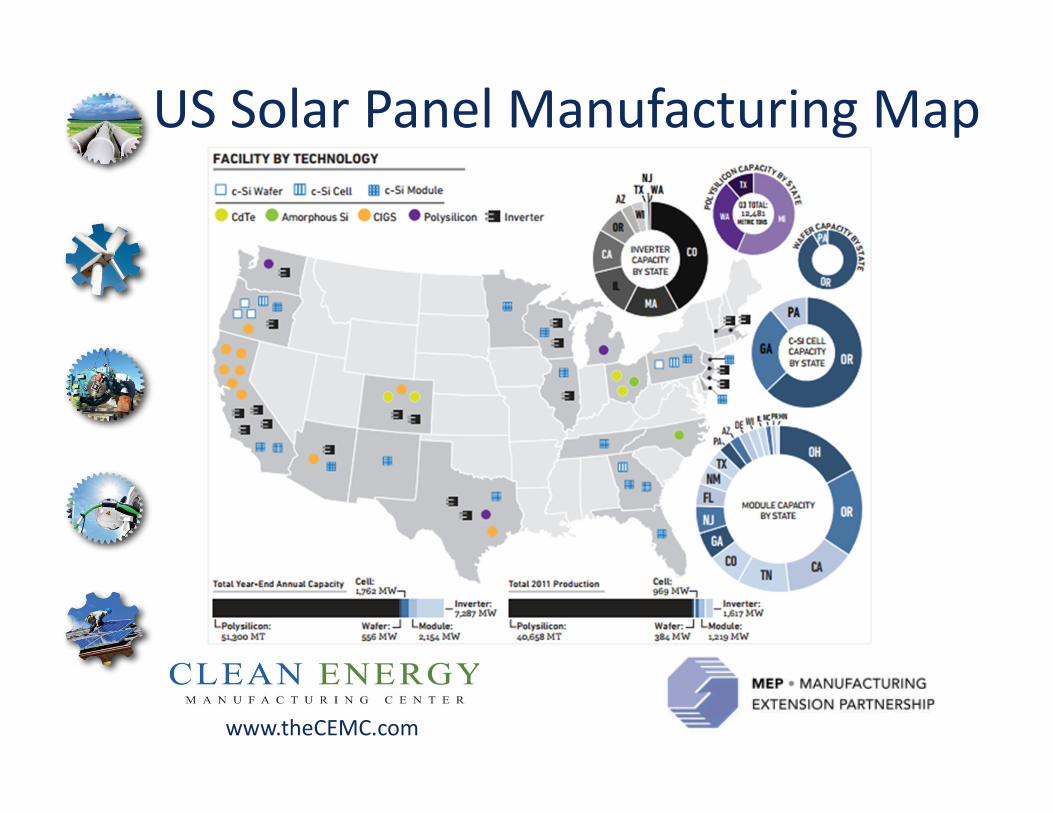
US Solar Panel Manufacturing Map
www.theCEMC.com
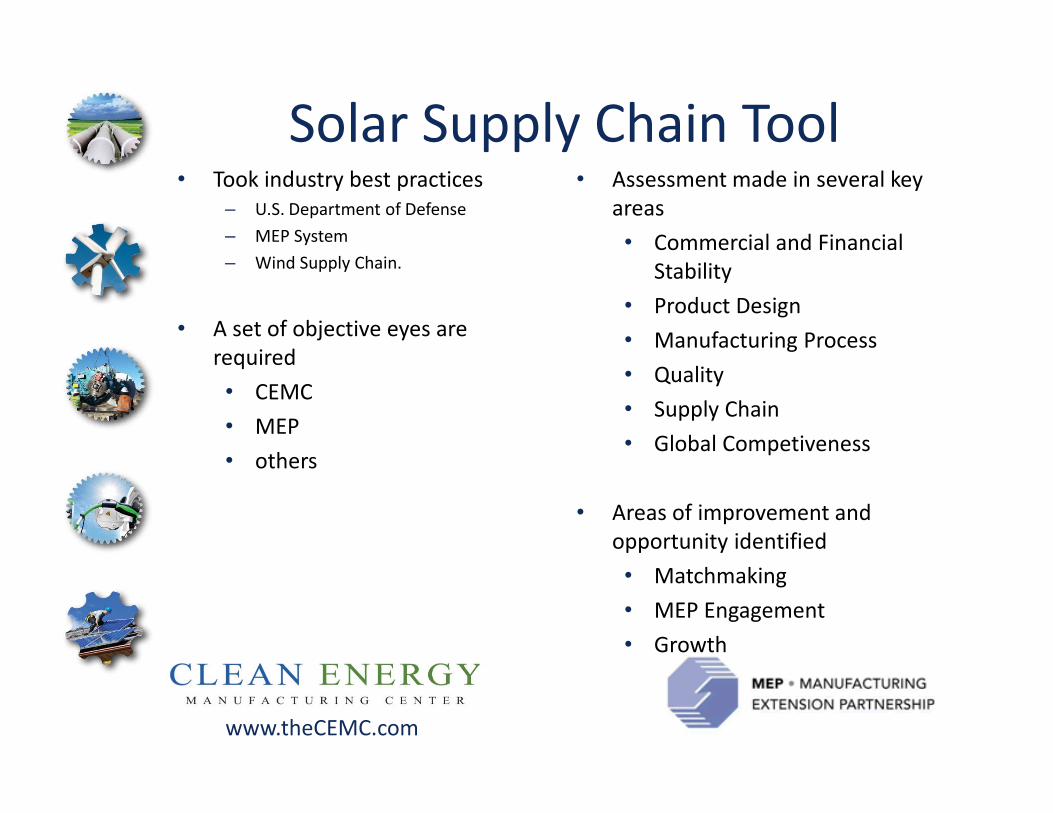
Solar Supply Chain Tool• Took industry best practices
– U.S. Department of Defense
– MEP System
– Wind Supply Chain.
• A set of objective eyes are
required
• CEMC
• MEP
• others
• Assessment made in several key
areas
• Commercial and Financial
Stability
• Product Design
• Manufacturing Process
• Quality
• Supply Chain
• Global Competiveness
• Areas of improvement and
opportunity identified
• Matchmaking
• MEP Engagement
• Growth

www.theCEMC.com
Solar Manufacturing Capabilities MatrixSMC Level 1 SMC Level 2 SMC Level 3 SMC Level 4 SMC Level 5 SMC Level 6 SMC Level 7 SMC Level 8
Research Technology DevelopmentEngineering and Manufacturing
DevelopmentProduction and Deployment
Initial ResearchProduct in Lab
Environment
Component
Development
System
Development
Process
Development
Process
Maturity
Low Rate
Production
LEAN, Full Rate
ProductionK
ey
Co
nsi
de
rati
on
s
Basic to Advanced
Research
Manufacturing
Feasibility
Determined
Manufacturing
Process Emerging
Manufacturing
Processes
Demonstrated
Manufacturing
Processes in
Development
Process Maturity
Demonstrated
Manufacturing
Process Operating
at Target
Performance
Lean / Six Sigma
Production in
Place
Advanced
Technology
Development
Manufacturing
Processes
Identified
Manufacturing
Cost Drivers
Identified
Cost Drivers
Analyzed
Producability
Improvements
Underway
Manufacturing
Processes Proven
Quality and Cost
Metrics met
Meeting or
Exceeding Cost,
Schedule, &
Performance
Goals
Manufacturing
Concepts
Identified
Key Processes
Identified
Long Lead Items
Identified
Supply Chain
Management in
Place
Supply Chain
Stable
Supply Chain
Mature and
Meeting Lead
Times
Lev
el
Ad
va
nce
me
nt
Cri
teri
a
Characterize Basic
Materials for
Manufacturing
Identify Baseline
Materials and
Issues
Key
Characteristics
Identified
Initial Trade /
Market Studies
Materials Being
ProvenMaterials Proven
Continuous
Process
Improvement is
Ongoing
Monitor and
Manage all Key
Characteristics at
Six Sigma Level
Identify Material
Concerns
Funding and
Budget for Trade
Studies
Mfg/QA approach
identified
Materials
Matured
Supply Chain
Being Assessed
Design For
Manufacturability
and Assembly
Materials In
Control
Funding to Meet
Six Sigma Goals
Identify Funding
Development
Strategy Should
Include Elements
of Mfg/QA
Early Supply
Chain Assessment
Quality
Thresholds
Established
QA Data Collected
Quality
Characteristics
Validated
Quality ValidatedNo Make / Buy
Changes
Funding to Meet
Next Level
Funding to Meet
Next Level
Supply Chain
Strategies Include
Mfg/QA
BOM Identified
BOM Supports
Low Rate
Production
Supply Chain
Supports Full Rate
Production
Key Critical
Suppliers Meet
Six Sigma Goals
Funding to Meet
Next Level
Funding to Meet
Next Level
Funding to Meet
Next Level
Funding to Meet
Next Level
www.theCEMC.com
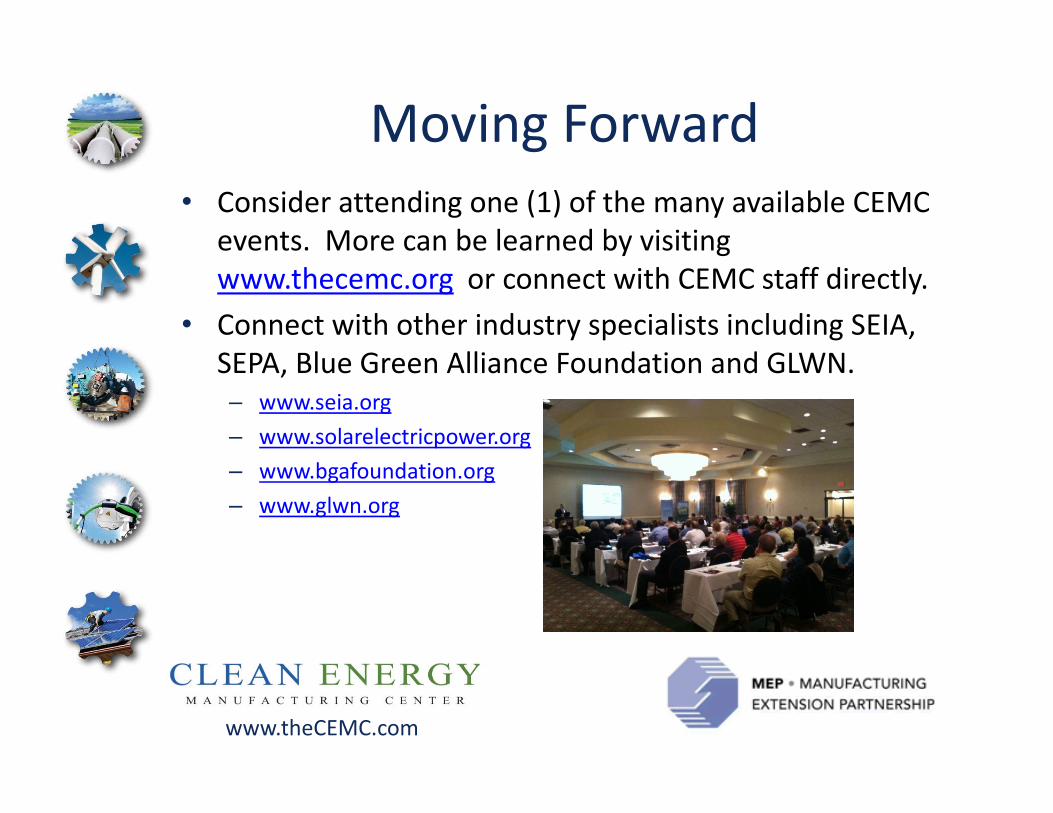
Moving Forward
• Consider attending one (1) of the many available CEMC
events. More can be learned by visiting
www.thecemc.org or connect with CEMC staff directly.
• Connect with other industry specialists including SEIA,
SEPA, Blue Green Alliance Foundation and GLWN.– www.seia.org
– www.solarelectricpower.org
– www.bgafoundation.org
– www.glwn.org
www.theCEMC.com
Questions and AnswersSubmit using Webinar Chat feature
www.theCEMC.com
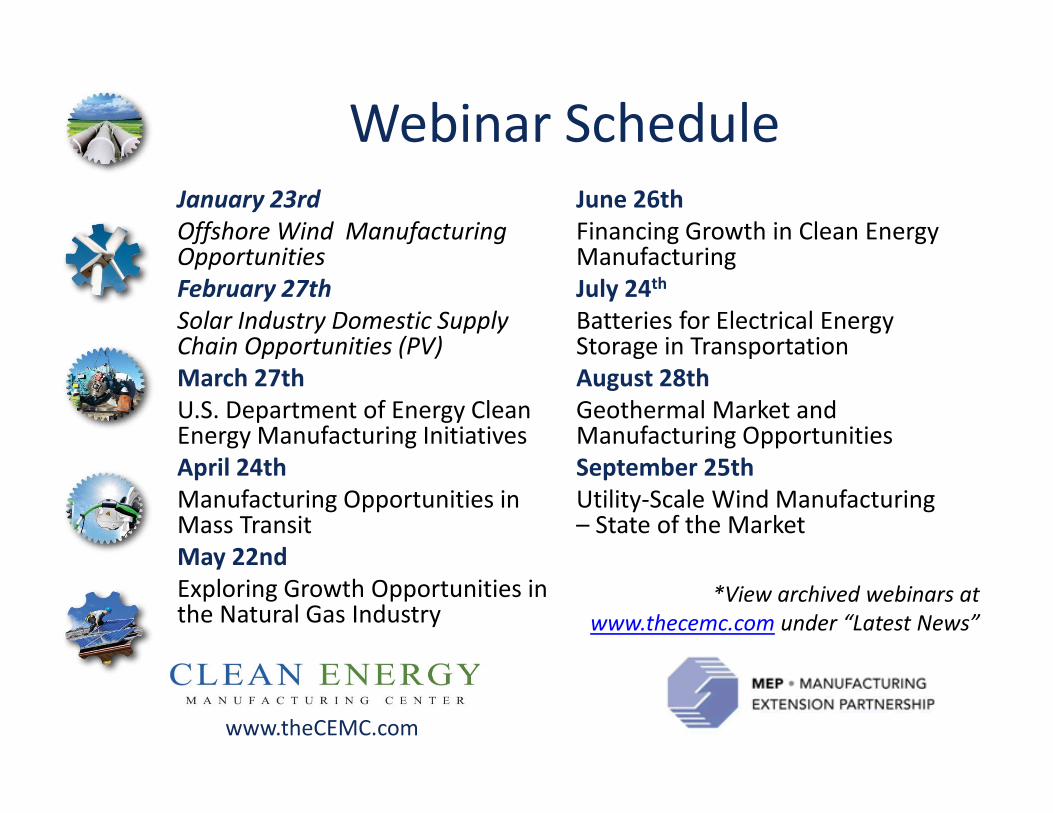
Webinar ScheduleJanuary 23rd
Offshore Wind Manufacturing Opportunities
February 27th
Solar Industry Domestic Supply Chain Opportunities (PV)
March 27th
U.S. Department of Energy Clean Energy Manufacturing Initiatives
April 24th
Manufacturing Opportunities in Mass Transit
May 22nd
Exploring Growth Opportunities in the Natural Gas Industry
June 26th
Financing Growth in Clean Energy Manufacturing
July 24th
Batteries for Electrical Energy Storage in Transportation
August 28th
Geothermal Market and Manufacturing Opportunities
September 25th
Utility-Scale Wind Manufacturing – State of the Market
*View archived webinars at
www.thecemc.com under “Latest News”

www.theCEMC.com
For Further Information
• Contact Linda Nielsen, Program Manager, Clean Energy Manufacturing Center, [email protected] , 612.466.4506
• Or visit our website at www.thecemc.com
Be with us next month as we learn about the US Department of Energy Clean Energy Manufacturing – 4th Wednesday at 1:00 Eastern


![U.S. Photovoltaic Manufacturing Consortium PVMC.pdfFeb 24, 2011 · Microsoft PowerPoint - MJ Presentation PVMC FSEC 2-24-11.ppt [Compatibility Mode] Author: JFenton Created Date:](https://static.fdocuments.in/doc/165x107/5fe4d681b229671e8d506d3d/us-photovoltaic-manufacturing-pvmcpdf-feb-24-2011-microsoft-powerpoint-.jpg)
