Webinar Series February 15, 2017 - Canadian Frailty Network · • To map the literature and...
47
www.cfn-nce.ca A scoping review of evidence for measuring frailty in hospital settings Olga Theou, PhD Dalhousie University Webinar Series February 15, 2017 Kayla Mallery, BSc Dalhousie University
Transcript of Webinar Series February 15, 2017 - Canadian Frailty Network · • To map the literature and...

www.cfn-nce.ca
A scoping review of evidence for measuring frailty in hospital settings
Olga Theou, PhDDalhousie University
Webinar SeriesFebruary 15, 2017
Kayla Mallery, BScDalhousie University
www.cfn-nce.ca
Reminder: Q-&-A session
• Follows the presentation
• Submit your Qs online during presentation
• We will answer as many Qs as time permits
2017-02-15
www.cfn-nce.ca
Reminder: Survey & Webinar
2017-02-15
• Survey will pop up on your screen after webinar • Feedback on how to improve webinar series
• Webinar slides & video available for viewing online within 1-2 days at:
• cfn-nce.ca/news-and-events/webinars

www.cfn-nce.ca
Reminder: Upcoming Webinars
Register at:http://www.cfn-nce.ca/news-and-events-overview/webinars/
• Wednesday, March 1, 2017 at 12 noon ETModeling changes in assessments to predict needs and guide care planning in home care – CFN-funded Implementation Grant Program – Debra Sheets and Stuart MacDonald, University of Victoria
• Wednesday, April 12, 2017 at 12 noon ETWeb-Based Videoconferencing (WBVC) for Rural Palliative Care Consultation in the Home – CFN-funded Health Technology Innovation Grant Program – Linda Read Paul and Charleen Salmon, University of Calgary
• Wednesday, April 26, 2017 at 12 noon ETImplementing the ‘Frailty Portal’ in Community Primary Care Practice: Evaluating feasibility, effects and expansion needs – CFN-funded Implementation Grant Program – Paige Moorhouse and Tara Sampalli, Nova Scotia Health Authority
2017-02-15

www.cfn-nce.ca
Reminder: CFN Summer Student Awards Program
Intent to Apply forms were due at 12 noon ET
Applications are due Tuesday, February 28, 2017 by 12 noon ET
2017-02-15

www.cfn-nce.ca
Reminder
2017-02-15

www.cfn-nce.ca
Presenters
• Assistant Professor of Medicine at Dalhousie University• Affiliated Scientist of Geriatric Medicine with the Nova Scotia
Health Authority• Adjunct Senior Lecturer of Medicine with the University of
Adelaide in Australia
• First year medical student at Dalhousie University• Obtained her BSc in Neuroscience from Dalhousie University• Worked as a Research Assistant from 2014-2016 for Dalhousie
University’s Geriatric Medicine Research team under the supervision of Dr. Theou and Dr. Kenneth Rockwood
2017-02-15
A scoping review of evidence for measuring frailty in hospital settings
Olga Theou,PhD
Kayla Mallery,BSc

A scoping review of evidence for measur ing frailt y in hospital set t ings
Theou O, Mallery K, Squires E, Goldstein J, Lee J, Greene J, Devereaux B, Brown R, Armstrong J, Douglas B, Rockwood K
Geriatric Medicine, Dalhousie UniversityNova Scotia Health Authority
Halifax, NS, Canada
Presenter
Presentation Notes
Do we need to add a “Presenter bio” slide? Or will they make one up?

• Many older adults are frail, especially in clinical settings.
• Frail older adults often require individualized interventions and modification of standard protocols.
• Most frailty literature-reviews focus on the community setting.
• How to measure frailty in clinical settings and which tools should be used are questions of ongoing debate.
Why is it important to identify frailty in hospital?
Presenter
Presentation Notes
Do we want to show any demographics about how large the frail population is (shows importance of article with population size). Do we want to explain frailty in depth? i.e. what a hospitalization does to a frail person vs a fit person? Do we want to mention more on the knowledge gap?

• To conduct a scoping review focused on frailty identification and management in acutely ill hospitalized patients.
• To map the literature and identify and document the nature and extent of research evidence related to frailty measures in hospital settings.
What was the purpose of this study?
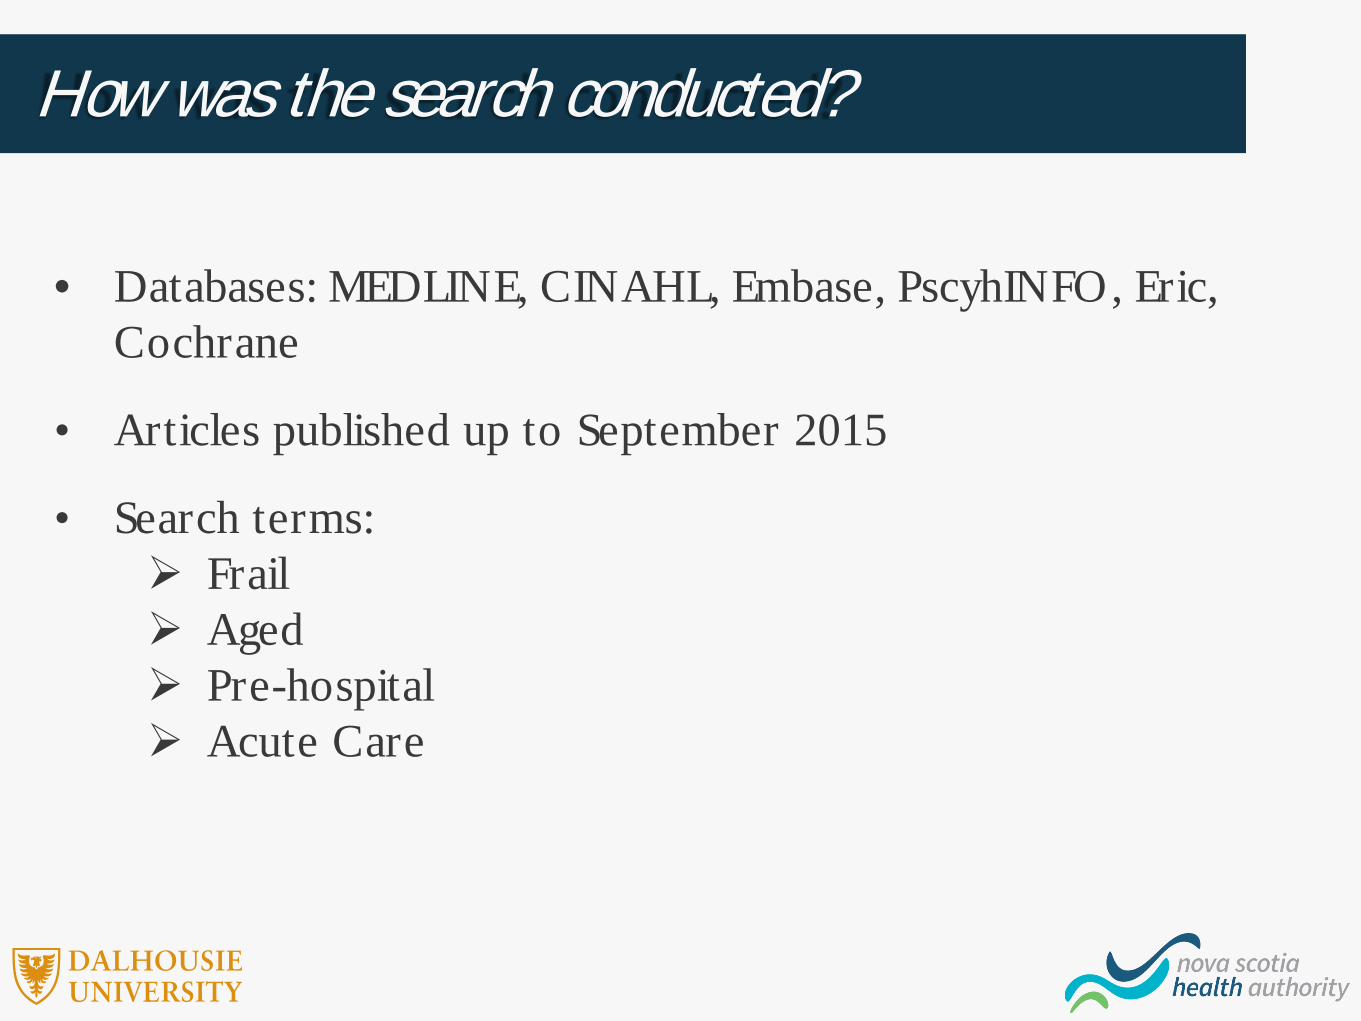
• Databases: MEDLINE, CINAHL, Embase, PscyhINFO, Eric, Cochrane
• Articles published up to September 2015
• Search terms: Frail Aged Pre-hospital Acute Care
How was the search conducted?

• Original research (and guidelines)
• Published after 2000
• Human participants
• Included ≥65 years
• Pre-hospital or in-hospital setting
• Acutely ill patients
• Authors identified participants as frail
• Not limited by: study design, quality, or outcome
What were the inclusion/exclusion criteria?

Database Search
N=8658
Title & Abstract ScreeningN= 6037
Full Text ScreeningN= 3240
Included StudiesN= 597
DuplicatesN=2621
ExcludedN=2797
ExcludedN=2643 Hand Search
N= 28
+
What was the screening process?
Presenter
Presentation Notes
As you can see, this was quite a daunting task. Our database search initially yielded 9725 articles. Of these, 2922 were excluded as duplicates, leaving 6803 papers for level 1 screening. After the titles and abstracts were screened, 3818 underwent full-text screening and 829 were included in the study. After hand-searching systematic reviews on frailty, 10 articles were added, to make the final number of included studies 839. Now I am going to present some of the results from the scoping review. I just want to say that these are very preliminary results. We have a lot of data, and this data can tell a whole lot of stories. At this point, we are still trying to figure out how to organize all of the studies.

Descriptive Characteristics
1. In what settings were the studies done?
2. When were the studies published?
3. In what languages were the articles written?
4. In what countries were the studies done?
5. How many participants were in the studies?
6. What was the age of the participants?
7. What was the sex of the participants?
8. What was the study design?
What data did we extract?
Frailty Characteristics
9. How often was frailty measured?
10. When was frailty measured?
11. Who measured frailty?
12. What type of frailty measure was used?
13. What specific scales were used?
14. For what purpose was frailty used?
15. What was the prevalence of frailty?
16. What adverse outcomes did frailty predict?

How often was frailty measured?
66%
33%
1%
Not Measured (n=413)Measured (n=204)Guidelines (n=8)
of studies did not measure
frailty
Presenter
Presentation Notes
Make fancier
Not Measured (n=413)
Measured (n=204)
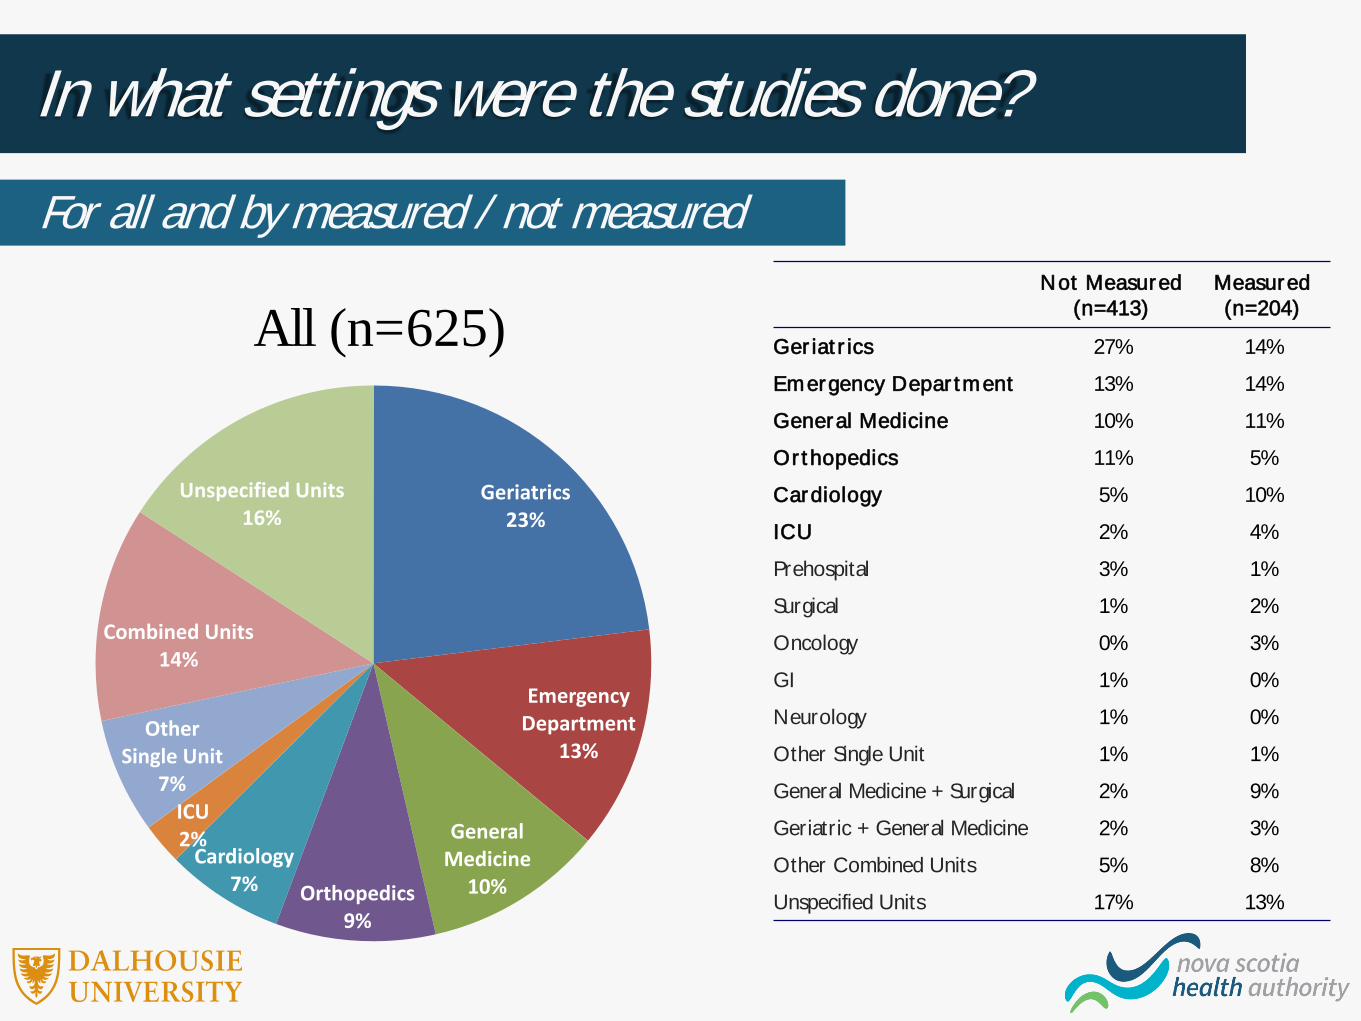
Ger iat r ics 27% 14%
Emergency Depar tment 13% 14%
General Medicine 10% 11%
Orthopedics 11% 5%
Cardiology 5% 10%
ICU 2% 4%
Prehospital 3% 1%
Surgical 1% 2%
Oncology 0% 3%
GI 1% 0%
Neurology 1% 0%
Other Single Unit 1% 1%
General Medicine + Surgical 2% 9%
Geriatric + General Medicine 2% 3%
Other Combined Units 5% 8%
Unspecified Units 17% 13%
In what settings were the studies done?
Geriatrics23%
Emergency Department
13%
General Medicine
10%Orthopedics9%
Cardiology7%
ICU2%
Other Single Unit
7%
Combined Units14%
Unspecified Units16%
For all and by measured / not measured
All (n=625)

When were the studies published?
0%
20%
40%
60%
80%
100%
All (n=625) NotMeasured
(n=413)
Measured(n=204)
0%
20%
40%
60%
80%
100%
By measured / not measured and by setting
%of
stud
ies
%of
stud
ies

In what languages were the articles written?By measured / not measured
All (n=625) Not Measured (n=413) Measured (n=204)
N % N % N %
English 590 94 383 93 200 98
French 11 2 11 3 - -
Italian 8 1 5 1 2 1
Spanish 7 1 7 2 - -
Dutch 4 .6 4 1 - -
Portuguese 3 .5 1 .2 2 1
German 2 .3 2 .5 - -

In what countries were the studies done?
0%
20%
40%
60%
80%
100%
All (n=625) Not Measured(n=413)
Measured(n=204)
Other
Australia/New Zealand
Other Europe
Italy
UK
US
Canada
By measured / not measured%
of s
tudi
es
Presenter
Presentation Notes
And whether they were measured

How many participants were in the studies?By setting
All measured
(n=204)
Geriatrics
(n=29)
Emergency Department
(n=29)
General Medicine
(n=22)
Orthopedics
(n=11)
Cardiology
(n=20)
ICU
(n=9)
N reported 201 28 29 21 11 19 9
Range 9-97,1434 44-20,933 40-7,532 34-3,479 16-36,900 24-111,023 22-47,427
Median (IQR)
206
(101-160)
164
(pp-490)
161
(100-278)
254
(119-562)
145
(47-284)
309
(135-773)
421
(119-982)

What was the age of the participants?By setting
40
50
60
70
80
90
100
All Measured(n=155)
Geriatrics(n=24)
EmergencyDepartment
(n=21)
GeneralMedicine
(n=18)
Orthopedics(n=9)
Cardiology(n=17)
ICU (n=9)
Mea
n ag
e of
stud
y pa
rtici
pant
s

What was the sex of the participants?By setting
0
20
40
60
80
100
120
All Measured(n=187)
Geriatrics(n=27)
EmergencyDepartment
(n=27)
GeneralMedicine
(n=20)
Orthopedics(n=11)
Cardiology(n=19)
ICU (n=9)
% F
emale

What was the study design?By setting
0%
20%
40%
60%
80%
100%
All (n=204) Geriatrics(n=29)
EmergencyDepartment
(n=29)
GeneralMedicine
(n=22)
Orthopedics(n=11)
Cardiology(n=20)
ICU (n=9)
QualitativeExperimentalObservational
% o
f stu
dies

When was frailty measured?
0%
20%
40%
60%
80%
100%
All (n=204) Geriatrics(n=29)
EmergencyDepartment
(n=29)
GeneralMedicine
(n=22)
Orthopedics(n=11)
Cardiology(n=20)
ICU (n=9)
Not reportedRetrospective ReviewMixedDuring HospitalizationAt DischargeAt Admission
By setting
% o
f stu
dies

Who measured frailty?
0%
20%
40%
60%
80%
100%
All (n=204) Geriatrics(n=29)
EmergencyDepartment
(n=29)
GeneralMedicine
(n=22)
Orthopedics(n=11)
Cardiology(n=20)
ICU (n=9)
Not ReportedOtherResearcherHealth Care Professional
By setting
% o
f stu
dies
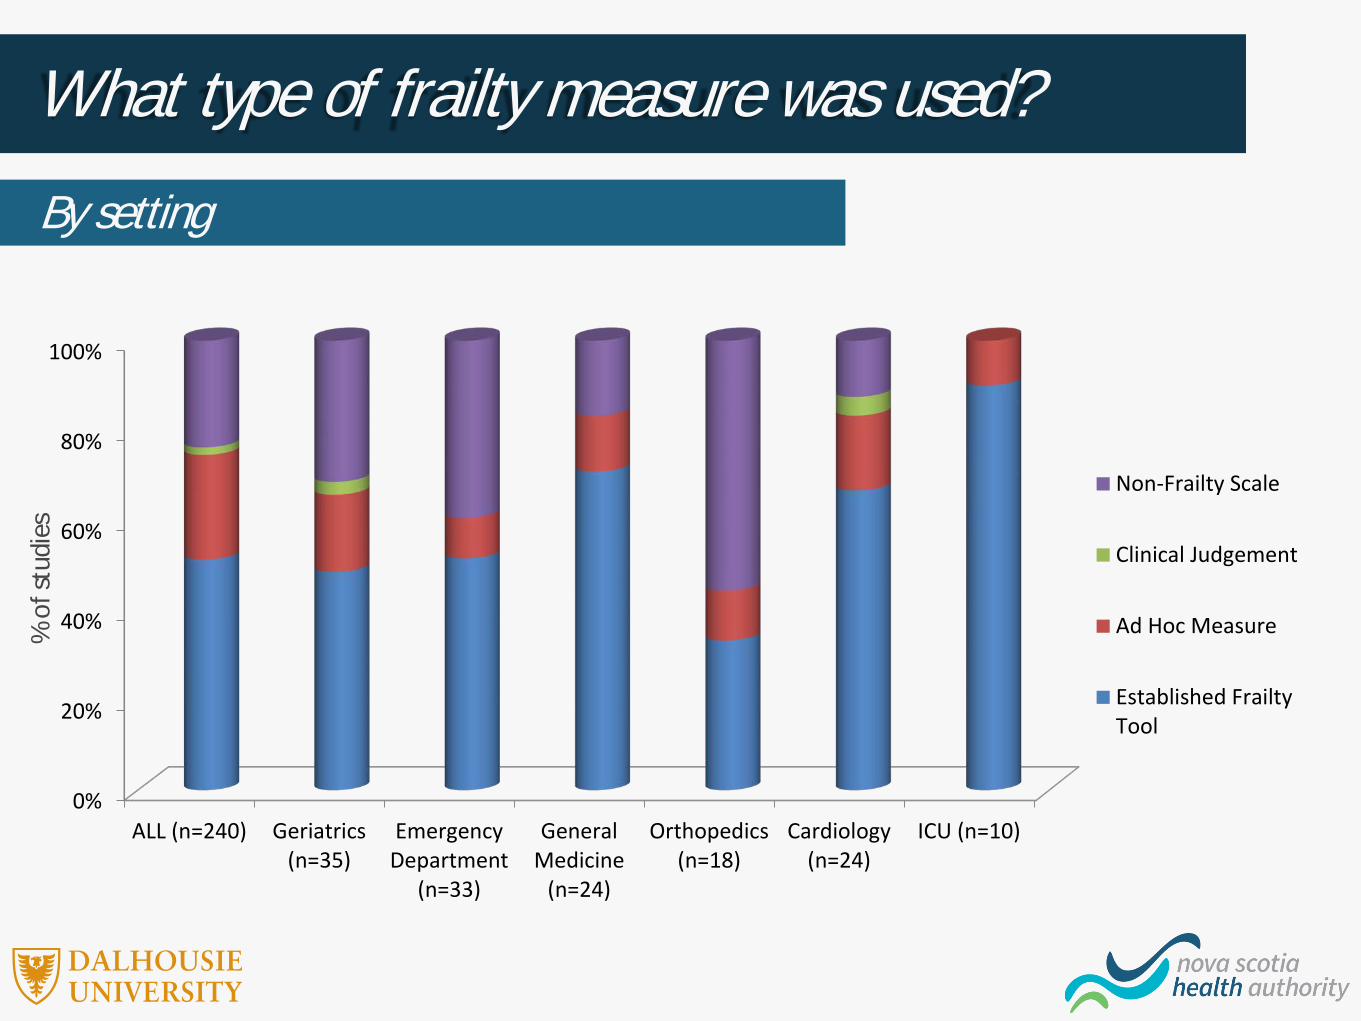
What type of frailty measure was used?
0%
20%
40%
60%
80%
100%
ALL (n=240) Geriatrics(n=35)
EmergencyDepartment
(n=33)
GeneralMedicine
(n=24)
Orthopedics(n=18)
Cardiology(n=24)
ICU (n=10)
Non-Frailty Scale
Clinical Judgement
Ad Hoc Measure
Established FrailtyTool
By setting
% o
f stu
dies
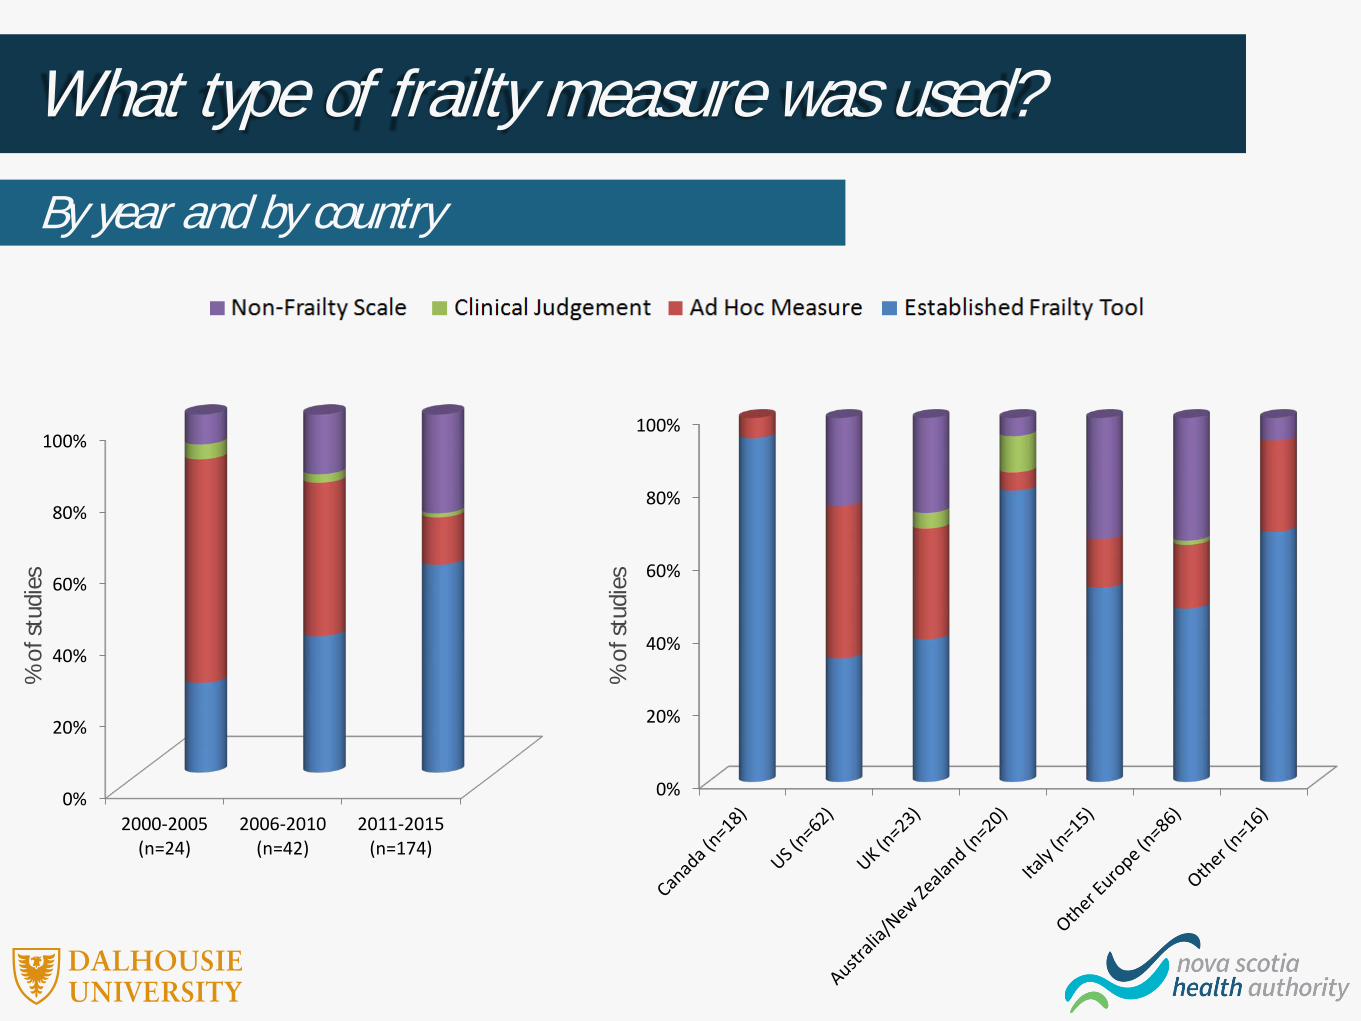
What type of frailty measure was used?
0%
20%
40%
60%
80%
100%
2000-2005(n=24)
2006-2010(n=42)
2011-2015(n=174)
0%
20%
40%
60%
80%
100%
By year and by country
% of
stud
ies
% of
stud
ies

What specific scales were used?
0 5 10 15 20 25 30
Life Space AssessmentShort Physical Performance Battery
Multidimensional Prognosis IndexGronigen Frailty Indicator
FRAIL scaleTilburg Frailty Indicator
Study of Osteoporotic Fracture IndexRockwood Geriatric Frailty Status
Balducci criteriaVulnerable Elders Survey
Winodgrad IndexEdmonton Frail Scale
GEM drug study criteriaIdentification of Seniors at Risk
Frailty PhenotypeFrailty Index
Clinical Frailty Scale
Number of Studies

What specific scales were used?
Ranked Geriatrics (n=29)
Emergency Department
(n=29)
General Medicine (n=22)
Orthopedics (n=11)
Cardiology (n=20)
ICU (n=9)
1 Clinical Frailty Scale (17%) Frailty Index (21%)
Clinical Frailty Scale (17%),
Frailty Phenotype (17%),
Frailty Index (17%)
Frailty Index (22%) Frailty Phenotype (25%) CFS (60%)
2Identification of Seniors At Risk
(11%)Clinical Frailty Scale
(12%),Frailty Phenotype
(12%)
Mobility/Balance (11%)
Clinical Frailty Scale (13%)
Frailty Phenotype (20%)
3 Frailty Index (9%)
Frailty Phenotype (6%), Edmonton Frailty Scale (6%), Identification of
Seniors At Risk (6%), Strength (6%)
Edmonton Frailty Scale (8%),
Tilburg Frailty Indicator (8%)
Frailty Index (10%)
4Frailty Phenotype
(6%), Study ofOsteoporotic
Fracture Index (6%), Rockwood Geriatric Frailty Status (6%), Multidimensional
Prognosis Index (6%), Strength (6%)
Identification of Seniors At Risk (9%),
Vulnerable Elders Survey (9%)
Edmonton Frailty Scale (8%),
Identification of Seniors At Risk (8%)
-
5
Frailty Index (4%), Rockwood Geriatric Frailty Status (4%), FRAIL scale (4%), Identification of
Seniors At Risk (4%), Mobility/Balance (4%)
By setting
Presenter
Presentation Notes
Is there a way to make this more clear? This is confusing to the eye

For what purpose was frailty used?By setting
% o
f stu
dies
0%
20%
40%
60%
80%
100%
All (n=625) Geriatrics(n=29)
EmergencyDepartment
(n=29)
GeneralMedicine
(n=22)
Orthopedics(n=11)
Cardiology(n=20)
ICU (n=9)
Descriptive
Mixed
Outcome
Inclusion/Exclusion
Risk Stratification

For what purpose was frailty used?By year and by design
% of
stud
ies
% of
stud
ies
0%
20%
40%
60%
80%
100%
2000-2005(n=24)
2006-2010(n=42)
2011-2015(n=174)
0%
20%
40%
60%
80%
100%
Observational(n=166)
Experimental(n=32)
Qualitative(n=6)

What was the prevalence of frailty?
0
20
40
60
80
100
ALL (n=122) Geriatrics(n=17)
EmergencyDepartment
(n=13)
GeneralMedicine
(n=12)
Orthopedics(n=5)
Cardiology(n=17)
ICU (n=8)
By setting%
Fra
il

What was the prevalence of frailty?By age, by % females, and by type of frailty measure
0
20
40
60
80
100
Mean Age<80(n=63)
Mean Age>80(n=42)
<50% Females(n=45)
>50% Females(n=72)
EstablishedFrailty Scale
(n=81)
Ad HocMeasure (n=19)
ClinicalJudgment (n=2)
Non-FrailtyScale (n=20)
% F
rail
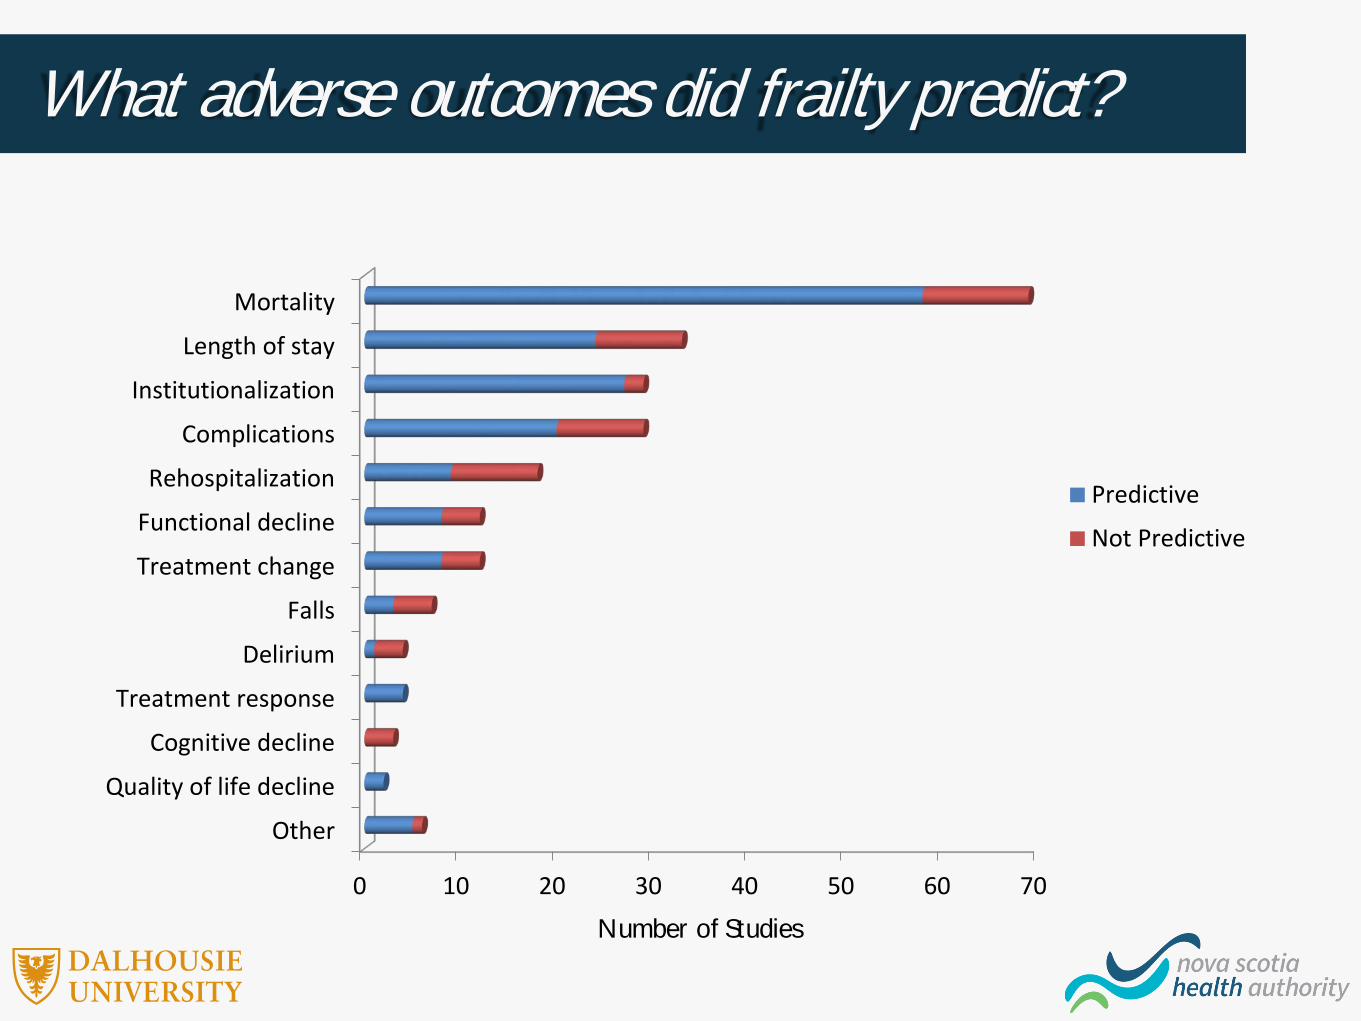
What adverse outcomes did frailty predict?
0 10 20 30 40 50 60 70
Other
Quality of life decline
Cognitive decline
Treatment response
Delirium
Falls
Treatment change
Functional decline
Rehospitalization
Complications
Institutionalization
Length of stay
Mortality
Predictive
Not Predictive
Number of Studies

What adverse outcomes did frailty predict?By setting
0%
20%
40%
60%
80%
100%
ALL (n=228) Geriatrics(n=33)
EmergencyDepartment
(n=33)
GeneralMedicine
(n=23)
Orthopedics(n=16)
Cardiology(n=19)
ICU (n=33)
Not Predictive
Predictive% o
f stu
dies

What adverse outcomes did frailty predict?By type of frailty measure
0%
20%
40%
60%
80%
100%
Established FrailtyScales (n=164)
Ad Hoc Measure(n=19)
Clinical Judgement(n=2)
Non-Frailty Scales(n=43)
Not Predictive
Predictive
% o
f stu
dies

What adverse outcomes did frailty predict?By frailty tool
0%
20%
40%
60%
80%
100%
Clinical FrailtyScale (n=48)
Fraily Index(n=44)
FrailtyPhenotype
(n=30)
EdmontonFrailty Scale
(n=16)
Identificationof Seniors At
Risk (n=5)
Not Predictive
Predictive
% o
f stu
dies

SummaryDescriptive Characteristics – All studies
Q. In what settings were the studies done? A. Most common settings were geriatrics, emergency department, and general medicine.
Q. When were the studies published? A. Almost 50% of the studies between 2011-2015. Even higher % among studies that
measured frailty (70%).
Q. In what languages were the articles written? A. Majority in English.
Q. In what countries were the studies done? A. >50% in USA, UK, Canada and Italy.

Q. How many participants were in the studies? A. Great variability but median ~200.
Q. What was the age of the participants? A. Median ~80.
Q. What was the sex of the participants? A. Median ~55% of females included in study.
Q. What was the study design? A. More than 80% observational studies.
SummaryDescriptive Characteristics – Measured studies
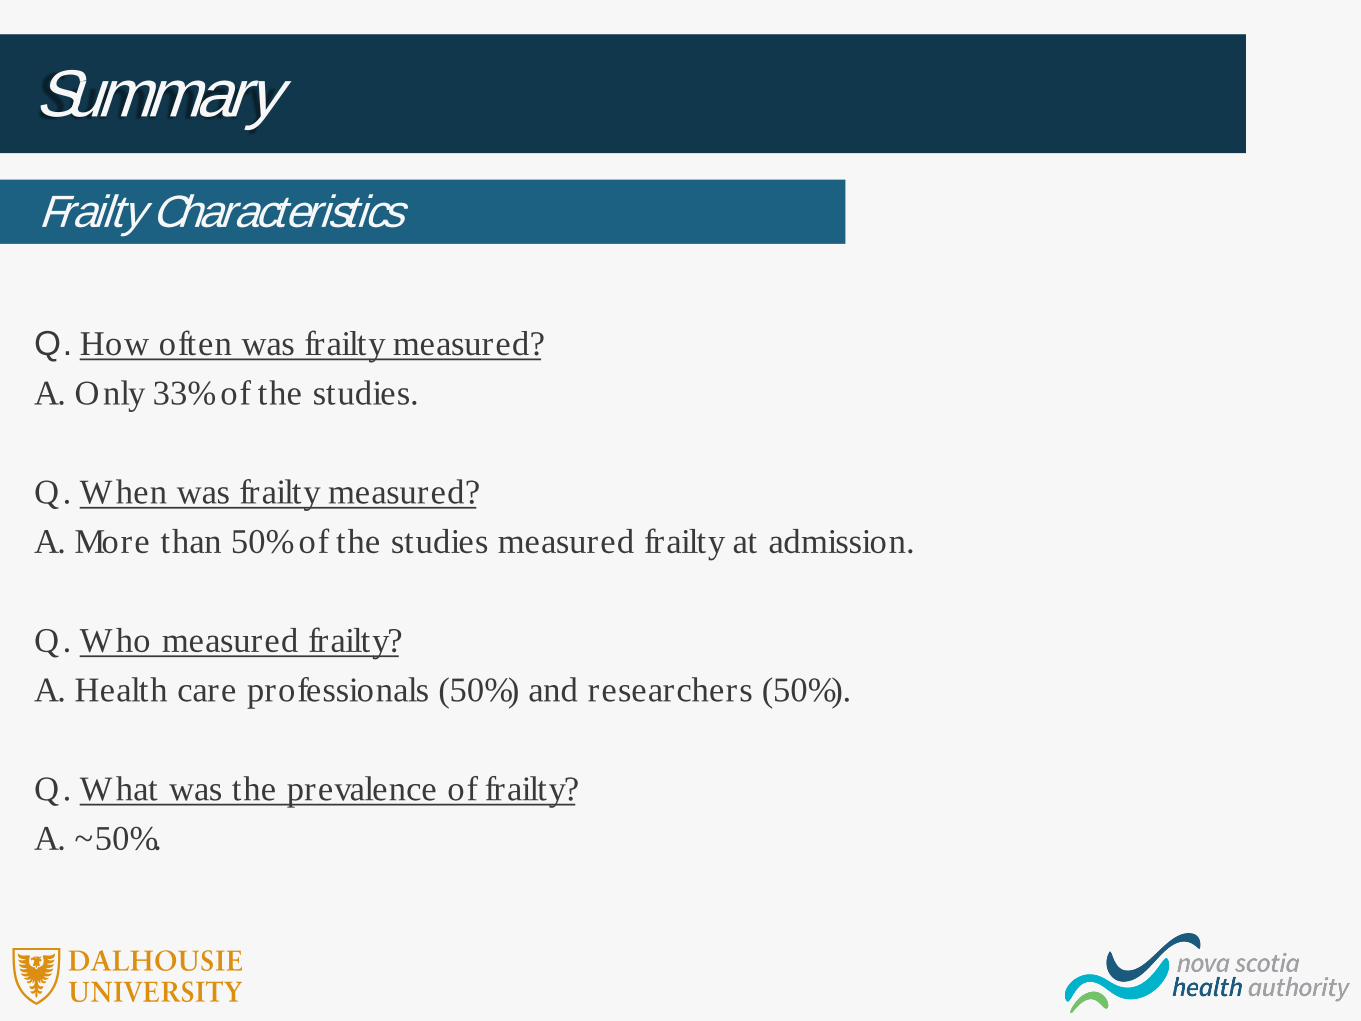
Q. How often was frailty measured?A. Only 33% of the studies.
Q. When was frailty measured? A. More than 50% of the studies measured frailty at admission.
Q. Who measured frailty?A. Health care professionals (50%) and researchers (50%).
Q. What was the prevalence of frailty? A. ~50%.
SummaryFrailty Characteristics
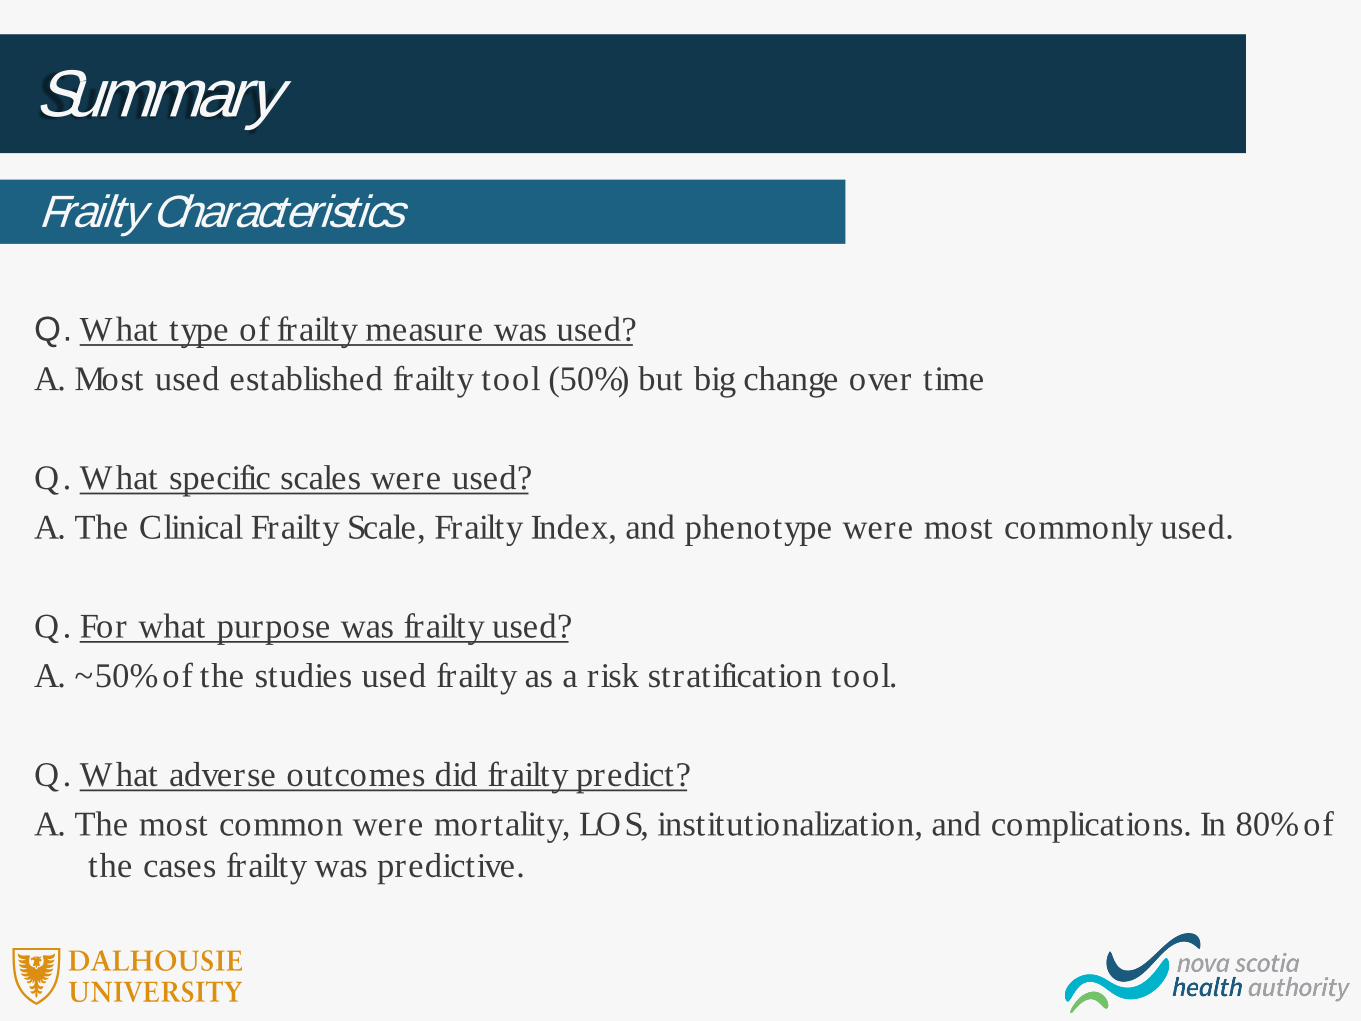
Q. What type of frailty measure was used? A. Most used established frailty tool (50%) but big change over time
Q. What specific scales were used? A. The Clinical Frailty Scale, Frailty Index, and phenotype were most commonly used.
Q. For what purpose was frailty used? A. ~50% of the studies used frailty as a risk stratification tool.
Q. What adverse outcomes did frailty predict? A. The most common were mortality, LOS, institutionalization, and complications. In 80% of
the cases frailty was predictive.
SummaryFrailty Characteristics
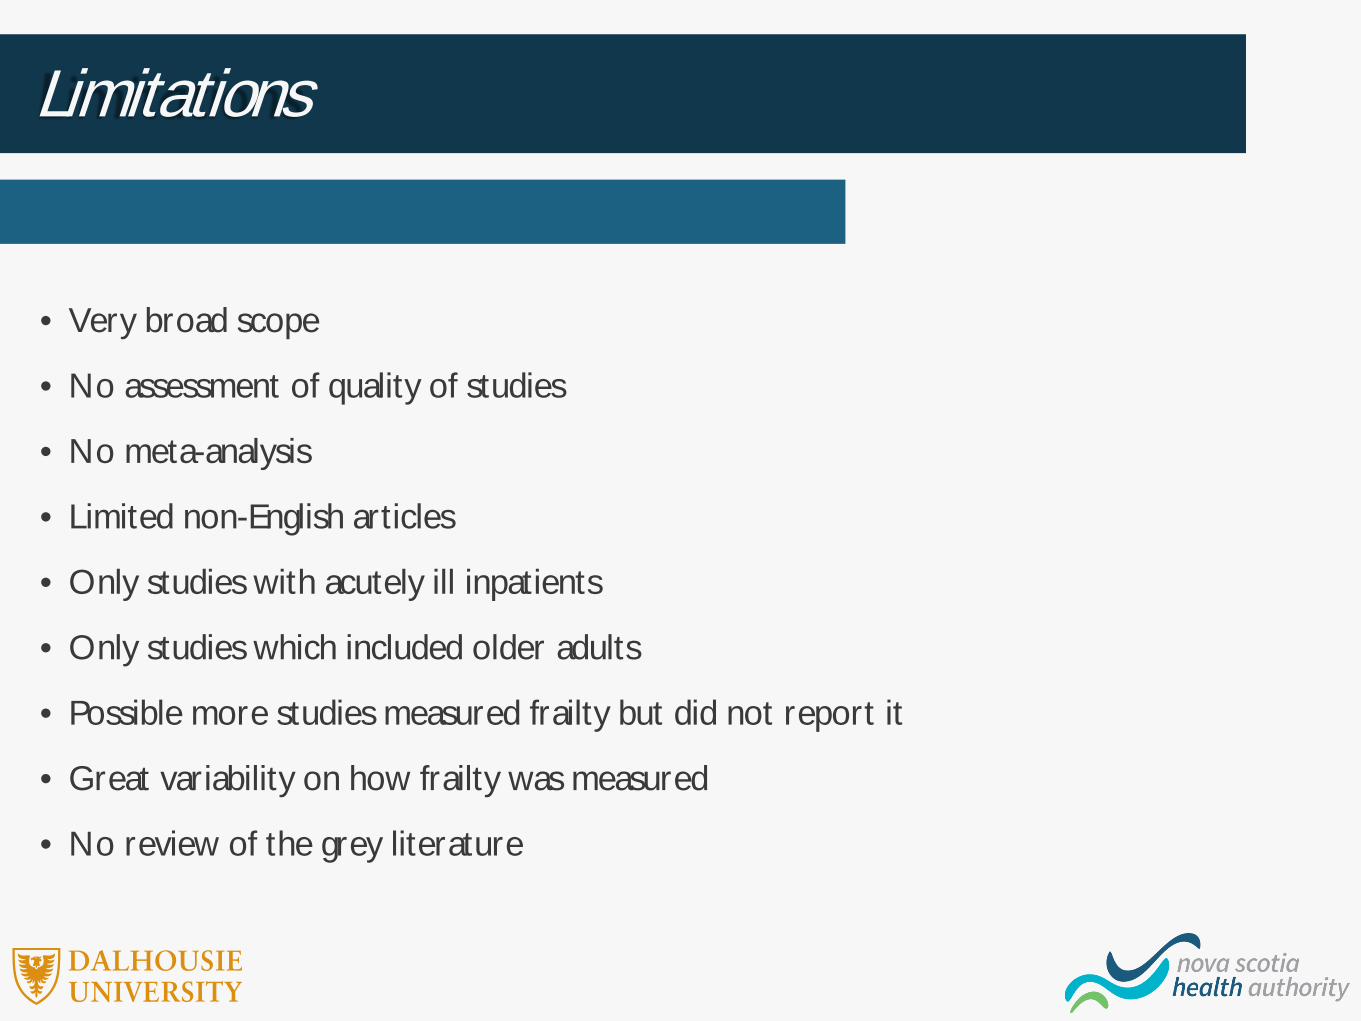
Limitations
• Very broad scope
• No assessment of quality of studies
• No meta-analysis
• Limited non-English articles
• Only studies with acutely ill inpatients
• Only studies which included older adults
• Possible more studies measured frailty but did not report it
• Great variability on how frailty was measured
• No review of the grey literature
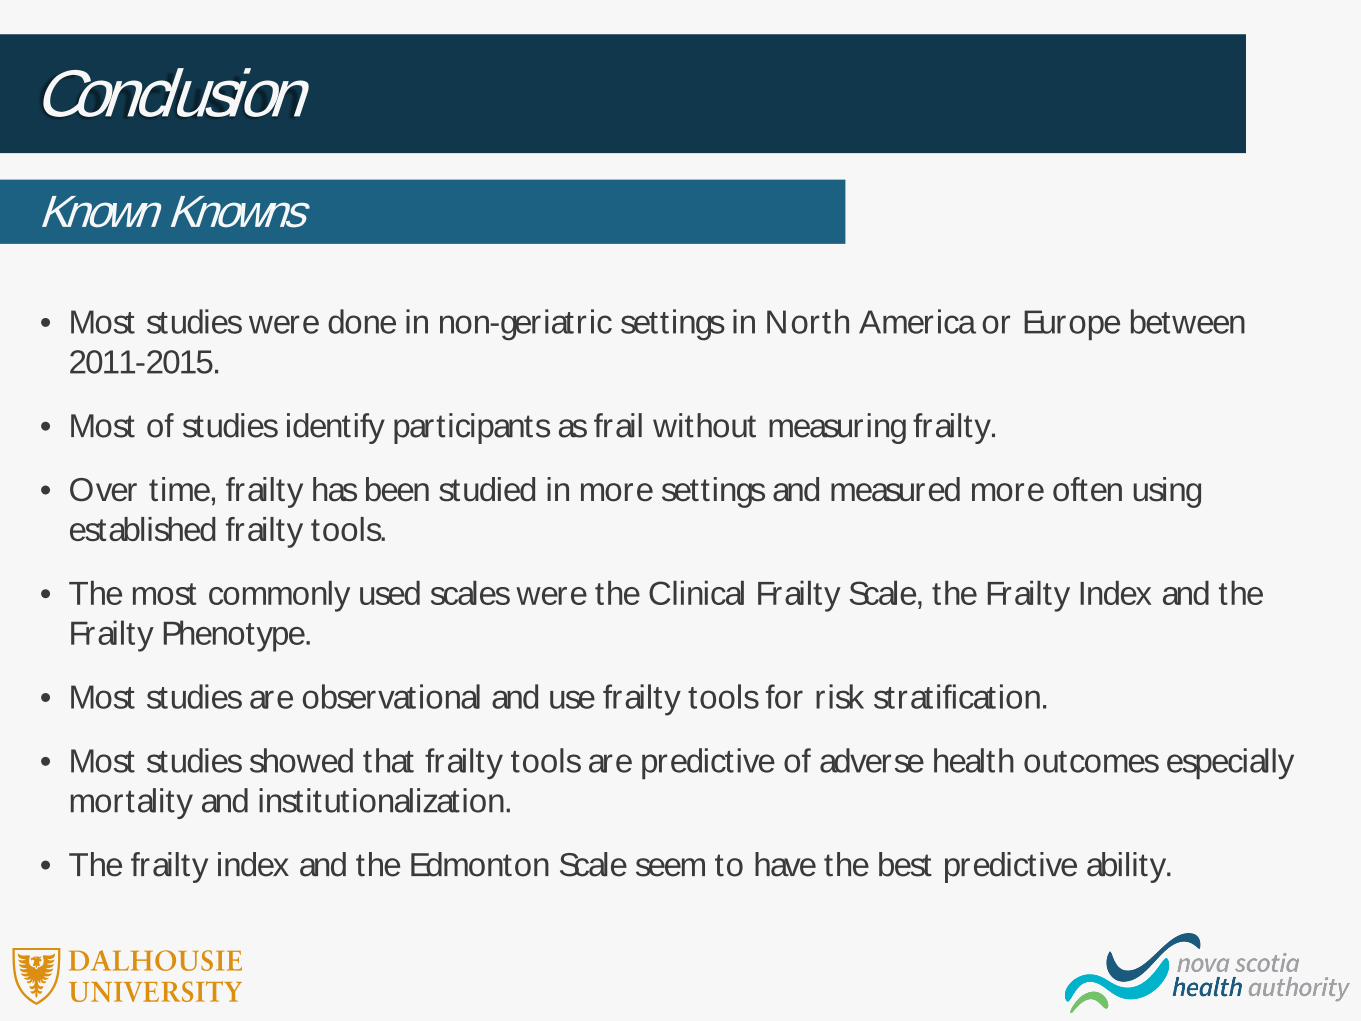
ConclusionKnown Knowns
• Most studies were done in non-geriatric settings in North America or Europe between 2011-2015.
• Most of studies identify participants as frail without measuring frailty.
• Over time, frailty has been studied in more settings and measured more often using established frailty tools.
• The most commonly used scales were the Clinical Frailty Scale, the Frailty Index and the Frailty Phenotype.
• Most studies are observational and use frailty tools for risk stratification.
• Most studies showed that frailty tools are predictive of adverse health outcomes especially mortality and institutionalization.
• The frailty index and the Edmonton Scale seem to have the best predictive ability.

ConclusionKnown Unknowns
• Frailty examined in experimental and qualitative studies.
• Frailty included as an outcome measure.
• Frailty measured in other clinical settings.
• Frailty predicting patient-oriented outcome measures.
• Frailty identification improving clinical decision making.
• Developing frailty management plans.
• Frailty identification and management improving care.

Next stepsCall to Action
Identify participants as frail only when it has been measured.
Report details of when and who measured frailty. Use established frailty tools and report details on
modifications. Conduct observational studies using patient-
oriented outcomes. Conduct qualitative studies about frailty. Conduct RCTs about modifying treatment plans
based on frailty level. Conduct RCTs using frailty as an outcome.
Presenter
Presentation Notes
Action points for Researchers: report details who/what/when you measured. Report results, don’t call people frail unless they are, report what scale you used an if you modified it.

Acknowledgements
Lindsay WallaceEmiel HoogendijkAgathe Daria JadczakPeter HicoYe PengMark ThompsonFernando PenaOleg Zaslavsky
Sherri FaySacha NadeauElizabeth DoyleJudith GodinJosh WebbRoxanne SterniczukKaterina TheohariNika Dominika Seblova

Want to know more? Interested in collaborating?Contact
Olga Theou, Principal [email protected]
Kayla Mallery, Research Assistant [email protected]
Emma Squires, Research Assistant [email protected]
Presenter
Presentation Notes
Call out if anyone is interested in learning more or collaborating


![Frailty pathway [970kb]](https://static.fdocuments.in/doc/165x107/588da5761a28ab737b8b4e2c/frailty-pathway-970kb.jpg)