![Healthy Meeting Essentials [WEBINAR]](https://static.fdocuments.in/doc/165x107/5a6cf3e27f8b9ac7418b491b/healthy-meeting-essentials-webinar.jpg)
Webinar: Reporting Essentials
24
Kurt Alexander Reporting Essentials
-
Upload
informa-middle-east -
Category
Education
-
view
14 -
download
1
Transcript of Webinar: Reporting Essentials
Kurt Alexander
Reporting Essentials
Trainer
Kurt L. Alexander
Condamine Developments Pty Ltd
This webinar is from the title courses “Financial Reporting for Executive Assistants”
or “Data Analysis & Dashboard Reporting”
Course information may be obtained from
INFORMA
“Bringing Knowledge to Life!”
Housekeeping
• Slides will be available on our SlideShare page, link will be emailed to you
• Recording of the webinar will be available to download, link will be emailed
• Take the time to complete post-webinar survey that will pop up at the end
• You can type your questions throughout the session
• Time will be allocated in the end for the speaker to address your questions
About The Speaker
Kurt Alexander has over 21 years’ experience in general management, financial management,
administration management, and project management.
He has nine years of professional business consulting and analysis experience, coupled with three
years’ extensive finance training in Australasia and the Middle East.
Kurt is Director of Condamine Developments, an Australian Company focused on Business
performance and training, and a Senior Consultant, Business Analyst, Management, and Finance
Trainer.
Kurt has extensive experience in a wide array of consulting/training engagements within the
electrical, hospitality, tourism, resort, mining, development, construction, engineering, retail,
manufacturing and consumer industries within Australasia, India and the Middle East.

Points we will cover in this Webinar:
• Start at the Beginning
• Theory, Design & Implementation
• Presentation
© Condamine Developments Pty Ltd
Start at the Beginning
• Know the end user
• Know the material
• Develop the layout
• Plan the layout
• Discuss the layout
• Produce the report
© Condamine Developments Pty Ltd
Know the End User
Key to the success of the project
• Identify the END USER
• Identify the reason for the report
• Identify the desired layout
• Understand the end users comprehension and
interpretation of charts and graphs
© Condamine Developments Pty Ltd
Know the Material
• What Industry
• What form it is delivered in
• What information is included
• How does the material fit together
• What are the variances
• What is related to this information
© Condamine Developments Pty Ltd
Develop the Layout
• Is this a “Once Off” report?
– If so, do it as quickly AND accurately as possible
• Is this report to be repeated, or only have slight
variations each time?
– If so, do it as a dynamic report that has inputs and
dynamically linked workings to allow for new data and slight
variations
© Condamine Developments Pty Ltd
Plan the Layout
• What is the end product?
• Where is it to be presented at?
• Organize and clean the raw data
• Determine your variables and assumptions
• Determine the method of calculations
• Set report/dashboard to previous agreed layout
© Condamine Developments Pty Ltd
Discuss the layout
Critical steps before presentation
• With the team
• With the end user
– Show rough drafts to ensure you are on the right path
– Gain insight into how they think and perceive information
© Condamine Developments Pty Ltd
Produce the Report
• Final review
• Review on media to be used
• Train the presenter
– If it is you, make sure you have all our information compiled
and understand it all
– If it is not you – ensure the presenter is capable of
explaining and presenting the material for what the DATA
says, not the outcome they want.
© Condamine Developments Pty Ltd
Theory, Design & Implementation
• Why do we do reports?
• What are the reasons reports are not effective?
• Why can data be misinterpreted?
• What tools do we use?
• What is a dashboard report?
• How does it work?
© Condamine Developments Pty Ltd
Why do we do reports?
• Key Reasons for producing reports:
– Operational
– Strategic / Executive
– Analytical
© Condamine Developments Pty Ltd

The problem lay with the
interpretation of the data, not the quantity or quality
of data.
Information Overload People usually react to too much information
in one of two ways:
• Shut down because it is too overwhelming
• Keep open to the flow of information, and never
make a decision
The best course of action?
The middle road
© Condamine Developments Pty Ltd

Excel Tools for Data Analysis
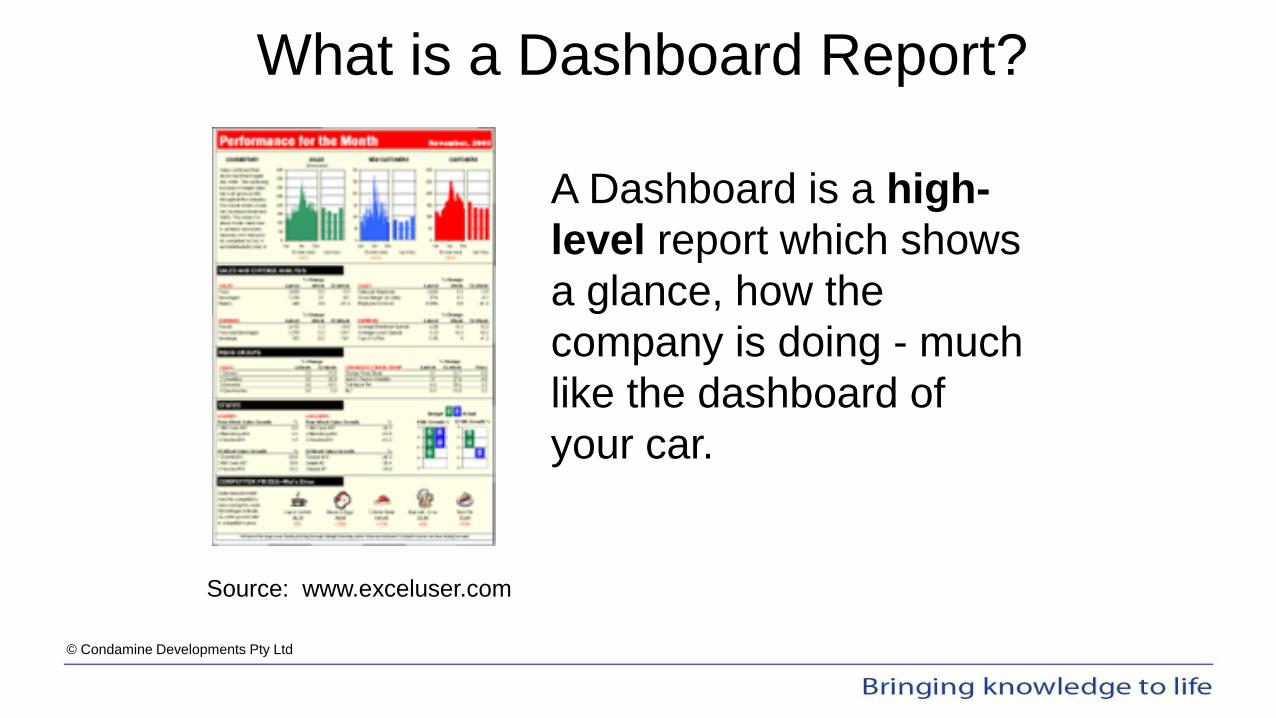
What is a Dashboard Report?
A Dashboard is a high-
level report which shows
a glance, how the
company is doing - much
like the dashboard of
your car.
Source: www.exceluser.com
© Condamine Developments Pty Ltd
Key Definition of a Dashboard
• Easy to read
• Usually single page and real-time
• Showing a snapshot of current status and historical
trends
• Shows KPIs and metrics
• Enables instantaneous and informed decisions to be
made at a glance
© Condamine Developments Pty Ltd
How a dashboard works:
Uses business units as the driver
and
Information Technology as the enabler
© Condamine Developments Pty Ltd
Presentation
• Don’t be sloppy. Your report is your image/brand
• Bring focus and simplify
• Calibrate the data to be shown optimally
• Eliminate distractions, make data stand out
• Lines, bars, pies, speedometer… chose the best fit
© Condamine Developments Pty Ltd
• Consolidate data, be honest with your data
• Ditch the text, visualize the story
• Keep interpretation down to under 30 seconds
• It’s not the ink…. It’s the think!
© Condamine Developments Pty Ltd
© Condamine Developments Pty Ltd
Conclusion
• Thank you for your time and attention into this webinar, I greatly appreciate that you were concerned enough about your Reporting Skills to make the effort to get more training, thank you!
• Sometimes we think that “Self Based Training” is more important than “Focused, collective skills based training”.
• Are you ready to make changes?
• As a pro-active employee/manager you should always be ready to make changes!
• Once again, thank you for your attention and we will now open up the opportunity for you to ask questions.
Trainer
Kurt L. Alexander
Condamine Developments Pty Ltd
This webinar is from the title courses ““Financial Reporting for Executive Assistants”
and “Data Analysis & Dashboard Reporting”
Available as In-House or Public Training
Course information may be obtained from
INFORMA
“Bringing Knowledge to Life!”