
Webinar O Nutricionista - Laboratório · Scanning electron microscopy of starch granules in corn:...
65
Webinar O Nutricionista
Transcript of Webinar O Nutricionista - Laboratório · Scanning electron microscopy of starch granules in corn:...

Webinar
O Nutricionista

8 de julho 19:00
(toda segunda quarta feira do mês)
Randy Shaver – PhD – Universidade de Wisconsin –
Madison. O que podemos fazer na fazenda para aumentar
a digestibilidade do amido.
Webinar - O Nutricionista


Ruminant Starch Digestion
Rumen
Small Intestine
Hind Gut
Microbial Fermentation • VFA
• Propionate • Glucose via liver
• Microbial Protein
Digestion (Enzymatic) • Glucose
Microbial Fermentation • VFA
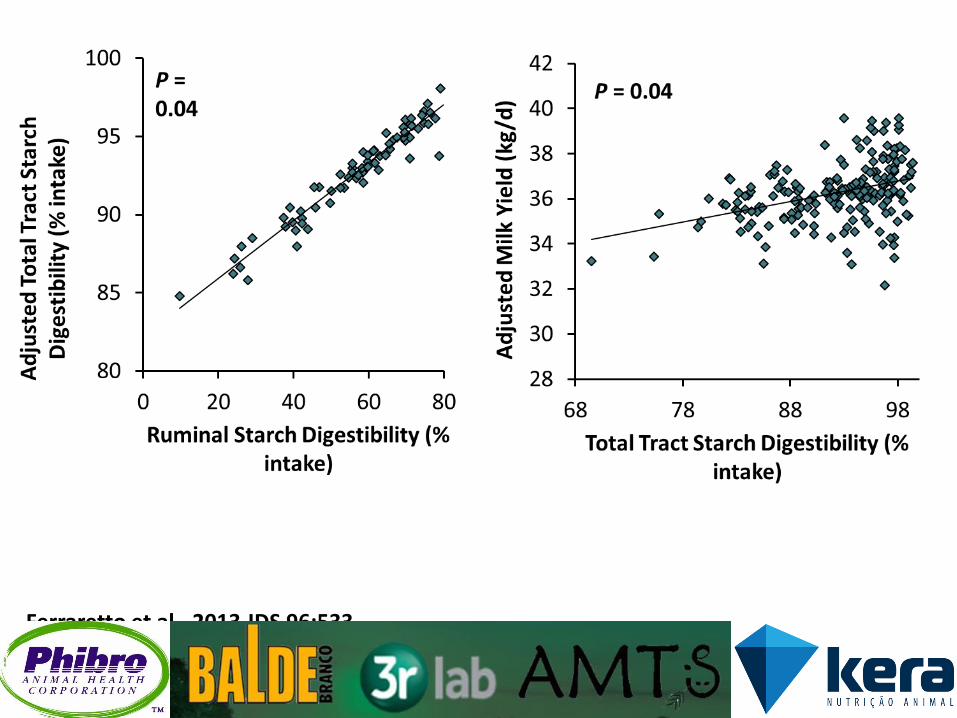
Ferraretto et al., 2013 JDS 96:533


80 to 98% StarchD•Kernel particle size•Duration of silage fermentation•Kernel maturity •Endosperm properties•Additives
40 to 70% IVNDFD•Lignin/NDF•Hybrid Type•Maturity •Additives
Grain ~40-45% of WPDMStover= ~55-60% of WPDM
•Avg. 42% NDF•Variable stover:grain
Whole-Plant Corn Silage
•Avg. 30% starch in WPDM•Variable grain:stover
Variable peNDF as per chop lengthAdapted from Joe Lauer, UW Madison Agronomy Dept.

Department of Dairy Science UW-Madison
Maximum yield of DM
Vegetative
growth
Optimal
stage
Flower or
Head or
Black Layer
Stage of maturity
Forage yield - quality vs. quantity
indigestible
digestible
Maximum yield of digestible DM
Dry matter yield (tons/acre)

Corn Silage Harvest Practices Influence Starch Digestibility!

Kernel Processing*Maturity
Ferraretto & Shaver, PAS 2012

Kernel Processing*TLOC
Ferraretto & Shaver, PAS 2012
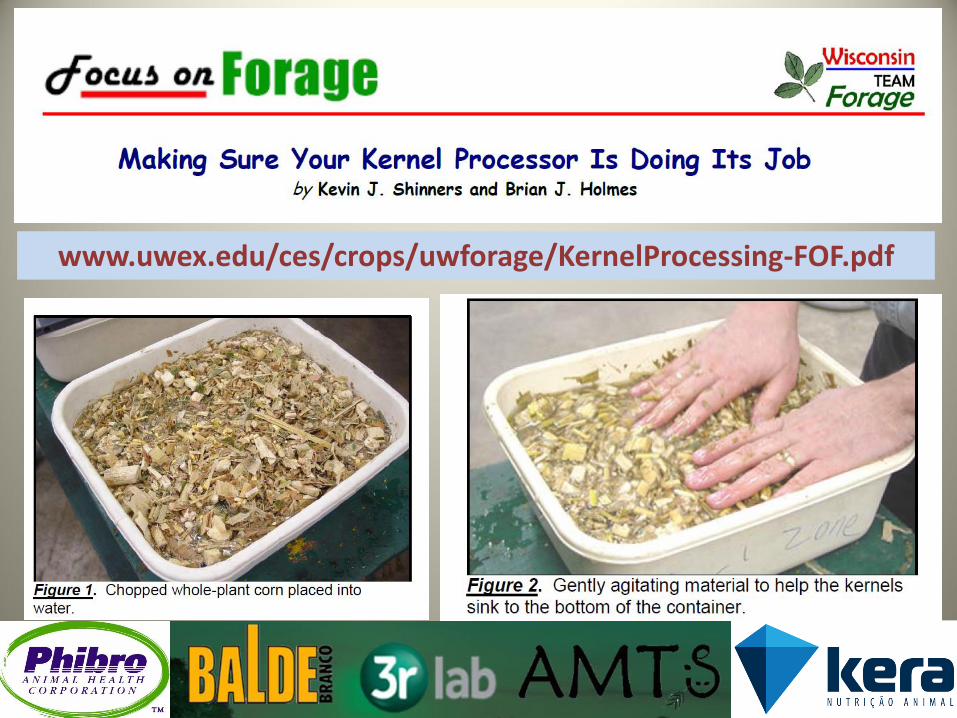
www.uwex.edu/ces/crops/uwforage/KernelProcessing-FOF.pdf


Kernel Processing Score Mertens, USDFRC
Ro-Tap Shaker
9 sieves (0.6 thru 19 mm) and pan
Analyze for starch on 4.75 mm & > sieves
% of starch passing 4.75 mm sieve
>70% 70% to 50%
< 50%
KPS
Excellent Adequate
Poor

Kernel Processing Score
∆Worth 1 kg Milk or 1 kg Corn

MN Field
Trial 1
MN Field
Trial 2
WI Field
Trial 1
Lab Survey
WI Field
Trial 2 Lab Survey
Testing Lab
Dairyland Rock River Cumberland
Valley
Year 2005 - 2007 2011 2011 -2012
2010 -2012
2010 - 2011
No. of samples 252 55 29 258 64 311 1,131
KPS - - - - - - - - - - - -% of Samples by Processing Score- - - - - - -
Excellent
10%
8%
10%
17%
17%
16%
7%
Adequate
48%
76%
55%
68%
61%
62%
51%
Poor
42%
16%
35%
15%
22%
22%
42%
Kernel Processing Score

Industry Makes Advances in Corn Silage Processing
(CVAS Data, 2006 to 2014) Crop Year
Number
Average
Percent Optimum
Percent Poor
2006 97 52.8 8.2 43.3
2007 272 52.3 9.2 37.9
2008 250 54.6 5.2 34.8
2009 244 51.1 6.1 48.0
2010 373 51.4 5.9 43.4
2011 726 55.5 12.3 33.1
2012 871 60.8 14.8 19.9
2013 2658 64.6 36.0 12.9
2014 322 61.8 24.2 9.0
Adapted from slide provided by Ralph Ward of CVAS

Shre
dlage
®
Shre
dlage
®
http://www.shredlage.com/

UW Madison Shredlage® Trials
Trial 1 Trial 2
Hybrid Dual Purpose Brown Midrib
Crop Year 2011 2013
Harvest DM 34% ± 2 38% ± 4
Ensiling Silo Bags Silo Bags
Months in Storage Before Feeding
1 4

UW Madison Shredlage® Trials
Trial 1 Trial 2
Control SHRD Control SHRD
TLOC, mm 19 30 19 26
WI-OS MPL, mm
10.4 11.2 10.0 11.4
% PSU Top 6% 32% 7% 18%
% PSU Top 2 82% 73% 75% 73%

UW Madison Shredlage® Trials
Trial 1 Trial 2
Control SHRD Control SHRD
Roll gap, mm 2 - 3 2.5 2 2
Roll Speed Differential
≈20% ≈30% ≈40% 30%-40%
Processing Score
60% ± 4
75% ± 3
68% ± 7
72% ± 4

Kernel Processing Score Samples obtained weekly during feed-out from the silo bags
UW Madison Trial 2

UW Madison Shredlage® Trials
Trial 1 Trial 2
DIM at trial start 116 d ± 36 81 d ± 8
Trial Duration, weeks 10 16
Trial Average Control Milk, kg/cow/day
43 50

UW Madison Shredlage® Trials
Shredlage Response
Trial 1 Trial 2
DMI no no
Daily Milk Yield avg. +1 kg avg. +1.2 kg
Feed Efficiency no no
Milk Composition no no
Milk Component Yields yes yes

UW Madison Shredlage® Trials
Shredlage Response
Trial 1 Trial 2
Total Tract Diet StarchD yes yes
Ruminal Silage StarchD yes yes
Total Tract Diet NDFD yes no
Ruminal Silage NDFD no? no

Corn Silage Fermentation Increases Starch Digestibility!

Results from Mini-Silo Trial
Month effect (P < 0.0001) Hybrid effect (NS) Hybrid×Month (NS)
Ferraretto et al., 2014, ADSA abstracts

Ferraretto et al., 2014, ADSA abstr.

Kernel Processing Score
vacuum sealed experimental mini silos
b
ab
a
a
56
58
60
62
64
66
68
70
0 30 120 240
% s
tarc
h p
assi
ng
thro
ugh
4.7
5 m
m
scre
en
Ensiling time, d
P = 0.08 SEM = 2.0 n = 3

Ferraretto et al., 2013 JDS Grain Meta-Analysis
A dataset comprised of 414 treatment means from 101 trials reported in 100 papers published 2000 - 2011
The reports included in this dataset were with lactating dairy cows fed TMR, and contained data for ruminal and (or) total tract starch digestibility

Cereal Grain Type Ferraretto et al., JDS, 2013
Ruminal Digestibility (% of intake)
Total Tract Digestibility (% of intake)
n Starch n Starch
Barley 30 70.6a 62 92.8
Corn 82 54.1b 335 92.6
Wheat 6 78.9a 11 93.9
P-value 0.001 0.80

All Grains Have Prolamins
Prolamin for each cereal grain have specific and historical names:
Grain Prolamin Name Prolamin Level
Wheat (gliadin) Med-Low
Barley (hordein) Low
Rye (secalin) Med-Low
Oats (avenin) Low
Corn (zein) High
Sorghum (kafirin) Very High
Copyright Patrick C. Hoffman, University of Wisconsin - Madison

Prolamins: Corn Endosperm Protein of Interest
• Prolamin Zein ( 4 Types) – άβγδ
• Form on the Starch Granule Surface
• Prolamin Proteins Can Cross-link
• Encapsulate Starch into a Matrix
• Advances with maturity – (like NDF in forages)
• Genetic differences in corn
– Floury/Opaque Corns are Missing the Y-zein Gene
– Floury/Opaque Corns are Low in Prolamins
– Flint Corns are Very High in Prolamins
– Common Corn Hybrids are Moderately-High in
Prolamins
Copyright: Patrick C. Hoffman, University of Wisconsin-Madison

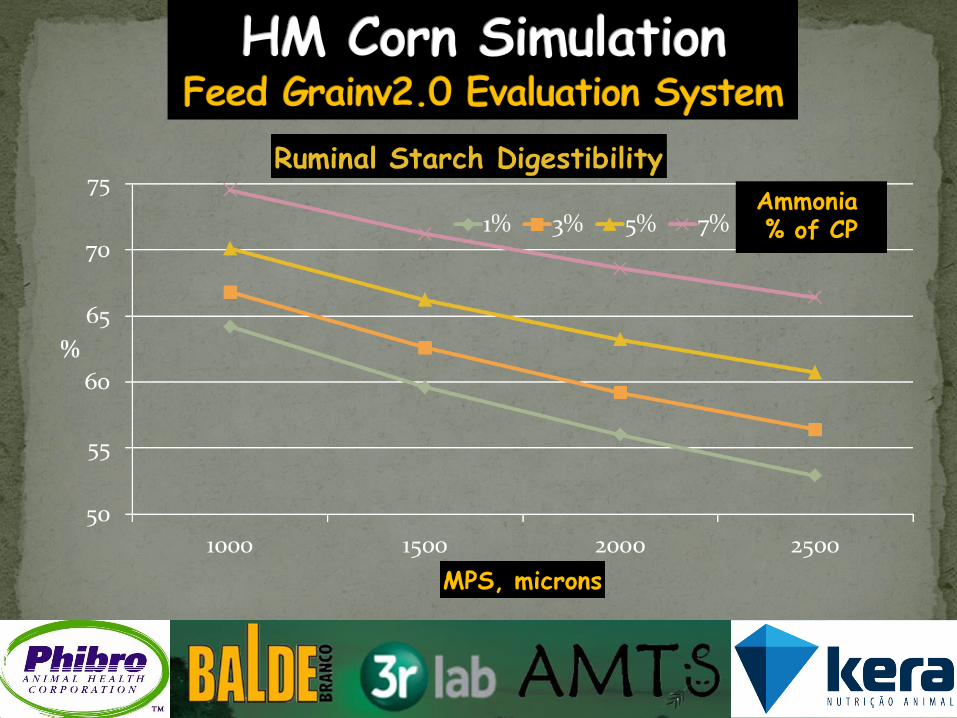
Primary Factors Influencing Starch Digestibility in Corn Grain
Processing
i.e. Particle size; Steam Treatment
Harvest/Storage i.e. Dry vs. HMC DM of HM/Maturity; Fermentation Time
Endosperm Type
i.e. Prolamin; Prolamin-starch matrix; Hardness
Adapted from Pat Hoffman, UW Madison Dairy Sci. Dept.
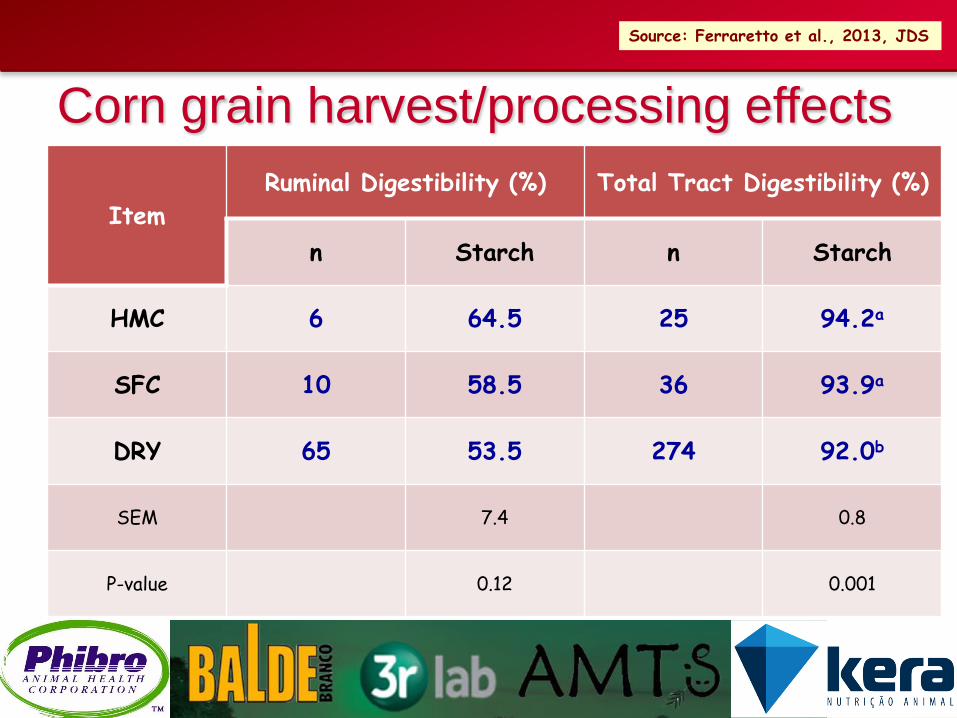
Corn grain harvest/processing effects
Item
Ruminal Digestibility (%) Total Tract Digestibility (%)
n Starch n Starch
HMC 6 64.5 25 94.2a
SFC 10 58.5 36 93.9a
DRY 65 53.5 274 92.0b
SEM 7.4 0.8
P-value 0.12 0.001
Source: Ferraretto et al., 2013, JDS

Scanning electron microscopy of starch granules in corn: A) starch granules heavily imbedded in prolamin-protein matrix, B) starch granules in opaque corn endosperm with less extensive encapsulation by prolamin-proteins (Gibbon et. al., 2003). Published with permission: Copyright (2003) National Academy of Sciences, U.S.A.
Vitreous Endosperm Floury Endosperm
The Starch-Protein Matrix Copyright: Patrick C. Hoffman, University of Wisconsin-Madison
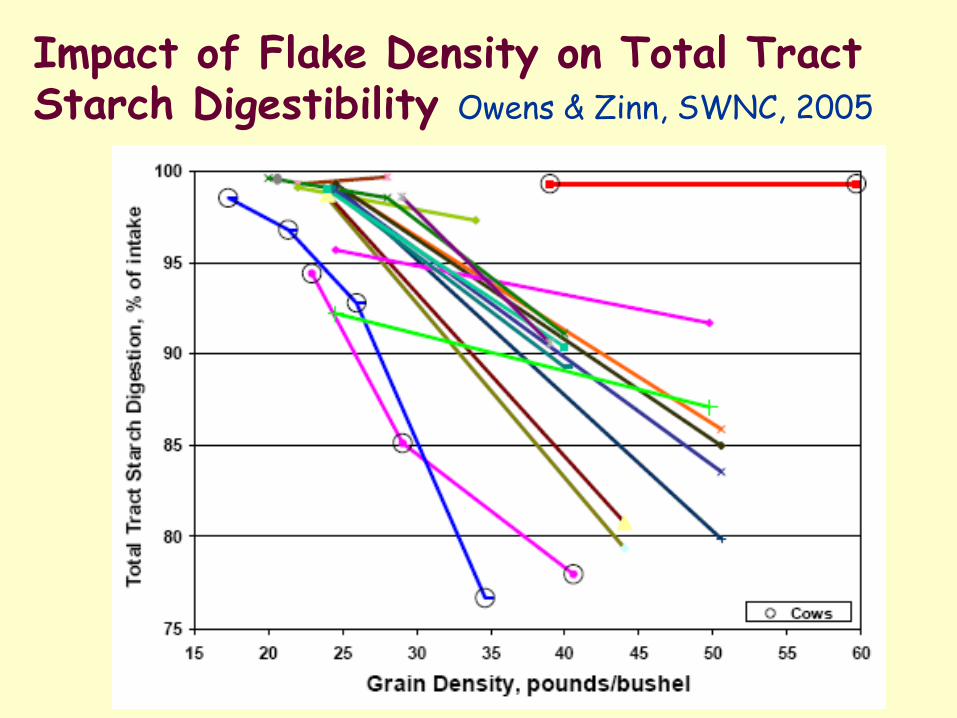
Impact of Flake Density on Total Tract Starch Digestibility Owens & Zinn, SWNC, 2005

Corn Grain MPS - DRY
Geometric Mean Particle Size (µm)
a a
Ferraretto et al., 2013, JDS


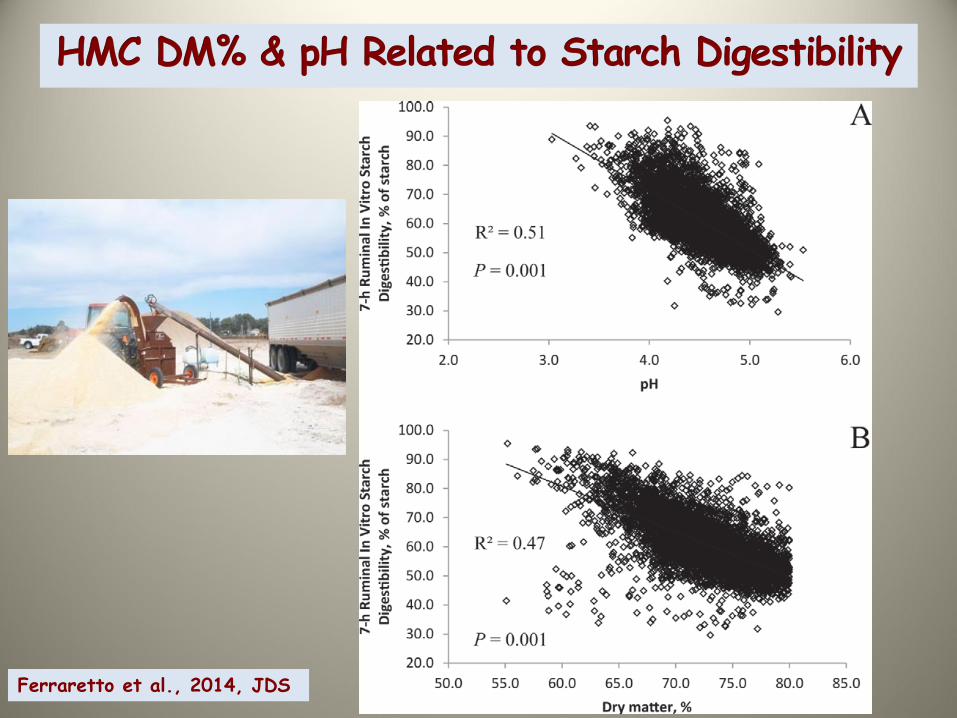
Ferraretto et al., 2014, JDS

Ferraretto et al., 2014, JDS


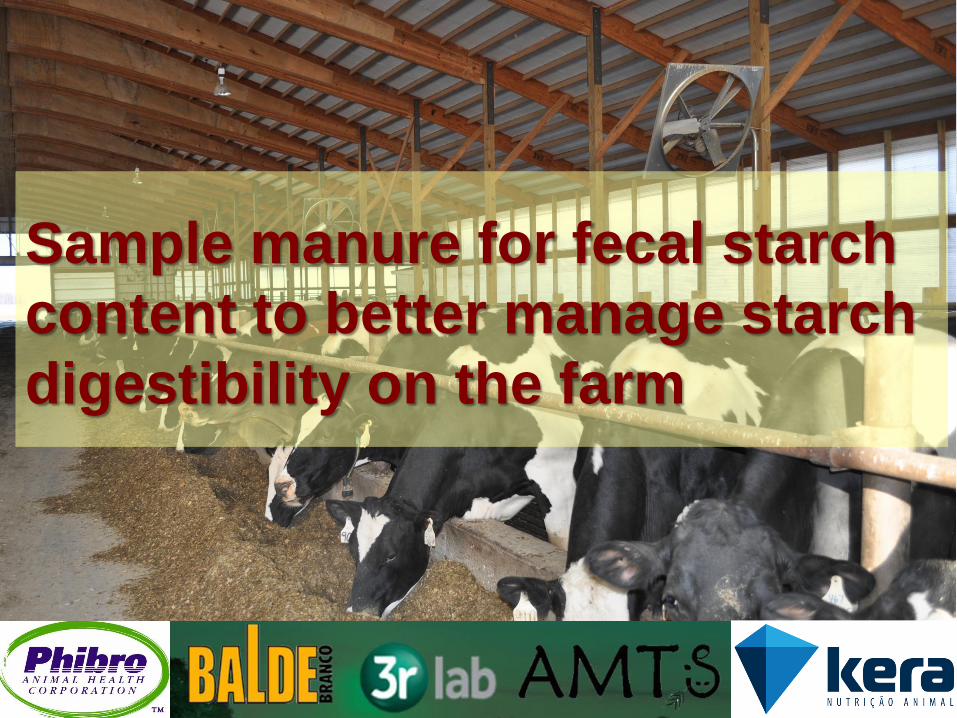
Sample manure for fecal starch
content to better manage starch
digestibility on the farm
Source Image: http://dairyinnovation.files.wordpress.com/2010/10/dsc_0083.jpg
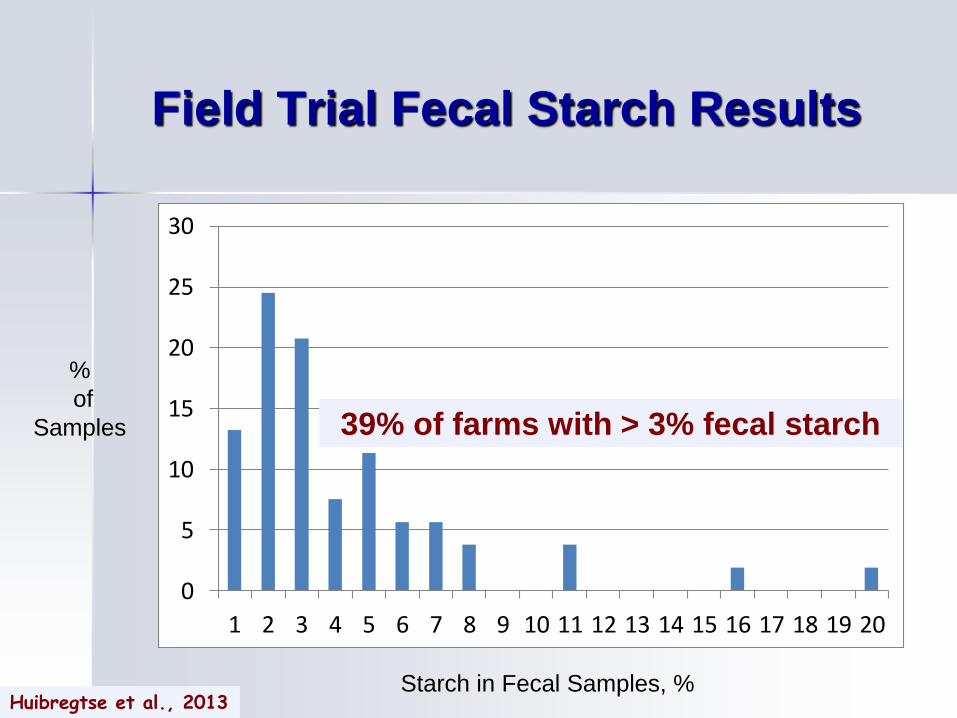
Field Trial Fecal Starch Results
0
5
10
15
20
25
30
1 2 3 4 5 6 7 8 9 10 11 12 13 14 15 16 17 18 19 20
Starch in Fecal Samples, %
%
of
Samples 39% of farms with > 3% fecal starch
Huibregtse et al., 2013
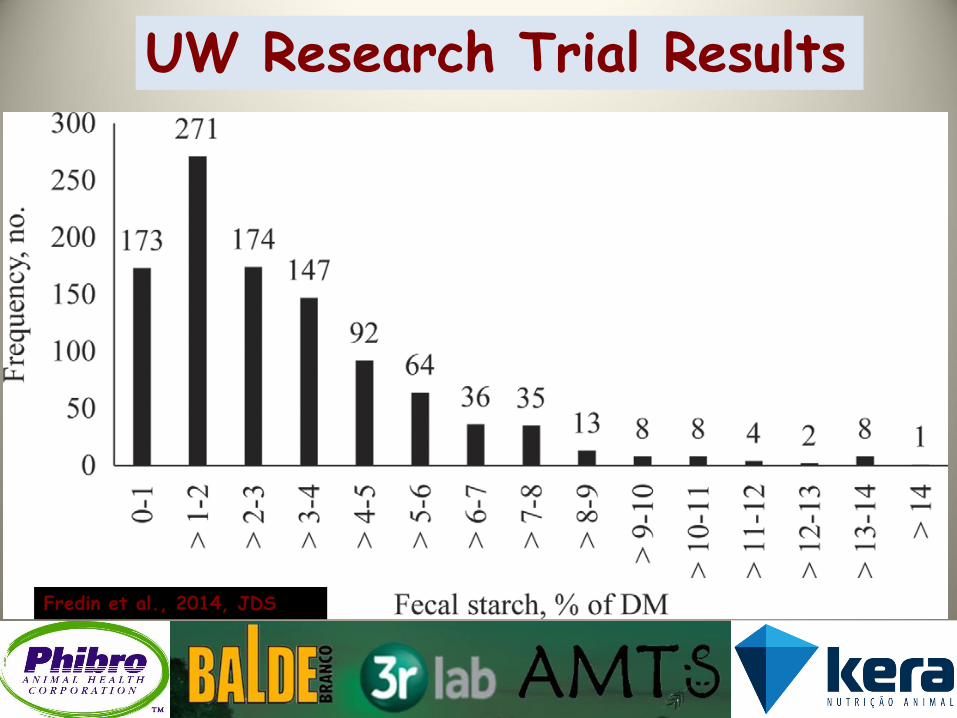
UW Research Trial Results
31% of samples with > 3% fecal starch
Fredin et al., 2014, JDS

TTSD % = 100.0% - (1.25 X fecal starch %)
564 samples
P < 0.001
R² = 0.94
Fredin et al., 2014, JDS

Utility of On-Farm Fecal Starch?
Can be used to predict total tract starch digestibility from available equation Monitor specific group over time
Reflects total diet, not specific feedstuffs!
If <3% starch in feces no need to investigate feeds
If >3% should evaluate specific starchy feedstuffs

Sample collection and submittal 8 – 10 animals per sample submitted
◦ Preferably fresh sample
If a dietary or management change occurs, re-evaluate minimum of 2-3 weeks later
Keep samples cool
◦ Fecal starch decreased by 24% in non-cooled samples (Haerr et al., 2014)
◦ 5.4% for cold sample vs. 4.1% for ambient temp sample
◦ Ideally, submit samples that are kept cold!
Slide provided by Shane Fredin of Miner Inst.

Ruminal In-Vitro StarchD

Ruminal ivStarchD Issues Sample incubation length
• 3 & 7 h common
• Ignores Kp and Kd differences
Incubation sample particle size • 2-6 mm grind common
• Masks effects of client’s feed particle size
Diet of Rumen Fluid Donor vs. Client Herd • Starch content and source affects amylase
activity and starch digestibility
Diet of Rumen Fluid Donor vs. Client Herd
NIRS calibrations ?

Ruminal ivStarchD Utility Indexing feedstuffs
• i.e. High, Mid, Low Determine population of lab samples
Interventions – i.e. finer corn processing
Ration adjustments - i.e. feeding more or less corn
Adjusting calculated feedstuff energy values for ration formulation • How to predict TT StarchD from Ruminal ivStarchD?
• NRC-2001 PAF?
Basing ration adjustments on intake of rumen digestible starch? • e.g. 15 DM lb. Corn-A x 70% starch x 60% ivStarchD = 6.3 lb.
• If Corn-B 70% starch & 75% ivStarchD, then 6.3/(0.70×0.75) =
12 DM lb. Corn-B

Questions?

12 de agosto 19:00
(segunda quarta feira do mês)
Rick Grant – PhD – Instituto Miner
O que aprendemos das pesquisas realizadas no Instituto
Miner . Foco em nutrição aplicada na fazenda.

Sua empresa pode ser parceira no próximo Webinar.
Ajude-nos a trazer aos nutricionistas Brasileiros o que
existe de mais novo em nutrição de vacas leiteiras no
mundo.
11 - 999756429

Cadastre-se nos nossos meios de comunicação para
receber os slides em português e o Webinar
gravado:
http://3rlab.wordpress.com/
https://www.facebook.com/3rlab
Excelente material para treinamento de equipes/grupos de estudos

0
10
20
30
40
50
60
70
80
90
100
Pego amostrae posso dizer
Uso técnicado "baldecom água"
Faço KPS Se não tivergrãos nasfezes esta
bom
Utilizo auto-motriz, elasprocessam
bem
Brasil
EUA
Argentina
Processamento do “grão” da SM

0
10
20
30
40
50
60
70
80
90
100
Não tenhorecomendação
(> 19 mm) (> 12 mm e <= 19mm)
(< = 12 mm) Se processado 19mm senão 9 mm
Brasil
EUA
Argentina
Comprimento de corte (TLOC)

0
10
20
30
40
50
60
70
80
90
100
Quebro omilho empedaços,
muito fino éproblema
Menor que omoinho pode
moer
Amido fecal éo meu guia
Menor que2000 µm
Menor que1000 µm
Brasil
EUA
Argentina
Tamanho de partícula para milho moido

0
10
20
30
40
50
60
70
80
90
100
Nunca Quando oleite cai
Uma vez aomês
Quandoabrimos silo
Quandomudo
ingredientesna dieta
Brasil
EUA
Argentina
Frequência de análise de amido fecal


