Webinar: Initial findings of legal & 2 monitoring for ...
37
ACT on Offshore Monitoring Webinar: Initial findings of legal & technical requirements of CO 2 monitoring for Carbon Capture and Storage (CCS)
Transcript of Webinar: Initial findings of legal & 2 monitoring for ...
ACT on Offshore Monitoring
Webinar: Initial findings of legal & technical requirements of CO2 monitoring
for Carbon Capture and Storage (CCS)

Moderator

Acknowledgements
This project, ACTOM, is funded through the ACT programme (Accelerating CCS Technologies, Horizon2020 Project No 294766). Financial contributions made from; The Research Council of Norway, (RCN), Norway, Netherlands Enterprise Agency (RVO), Netherlands, Department for Business, Energy & Industrial Strategy (BEIS) together with extra funding from NERC and EPSRC research councils, United Kingdom, US-Department of Energy (US-DOE), USA.
www.act-ccs.eu
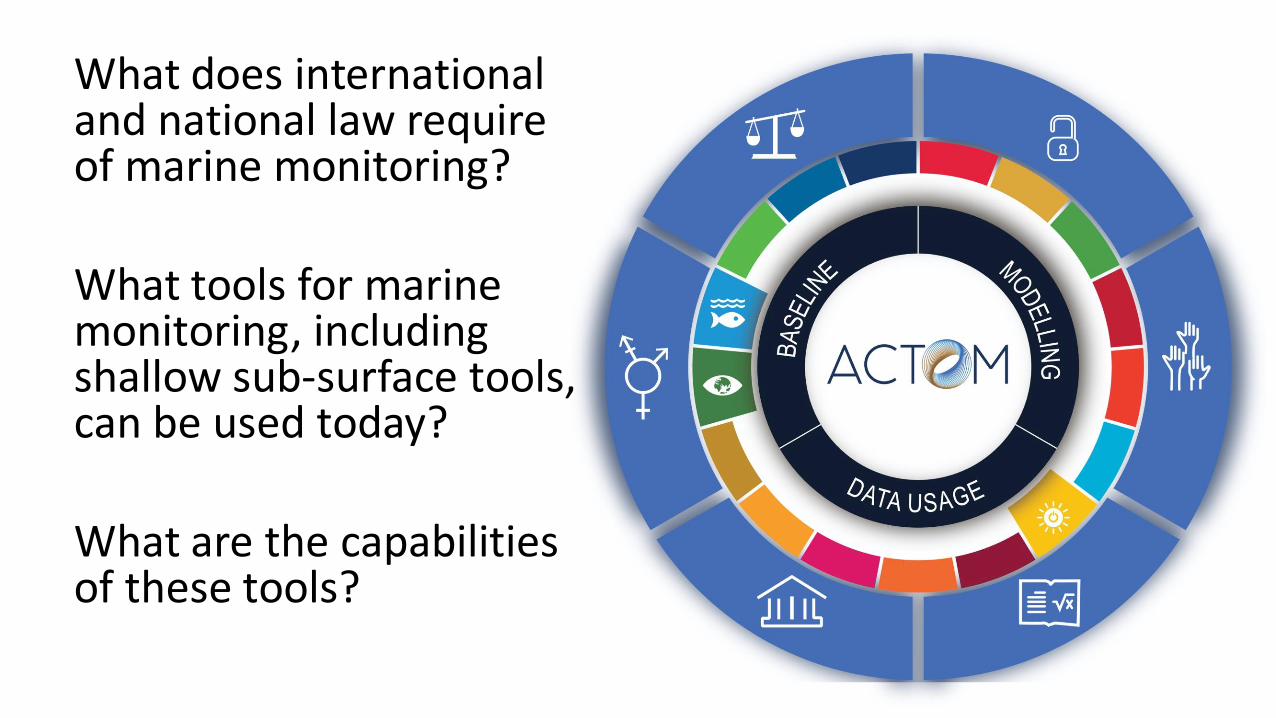
What does international and national law require of marine monitoring?
What tools for marine monitoring, including shallow sub-surface tools, can be used today?
What are the capabilities of these tools?
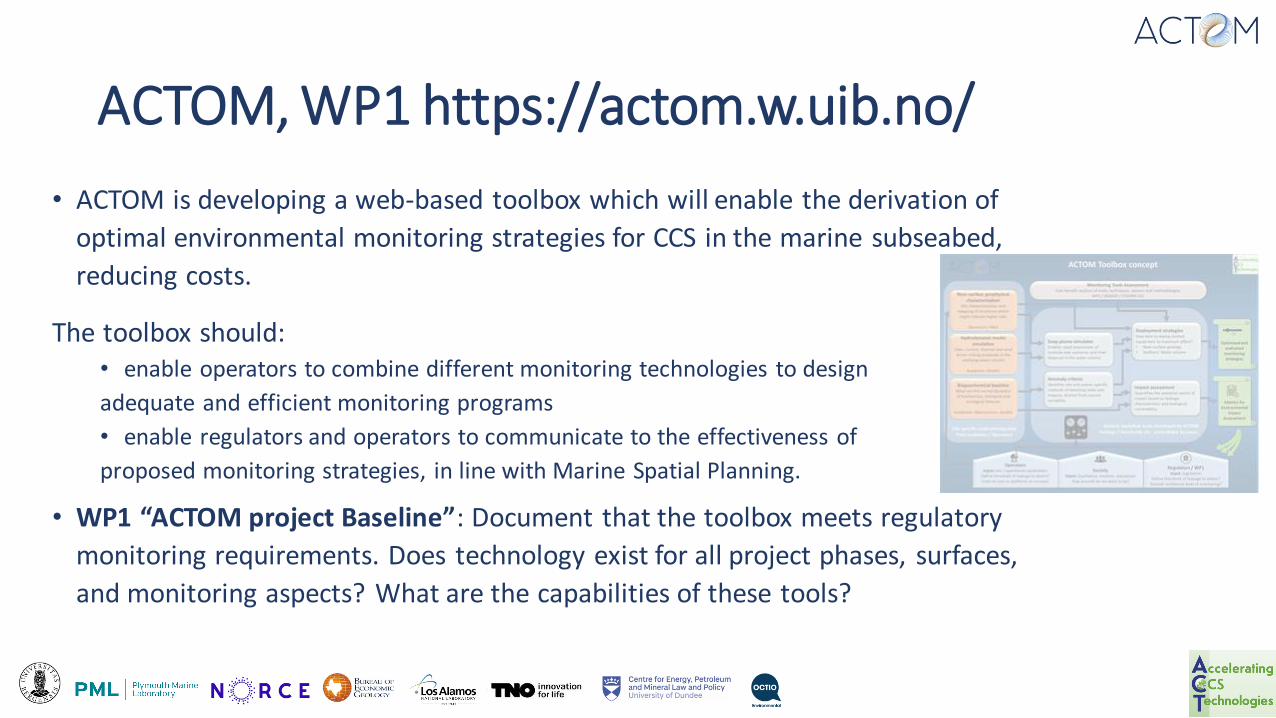
ACTOM, WP1 https://actom.w.uib.no/
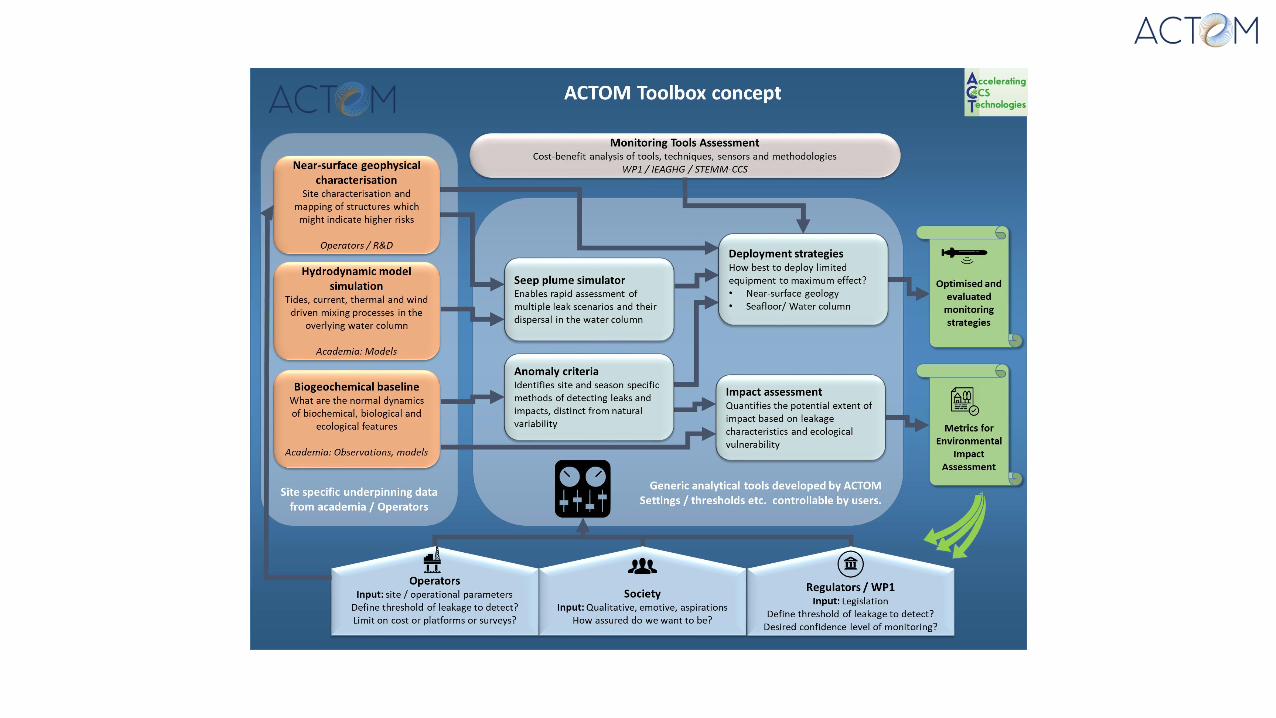
• ACTOM is developing a web-based toolbox which will enable the derivation of
optimal environmental monitoring strategies for CCS in the marine subseabed,
reducing costs.
The toolbox should:• enable operators to combine different monitoring technologies to design
adequate and efficient monitoring programs
• enable regulators and operators to communicate to the effectiveness of
proposed monitoring strategies, in line with Marine Spatial Planning.
• WP1 “ACTOM project Baseline”: Document that the toolbox meets regulatory
monitoring requirements. Does technology exist for all project phases, surfaces,
and monitoring aspects? What are the capabilities of these tools?

WebinarProgram

Part 1: CCS Regulatory Frameworks
What does international and national law require of marine monitoring?

Are there any minimum legal requirements or
precise descriptive requirements for
monitoring and monitoring technologies?
Global CCS Institute, Legal-and-Regulatory-Indicator2018
What does international and national law require of marine monitoring?
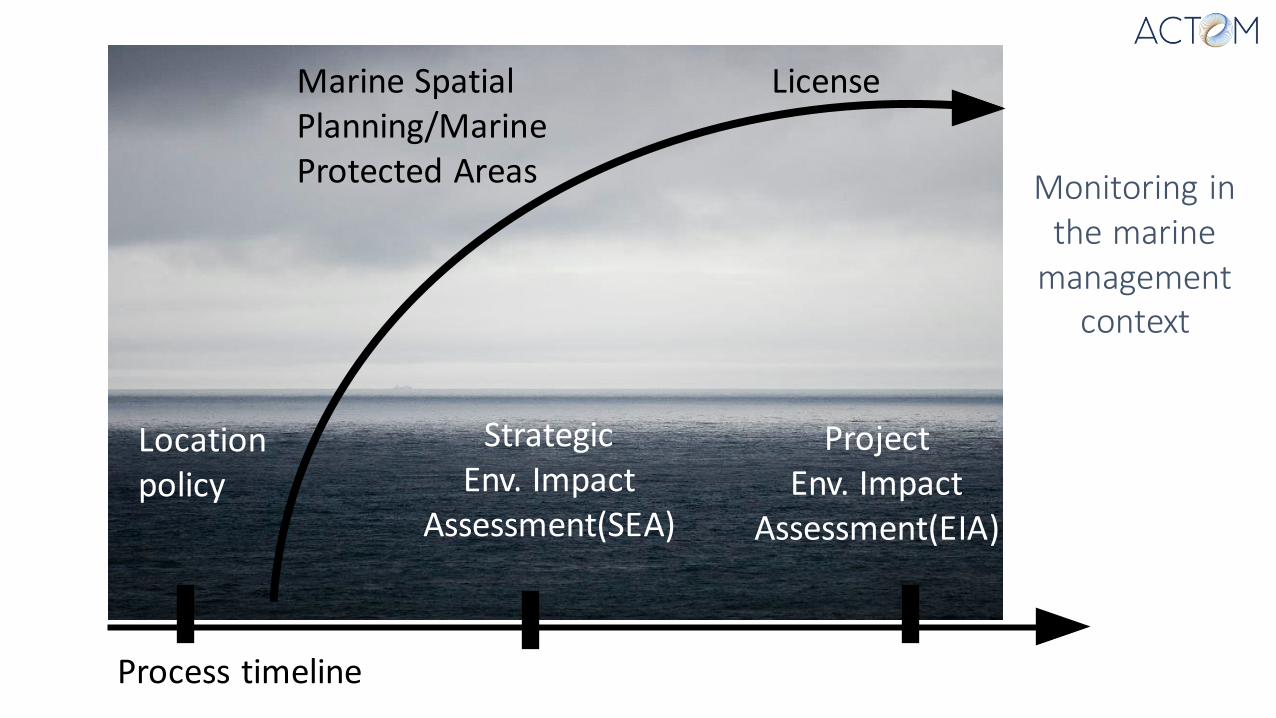
LicenseMarine Spatial Planning/Marine Protected Areas
Location policy
Strategic Env. Impact
Assessment(SEA)
ProjectEnv. Impact
Assessment(EIA)
Process timeline
Monitoring in the marine
management context

Regulatory approach
• Command and control (top-down); involve a centralised authority, usually wielding legal powers of inspection and sanction, to oversee the sector. CCS-regulation bear these traits.
• Reflexive regulation; facilitate a close linkage between the latest scientific knowledge on the condition and functioning of the marine environment on the one hand, and the management of human activities at sea on the other.
• Co-production; the particular monitoring elements of the regulation could better be characterized as co-production (bottom-up); flexible principle-based regimes and with reflexive and adaptive management-instruments.

Global and Regional Regulations
• The IPCC Guidelines for National Greenhouse Gas Inventories (IPCC, 2006).
• The United Nations Framework Convention on Climate Change (UNFCCC) Clean Development Mechanism(CDM) Modalitiesand Procedures (for developing countries).
• The London Convention and Protocol, regional instruments like the European Union (EU) CCS Directive andEmission Trading Scheme (ETS) Directive and the United States Environmental Protection Agency (US EPA)Final Rules.
The Guidelines;
• “The suitability and efficacy of these [monitoring] technologies can be strongly influenced by the geology … so the choice of monitoring technologies will need to be made on a site-by-site basis.
• Monitoring technologies are advancing rapidly and it would be good practice to keep up to date on new technologies.”

Regional & EU Directive, example
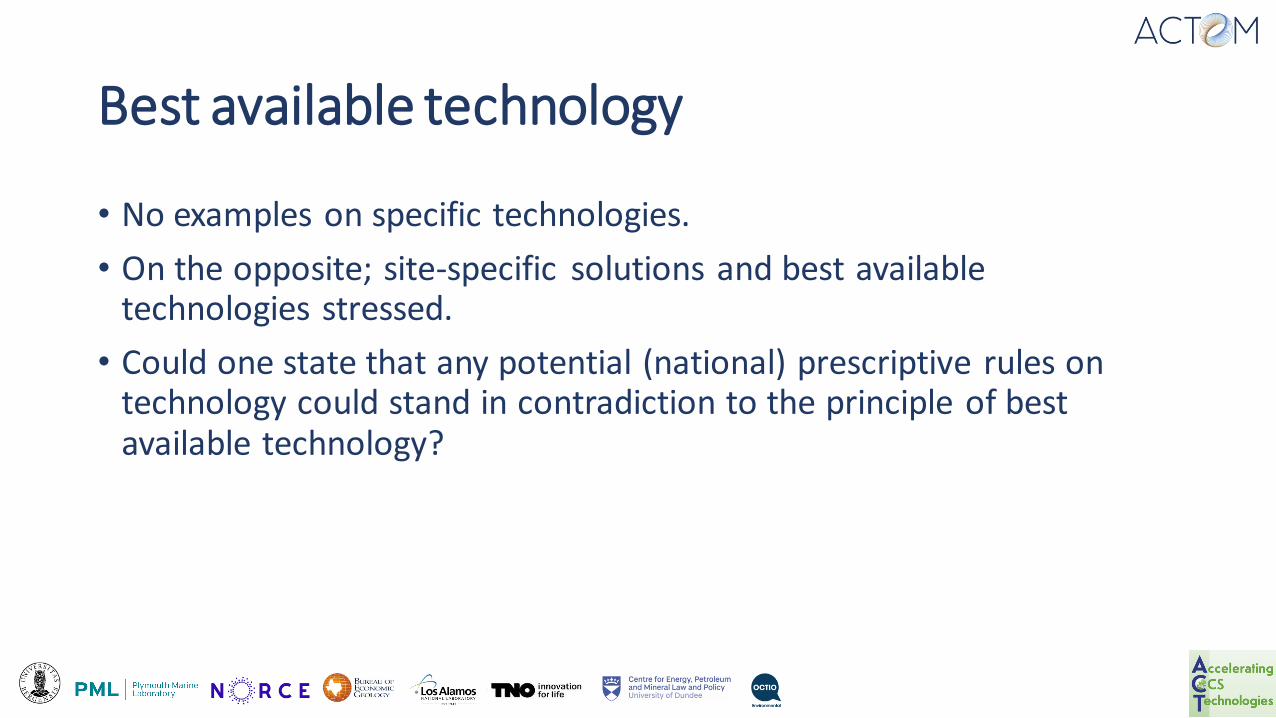
Best available technology
• No examples on specific technologies.
• On the opposite; site-specific solutions and best available technologies stressed.
• Could one state that any potential (national) prescriptive rules on technology could stand in contradiction to the principle of best available technology?

Summary 1
• Globally the guidelines and regulations are based on the principles of
• best available practice
• best available technology
• recognition of the fact that monitoring needs to be site-specific
• in EU, a level playing field/disturbance of competiton are arguments that further supports this approach of technology-neutrality in prescriptive rules.
• designing the monitoring program could be regarded as co-production
-
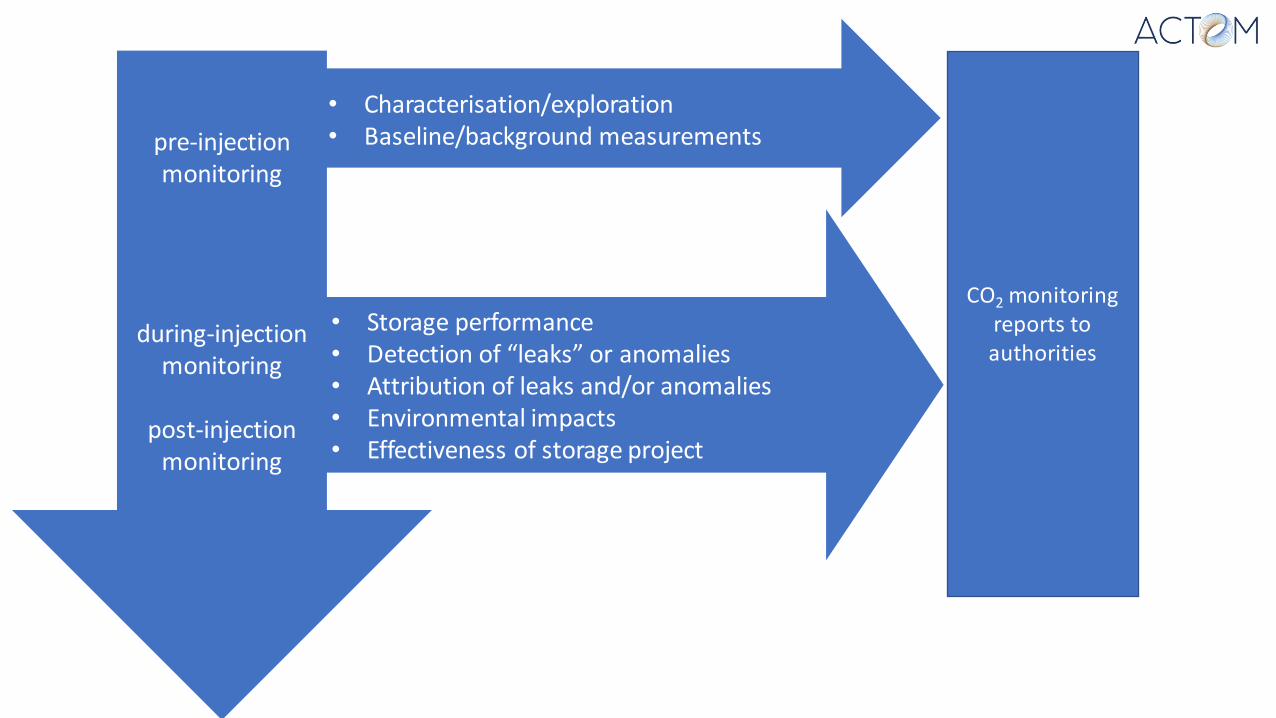
• Storage performance• Detection of “leaks” or anomalies• Attribution of leaks and/or anomalies• Environmental impacts• Effectiveness of storage project
pre-injection monitoring
during-injection monitoring
post-injection monitoring
• Characterisation/exploration• Baseline/background measurements
CO2 monitoring reports to authorities

Summary 2• Global, regional and national regulation and guidelines identifies
different monitoring phases; pre injection monitoring, during and after. Monitoring relates to different parameters and monitoring aimsin these respective phases (Dixon and Romanak 2015). In some circumstances terminology differs.
• Thus, monitoring phases with respective aims are recommended (soft law, guidelines) or mandatory (hard law, prescribed).
• Our presumption is that existing and future national regulation could potentially relate to all these phases and prescribe all these monitoring aims. An online monitoring tool needs to be able to address these phases and aims, to be relevant in all jurisdictions globally.
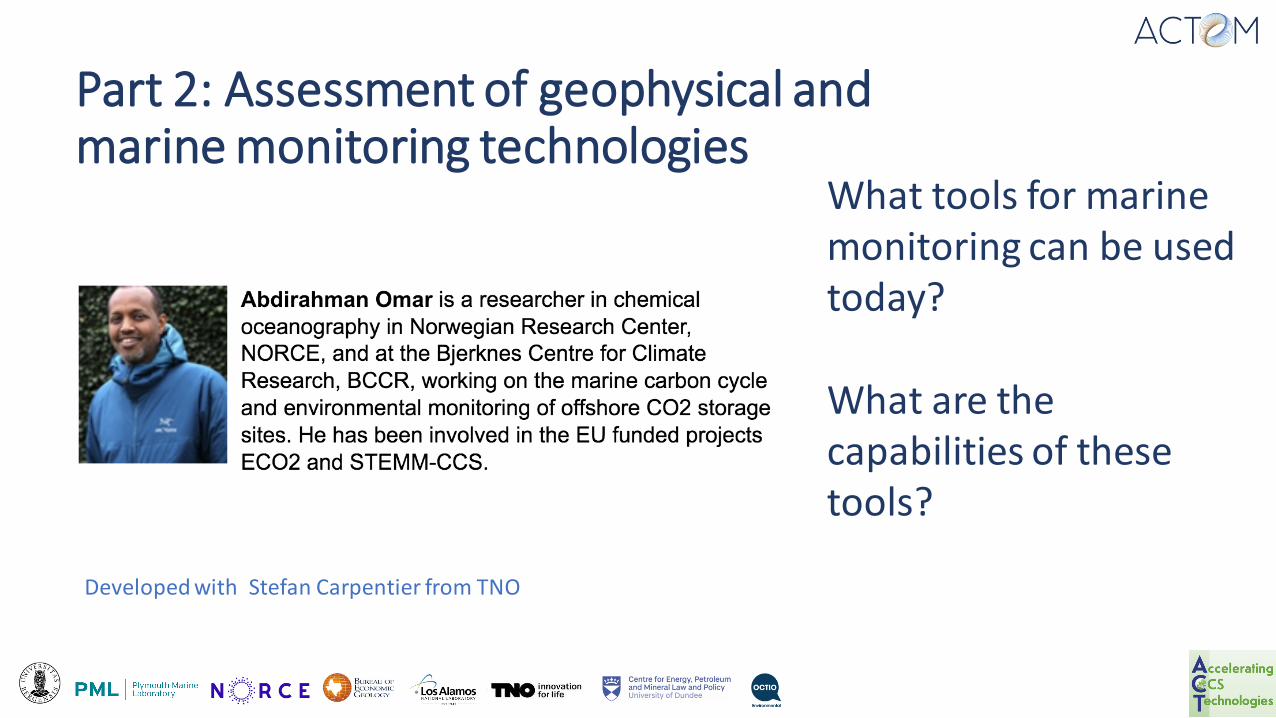
Part 2: Assessment of geophysical and marine monitoring technologies
What tools for marine monitoring can be used today?
What are the capabilities of these tools?
Developed with Stefan Carpentier from TNO
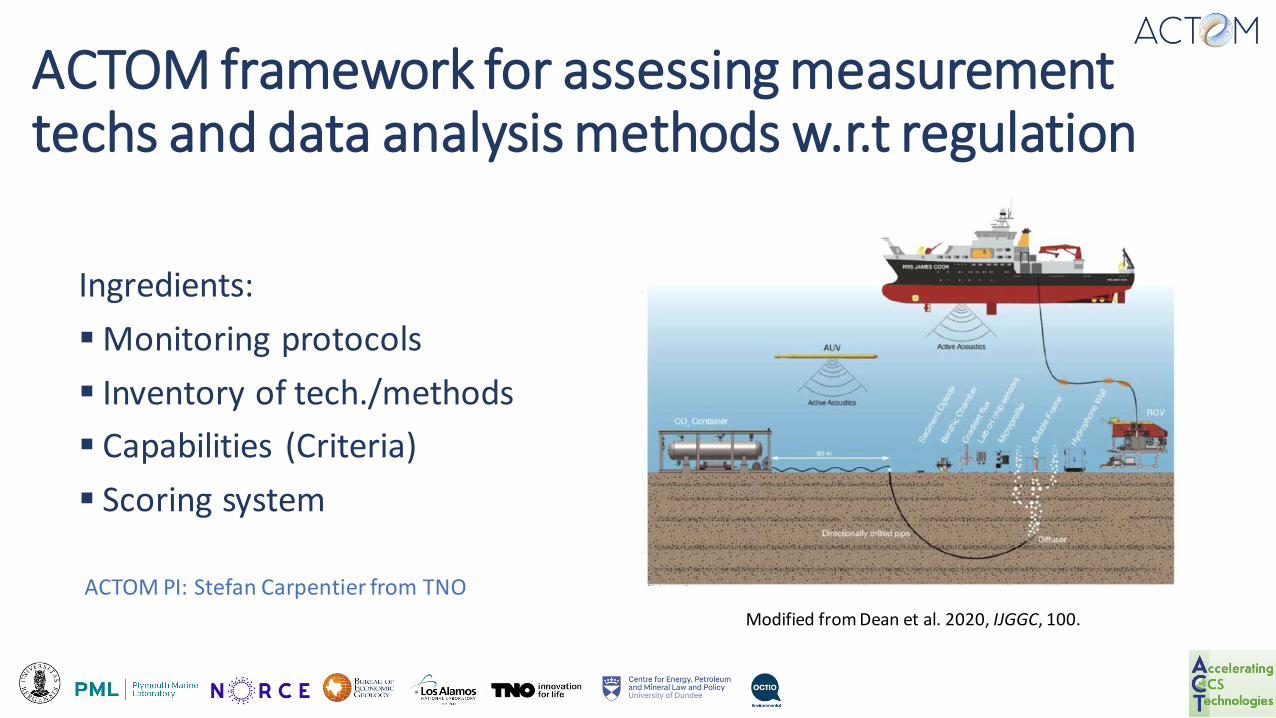
ACTOM framework for assessing measurement techs and data analysis methods w.r.t regulation
Ingredients:
▪ Monitoring protocols
▪ Inventory of tech./methods
▪ Capabilities (Criteria)
▪ Scoring system
Modified from Dean et al. 2020, IJGGC, 100.
ACTOM PI: Stefan Carpentier from TNO
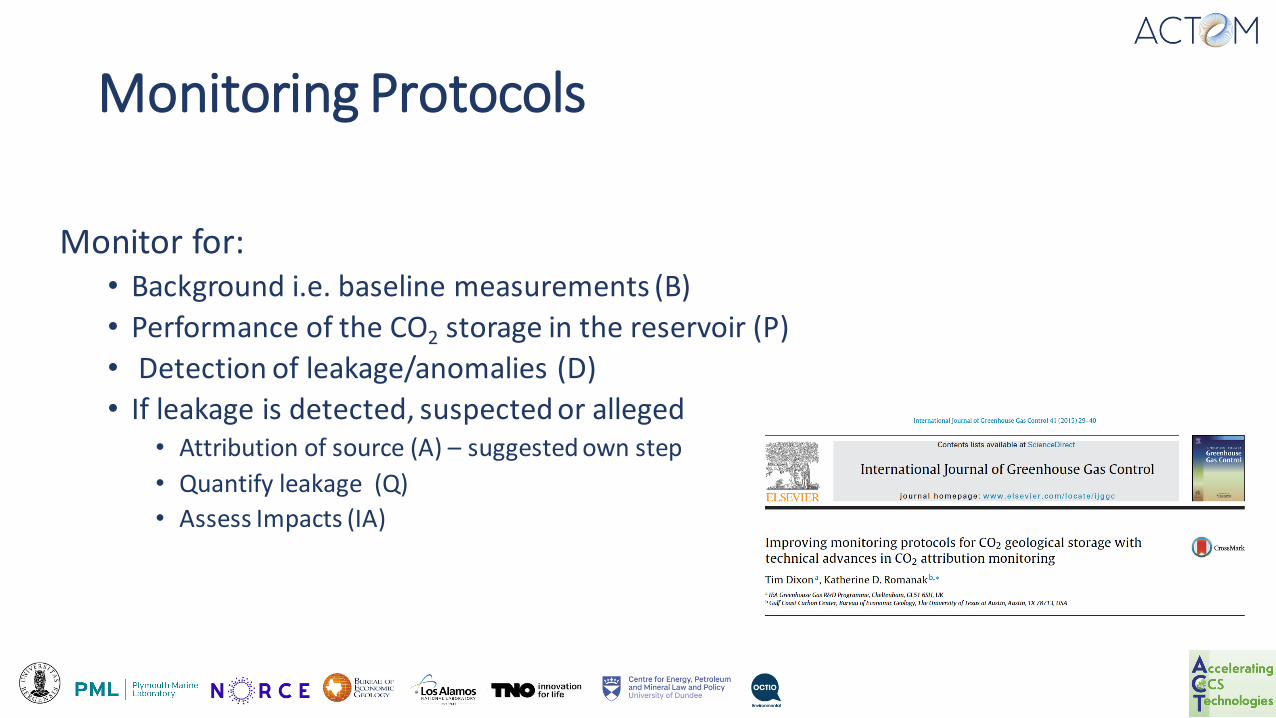
Monitoring Protocols
Monitor for: • Background i.e. baseline measurements (B)
• Performance of the CO2 storage in the reservoir (P)
• Detection of leakage/anomalies (D)
• If leakage is detected, suspected or alleged• Attribution of source (A) – suggested own step
• Quantify leakage (Q)
• Assess Impacts (IA)
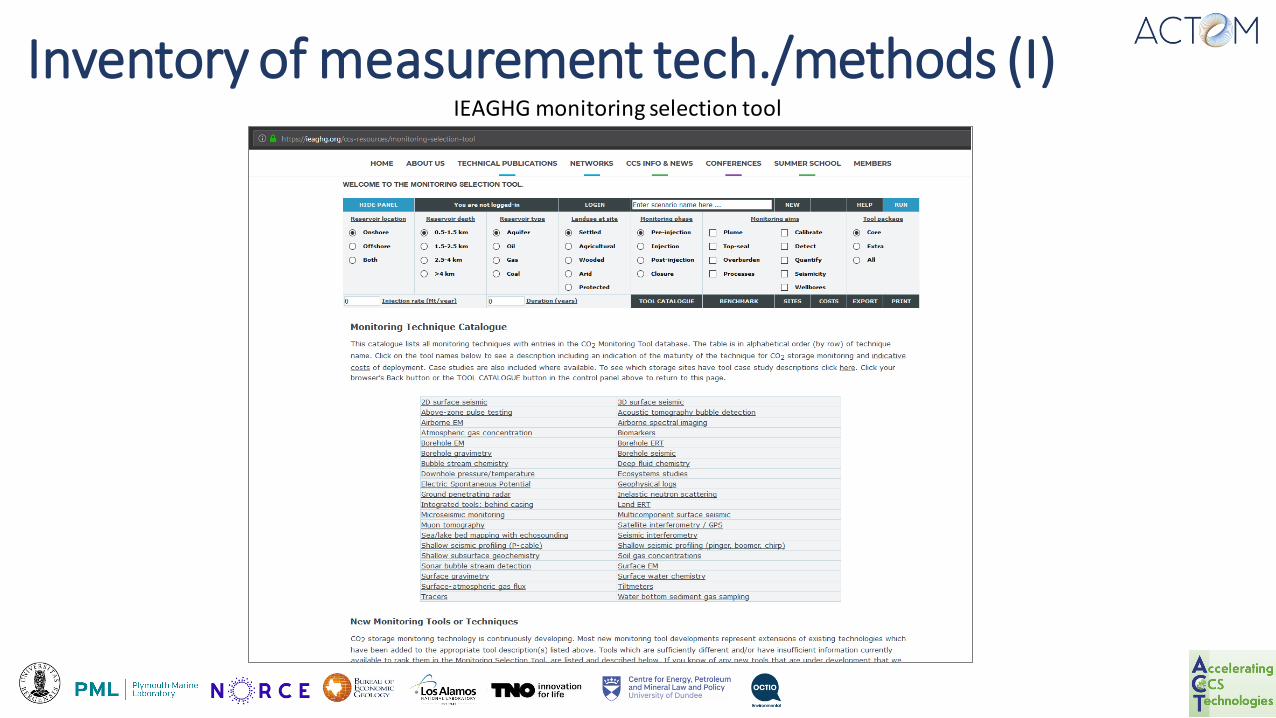
Inventory of measurement tech./methods (I)IEAGHG monitoring selection tool
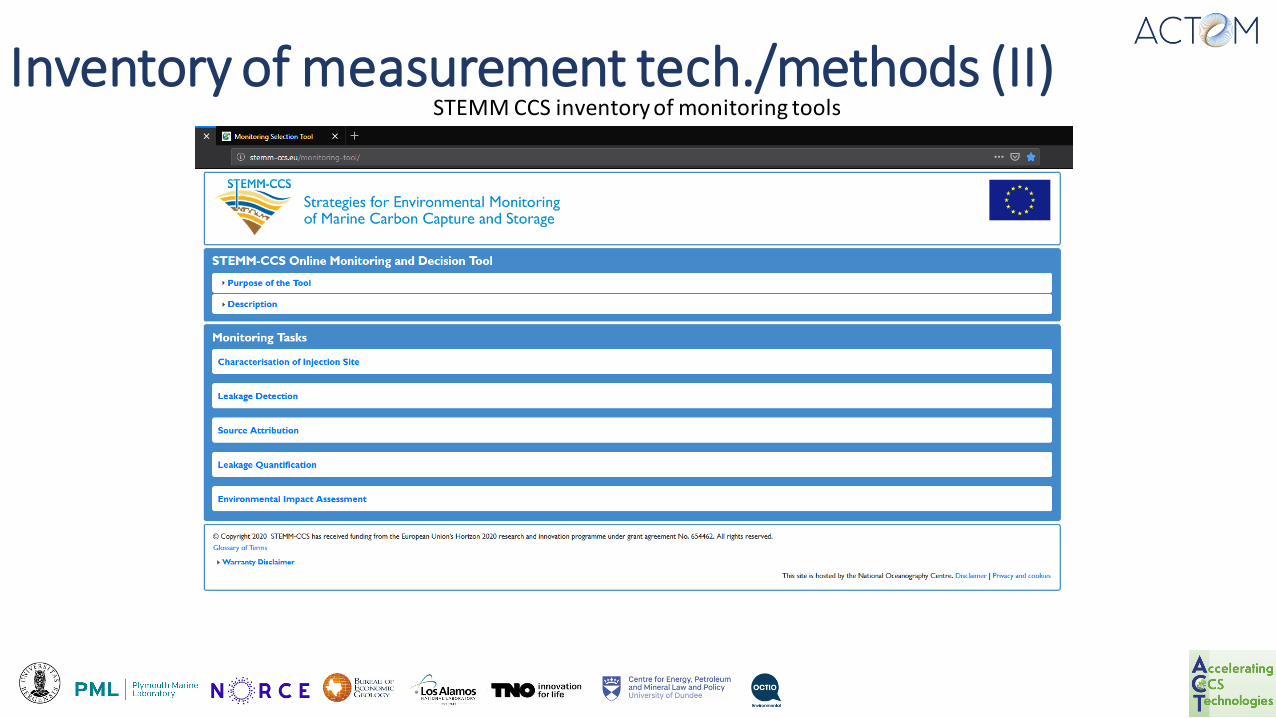
Inventory of measurement tech./methods (II)STEMM CCS inventory of monitoring tools
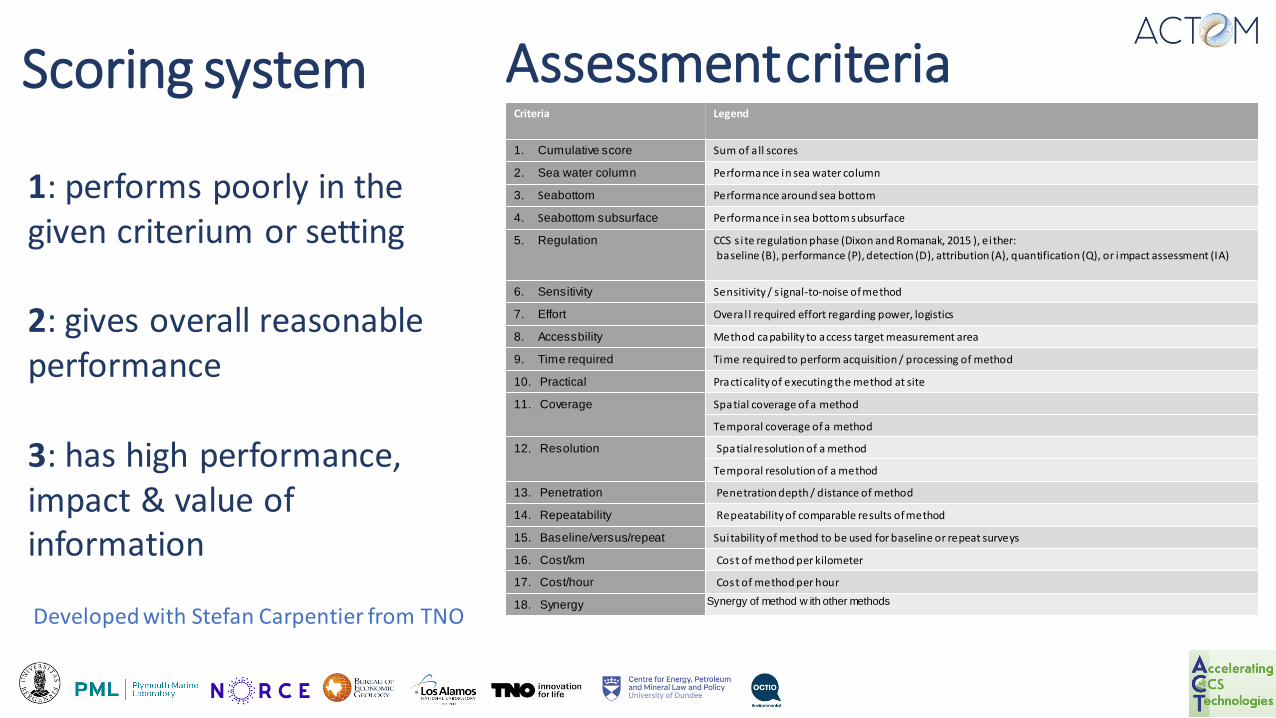
Scoring systemCriteria Legend
1. Cumulative score Sum of a ll scores
2. Sea water column Performance in sea water column
3. Seabottom Performance around sea bottom
4. Seabottom subsurface Performance in sea bottom subsurface
5. Regulation CCS s i te regulation phase (Dixon and Romanak, 2015 ), ei ther:baseline (B), performance (P), detection (D), attribution (A), quantification (Q), or impact assessment (IA)
6. Sensitivity Sensitivity / s ignal-to-noise of method
7. Effort Overal l required effort regarding power, logistics
8. Accessbility Method capability to access target measurement area
9. Time required Time required to perform acquisition / processing of method
10. Practical Practicality of executing the method at site
11. Coverage Spatial coverage of a method
Temporal coverage of a method
12. Resolution Spatial resolution of a method
Temporal resolution of a method
13. Penetration Penetration depth / distance of method
14. Repeatability Repeatability of comparable results of method
15. Baseline/versus/repeat Suitability of method to be used for baseline or repeat surveys
16. Cost/km Cost of method per kilometer
17. Cost/hour Cost of method per hour
18. Synergy Synergy of method w ith other methods
Assessmentcriteria
1: performs poorly in the given criterium or setting
2: gives overall reasonable performance
3: has high performance, impact & value of information
Developed with Stefan Carpentier from TNO
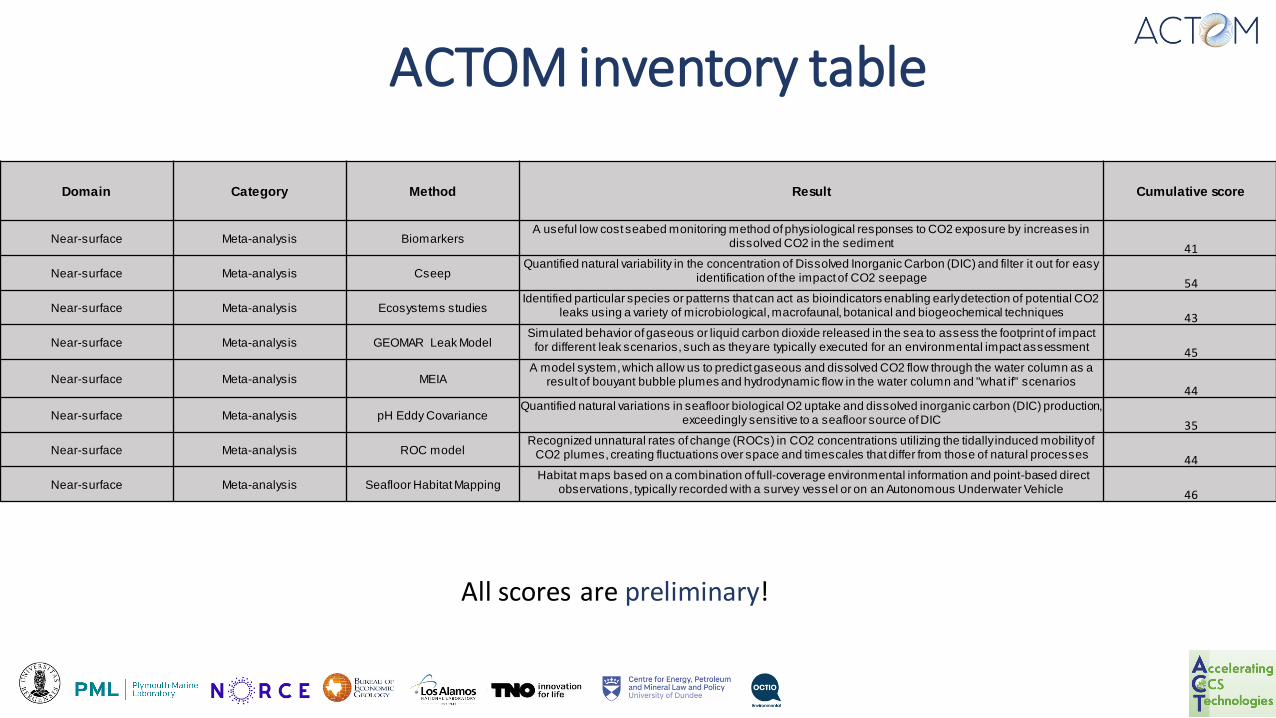
ACTOM inventory table
Domain Category Method Result Cumulative score
Near-surface Meta-analysis BiomarkersA useful low cost seabed monitoring method of physiological responses to CO2 exposure by increases in
dissolved CO2 in the sediment 41
Near-surface Meta-analysis CseepQuantified natural variability in the concentration of Dissolved Inorganic Carbon (DIC) and filter it out for easy
identification of the impact of CO2 seepage 54
Near-surface Meta-analysis Ecosystems studiesIdentified particular species or patterns that can act as bioindicators enabling early detection of potential CO2
leaks using a variety of microbiological, macrofaunal, botanical and biogeochemical techniques 43
Near-surface Meta-analysis GEOMAR Leak ModelSimulated behavior of gaseous or liquid carbon dioxide released in the sea to assess the footprint of impact
for different leak scenarios, such as they are typically executed for an environmental impact assessment 45
Near-surface Meta-analysis MEIAA model system, which allow us to predict gaseous and dissolved CO2 flow through the water column as a
result of bouyant bubble plumes and hydrodynamic flow in the water column and "what if" scenarios44
Near-surface Meta-analysis pH Eddy CovarianceQuantified natural variations in seafloor biological O2 uptake and dissolved inorganic carbon (DIC) production,
exceedingly sensitive to a seafloor source of DIC 35
Near-surface Meta-analysis ROC modelRecognized unnatural rates of change (ROCs) in CO2 concentrations utilizing the tidally induced mobility of
CO2 plumes, creating fluctuations over space and timescales that differ from those of natural processes 44
Near-surface Meta-analysis Seafloor Habitat MappingHabitat maps based on a combination of full-coverage environmental information and point-based direct
observations, typically recorded with a survey vessel or on an Autonomous Underwater Vehicle 46
All scores are preliminary!
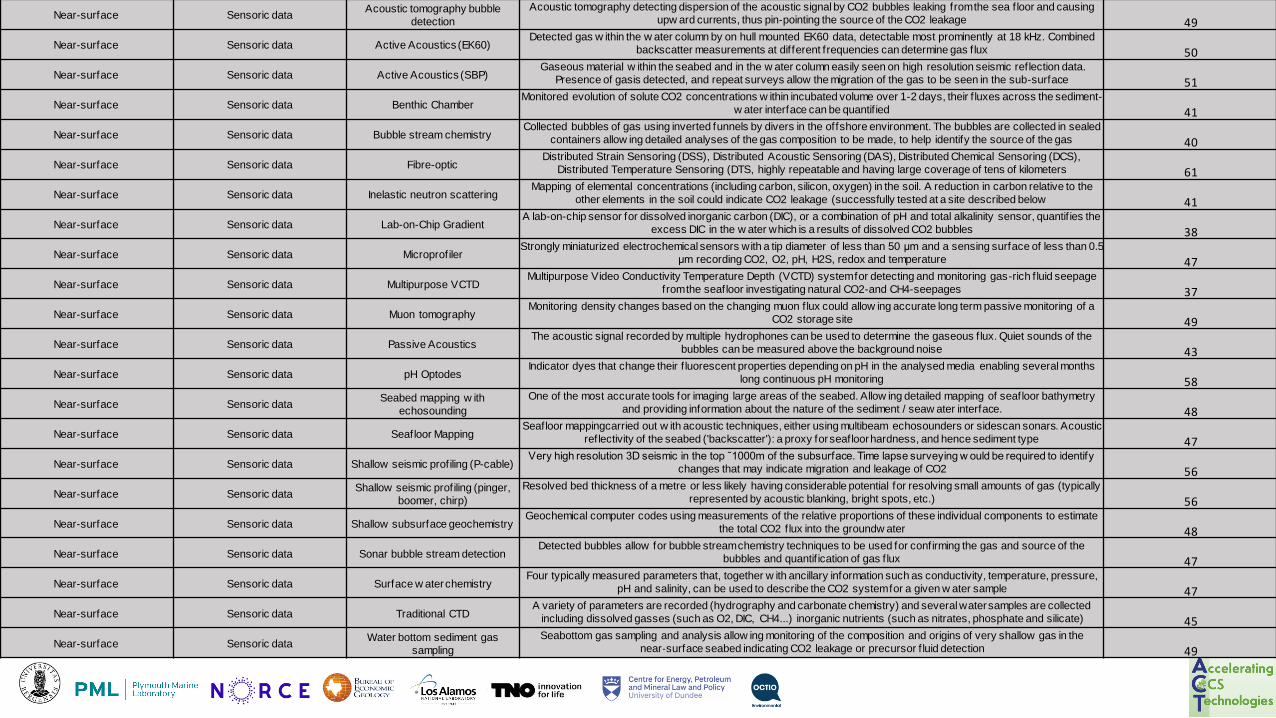
ACTOM inventory table of monitoring technologies and methods
Near-surface Sensoric dataAcoustic tomography bubble
detection
Acoustic tomography detecting dispersion of the acoustic signal by CO2 bubbles leaking from the sea f loor and causing
upw ard currents, thus pin‐pointing the source of the CO2 leakage 49
Near-surface Sensoric data Active Acoustics (EK60)Detected gas w ithin the w ater column by on hull mounted EK60 data, detectable most prominently at 18 kHz. Combined
backscatter measurements at different frequencies can determine gas f lux 50
Near-surface Sensoric data Active Acoustics (SBP)Gaseous material w ithin the seabed and in the w ater column easily seen on high resolution seismic reflection data.
Presence of gasis detected, and repeat surveys allow the migration of the gas to be seen in the sub-surface 51
Near-surface Sensoric data Benthic ChamberMonitored evolution of solute CO2 concentrations w ithin incubated volume over 1-2 days, their f luxes across the sediment-
w ater interface can be quantif ied 41
Near-surface Sensoric data Bubble stream chemistryCollected bubbles of gas using inverted funnels by divers in the offshore environment. The bubbles are collected in sealed
containers allow ing detailed analyses of the gas composition to be made, to help identify the source of the gas 40
Near-surface Sensoric data Fibre-opticDistributed Strain Sensoring (DSS), Distributed Acoustic Sensoring (DAS), Distributed Chemical Sensoring (DCS),
Distributed Temperature Sensoring (DTS, highly repeatable and having large coverage of tens of kilometers 61
Near-surface Sensoric data Inelastic neutron scatteringMapping of elemental concentrations (including carbon, silicon, oxygen) in the soil. A reduction in carbon relative to the
other elements in the soil could indicate CO2 leakage (successfully tested at a site described below 41
Near-surface Sensoric data Lab-on-Chip GradientA lab-on-chip sensor for dissolved inorganic carbon (DIC), or a combination of pH and total alkalinity sensor, quantif ies the
excess DIC in the w ater which is a results of dissolved CO2 bubbles 38
Near-surface Sensoric data MicroprofilerStrongly miniaturized electrochemical sensors with a tip diameter of less than 50 μm and a sensing surface of less than 0.5
μm recording CO2, O2, pH, H2S, redox and temperature 47
Near-surface Sensoric data Multipurpose VCTDMultipurpose Video Conductivity Temperature Depth (VCTD) system for detecting and monitoring gas-rich f luid seepage
from the seafloor investigating natural CO2-and CH4-seepages 37
Near-surface Sensoric data Muon tomographyMonitoring density changes based on the changing muon flux could allow ing accurate long term passive monitoring of a
CO2 storage site 49
Near-surface Sensoric data Passive AcousticsThe acoustic signal recorded by multiple hydrophones can be used to determine the gaseous flux. Quiet sounds of the
bubbles can be measured above the background noise 43
Near-surface Sensoric data pH OptodesIndicator dyes that change their f luorescent properties depending on pH in the analysed media enabling several months
long continuous pH monitoring 58
Near-surface Sensoric dataSeabed mapping w ith
echosounding
One of the most accurate tools for imaging large areas of the seabed. Allow ing detailed mapping of seafloor bathymetry
and providing information about the nature of the sediment / seaw ater interface. 48
Near-surface Sensoric data Seafloor MappingSeafloor mappingcarried out w ith acoustic techniques, either using multibeam echosounders or sidescan sonars. Acoustic
reflectivity of the seabed ('backscatter'): a proxy for seafloor hardness, and hence sediment type 47
Near-surface Sensoric data Shallow seismic profiling (P-cable)Very high resolution 3D seismic in the top ˜1000m of the subsurface. Time lapse surveying w ould be required to identify
changes that may indicate migration and leakage of CO2 56
Near-surface Sensoric dataShallow seismic profiling (pinger,
boomer, chirp)
Resolved bed thickness of a metre or less likely having considerable potential for resolving small amounts of gas (typically
represented by acoustic blanking, bright spots, etc.) 56
Near-surface Sensoric data Shallow subsurface geochemistryGeochemical computer codes using measurements of the relative proportions of these individual components to estimate
the total CO2 flux into the groundw ater 48
Near-surface Sensoric data Sonar bubble stream detectionDetected bubbles allow for bubble stream chemistry techniques to be used for confirming the gas and source of the
bubbles and quantif ication of gas f lux 47
Near-surface Sensoric data Surface w ater chemistryFour typically measured parameters that, together w ith ancillary information such as conductivity, temperature, pressure,
pH and salinity, can be used to describe the CO2 system for a given w ater sample 47
Near-surface Sensoric data Traditional CTDA variety of parameters are recorded (hydrography and carbonate chemistry) and several water samples are collected
including dissolved gasses (such as O2, DIC, CH4...) inorganic nutrients (such as nitrates, phosphate and silicate) 45
Near-surface Sensoric dataWater bottom sediment gas
sampling
Seabottom gas sampling and analysis allow ing monitoring of the composition and origins of very shallow gas in the
near‐surface seabed indicating CO2 leakage or precursor f luid detection 49
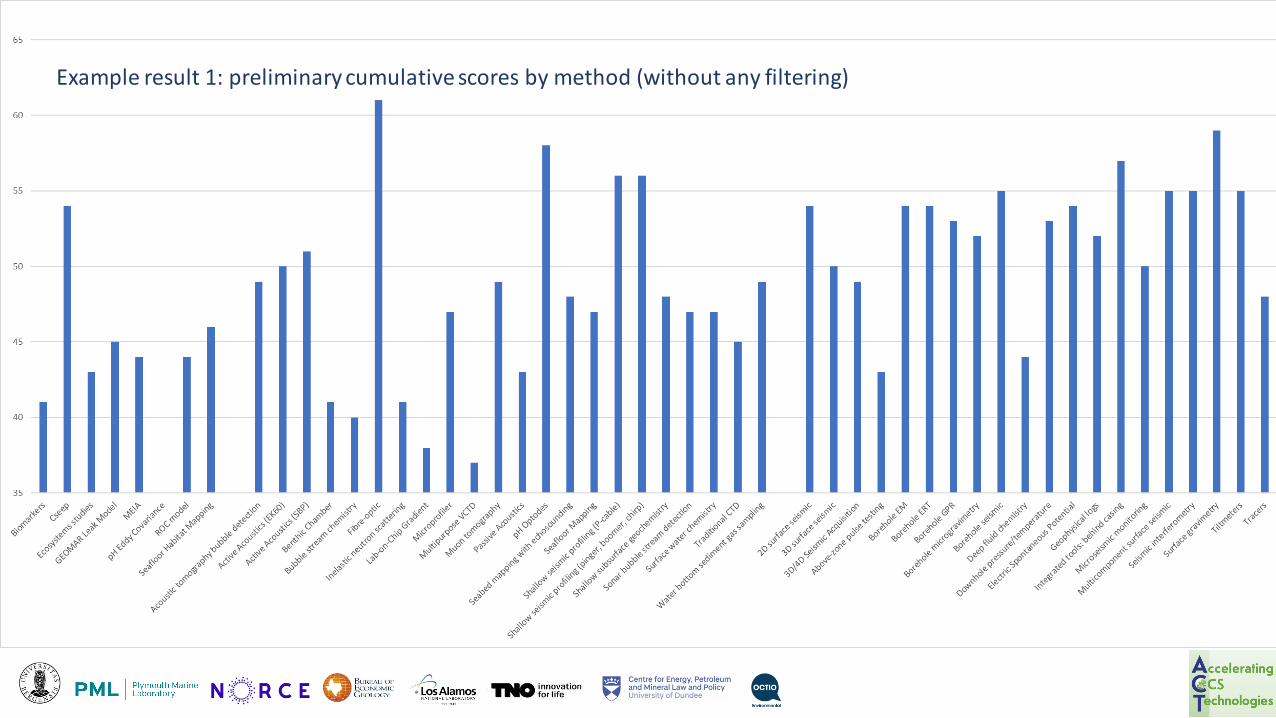
ACTOM ranking of monitoring toolsExample result 1: preliminary cumulative scores by method (without any filtering)

30
35
40
45
50
55
60
65
Acous
tic to
mogr
aphy b
ubble
detect
ion
Airborn
e EM
Airborn
e spec
tral im
agin
g
Atmosp
heric ga
s con
centra
tion
Elect
ric Sp
onta
neous P
otent
ial
Groun
d pen
etra
ting ra
dar
Land ER
T
Micr
osei
smic
monito
ring
Muo
n tom
ograp
hy
pH Opto
des
Sate
llite in
terfe
rom
etry /
GPS
Seism
ic in
terfe
rom
etry
Surfa
ce E
M
Surfa
ce g
ravim
etry
Surfa
ce-a
tmos
pheric
gas f
lux
Tiltm
eters
Trac
ers
overall
Example result 2: preliminary cumulative scores by method (with filtering):sensoric methods only + best performance in cost per km

0
0.5
1
1.5
2
2.5
3
sea water columnseabottom
seabottom subsurface
Regulation (B, P, D, A, Q, IA)
Sensitivity
Effort
AccessbilityTime requiredPractical
Coverage
Resolution
Penetration
Repeatability
Baseline/versus/repeat
Cost/km
Cost/hour
Synergy
Escalation level
Average performance for all tech/methdos
Performance (in reservoir)
Detection
Attribution
Quantification
Impact assessment
Baseline
Example result 3: average preliminary scores by criteria for all technologies & methods
Temporal
Temporal

0
0.5
1
1.5
2
2.5
3
Sea water columnSeabottom
Seabottom subsurface
Regulation
Sensitivity
Effort
AccessbilityTime requiredPractical
Coverage
Resolution
Penetration
Repeatability
Baseline/versus/repeat
Cost/km
Cost/hour
Synergy
Escalation level
Example result 4: preliminary scores by criteria for a sensor
Performance (in reservoir)
Detection
Attribution
Quantification
Impact assessment
Baseline
Temporal
Temporal

ACTOM ranking of monitoring tools
Ideas to further improve the ranking table:
• Include depth-relation: can certain shallow monitoring be ruled out/excluded by deep monitoring or vice versa?
• Include CO2 flux detection threshold per method as a function of distance, time, site characteristics etc: which method is sensitive enough to pick up CCS site anomalies at which distance and moment in time?
• Include more options to make the scores site-dependent: which methods work for a rig, work for aquifer/depeleted gasfield, work for active shipping lanes, work for fishery grounds, etc.
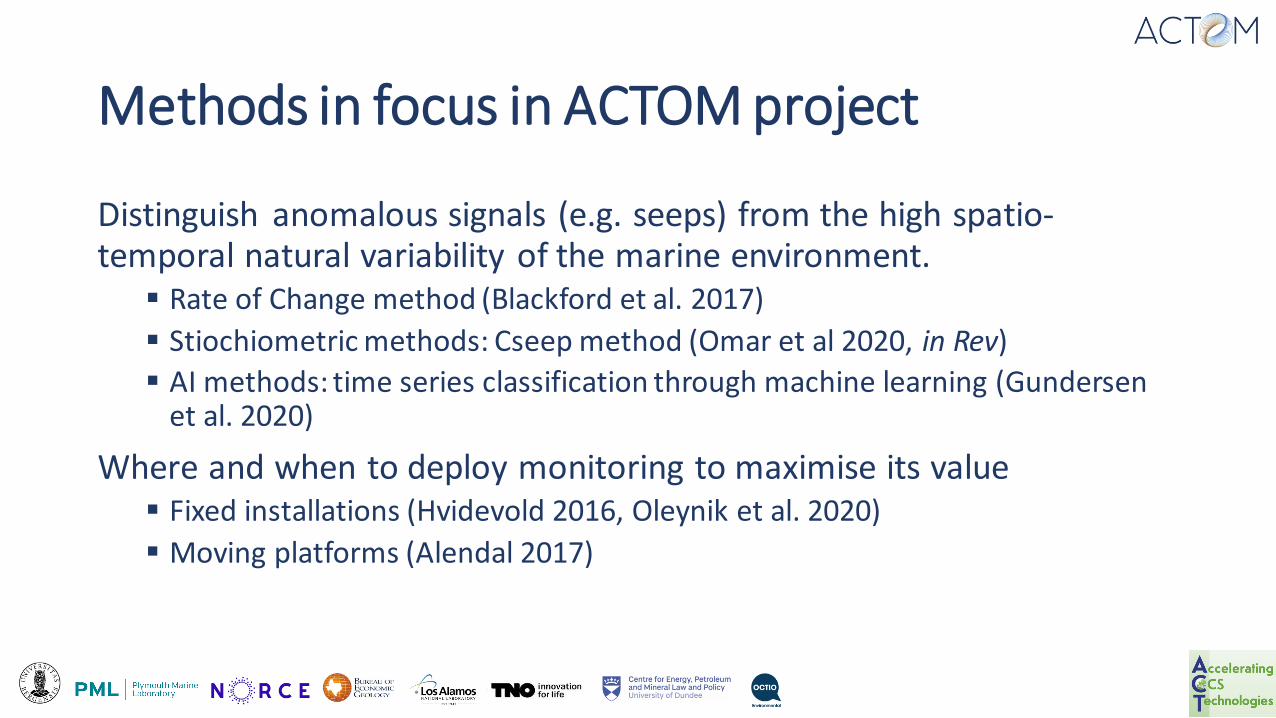
Methods in focus in ACTOM project
Distinguish anomalous signals (e.g. seeps) from the high spatio-temporal natural variability of the marine environment.
▪ Rate of Change method (Blackford et al. 2017)
▪ Stiochiometric methods: Cseep method (Omar et al 2020, in Rev)
▪ AI methods: time series classification through machine learning (Gundersen et al. 2020)
Where and when to deploy monitoring to maximise its value▪ Fixed installations (Hvidevold 2016, Oleynik et al. 2020)
▪ Moving platforms (Alendal 2017)
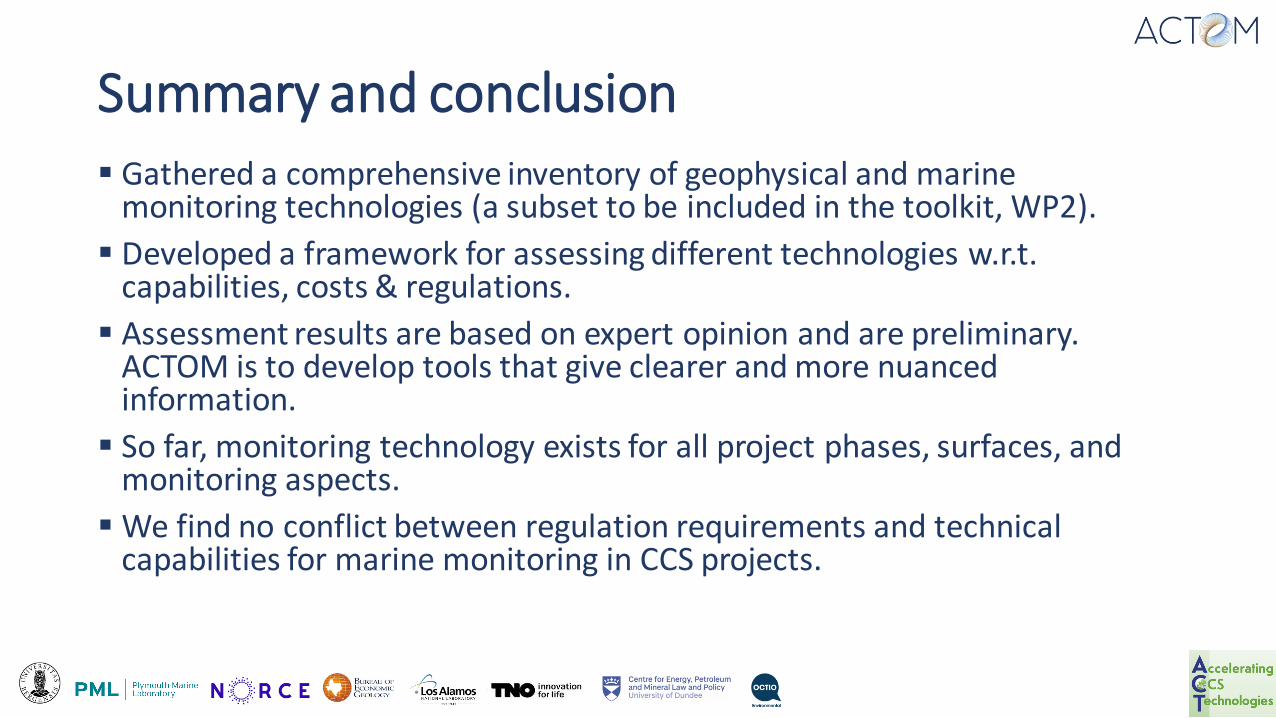
Summary and conclusion▪ Gathered a comprehensive inventory of geophysical and marine
monitoring technologies (a subset to be included in the toolkit, WP2).
▪ Developed a framework for assessing different technologies w.r.t.capabilities, costs & regulations.
▪ Assessment results are based on expert opinion and are preliminary. ACTOM is to develop tools that give clearer and more nuanced information.
▪ So far, monitoring technology exists for all project phases, surfaces, and monitoring aspects.
▪ We find no conflict between regulation requirements and technical capabilities for marine monitoring in CCS projects.
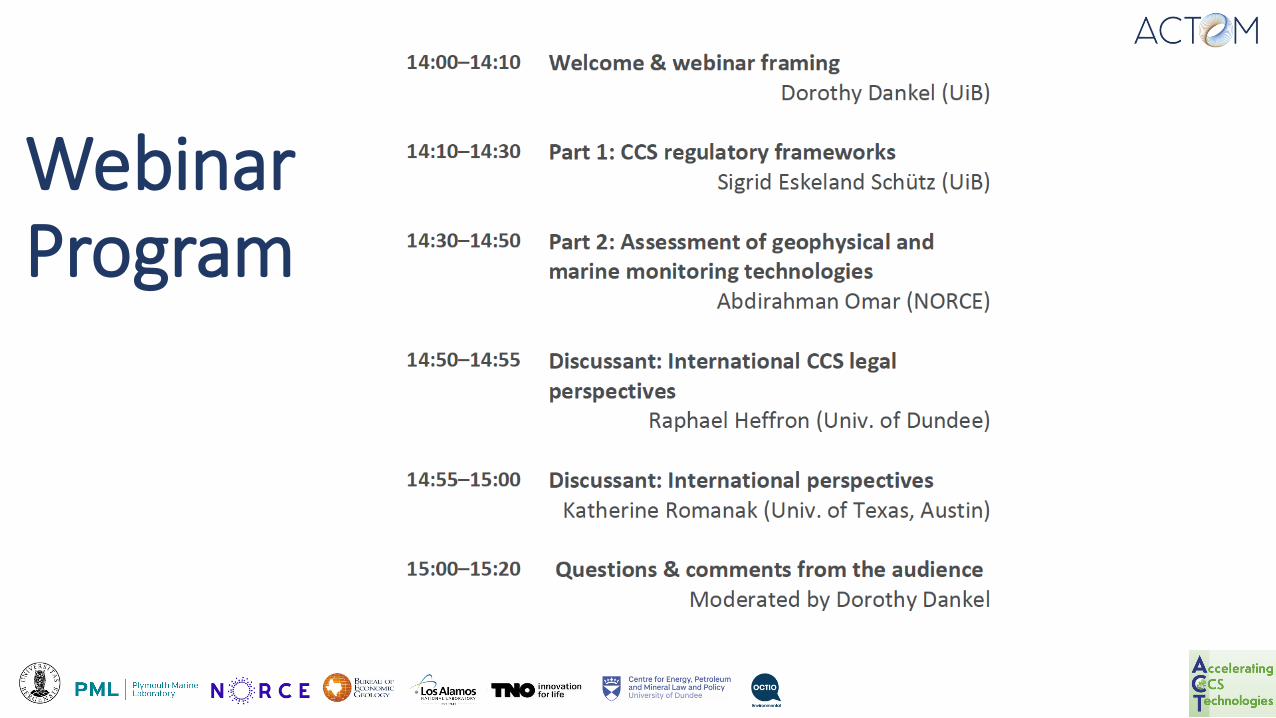
WebinarProgram

Discussant: International CCS legal perspectives
Professor Raphael HeffronUniversity of Dundee
Raphael Heffron is Professor for Global Energy Law & Sustainability at the Centre for Energy, Petroleum and Mineral Law and Policy at the University of Dundee. He as of July 2019 is a Jean Monnet Professor in the Just Transition to a Low-Carbon Economy awarded by the European Commission. Professor Heffron is a qualified Barrister-at-Law, and a graduate of both Oxford (MSc) and Cambridge (MPhil & PhD). His work all has a principal focus on achieving a just transition to a low-carbon economy and combines a mix of energy law, policy and economics.

Discussant: International perspectives
Dr. Katherine RomanakUniversity of Texas, Austin
Dr. Romanak is an expert in environmental monitoring at geologic CO2 storage sites and has developed and implemented several environmental monitoring programs with an innovative “process-based” method for assessing potential leakage at CCS sites. Dr. Romanak has worked internationally at CO2 storage sites and is a member of the International Steering Committees for the IEAGHG Monitoring and the Environmental Science Networks. She regularly informs global policy within the United Nations Framework Convention on Climate Change (UNFCCC) and has informed the U.S. Congress on environmental monitoring at geologic CO2 storage sites. She is passionate about working with developing countries to build their national CCS programs.

ISSUE
PROBLEM
SO WHAT?
SOLUTIONS
BENEFITS
Ensure that the marine monitoring toolbox meets regulatory
requirements and examine the capabilities of tools.
International and regional CCS guidelines and regulations require no specific technology, but identify storage phases and monitoring aims.
Technology exists for all project phases, surfaces, and monitoring aims, optimal methods have emerged.
Monitoring Offshore CCS
What are regulatory monitoring requirements, and does technology exist
for all project phases, surfaces, and monitoring aims? What are the
capabilities of these tools?
A web-based toolbox of global relevance, regardless of jurisdiction and CCS site.
Enable the derivation of optimal environmental monitoring strategies, reducing costs.
ACT on Offshore Monitoring

Questions and Comments from Audience