Webinar #1: Enhancing Poverty Alleviation Performance: The ...
29
Webinar #1: Enhancing Poverty Alleviation Performance: The Importance of Implementing Multidimensional Metrics Presenters: • Heather Esper, Program Manager for Impact Assessment- WDI • Yaquta Kanchwala Fatehi, Research Associate- Impact Assessment- WDI • Julie Peachey, Director of Social Performance Management- Grameen Foundation This webinar is part of a larger series “Assessing Multidimensional Poverty Impacts: Techniques that are Easy-to- Implement and Customizable”. Schedule of events: • Webinar #2: Enhancing Poverty Alleviation Performance: Amplifying the Voice of Local Stakeholders – JUNE 17, 11 AM- 12 PM EDT • Webinar #3: Enhancing Poverty Alleviation Performance: Quantifying Changes Experienced by Local Stakeholders – JULY 18, 10 AM-11 AM EDT • Impact Assessment Hands-on Workshop: OCTOBER 22-24, 2014, Ann Arbor, MI Register at: http://wdi.umich.edu/research/bop/webinar2014 1
Transcript of Webinar #1: Enhancing Poverty Alleviation Performance: The ...

Webinar #1: Enhancing Poverty Alleviation Performance: The Importance of Implementing Multidimensional Metrics Presenters: • Heather Esper, Program Manager for Impact Assessment- WDI • Yaquta Kanchwala Fatehi, Research Associate- Impact Assessment- WDI • Julie Peachey, Director of Social Performance Management-
Grameen Foundation This webinar is part of a larger series “Assessing Multidimensional Poverty Impacts: Techniques that are Easy-to-Implement and Customizable”. Schedule of events: • Webinar #2: Enhancing Poverty Alleviation Performance:
Amplifying the Voice of Local Stakeholders – JUNE 17, 11 AM-12 PM EDT
• Webinar #3: Enhancing Poverty Alleviation Performance: Quantifying Changes Experienced by Local Stakeholders – JULY 18, 10 AM-11 AM EDT
• Impact Assessment Hands-on Workshop: OCTOBER 22-24, 2014, Ann Arbor, MI
Register at: http://wdi.umich.edu/research/bop/webinar2014
1

1. The value of capturing multi-dimensional outcomes of poverty - WDI 2. Guest speaker – Grameen Foundation 3. Contact information 4. Questions from the audience 5. References
Agenda
2
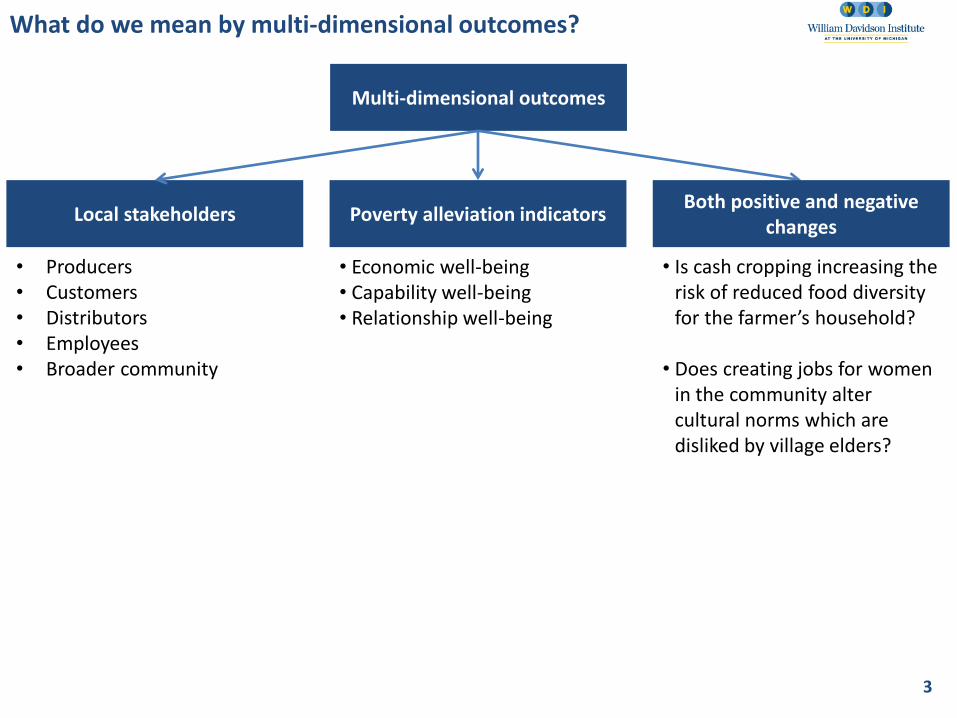
What do we mean by multi-dimensional outcomes?
Multi-dimensional outcomes
Local stakeholders Poverty alleviation indicators
• Producers • Customers • Distributors • Employees • Broader community
• Economic well-being • Capability well-being • Relationship well-being
Both positive and negative changes
• Is cash cropping increasing the risk of reduced food diversity for the farmer’s household?
• Does creating jobs for women in the community alter cultural norms which are disliked by village elders?
3

Why is it important to speak with all local stakeholders?
Why is this important? “What is missing from the many evaluation reports … [is] feedback from beneficiaries themselves.” Nicholas van Praag, Advisor- World Development Report 2011
Multi-dimensional outcomes
Local stakeholders
• Producers • Customers • Distributors • Employees • Broader community
4

What do we mean by multi-dimensional poverty alleviation indicators?
Why is this important? “The whole question hinges on one’s definition of impact. If impact equates to scale, say jobs created, then it is little surprise that you’d find financially well-run businesses deliver bigger impact. The assessment is biased by using a narrow, output-based metric…” Tom Adams, Acumen
Multi-dimensional outcomes
Multi-dimensional poverty alleviation indicators
• Economic well-being • Capability well-being • Relationship well-being
5

What do we mean by economic well-being outcomes?
Economic Well-being
+/- Income/Revenue +/- Income stability +/- Savings/Assets +/- Debt +/- Economic risk +/- Cost to engage with venture +/- Productivity +/- Expenditure
Examples of other organizations/frameworks who track economic well-being 1. United Nations (UN) Human Development
Index 2. Committee On Sustainability Assessment
(COSA) 3. Grameen Foundation 4. IRIS (output indicators) 5. Measuring Impact Framework, from WBCSD
with IFC 6. Business Call to Action (BCtA) Results
Reporting Framework, from the UNDP 7. Poverty Footprint Methodology from Oxfam 8. Global Reporting Initiative (GRI) 9. GEMI (mainly output indicators) 10.Environmental and Social Impact Assessment
(ESIA) used by the Cement Sustainability Initiative at WBCSD
11.USAID Poverty Assessment Tools (PAT)
6

Why are these indicators important?
1. “Financial services … are essential to leading a better life…Poor people need such services more than anyone, because in developing countries, poverty does not just mean low income, it means volatile income.” David Roodman, Center for Global Development
2. “Study of a BRAC program that provides capital, coupled with training, for Bangladeshi women … found… after two years these [earnings per hour] are not significantly different from the baseline, but at four years they are: 15% higher.... This suggests productivity gains that manifest over time.” Markus Goldstein, World Bank
What do we mean by economic well-being outcomes?
7
Economic Well-being
+/- Income/Revenue +/- Income stability +/- Savings/Assets +/- Debt +/- Economic risk +/- Cost to engage with venture +/- Productivity +/- Expenditure +/- Consumer surplus

What do we mean by capability well-being outcomes?
Capability Well-being
+/- Physical health +/- Psychological health +/- Knowledge +/- Skills +/- Self-confidence +/- Self-efficacy +/- Self-worth +/- Empowerment +/- Contentment +/- Dignity +/- Aspirations
Examples of other organizations/frameworks who track capability well-being 1. UN’s Human Development Index 2. COSA 3. BCtA Results Reporting Framework, from the
UNDP (human capital development) 4. GRI 5. IRIS (output indicators) 6. Poverty Footprint Methodology, from Oxfam 7. Measuring Impact Framework, from WBCSD
and co-branded with the IFC 8. GEMI (mainly output indicators) 9. ESIA used by the Cement Sustainability
Initiative at WBCSD
8

What do we mean by capability well-being outcomes?
Why are these indicators important?
1. “In Malawi, …we show that increases in income under the UCT arm caused large improvements in adolescent mental health and decreased the risk of sexually transmitted diseases among adolescent girls. The effects on mental health seemed to be due partly to increased consumption, leisure, and family support for education…” University of Otago
2. “The economic poor also often exhibit low levels of psycho-social health and functioning…” Jed Friedman, World Bank
9
Capability Well-being
+/- Physical health +/- Psychological health +/- Knowledge +/- Skills +/- Self-confidence +/- Self-efficacy +/- Self-worth +/- Empowerment +/- Contentment +/- Dignity +/- Aspirations
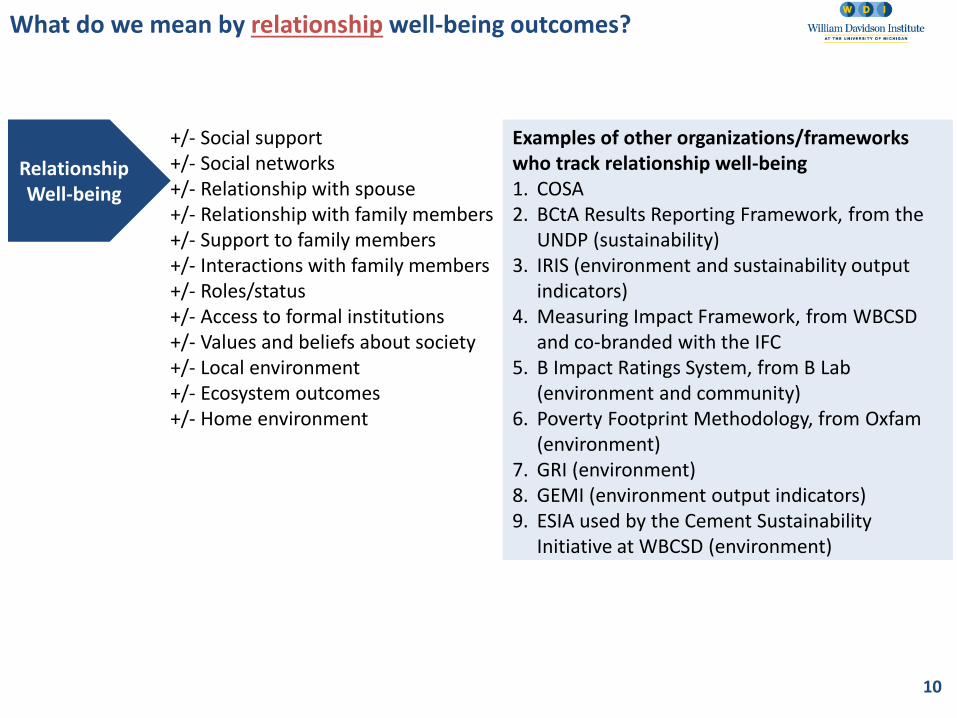
What do we mean by relationship well-being outcomes?
Relationship Well-being
+/- Social support +/- Social networks +/- Relationship with spouse +/- Relationship with family members +/- Support to family members +/- Interactions with family members +/- Roles/status +/- Access to formal institutions +/- Values and beliefs about society +/- Local environment +/- Ecosystem outcomes +/- Home environment
10
Examples of other organizations/frameworks who track relationship well-being 1. COSA 2. BCtA Results Reporting Framework, from the
UNDP (sustainability) 3. IRIS (environment and sustainability output
indicators) 4. Measuring Impact Framework, from WBCSD
and co-branded with the IFC 5. B Impact Ratings System, from B Lab
(environment and community) 6. Poverty Footprint Methodology, from Oxfam
(environment) 7. GRI (environment) 8. GEMI (environment output indicators) 9. ESIA used by the Cement Sustainability
Initiative at WBCSD (environment)

What do we mean by relationship well-being outcomes?
Why are these indicators important? 1. A March 2014 National Bureau of Economic Research (NBER) working paper found that “using individual
level data on domestic violence we find evidence that increased property rights for women did increase the incidence of wife beating in India.”
2. “Taken all together, [in] the program [Chile Solidario] … increased access [to subsidy programs for poor households] translates most directly into improvements in the quality of housing as well as in formal ownership of housing…and younger households are less likely to experience family dissolution.” Jed Friedman, World Bank
11
Relationship Well-being
+/- Social support +/- Social networks +/- Relationship with spouse +/- Relationship with family members +/- Support to family members +/- Interactions with family members +/- Roles/status +/- Access to formal institutions +/- Values and beliefs about society +/- Local environment +/- Ecosystem outcomes +/- Home environment
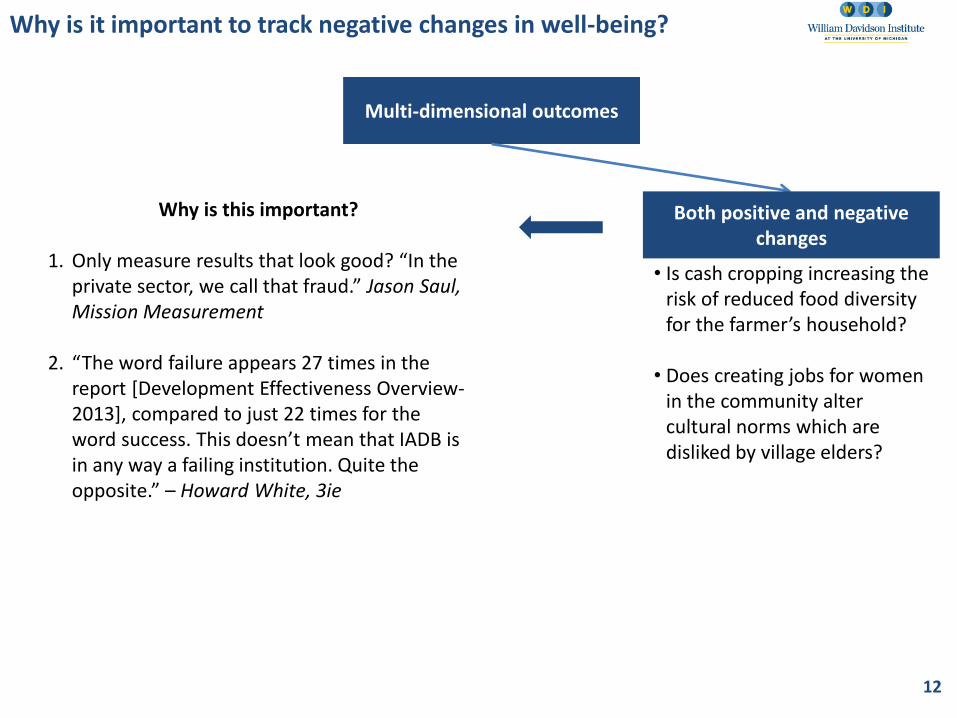
Why is it important to track negative changes in well-being?
Multi-dimensional outcomes
Both positive and negative changes
Why is this important?
1. Only measure results that look good? “In the private sector, we call that fraud.” Jason Saul, Mission Measurement
2. “The word failure appears 27 times in the report [Development Effectiveness Overview-2013], compared to just 22 times for the word success. This doesn’t mean that IADB is in any way a failing institution. Quite the opposite.” – Howard White, 3ie
12
• Is cash cropping increasing the risk of reduced food diversity for the farmer’s household?
• Does creating jobs for women in the community alter cultural norms which are disliked by village elders?

Output data is useful but not sufficient!
13
Outputs Outcomes
• What is the immediate output from an activity?
• Easier to measure
• Does not measure changes in lives of stakeholders
• Tells us about changes in stakeholders’ lives in the short, medium and long term
• Changes in skills, knowledge, attitudes and behaviors are outcomes of an activity
EXAMPLES
# of beneficiaries receiving female empowerment services
• Δ Gender equality • Δ Conflict over gender roles
• Δ Mental health
Revenue from sales of exports • Δ Income for sellers
• Δ Access/prices for locals
# of bed nets sold • Δ Incidence of malaria • Δ Income of consumers
Poverty Metrics
Julie Peachey
Director, Social Performance Management
May 28, 2014

PC Users: To change the photo in the background,
SELECT DESIGN and then BACKGROUND or right click.
Mac Users: To change the color of the background, go
under the FORMAT menu and select SLIDE BACKGROUND.
For light photos, you may need to adjust the gradient. Duplicate the
CALL OUT OVER PHOTO Master Slide and adjust the transparency on
the gradient graphic. Then apply the new master to your slide page.

What is poverty?
Poverty can be defined in many ways.
Here are a few examples:
• Insufficient access to basic services
• Inability to consume a minimum number of
calories per day
A common way to express a household’s
poverty status is by whether the
household expenditure is under the daily
amount set by a given poverty line.
Progress out of Poverty Index® by Grameen Foundation 16

Why measure poverty?
"While 77 percent of MFIs rank poverty reduction as a development goal, less than 20 percent of them can actually report poverty figures of their clients.”
-Mix Market blog post May 2014
Poverty measurement is an important part of a socially-oriented organization’s monitoring and evaluation program:
• Are we reaching our target clients?
• Are we meeting our target clients’ needs?
• Are we changing the lives of our
target clients?
17
Adapted from SPM Essentials Resource Handbook, SPTF, 2012.
Progress out of Poverty Index® by Grameen Foundation
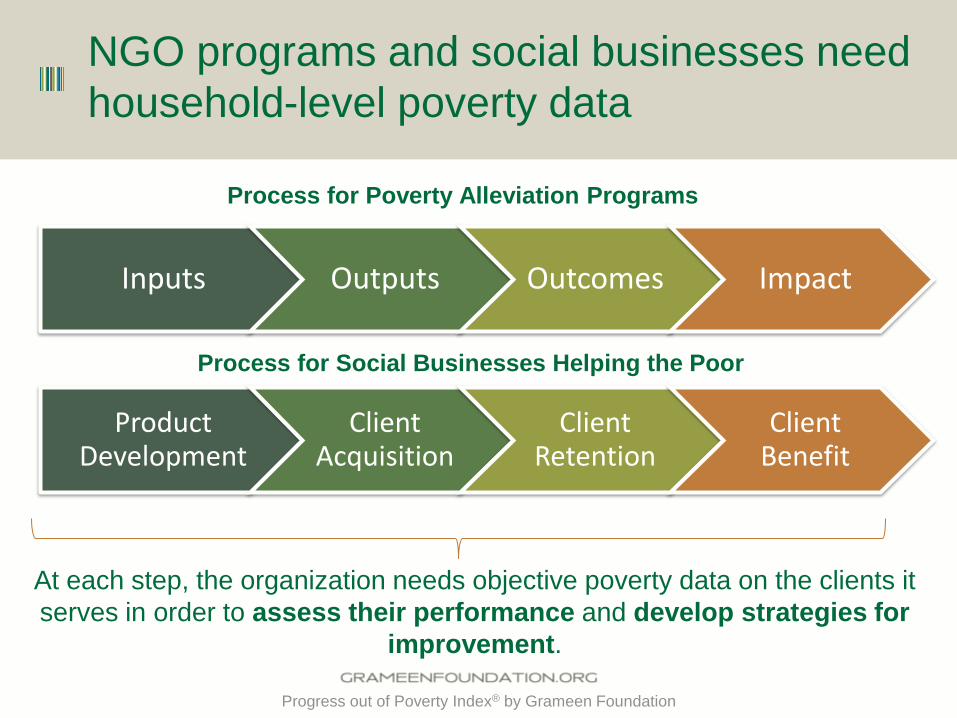
NGO programs and social businesses need
household-level poverty data
Inputs Outputs Outcomes Impact
Product Development
Client Acquisition
Client Retention
Client Benefit
Process for Poverty Alleviation Programs
Process for Social Businesses Helping the Poor
At each step, the organization needs objective poverty data on the clients it
serves in order to assess their performance and develop strategies for
improvement.
Progress out of Poverty Index® by Grameen Foundation

Benefits of household-level poverty
measurement
Organizations that work directly with the world’s poor
can do better by collecting and analyzing poverty data
from the families they serve.
How many poor people are we
reaching?
•Assures practitioners and donors that services are being used by the intended demographic
What needs or characteristics do the poor share?
•Helps practitioners tailor services to the needs of the poor
•Helps practitioner evaluate how current services are performing among the poor
How are poor households
progressing over time?
•One of many factors that contribute to an impact evaluation
Questions
answered
Benefits to
business
Progress out of Poverty Index® by Grameen Foundation
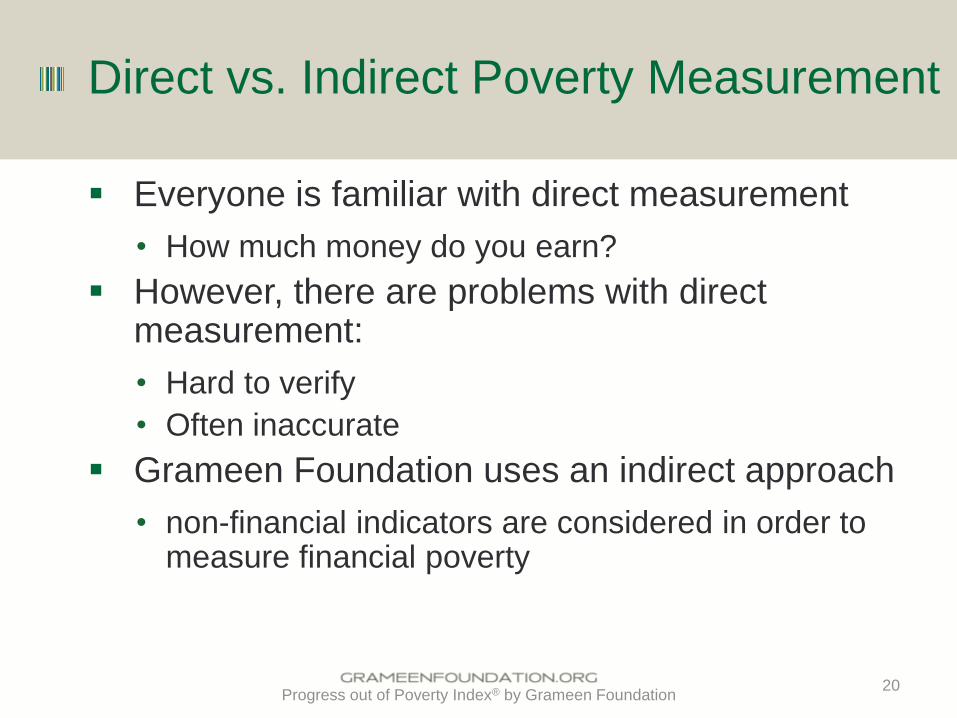
Direct vs. Indirect Poverty Measurement
Everyone is familiar with direct measurement
• How much money do you earn?
However, there are problems with direct measurement:
• Hard to verify
• Often inaccurate
Grameen Foundation uses an indirect approach
• non-financial indicators are considered in order to measure financial poverty
20
Progress out of Poverty Index® by Grameen Foundation

The Progress out of Poverty Index®
The PPI® is…
A country-specific poverty
assessment scorecard
10 questions in length
Completed in less than 10
minutes
Easy to use
Reliable
Tied to poverty lines
The PPI is developed by Mark Schreiner of Microfinance Risk Management, L.L.C.

PPI Indicators are multi-dimensional
Based on national household income-
expenditure survey
Contains questions on:
• Household income or expenditure;
• Housing condition and characteristics;
• Education;
• Household composition;
• Ownership of durable goods; and
• Employment status.
Progress out of Poverty Index® by Grameen Foundation

Case Study
E-WAREHOUSE:BASELINE DATA
Male
22% Femal
e
78%
Farmer gender
Widowed females represented half of the registered female
farmers (51%), and had the highest poverty rate (82.4% under
the $2.50 line)
Below
Extreme Line
Below 150%
of NPL
Below $2.50
line
17%
65%
Poverty Outreach
75%
Progress out of Poverty Index® by Grameen Foundation

Most farmers sold their crops in the first month after harvest (53.8%)
Among the poorest farmers, 62.9% sell within the first month, compared to 42.6% of
the less poor farmers
E-WAREHOUSE: BASELINE DATA
Progress out of Poverty Index® by Grameen Foundation

E-WAREHOUSE: BASELINE DATA
Sell
ing p
rice
of
maiz
e p
er K
g. ($
)
poorest mid less poor
Broker 55% 53% 36%
Retailer 36% 40% 57%
Wholesaler 9% 7% 7%
Institutional Customer 0% 0% 0%
Processors 0% 0% 0%
Total 100% 100% 100%
The poorest farmers tend to sell more to
brokers than retailers – while the less
poor sell more to retailers than brokers
Poorer farmers sell their maize at
significantly lower prices
Progress out of Poverty Index® by Grameen Foundation

Case Study: CARD Bank
• CARD Bank is the largest
microfinance provider in the
Philippines and it collects PPI
data from all customers.
• Management wanted to test
the effect of lowering the
opening balance for its
savings product.
• Lowering the opening
balance resulted in more
people below the poverty
line opening an account.
Progress out of Poverty Index® by Grameen Foundation
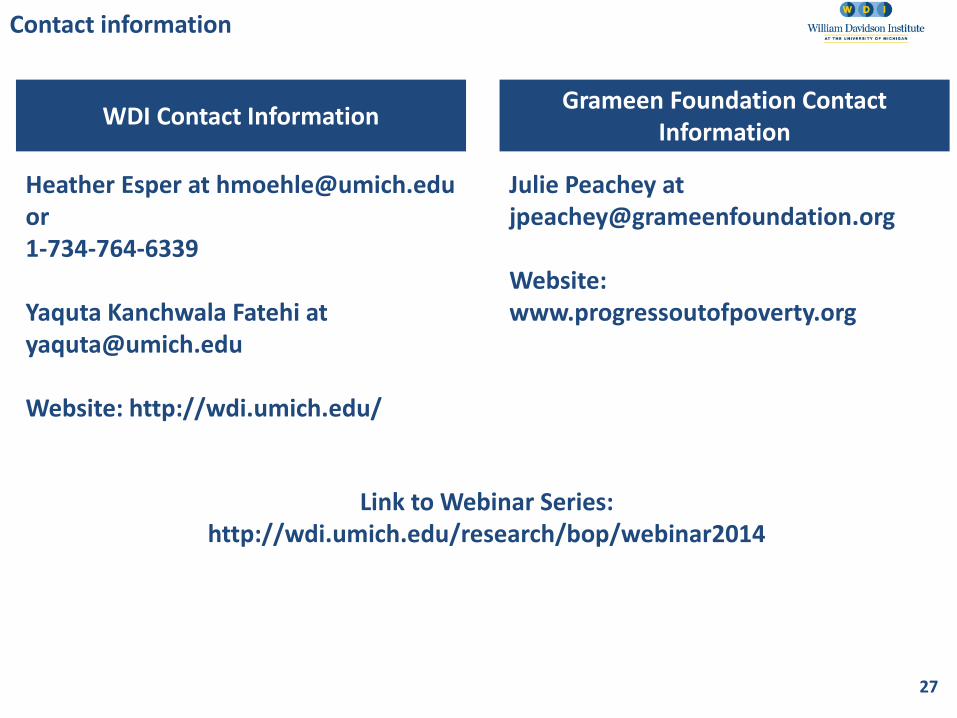
Contact information
27
Heather Esper at [email protected] or 1-734-764-6339 Yaquta Kanchwala Fatehi at [email protected] Website: http://wdi.umich.edu/
WDI Contact Information
Link to Webinar Series: http://wdi.umich.edu/research/bop/webinar2014
Julie Peachey at [email protected] Website: www.progressoutofpoverty.org
Grameen Foundation Contact Information

28
Questions?
References
29
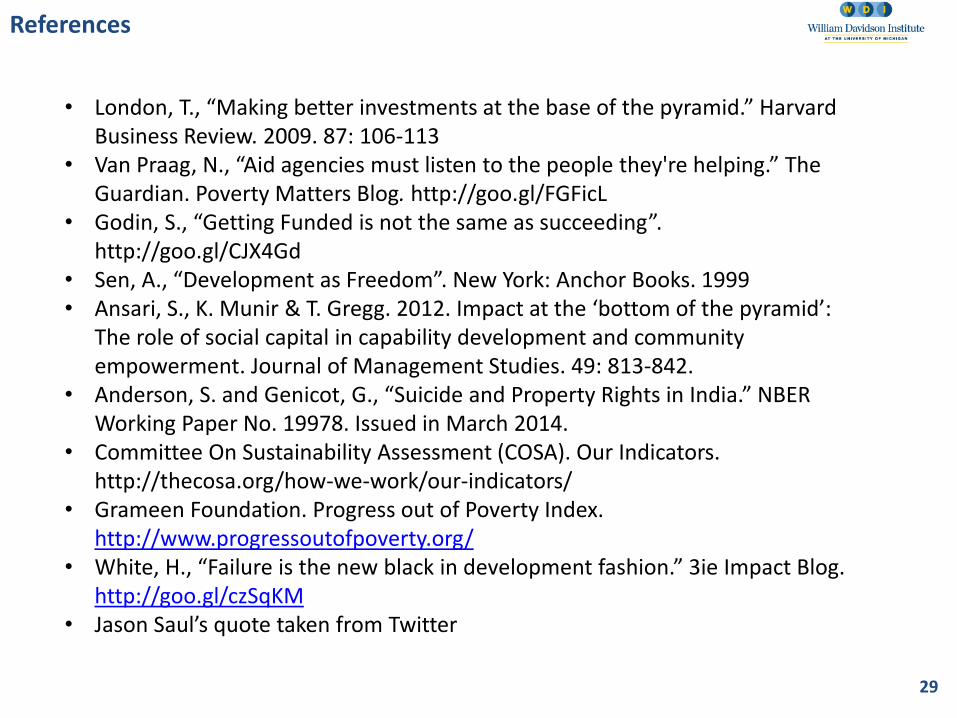
• London, T., “Making better investments at the base of the pyramid.” Harvard Business Review. 2009. 87: 106-113
• Van Praag, N., “Aid agencies must listen to the people they're helping.” The Guardian. Poverty Matters Blog. http://goo.gl/FGFicL
• Godin, S., “Getting Funded is not the same as succeeding”. http://goo.gl/CJX4Gd
• Sen, A., “Development as Freedom”. New York: Anchor Books. 1999 • Ansari, S., K. Munir & T. Gregg. 2012. Impact at the ‘bottom of the pyramid’:
The role of social capital in capability development and community empowerment. Journal of Management Studies. 49: 813-842.
• Anderson, S. and Genicot, G., “Suicide and Property Rights in India.” NBER Working Paper No. 19978. Issued in March 2014.
• Committee On Sustainability Assessment (COSA). Our Indicators. http://thecosa.org/how-we-work/our-indicators/
• Grameen Foundation. Progress out of Poverty Index. http://www.progressoutofpoverty.org/
• White, H., “Failure is the new black in development fashion.” 3ie Impact Blog. http://goo.gl/czSqKM
• Jason Saul’s quote taken from Twitter