Webcast 4Q14
19
Apresentação Usiminas 2T11 - APIMEC 4Q14 and 2014 Results Webcast
-
Upload
usiminasri -
Category
Documents
-
view
228 -
download
0
Transcript of Webcast 4Q14

Apresentação Usiminas
2T11 - APIMEC 4Q14 and 2014 Results
Webcast
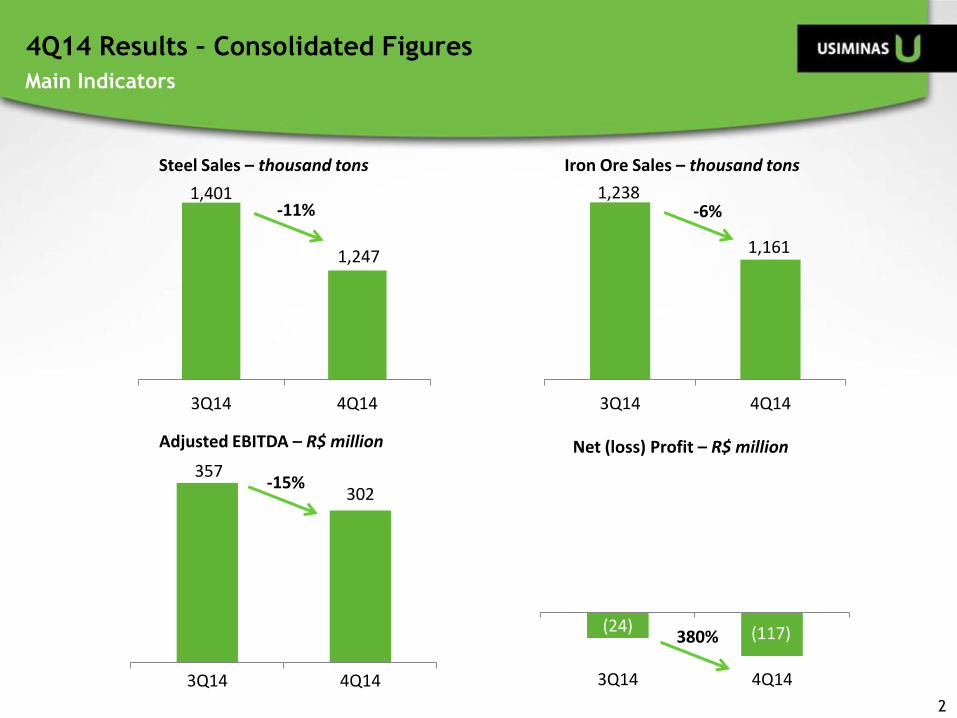
(24)
3Q14 4Q14
357 302
3Q14 4Q14
1,238
1,161
3Q14 4Q14
1,401
1,247
3Q14 4Q14
4Q14 Results – Consolidated Figures
Main Indicators
Steel Sales – thousand tons
2
Iron Ore Sales – thousand tons
Adjusted EBITDA – R$ million Net (loss) Profit – R$ million
(117)
-11% -6%
-15%
380%

2014 Results – Consolidated Figures
Main Indicators
6,220 5,541
2013 2014
-11% 6,754
5,623
2013 2014
-17%
1,806 1,863
2013 2014
17
208
2013 2014
Steel Sales – thousand tons
Adjusted EBITDA – R$ million
Iron Ore Sales – thousand tons
Net (loss) Profit – R$ million
+3%
+1,142%
3

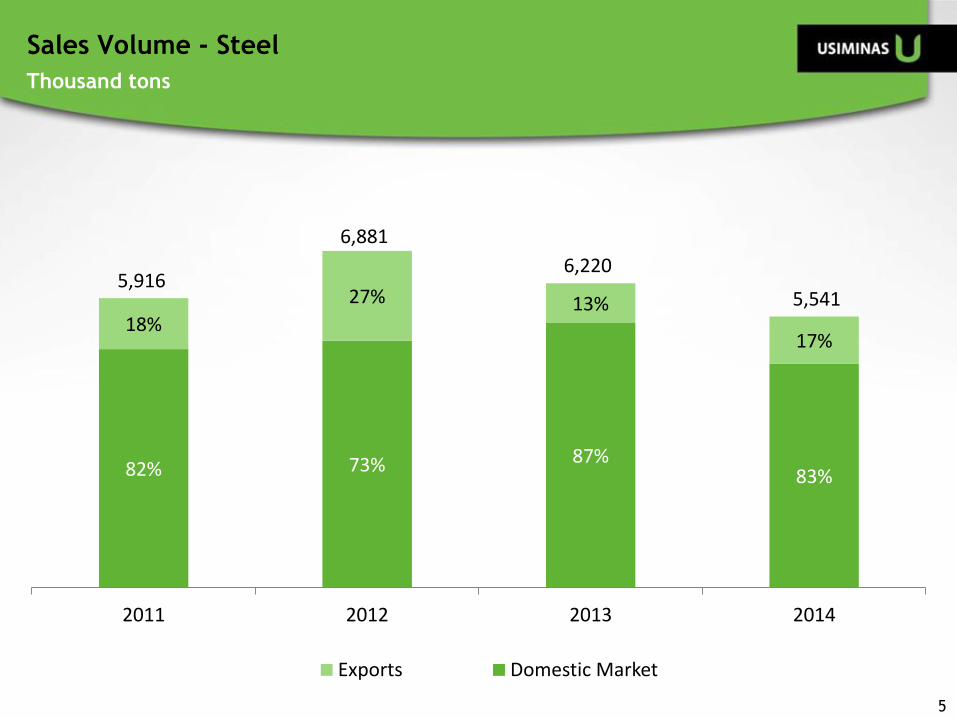
Sales Volume - Steel
Thousand tons
4
87% 88% 85% 76% 81%
13% 12% 15%
24% 19%
1,492 1,437 1,456
1,401
4Q13 1Q14 2Q14 3Q14 4Q14
Domestic Market Exports
1,247
Sales Volume - Steel
Thousand tons
82% 73% 87% 83%
18%
27% 13%
17%
2011 2012 2013 2014
Exports Domestic Market
5,916
6,881
5,541
6,220
5

R$ Million
Adjusted EBITDA /Adjusted EBITDA Margin - Steel
6
308
477 457
343 268
11%
17% 16%
13%
11%
4Q13 1Q14 2Q14 3Q14 4Q14
Adjusted EBITDA Adjusted EBITDA Margin

463 378
1,151
1,546
4% 3%
10%
14%
2011 2012 2013 2014
Ajusted EBITDA Ajusted EBITDA Margin
R$ Million
Adjusted EBITDA /Adjusted EBITDA Margin - Steel
Sales of electrical energy surplus
35
323
7

Sales Volume – Mining
Thousand tons
8
1,048 960 989 1,039 1,122
996
298 297 199 39
168
509 171
2,212
1,767
1,457
1,238
4Q13 1Q14 2Q14 3Q14 4Q14
Sales to Usiminas Sales to 3rd parties - Domestic Market Exports
1,161
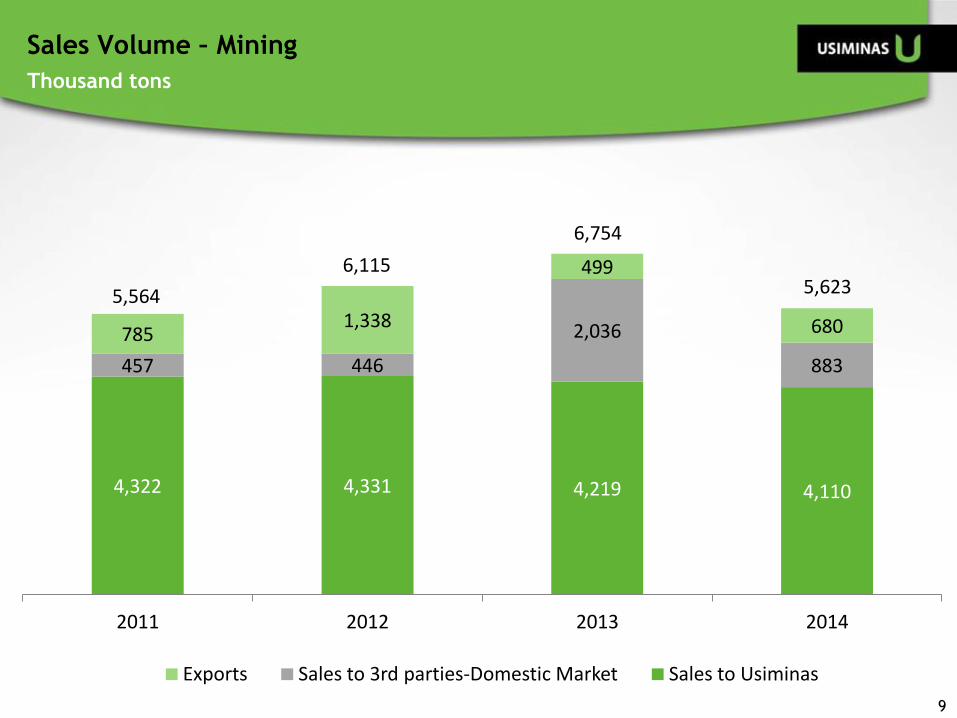
Sales Volume – Mining
Thousand tons
4,322 4,331 4,219 4,110
457 446
2,036
883
785 1,338
499
680
2011 2012 2013 2014
Exports Sales to 3rd parties-Domestic Market Sales to Usiminas
5,564
6,115
6,754
5,623
9
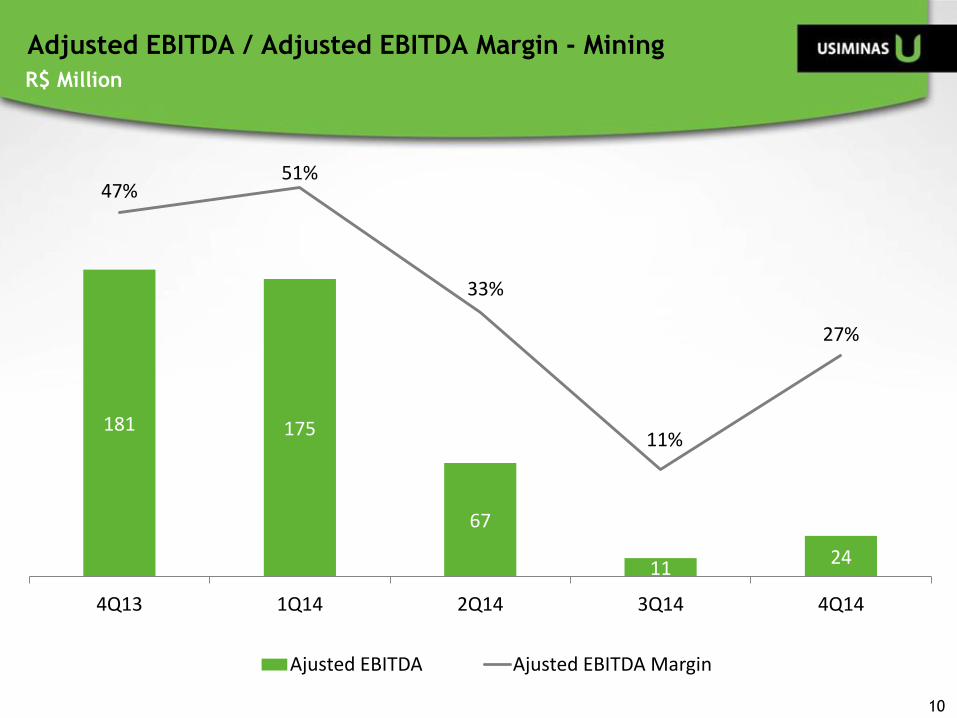
Adjusted EBITDA / Adjusted EBITDA Margin - Mining
R$ Million
10
181 175
67
11 24
47% 51%
33%
11%
27%
4Q13 1Q14 2Q14 3Q14 4Q14
Ajusted EBITDA Ajusted EBITDA Margin
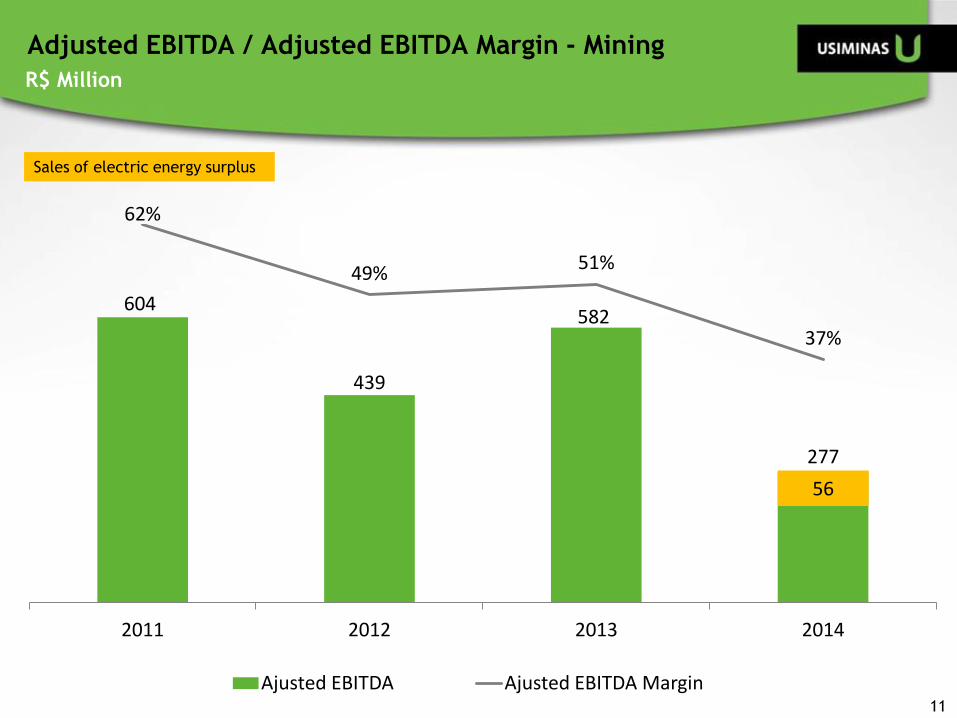
Adjusted EBITDA / Adjusted EBITDA Margin - Mining
R$ Million
604
439
582
277
62%
49% 51%
37%
2011 2012 2013 2014
Ajusted EBITDA Ajusted EBITDA Margin
56
Sales of electric energy surplus
11

Adjusted EBITDA / Adjusted EBITDA Margin - Consolidated
R$ Million
12
514
655
549
357 302
16%
21% 18%
12% 12%
4Q13 1Q14 2Q14 3Q14 4Q14
Ajusted EBITDA Ajusted EBITDA Margin

Adjusted EBITDA / Adjusted EBITDA Margin - Consolidated
R$ Million
1,264
697
1,806 1,863 11%
5%
14%
16%
2011 2012 2013 2014
Ajusted EBITDA Ajusted EBITDA Margin
35 379
Sales of electrical energy surplus
13
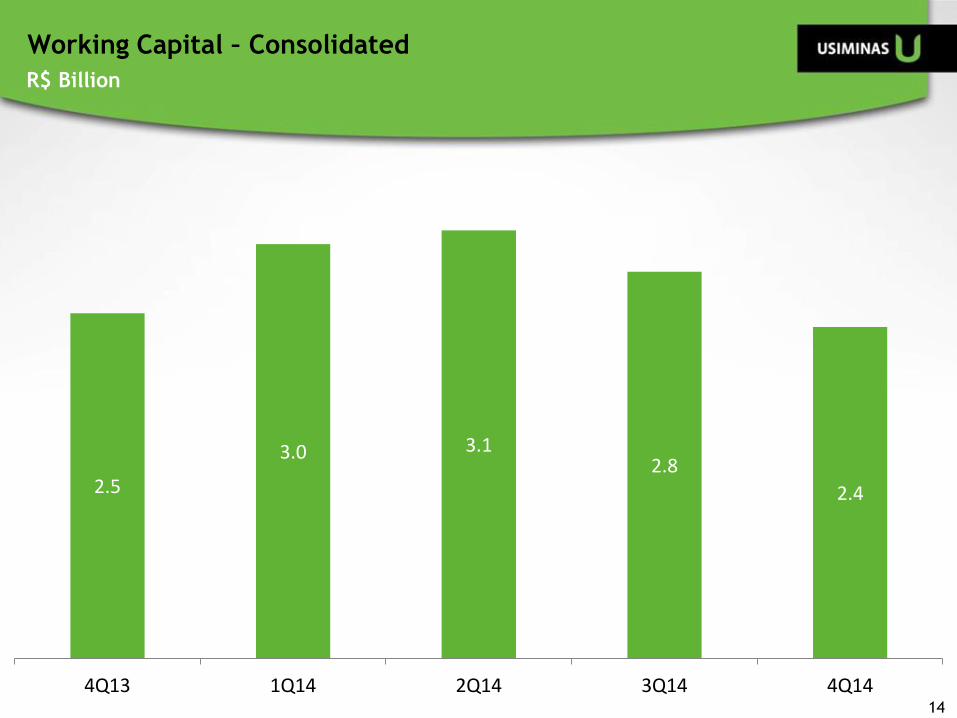
Working Capital – Consolidated
R$ Billion
14
2.5
3.0 3.1 2.8
2.4
4Q13 1Q14 2Q14 3Q14 4Q14
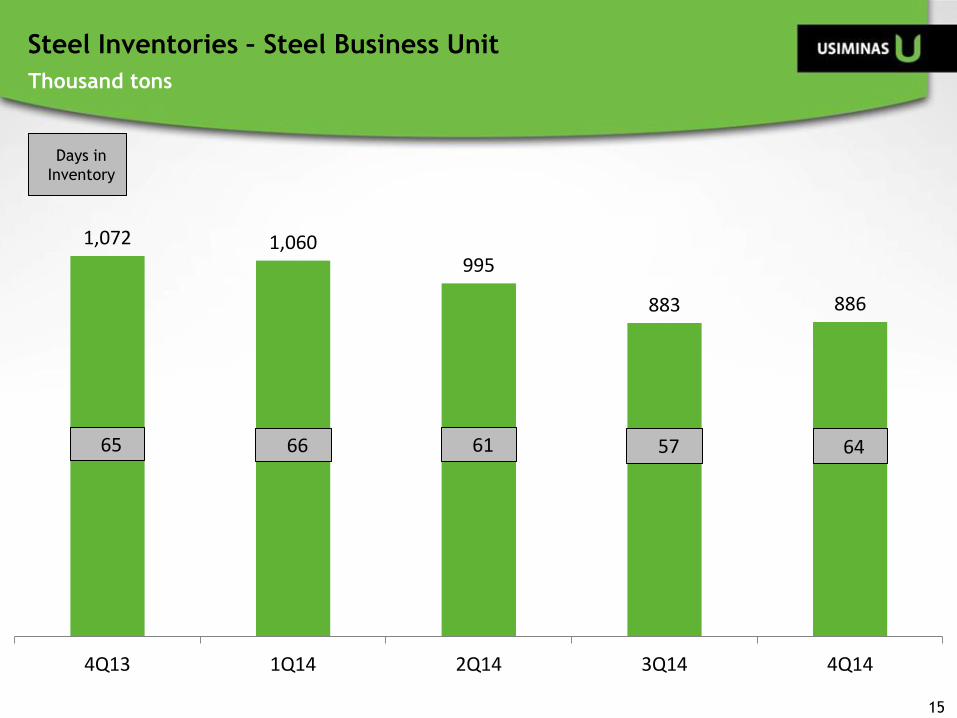
Steel Inventories – Steel Business Unit
Thousand tons
15
Days in
Inventory
1,072 1,060 995
883 886
4Q13 1Q14 2Q14 3Q14 4Q14
64 57 61 66 65
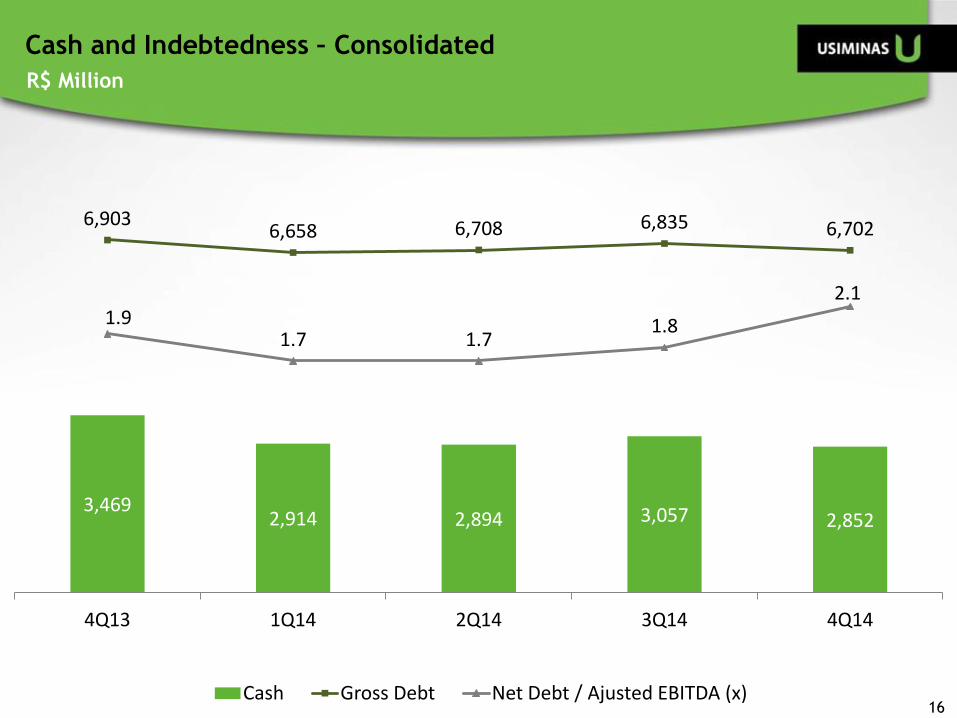
Cash and Indebtedness – Consolidated
R$ Million
16
3,469 2,914 2,894 3,057 2,852
6,903 6,658 6,708 6,835 6,702
1.9 1.7 1.7
1.8
2.1
4Q13 1Q14 2Q14 3Q14 4Q14
Cash Gross Debt Net Debt / Ajusted EBITDA (x)
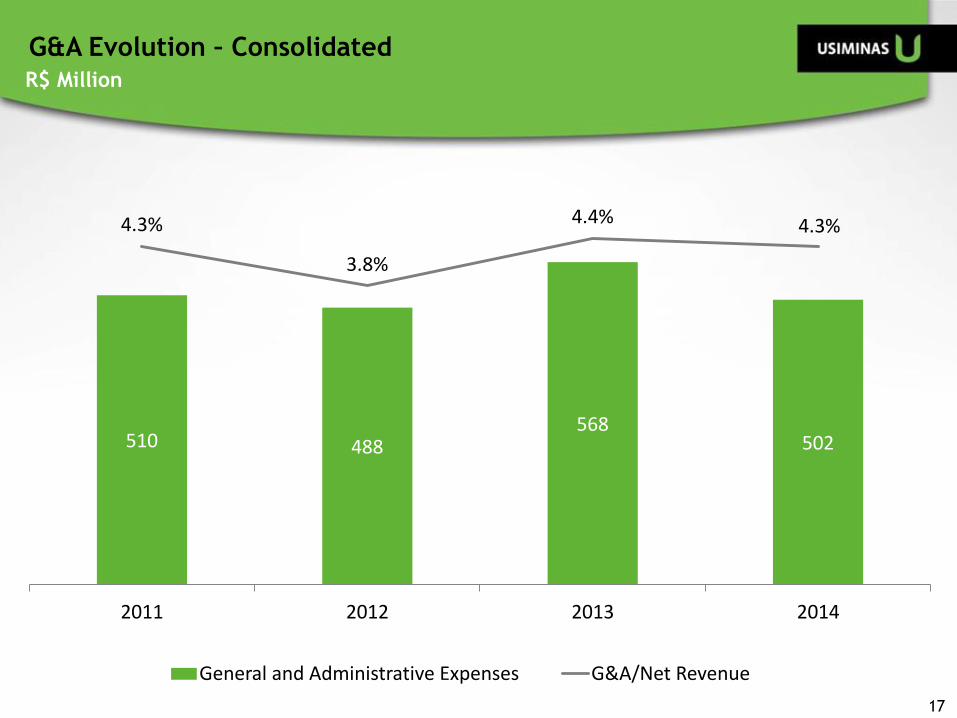
G&A Evolution – Consolidated R$ Million
17
510 488 568
502
4.3%
3.8%
4.4% 4.3%
2011 2012 2013 2014
General and Administrative Expenses G&A/Net Revenue

CAPEX – Consolidated
R$ Million
18
1,849
976
600
964
365
555
317
94
276
112
64 52
2011 2012 2013 2014
Others Mining Steel
2,490
1,643
981 1,110

www.usiminas.com/ri
ADR
Level I
Declarations relative to business perspectives of the Company, operating and
financial results and projections, and references to the growth of the
Company, constitute mere forecasts and were based on Management’s
expectations in relation to future performance. These expectations are highly
dependent on market behavior, on Brazil’s economic situation, on the
industry and on international markets, and are therefore subject to change.
Cristina Morgan C. Drumond Head of IR
Phone: 55 31 3499-8772
Fax: +55 31 3499-9357
Leonardo Karam Rosa Investor Relations Manager
Phone: +55 31 3499-8550
Diogo Dias Gonçalves Investor Relations Manager
Phone: +55 31 3499-8710
Renata Costa Couto Investor Relations Analyst
Phone: +55 31 3499-8619