modelingin203.files.wordpress.com€¦ · Web viewYou seem to be running late for school. You also...
30
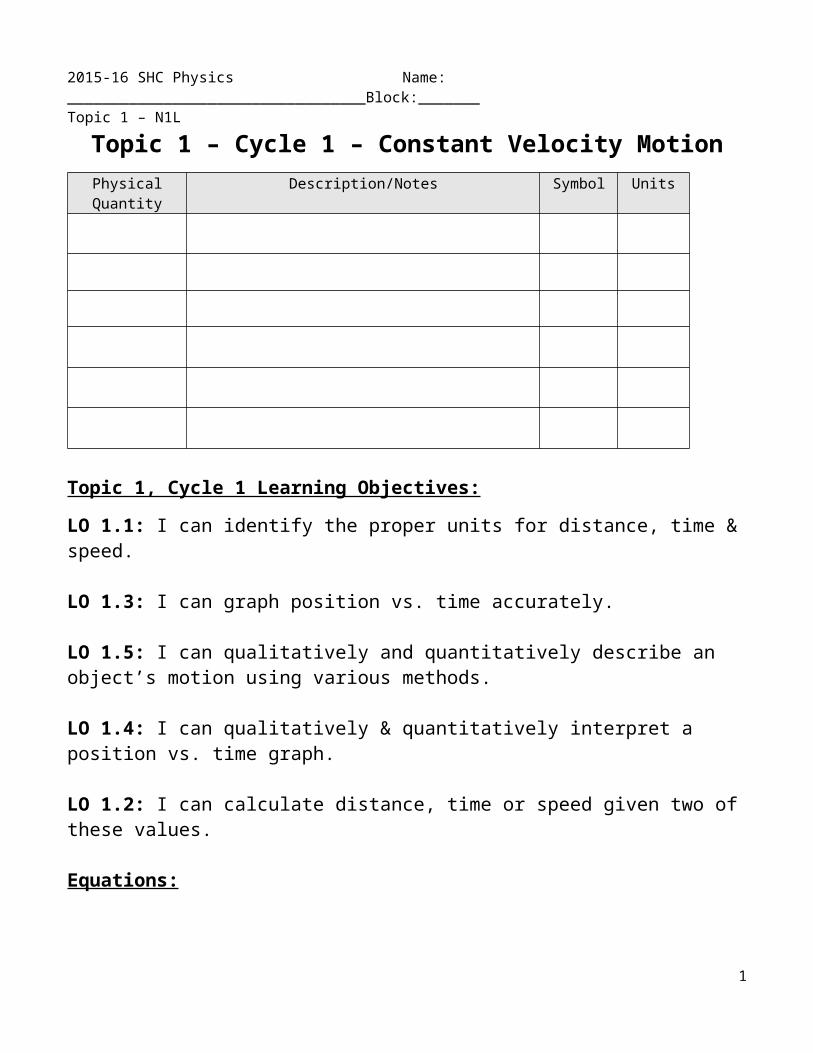
2015-16 SHC Physics Name: __________________________________Block:_______ Topic 1 – N1L Topic 1 – Cycle 1 – Constant Velocity Motion Physical Quantity Description/Notes Symbol Units Topic 1, Cycle 1 Learning Objectives: LO 1.1: I can identify the proper units for distance, time & speed. LO 1.3: I can graph position vs. time accurately. LO 1.5: I can qualitatively and quantitatively describe an object’s motion using various methods. LO 1.4: I can qualitatively & quantitatively interpret a position vs. time graph. LO 1.2: I can calculate distance, time or speed given two of these values. Equations: 1
Transcript of modelingin203.files.wordpress.com€¦ · Web viewYou seem to be running late for school. You also...
2015-16 SHC Physics Name: __________________________________Block:_______Topic 1 – N1L
Topic 1 – Cycle 1 – Constant Velocity MotionPhysical Quantity Description/Notes Symbol Units
Topic 1, Cycle 1 Learning Objectives:
LO 1.1: I can identify the proper units for distance, time & speed.
LO 1.3: I can graph position vs. time accurately.
LO 1.5: I can qualitatively and quantitatively describe an object’s motion using various methods.
LO 1.4: I can qualitatively & quantitatively interpret a position vs. time graph.
LO 1.2: I can calculate distance, time or speed given two of these values.
Equations:
1
Topic 1, Cycle 1 Challenge
You seem to be running late for school. You also got a speeding ticket last week – ouch. While still on the drive to school, what would you need to know to find out if you need to stop by the attendance office for a detention on your way to class? And how fast you would have to risk going to make it on time?
You are running the Bay to Breakers. You would like to beat your time from last year. How would you figure out how fast you need to run?
Think about these questions. What things would you need to know and understand to answer them? Brainstorm your thoughts below.
Opener: How can you describe motion?
Box O’ Cars – check out your four cars and think about what’s happening - describe the motion verbally, and make some kind of diagrammatic (visual) representation of the motion. Focus on describing the MOTION, not WHY it is moving.
Type of Car Verbal Representation Diagrammatic Representation
2
Explore: Lab 1: Buggy Lab
Watch the buggy move. What do you notice?
What KEY QUESTION should we investigate?
What is your INDEPENDENT variable?
What is your DEPENDENT variable?
What things must you CONTROL?
Open the google doc with the lab report template and save a copy for yourself, in your google drive. Or download the .docx version. Use this paper and that template as you complete the lab.
Procedure:
I have set up the hallway with metersticks. Your group will be assigned somewhere to start on the number line, and which direction to travel. Fill those in below.
1. We will start at a position of _________ cm on the number line. Our buggy will travel (toward 401 or toward 406).
3
Data Collection:
After you finish collecting data, you use your device to create a graph. Refer to the Making Graphs sheet. Paste your graph into your lab report, and then we will create a class graph. After that, as a class, we will discuss our findings.
Claims Evidence
Other notes:
Error Analysis:
4
Discussion 1: Motion Maps
Reading 1: Motion Maps
A motion map represents the position and velocity of an object at various clock readings. The dot on the number line shows the object's position, the arrow out of the dot shows the object's velocity, and the "t =" label on the dot shows the clock reading for each dot.
Suppose that you took a few photographs of a car moving to the right at constant velocity, where each image revealed the position of the car at one-second intervals.
The diagram below shows an example of the motion map that represents the car's motion. Indicate the position of the object with a dot on a number line. (We've chosen to measure position using the back of the car.) Indicate velocity with an arrow sticking out the dot. The clock reading for each dot should be labeled near the dot itself, one clock reading per dot.
The length of the velocity arrow shows the speed of the object at that clock reading.
If the car were moving faster and to the left, the photos and motion map would look different. The motion map shows the position dots spaced farther apart and the velocity arrows are longer, implying that the car is moving faster.
5
t = 3s
t = 0s
t = 1s
t = 2s
t = 0s
t = 1s
t = 2s
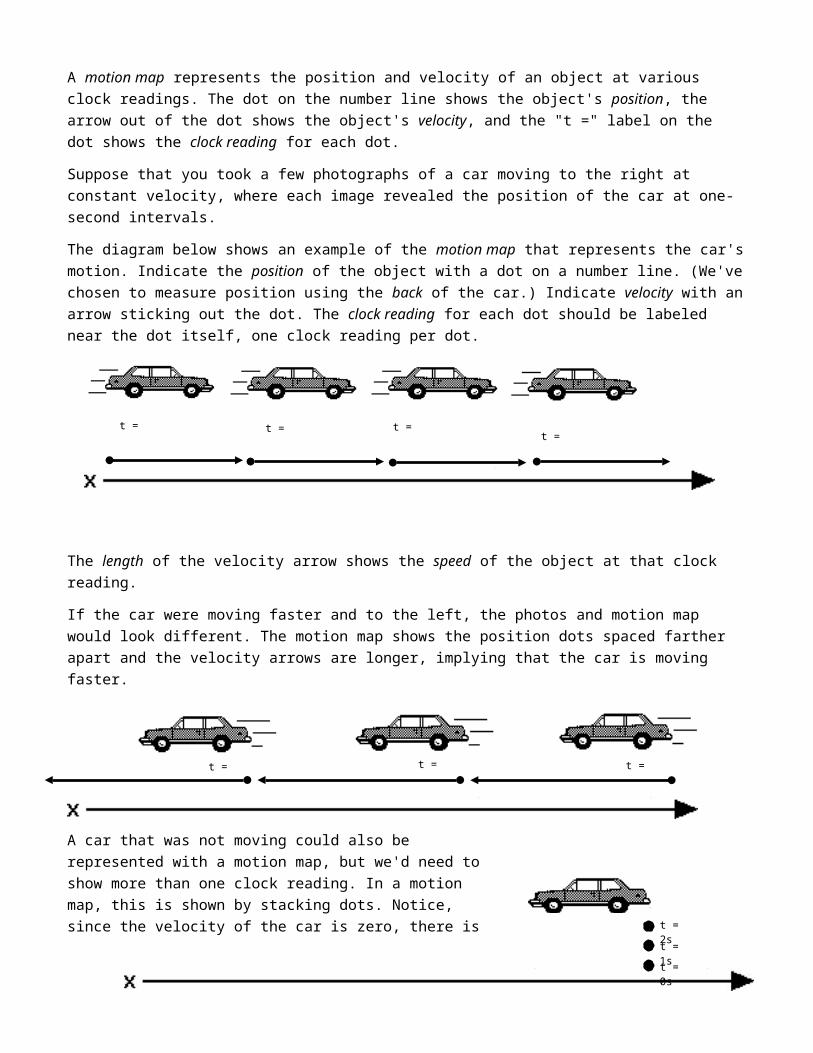
A car that was not moving could also be represented with a motion map, but we'd need to show more than one clock reading. In a motion map, this is shown by stacking dots. Notice, since the velocity of the car is zero, there is no arrow, and the position on the number line does not change.
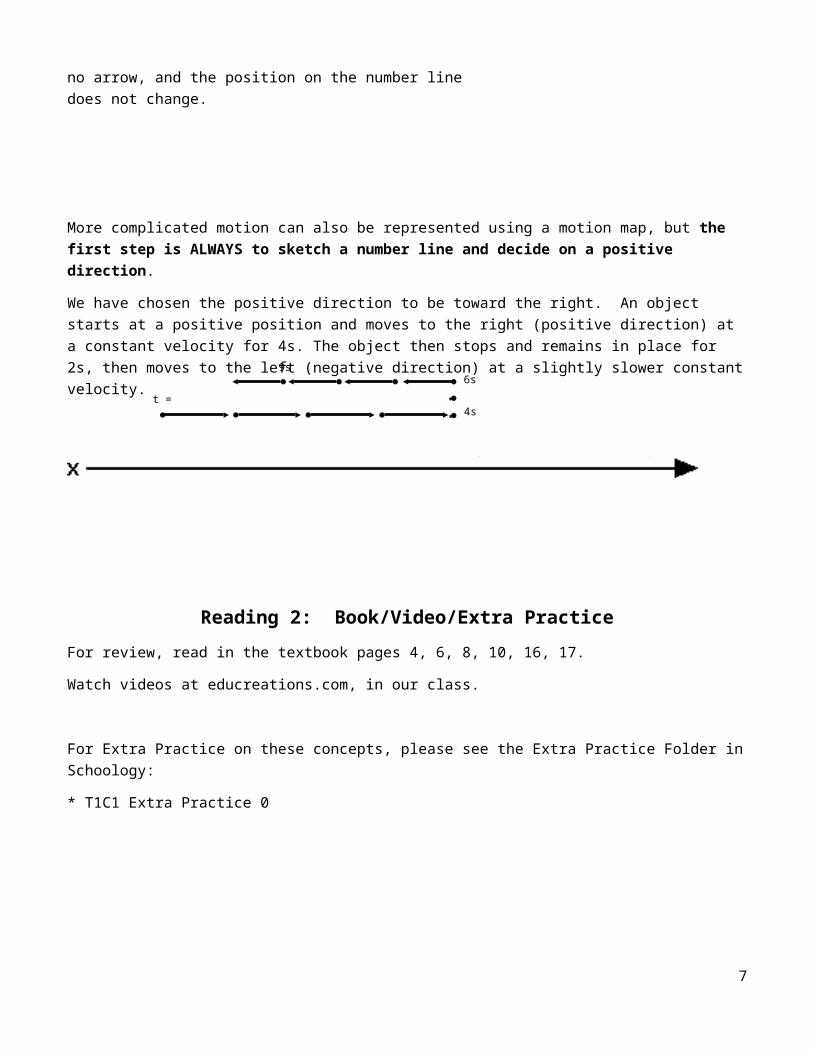
More complicated motion can also be represented using a motion map, but the first step is ALWAYS to sketch a number line and decide on a positive direction.
We have chosen the positive direction to be toward the right. An object starts at a positive position and moves to the right (positive direction) at a constant velocity for 4s. The object then stops and remains in place for 2s, then moves to the left (negative direction) at a slightly slower constant velocity.
Reading 2: Book/Video/Extra Practice
For review, read in the textbook pages 4, 6, 8, 10, 16, 17.
Watch videos at educreations.com, in our class.
For Extra Practice on these concepts, please see the Extra Practice Folder in Schoology:
* T1C1 Extra Practice 0
6
t = 0s 4s
6s9s
t = 2st = 1st = 0s
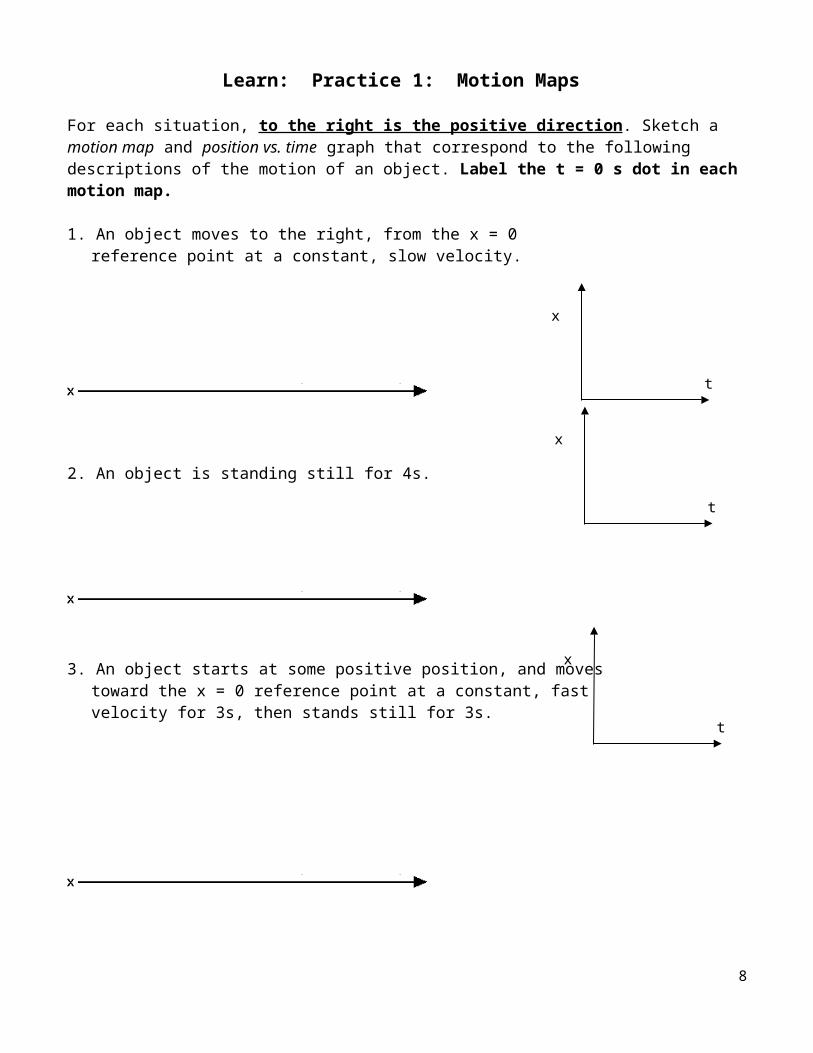
Learn: Practice 1: Motion Maps
For each situation, to the right is the positive direction. Sketch a motion map and position vs. time graph that correspond to the following descriptions of the motion of an object. Label the t = 0 s dot in each motion map.
1. An object moves to the right, from the x = 0 reference point at a constant, slow velocity.
2. An object is standing still for 4s.
3. An object starts at some positive position, and moves toward the x = 0 reference point at a constant, fast velocity for 3s, then stands still for 3s.
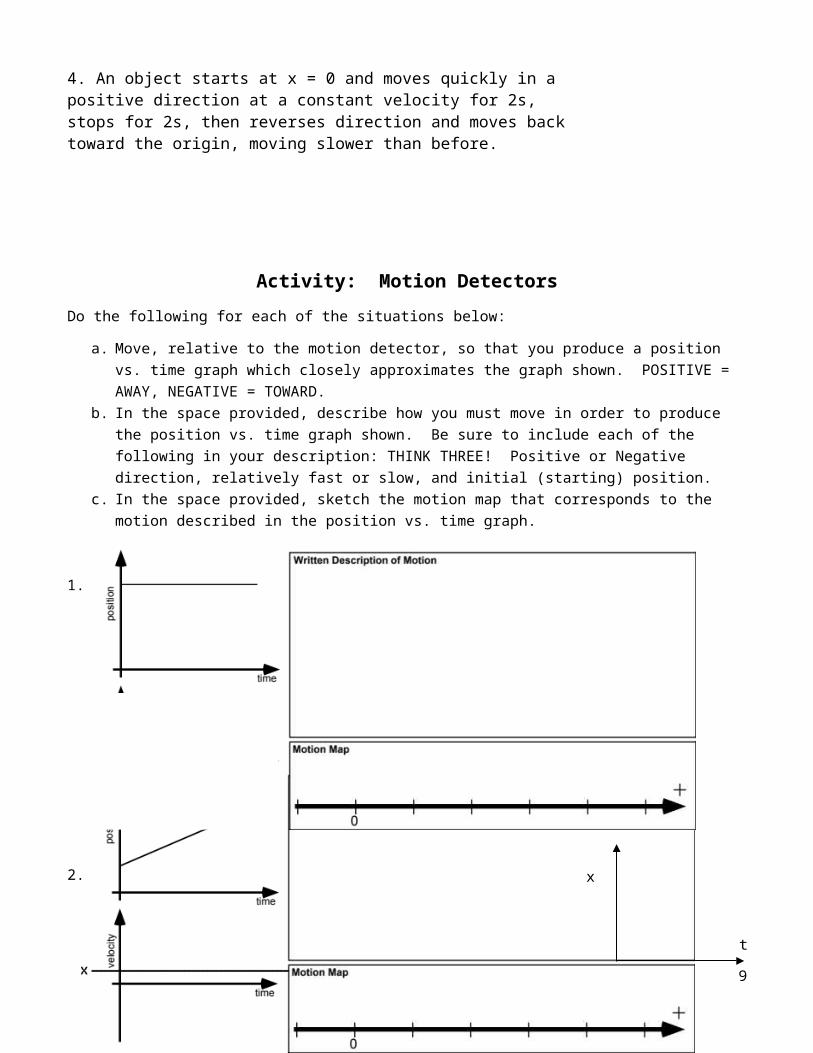
4. An object starts at x = 0 and moves quickly in a positive direction at a constant velocity for 2s, stops for 2s, then reverses direction and moves back toward the origin, moving slower than before.
7
t
x
t
x
t
x
tx
Activity: Motion Detectors
Do the following for each of the situations below:
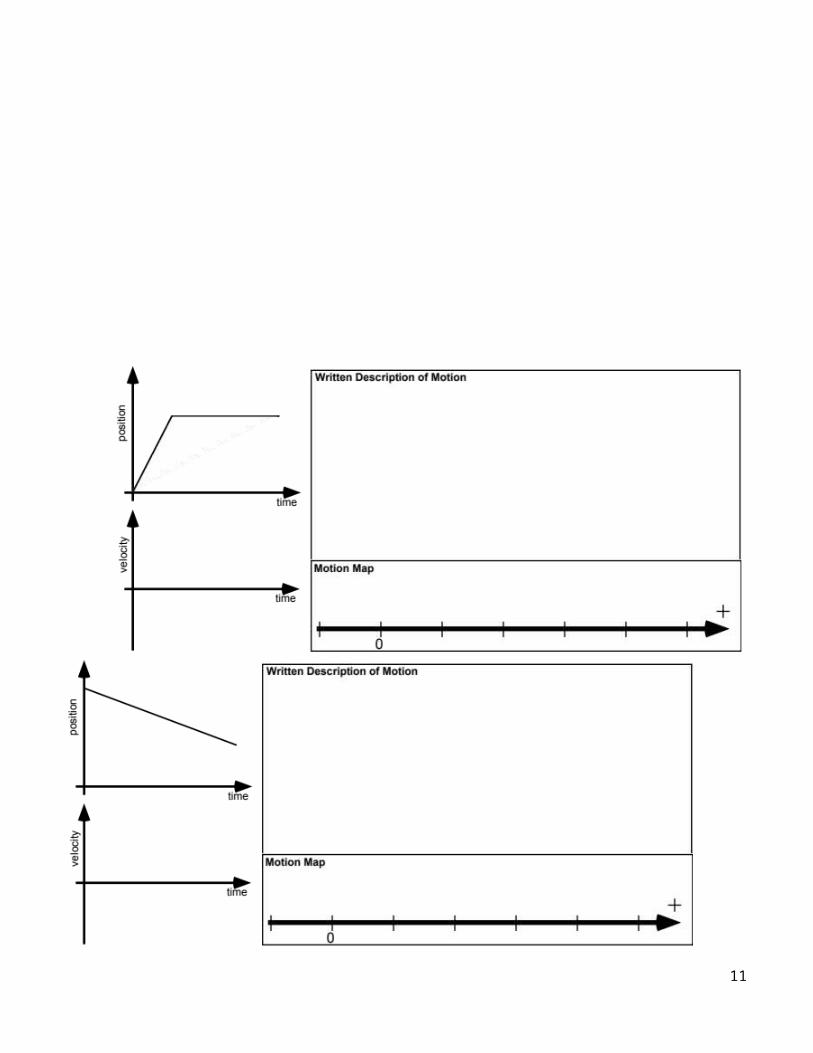
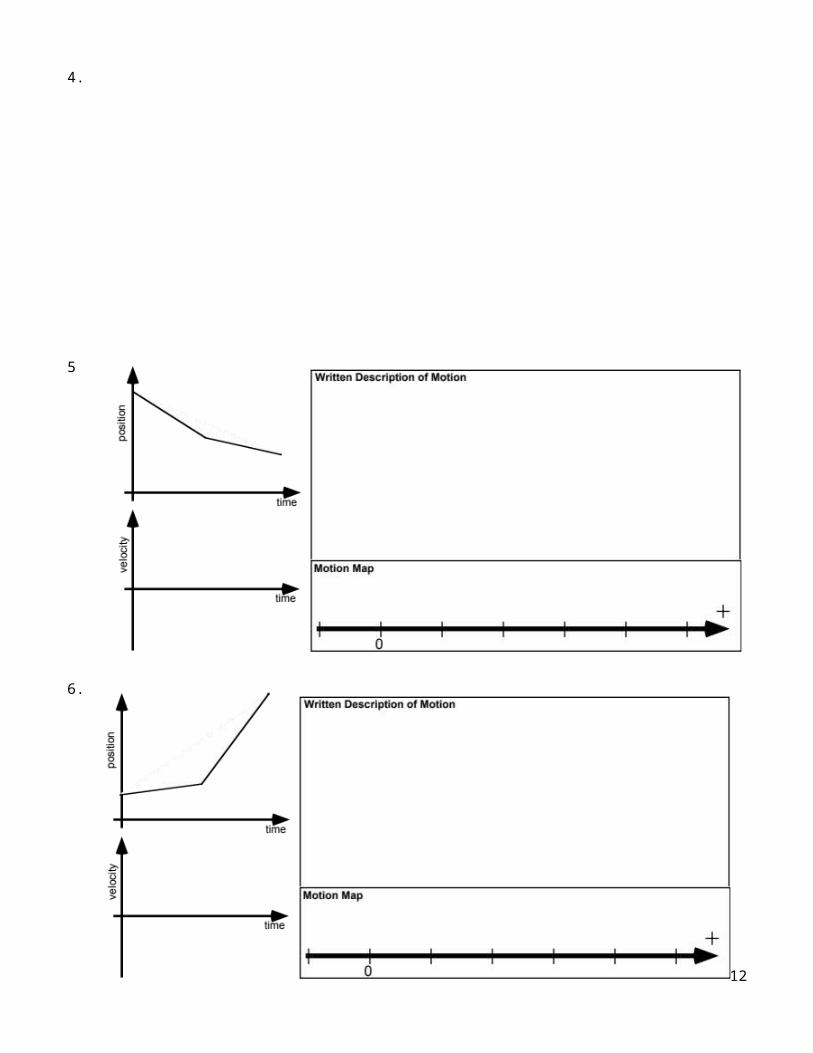
a. Move, relative to the motion detector, so that you produce a position vs. time graph which closely approximates the graph shown. POSITIVE = AWAY, NEGATIVE = TOWARD.
b. In the space provided, describe how you must move in order to produce the position vs. time graph shown. Be sure to include each of the following in your description: THINK THREE! Positive or Negative direction, relatively fast or slow, and initial (starting) position.
c. In the space provided, sketch the motion map that corresponds to the motion described in the position vs. time graph.
1.
2.
8
3.
4.
5
9

6.
7.
8.
10
Practice 2: Comparing x vs t graphs
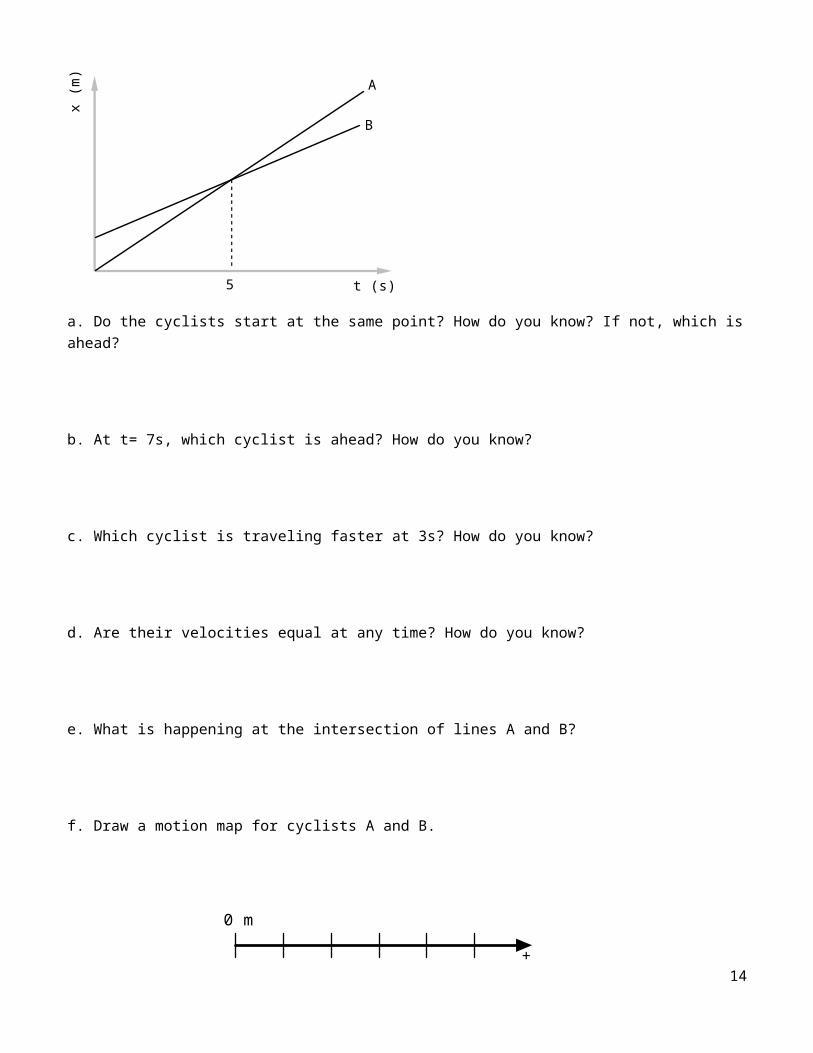
1. Consider the position vs. time graph below for cyclists A and B.
.
A
B
5 t (s)
x (m
)
a. Do the cyclists start at the same point? How do you know? If not, which is ahead?
b. At t= 7s, which cyclist is ahead? How do you know?
c. Which cyclist is traveling faster at 3s? How do you know?
d. Are their velocities equal at any time? How do you know?
e. What is happening at the intersection of lines A and B?
f. Draw a motion map for cyclists A and B.
11
0 m
+
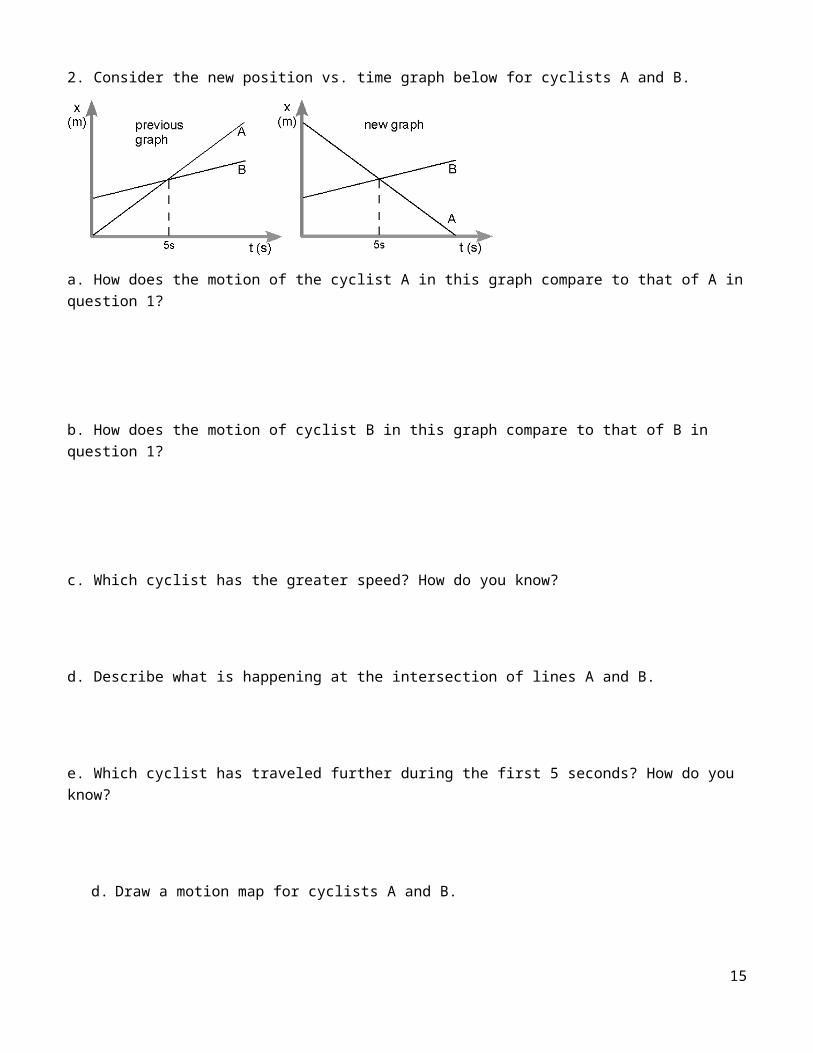
2. Consider the new position vs. time graph below for cyclists A and B.
a. How does the motion of the cyclist A in this graph compare to that of A in question 1?
b. How does the motion of cyclist B in this graph compare to that of B in question 1?
c. Which cyclist has the greater speed? How do you know?
d. Describe what is happening at the intersection of lines A and B.
e. Which cyclist has traveled further during the first 5 seconds? How do you know?
d. Draw a motion map for cyclists A and B.
0 m
+
***If needed, complete T1C1 Extra Practice 1 which can be found in Schoology in the Extra Practices folder.
12

Learn: Analyzing a Graph
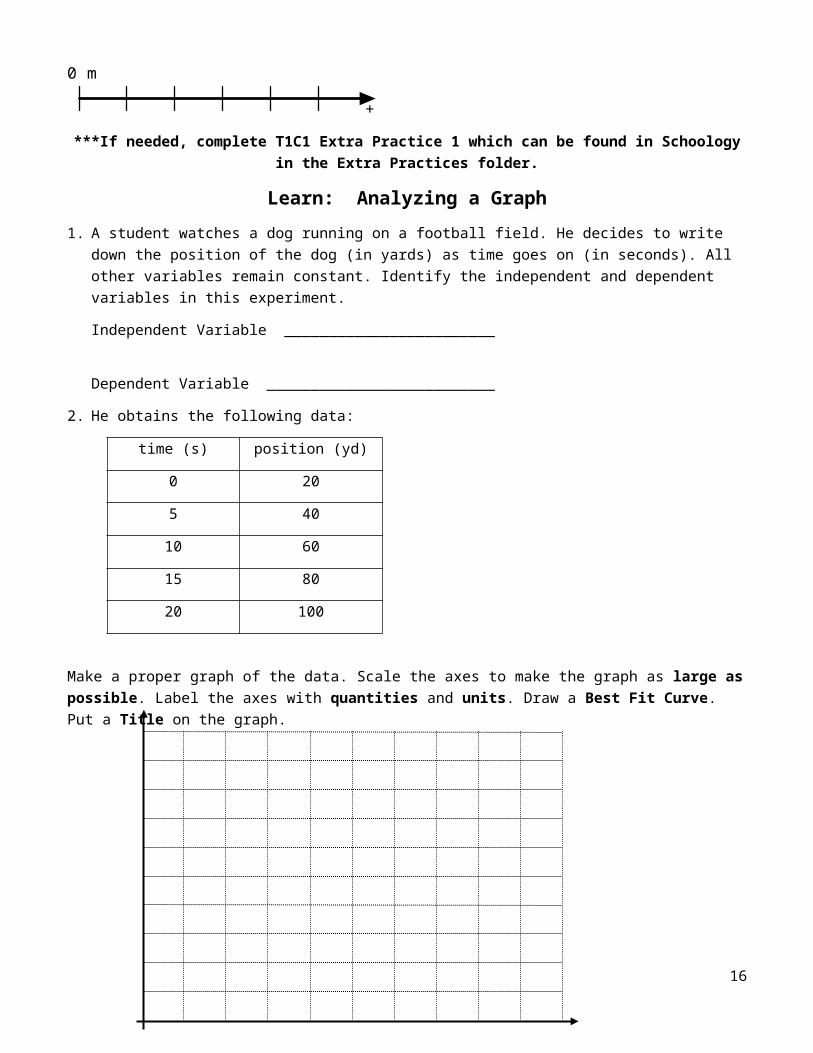
1. A student watches a dog running on a football field. He decides to write down the position of the dog (in yards) as time goes on (in seconds). All other variables remain constant. Identify the independent and dependent variables in this experiment.
Independent Variable ________________________
Dependent Variable __________________________
2. He obtains the following data:
time (s) position (yd)
0 20
5 40
10 60
15 80
20 100
Make a proper graph of the data. Scale the axes to make the graph as large as possible. Label the axes with quantities and units. Draw a Best Fit Curve. Put a Title on the graph.
3. Describe the motion of the dog.
13
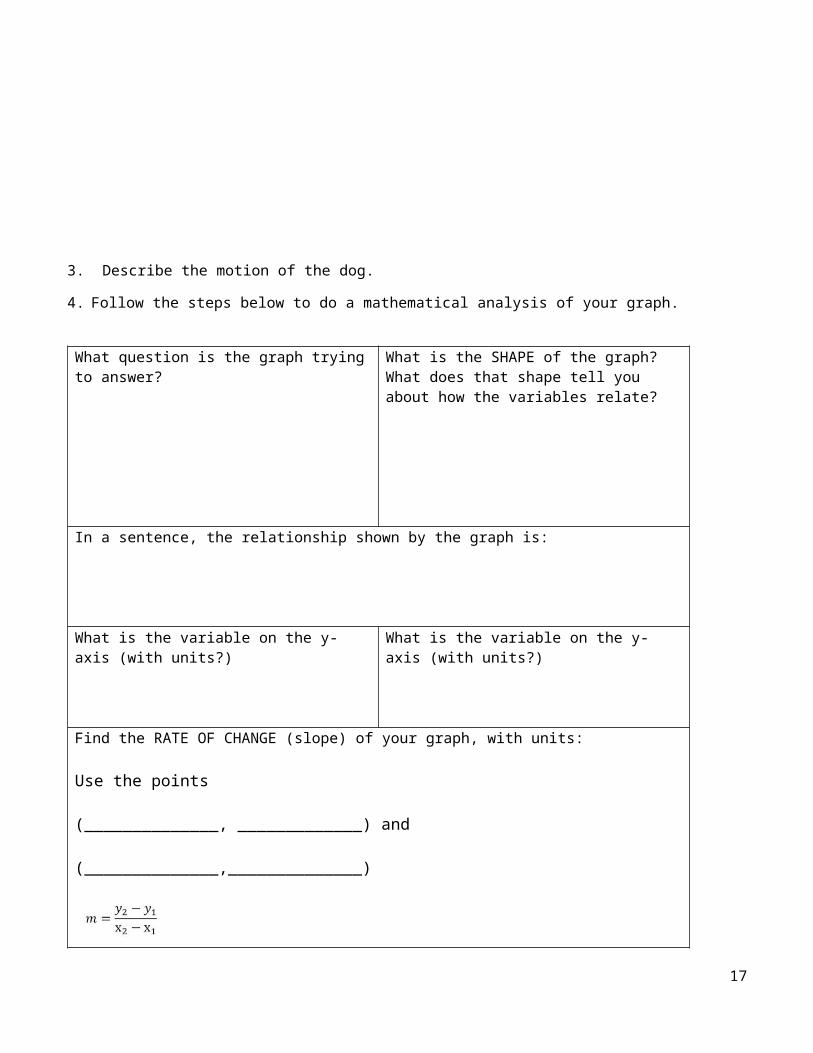
4. Follow the steps below to do a mathematical analysis of your graph.
What question is the graph trying to answer? What is the SHAPE of the graph? What does that shape tell you about how the variables relate?
In a sentence, the relationship shown by the graph is:
What is the variable on the y-axis (with units?) What is the variable on the y-axis (with units?)
Find the RATE OF CHANGE (slope) of your graph, with units:
Use the points (______________, _____________) and (______________,______________)
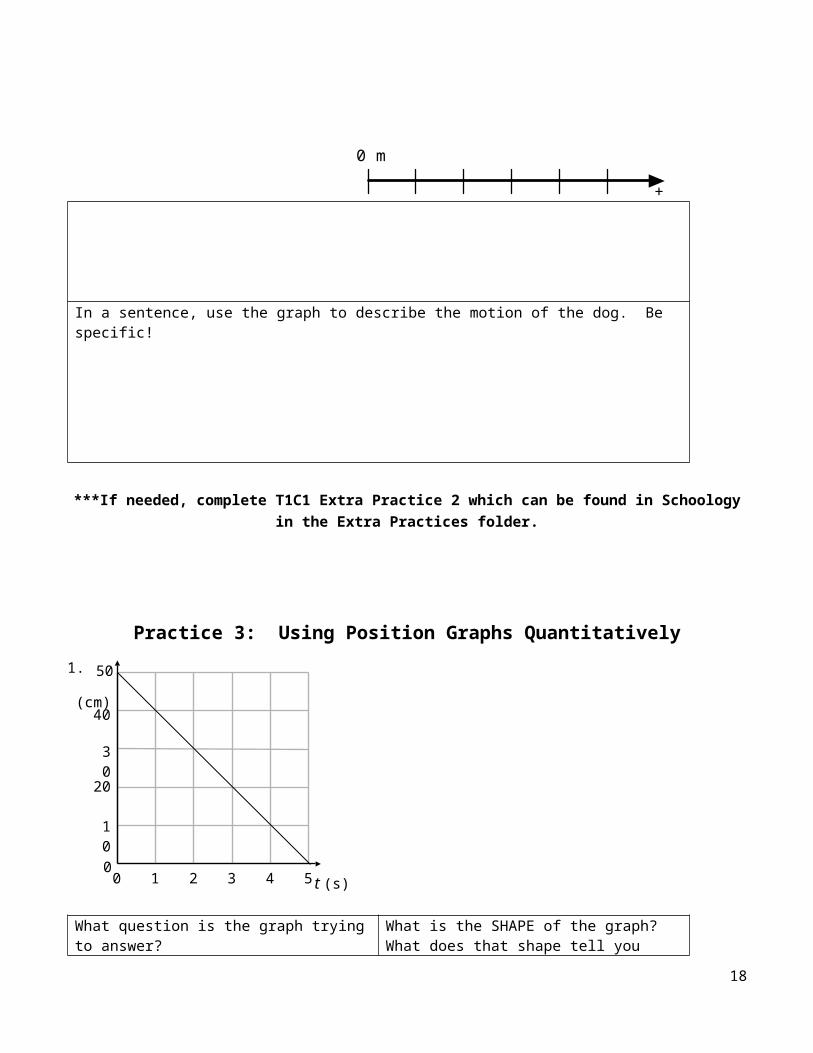
In a sentence, use the graph to describe the motion of the dog. Be specific!
***If needed, complete T1C1 Extra Practice 2 which can be found in Schoology in the Extra Practices folder.
14
Practice 3: Using Position Graphs Quantitatively
1.
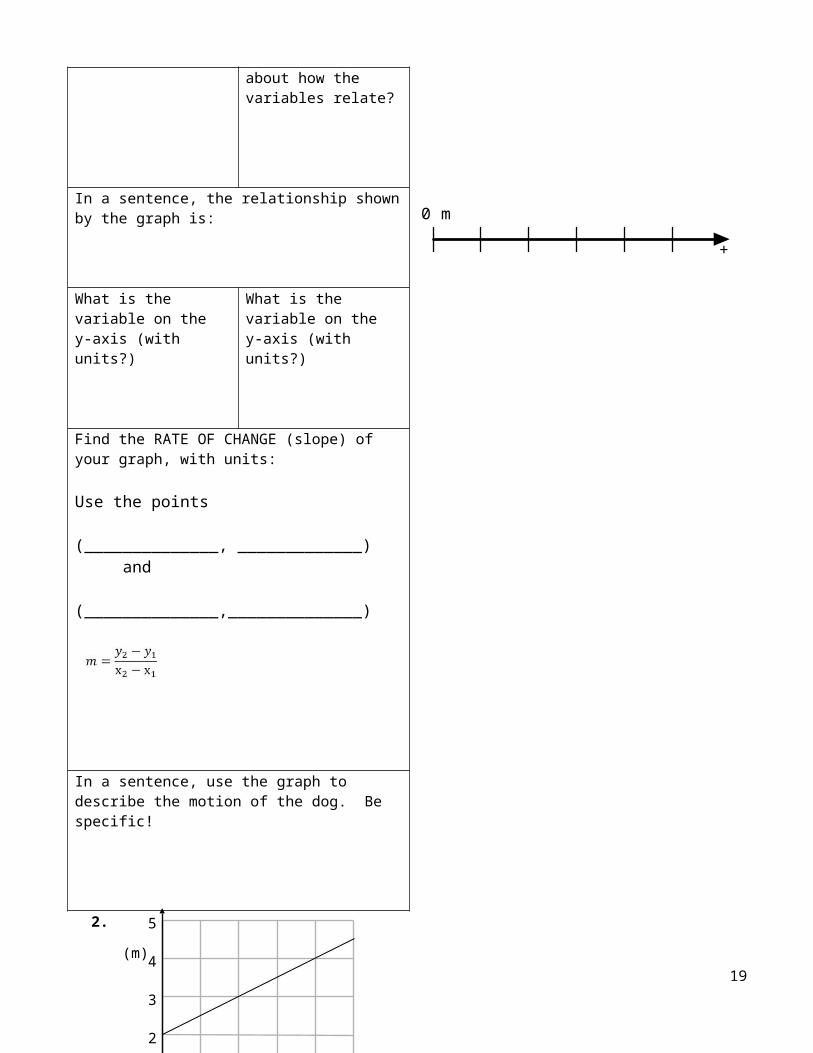
What question is the graph trying to answer? What is the SHAPE of the graph? What does that shape tell you about how the variables relate?
In a sentence, the relationship shown by the graph is:
What is the variable on the y-axis (with units?) What is the variable on the y-axis (with units?)
Find the RATE OF CHANGE (slope) of your graph, with units:
Use the points (______________, _____________) and (______________,______________)
In a sentence, use the graph to describe the motion of the dog. Be specific!
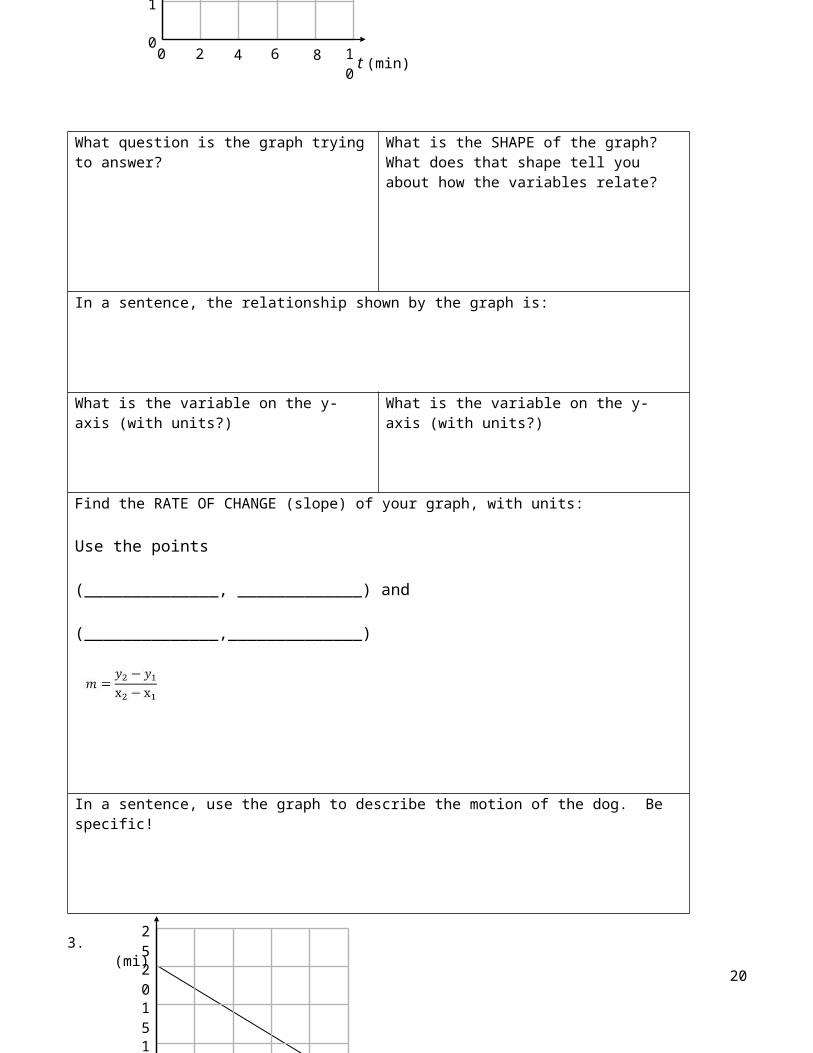
2.
15
10
0 3
30
01
40
20
50
42 5 t (s)
(cm)
(m)
3
4
2
5
0 m
+
What question is the graph trying to answer? What is the SHAPE of the graph? What does that shape tell you about how the variables relate?
In a sentence, the relationship shown by the graph is:
What is the variable on the y-axis (with units?) What is the variable on the y-axis (with units?)
Find the RATE OF CHANGE (slope) of your graph, with units:
Use the points (______________, _____________) and (______________,______________)
In a sentence, use the graph to describe the motion of the dog. Be specific!
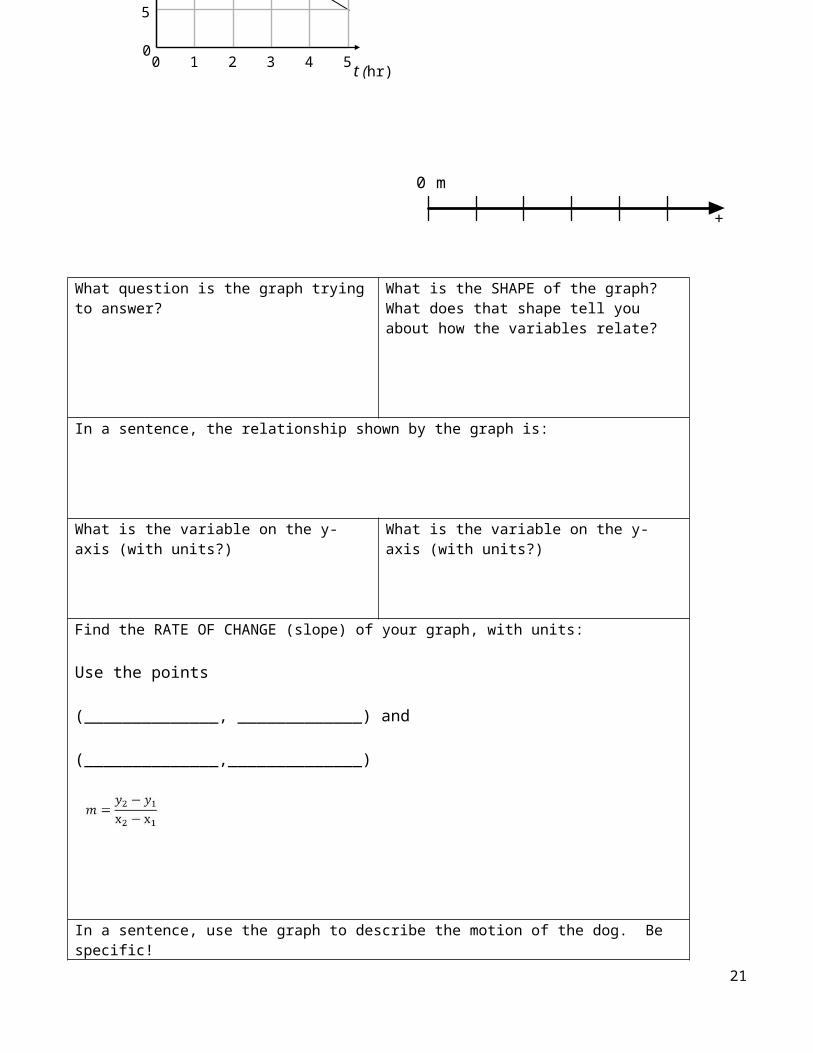
3.
16
(mi)
15
20
10
25
0 m
+
What question is the graph trying to answer? What is the SHAPE of the graph? What does that shape tell you about how the variables relate?
In a sentence, the relationship shown by the graph is:
What is the variable on the y-axis (with units?) What is the variable on the y-axis (with units?)
Find the RATE OF CHANGE (slope) of your graph, with units:
Use the points (______________, _____________) and (______________,______________)
In a sentence, use the graph to describe the motion of the dog. Be specific!
*If needed, complete T1C1 Extra Practices 3 and 4 which can be found in Schoology in the Extra Practices folder.
17
0 m
+
Practice 4: TIPERS tasks
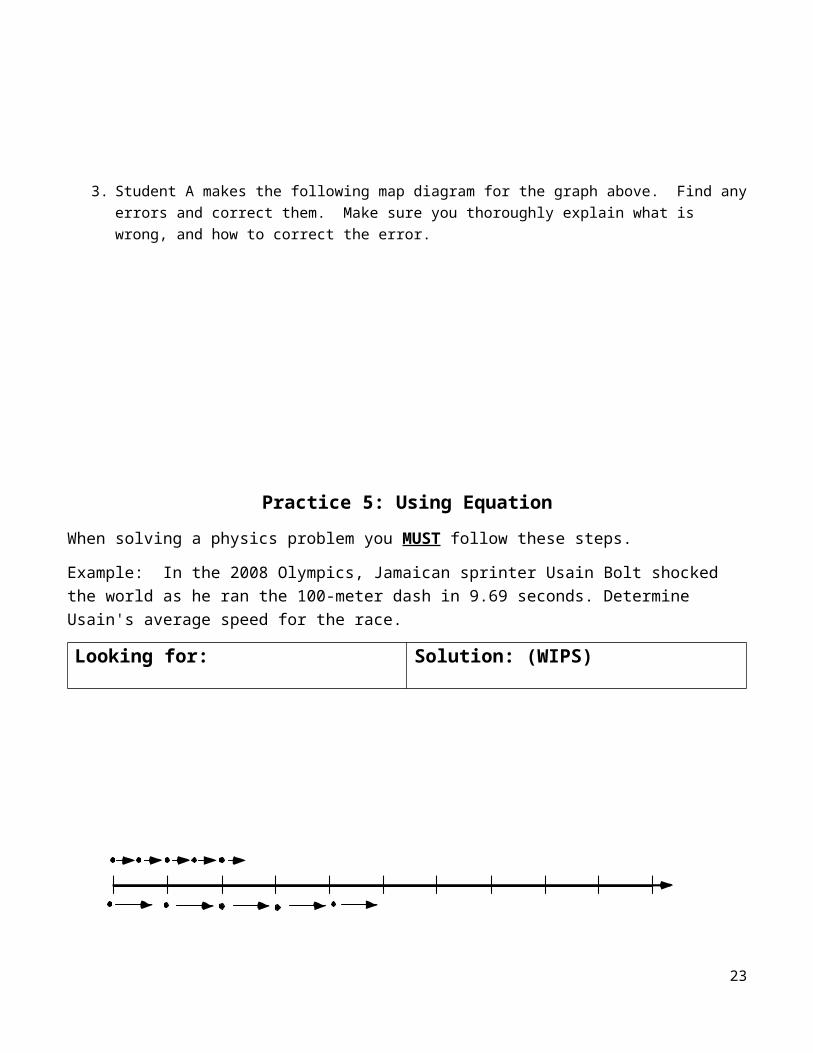
1. Compare the velocities of the cyclists, A and B, at the time t= 5.0 s on the position-time graph. Explain your reasoning.
2. With which, if any, of these students do you agree?
Student A says: Object A moves at a steady pace, while object B increases speed.
Student B says: No, object A and B move the same speed, because they are at the same place at 5.0 s.
Student C says: Yes, A and B are at the same place at 5.0 s, but B over takes A because he is picking up speed.
I agree with A B C none
Carefully explain your reasoning.
3. Student A makes the following map diagram for the graph above. Find any errors and correct them. Make sure you thoroughly explain what is wrong, and how to correct the error.
18
Position(m)
Time(s)
5 s
A
B
Position vs Time
Practice 5: Using Equation
When solving a physics problem you MUST follow these steps.
Example: In the 2008 Olympics, Jamaican sprinter Usain Bolt shocked the world as he ran the 100-meter dash in 9.69 seconds. Determine Usain's average speed for the race.
Looking for: Solution: (WIPS)
Given:
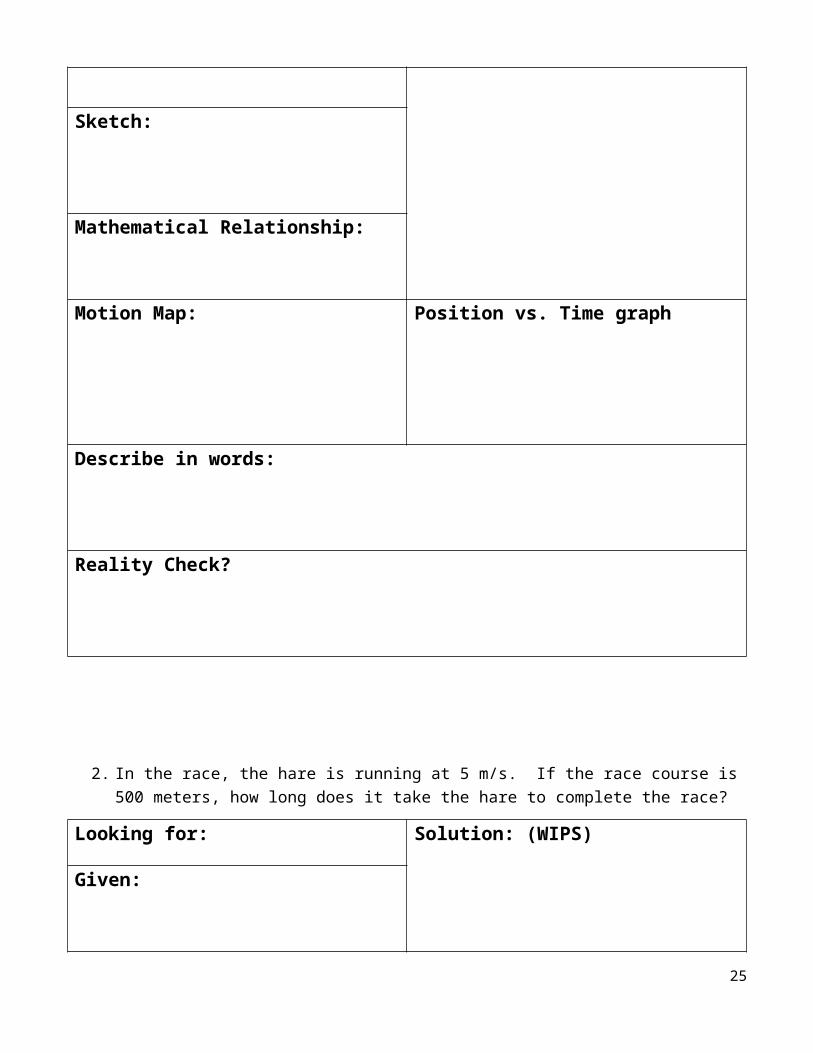
Sketch:
Mathematical Relationship:
Motion Map: Position vs. Time graph
Describe in words:
Reality Check?
19
1. The tortoise and the hare are having a race. If the race course is 500 meters long, and it take the tortoise 8 minutes (480 seconds) to reach the finish line, what is the tortoise’s average speed?
Looking for: Solution: (WIPS)
Given:
Sketch:
Mathematical Relationship:
Motion Map: Position vs. Time graph
Describe in words:
Reality Check?
20
2. In the race, the hare is running at 5 m/s. If the race course is 500 meters, how long does it take the hare to complete the race?
Looking for: Solution: (WIPS)
Given:
Sketch:
Mathematical Relationship:
Motion Map: Position vs. Time graph
Describe in words:
Reality Check?
21

3. In last week's Homecoming victory, Al Konfurance, the star halfback of South's football team, broke a tackle at the line of scrimmage and darted upfield untouched. He averaged 9.8 m/s for an 80-yard (73 m) score. Determine the time for Al to run from the line of scrimmage to the end zone.
Looking for: Solution: (WIPS)
Given:
Sketch:
Mathematical Relationship:
Motion Map: Position vs. Time graph
Describe in words:
Reality Check?
22
4. In the qualifying round of the 50-yd freestyle in the sectional swimming championship, Dugan got an early lead by finishing the first 25 yards in 10.1 seconds. However, Dugan got a leg cramp so was slower on the second 25 yards, taking 15.2 more seconds to reach the finish line. What was Dugan’s average speed for the entire race?
Looking for: Solution: (WIPS)
Given:
Sketch:
Mathematical Relationship:
Motion Map: Position vs. Time graph
Describe in words:
Reality Check?
23

5. Find the average speed of the buggy.
Looking for: Solution: (WIPS)
Given:
Sketch:
Mathematical Relationship:
Motion Map: Position vs. Time graph
Describe in words:
Reality Check?
Reading 3: Book/Video/Extra Practice
For review, read in the textbook pages 18-21.
24
0.0s 8.0s
105-5 0-10
Watch videos at educreations.com on our class page.
For Extra Practice, please see the Extra Practices Folder in Schoology:
* T1C1 Extra Practice 5* T1C1 Extra Practice 6
Apply: Challenge 1: Time Flies
The purpose of this challenge is to determine an unknown distance using only a stopwatch. I have marked off two distances outside; one is known, one is unknown.
How can you determine the unknown distance using only a stopwatch? Brainstorm your plan here.
For your final product, include the following: What was the challenge you were to solve? Write a paragraph explaining your plan for answering the question. A picture of your team solving the problem. A picture of the whiteboard showing your measurements and calculations. A few sentences describing how you could use a similar method to find something out in your
real life.
25