A. Wechsler Adult Intelligent Scale-Revised (Gen. Information)
Supplementary Material
Supplementary Methods
1. Cognitive assessments
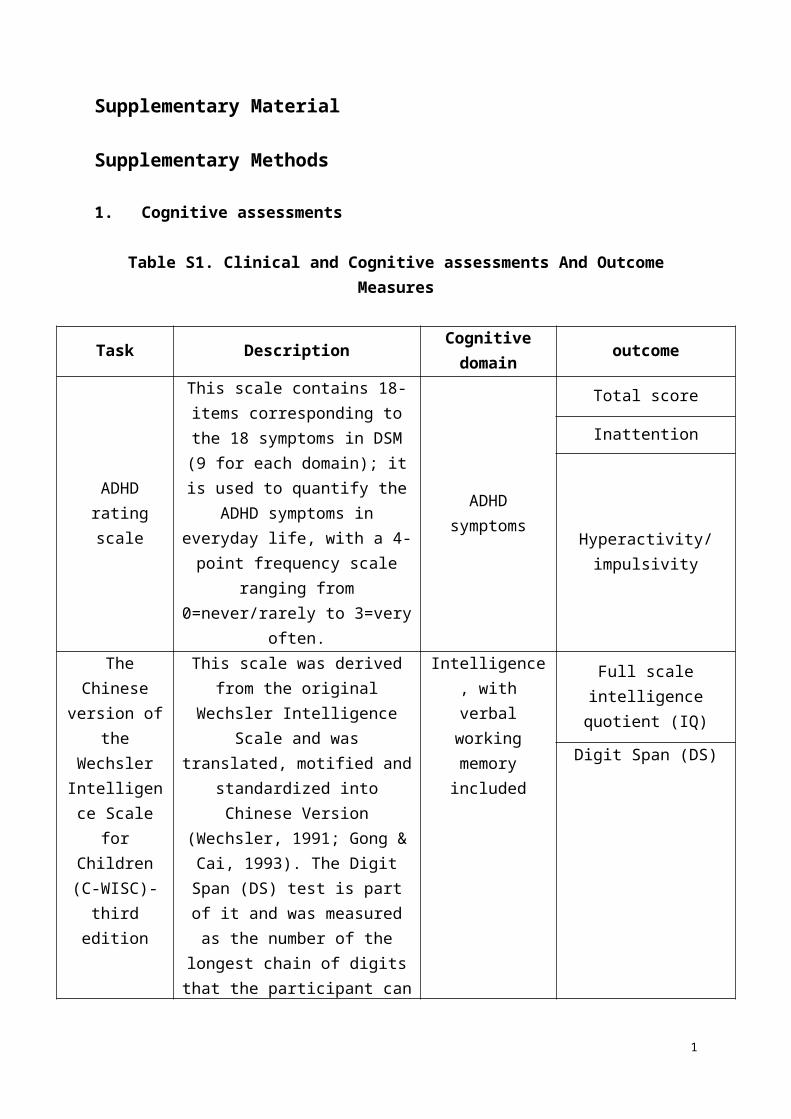
Table S1. Clinical and Cognitive assessments And Outcome Measures
Task Description Cognitive domain outcome
ADHD rating scale
This scale contains 18-items corresponding to the 18 symptoms in DSM (9 for each domain); it is
used to quantify the ADHD symptoms in everyday life, with a 4-point frequency scale ranging from 0=never/rarely to 3=very
often.
ADHD symptoms
Total score
Inattention
Hyperactivity/impulsivity
The Chinese version of the
Wechsler Intelligence
Scale for Children (C-WISC)-third
edition
This scale was derived from the original Wechsler Intelligence Scale
and was translated, motified and standardized into Chinese Version
(Wechsler, 1991; Gong & Cai, 1993). The Digit Span (DS) test is part of it and was measured as the
number of the longest chain of digits that the participant can copy
from the performer either in the same or reverse order, and the final score is standardized according to the Chinese norms (Gong & Cai,
1993)
Intelligence, with verbal working
memory included
Full scale intelligence quotient (IQ)
Digit Span (DS)
Behavior Rating
Inventory of Executive Function (BRIEF)
The BRIEF is a parent or teacher (in our case, parent is the
informant) report designed to assess the executive function in everyday behavior, and eight domains were
statistically derived after standardized quality control based on the inconsistency or negativity index. It was introduced to China
and modified into Mandarin version in 2006. Previously, data from our sample also indicated that children
Executive Funcition in Home
enviroment: Inhibition and
working memory
Inhibition (IB_P1)
Working memory (WM_P1)
1
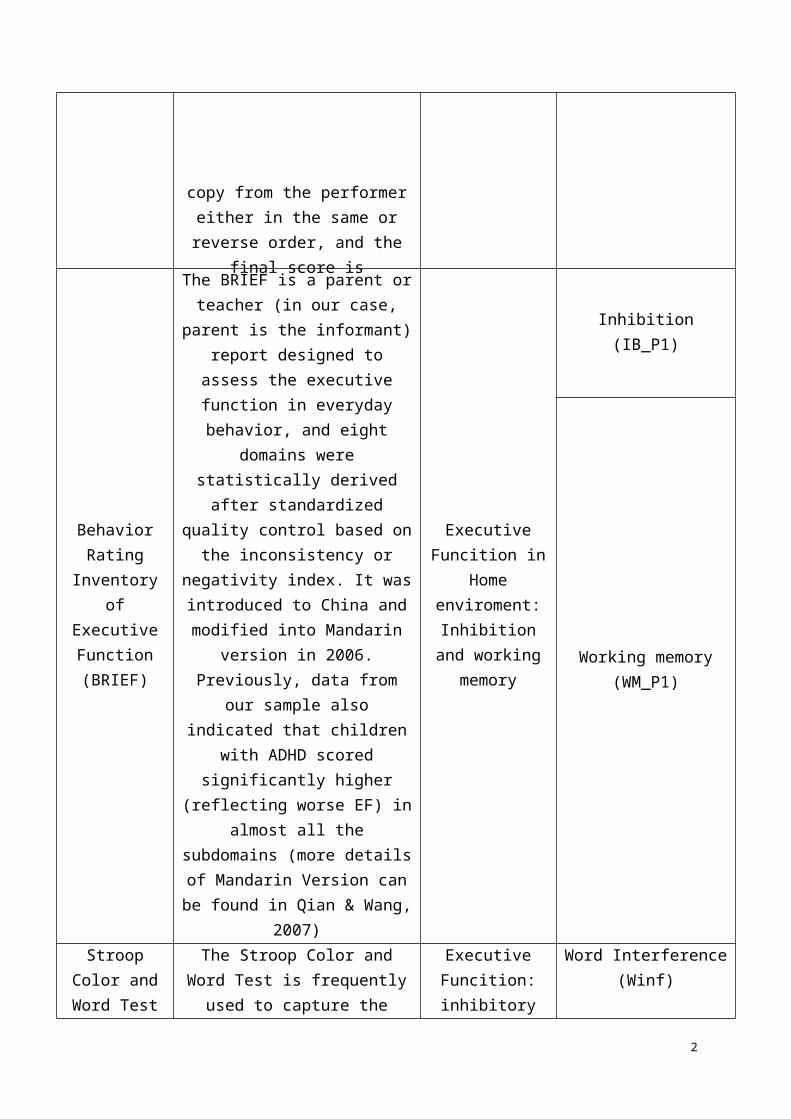
with ADHD scored significantly higher (reflecting worse EF) in
almost all the subdomains (more
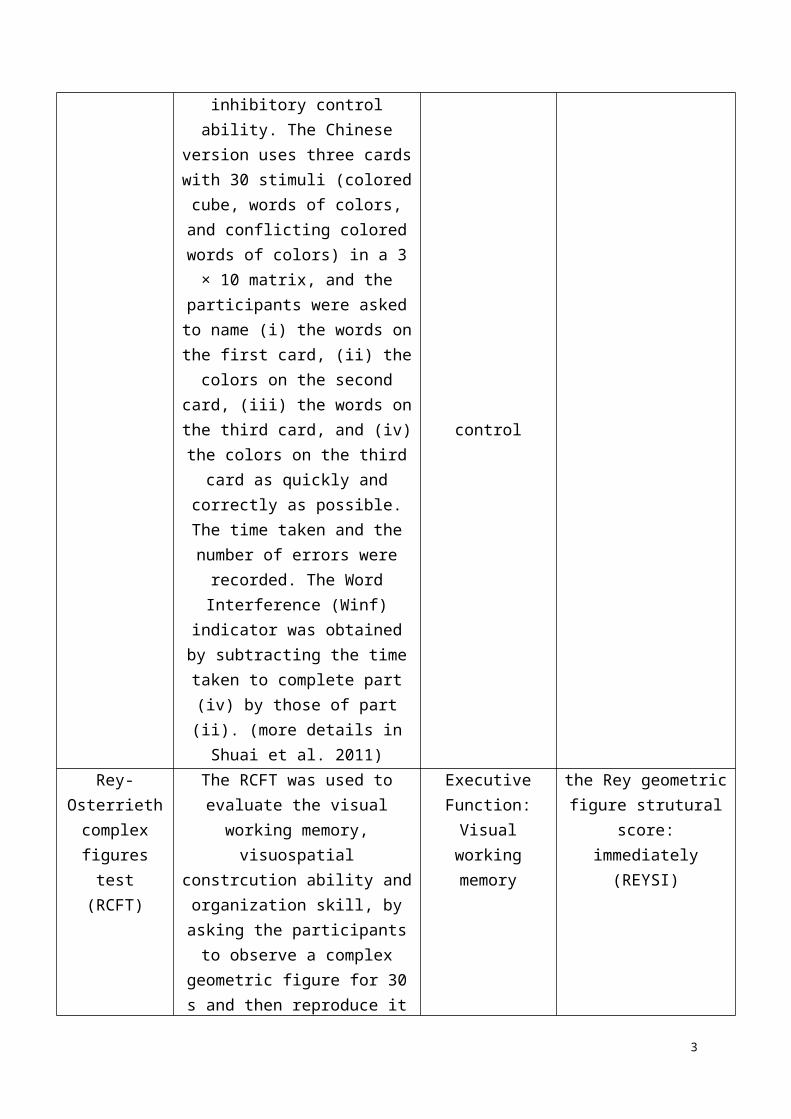
Stroop Color and Word Test
The Stroop Color and Word Test is frequently used to capture the inhibitory control ability. The
Chinese version uses three cards with 30 stimuli (colored cube,
words of colors, and conflicting colored words of colors) in a 3 × 10
matrix, and the participants were asked to name (i) the words on the
first card, (ii) the colors on the second card, (iii) the words on the
third card, and (iv) the colors on the third card as quickly and correctly as possible. The time taken and the
number of errors were recorded. The Word Interference (Winf)
indicator was obtained by subtracting the time taken to
complete part (iv) by those of part (ii). (more details in Shuai et al.
2011)
Executive Funcition:
inhibitory controlWord Interference (Winf)
Rey-Osterrieth complex
figures test (RCFT)
The RCFT was used to evaluate the visual working memory,
visuospatial constrcution ability and organization skill, by asking the
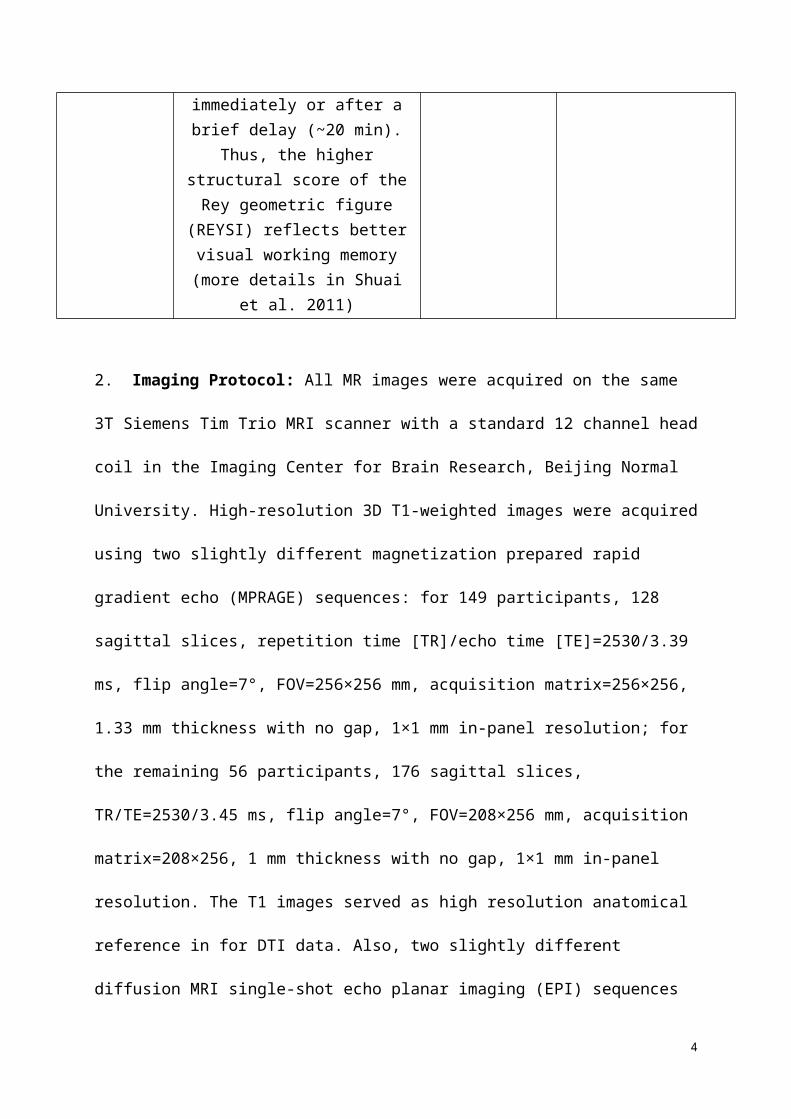
participants to observe a complex geometric figure for 30 s and then reproduce it immediately or after a
brief delay (~20 min). Thus, the higher structural score of the Rey geometric figure (REYSI) reflects
better visual working memory (more details in Shuai et al. 2011)
Executive Function: Visual working memory
the Rey geometric figure strutural score:
immediately (REYSI)
2. Imaging Protocol: All MR images were acquired on the same 3T Siemens Tim Trio
MRI scanner with a standard 12 channel head coil in the Imaging Center for Brain Research,
2
Beijing Normal University. High-resolution 3D T1-weighted images were acquired using two
slightly different magnetization prepared rapid gradient echo (MPRAGE) sequences: for 149
participants, 128 sagittal slices, repetition time [TR]/echo time [TE]=2530/3.39 ms, flip
angle=7°, FOV=256×256 mm, acquisition matrix=256×256, 1.33 mm thickness with no gap,
1×1 mm in-panel resolution; for the remaining 56 participants, 176 sagittal slices,
TR/TE=2530/3.45 ms, flip angle=7°, FOV=208×256 mm, acquisition matrix=208×256, 1 mm
thickness with no gap, 1×1 mm in-panel resolution. The T1 images served as high resolution
anatomical reference in for DTI data. Also, two slightly different diffusion MRI single-shot
echo planar imaging (EPI) sequences were axially applied : for 149 participants, 49 axial
slices, TR/TE=7200/104 ms, flip angle=90°, FOV=230×230 mm, matrix=128×128, 2.5 mm
thickness with no gap, 64 optimal nonlinear diffusion-weighted directions with b = 1000
s/mm2 and one additional image without diffusion weighting (i.e., b = 0 s/mm2), 1.8 × 1.8
mm in-plane resolution; for the remaining 56 participants, 47 axial slices, TR/TE=6900/104
ms, flip angle=90°, FOV=230×230 mm, matrix=128×128, 2.5 mm thickness with no gap, 64
optimal nonlinear diffusion-weighted directions with b = 1000 s/mm2 and one additional
image without diffusion weighting (i.e., b = 0 s/mm2), 1.8 × 1.8 mm in-plane resolution.
Acquisition protocol was included as covariate in all analyses.
3. Preprocessing and skeletonization of diffusion-weighted images: The diffusion-
weighted data was preprocessed using the PATCH algorithm(Zwiers, 2010). Briefly, the
diffusion-weighted images of each subject were realigned on the unweighted image using
mutual information routines from SPM8. Next, an iteratively reweighted-least-squares
algorithm (PATCH) was used to robustly correct for head and cardiac motion artifacts in the
diffusion-weighted data(Zwiers, 2010). Quality of images was checked manually both before
and after using the PATCH algorithm. Participants (2 ADHD and 4 controls) who showed
3
persistent head motion artifact after preprocessing were removed from subsequent analyses.
Later, DTIFIT from the FMRIB’s Diffusion Toolbox (part of FMRIB’s Software Library
(FSL)) was used to create the FA images and further feed them into the TBSS pipeline(Smith
et al, 2006) . Since there is no valid template for children and adolescents, a sample-specific
template was produced from 15 ADHD and 21 healthy control participants with highest
quality of the DTI images using the TBSS pipeline
(http://fsl.fmrib.ox.ac.uk/fsl/fslwiki/TBSS). Subsequently, individual FA images were
mapped onto the created skeleton resulting in a skeletonized FA image for each individual.
Finally, each participant’s FA, MD, AD, RD, and MO image was projected onto the skeleton,
and resultant data were used for voxel-wise statistics.
4. Hybrid modeling: FA was the only measure taken into the hybrid model since it
produced the most significant findings in both categorical and dimensional analysis. To assess
the co-existence of categorical and dimensional effects (for inattention,
hyperactivity/impulsivity and the total ADHD score), we tested the hybrid model for FA
images in two steps. The first step is to model the interaction of the ADHD symptom severity
scores and ADHD diagnosis. If the interaction of the two predictors was significant, then the
interaction regressor was added to the hybrid model. If the interaction regressor was not
significant, then the hybrid models were built without the interaction regressor. In the first
model, the robustness of categorical effects regardless of dimensional difference between the
two diagnostic groups was tested using the following predictors: 1) diagnostic group (ADHD,
Control coded as 1 or -1 depending on the categorical diagnosis); 2) the total score from the
ADHD Rating Scale-Ⅳ (to avoid collinearity, the inattention and hyperactivity/impulsivity
scores were not used separately); 3) additional covariates of no interest including age, sex,
scanning protocol. In the second model, the robustness of dimensional effects regardless of
4

categorical grouping effects was tested using the following predictors: 1) diagnostic group
(ADHD, Control coded as 1 or -1 depending on the categorical diagnosis); 2) the
hyperactivity/impulsivity score from the ADHD Rating Scale-Ⅳ(the inattention score was not
added due to the lack of dimensional effects); 3) additional covariates of no interest including
age, sex, and scanning protocol. The head motion parameter was added post-hoc to all the
models to investigate the potential effect of head motion.
5. Confounders: Post-hoc analyses including the sum of the six directions frame-wise
head motion parameters (relative motion displacement, RMD) or IQ as a covariate were
performed to investigate the potential effect of different head motion and/or IQ in the two
groups. Because of the different sex ratios in the two groups, we extracted two well-matched
subsample fromthe original cohort using the MatchIt package in R (Daniel E. Ho, 2011). On
those, we repeated the analysis with paired t test design. The sub-samples were matched on
sex, age and scanning protocols (demographic characteristics shown in Supplemental Table
S3).
6. Statistical analysis: The ROIs used to extract FA values were made as following steps.
1) Masks of regions of interest in standard space, namely the regions popped out in the voxel
based analysis, including genu and body of the corpus callosum, left internal capsule
(including anterior limb of internal capsule, posterior limb of internal capsule, retrolenticular
part of internal capsule, and superior fronto-occipital fasciculus), left anterior corona radiata,
left superior corona radiata, left posterior corona radiata, and left superior longitudinal
fasciculus, were made from the ICBM-DTI-81 white matter labels atlas; 2) these masks were
then non-linearly registered to the mean FA space of the whole group; 3) overlapping regions
of the categorical resultant image and these ROIs were calculated and assembled into final
5

ROIs. 4) dimensional ROIs were also constructed with the sample procedures, but majorly the
regions of interest are from the right hemisphere, including genu and body of the corpus
callosum, right internal capsule (anterior limb of internal capsule, posterior limb of capsule,
retrolenticular part of internal capsule, and superior fronto-occipital fasciculus (probably part
of anterior internal capsule)), right anterior corona radiata, right superior corona radiata, right
posterior corona radiata, and right superior longitudinal fasciculus.
Table S2. ROIs used for exploring the functional consequences of categorical or dimentional alterations in children with ADHD
Categorical ROIs Dimensional ROIsNames of ROIs Size (Voxel) Names of ROIs Size (Voxel)
Genu of CC 457 Genu of CC 257Body of CC 582 Body of CC 165
Internal Capsule_L 533Internal
Capsule_R774
SLF_L 957 SLF_R 118ACR_L 723 ACR_R 348SCR_L 473 SCR_R 327PCR_L 247 PCR_R 171
Abbreviation: ACR anterior corona radiata, CC corpus callosum; PCR posterior corona radiata, SCR superior corona radiata; SLF superior longitudinal fasciculus
6

Supplementary Results
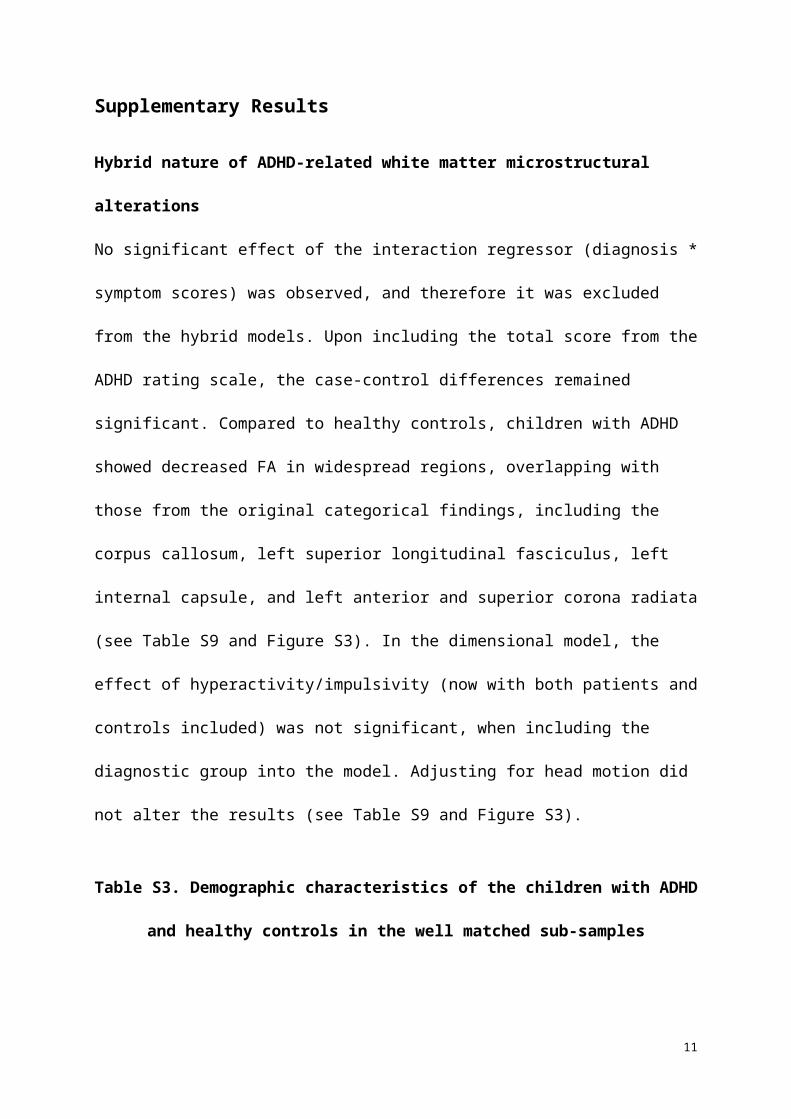
Hybrid nature of ADHD-related white matter microstructural alterations
No significant effect of the interaction regressor (diagnosis * symptom scores) was observed,
and therefore it was excluded from the hybrid models. Upon including the total score from the
ADHD rating scale, the case-control differences remained significant. Compared to healthy
controls, children with ADHD showed decreased FA in widespread regions, overlapping with
those from the original categorical findings, including the corpus callosum, left superior
longitudinal fasciculus, left internal capsule, and left anterior and superior corona radiata (see
Table S9 and Figure S3). In the dimensional model, the effect of hyperactivity/impulsivity
(now with both patients and controls included) was not significant, when including the
diagnostic group into the model. Adjusting for head motion did not alter the results (see Table
S9 and Figure S3).
Table S3. Demographic characteristics of the children with ADHD and healthy controls
in the well matched sub-samples
Matched SubsampleADHD
(n=67)
Control
(n=67)P-value
Gender (Males/Females) 57/10 57/10 --
Age (years) 11.10±1.96 10.90±1.82 0.52
IQ 107.2±13.08 119.1±13.30 <0.001
RMD 0.80±0.29 0.72±0.19 0.06
Matched Male-only
Subsample
ADHD
(n=57)
Control
(n=57)P-value
Age (years) 11.2±1.92 10.9±1.75 0.48
IQ 108.9±12.51 120.2±13.30 <0.001
RMD 0.80±0.30 0.72±0.20 0.08
Table S4. Clusters showing significant differences in FA between children with ADHD and controls after adjusting for IQ
7
Cluster Index
White matter tracts a
(size of overlap > 10 voxels)
Size(voxels) b
MNI coordinate(x; y; z;)
P value c
Clusters showing significant differences in FA between ADHD and control group after adjusting for IQ1 PCR (L), SLF (L) 718 -36;-28;32 0.0352 SLF (L) 122 -34;6;23 0.0443 PCR (L) 73 -25;-62;28 0.048
Abbreviation: PCR posterior corona radiata, SLF superior longitudinal fasciculus.
a white matter tracts as defined with the JHU ICBM-DTI-81 White-Matter Labels
b Cluster size > 50 voxels
c p < 0.05, FWE-corrected, controlling for gender, age and scan acquisition protocol
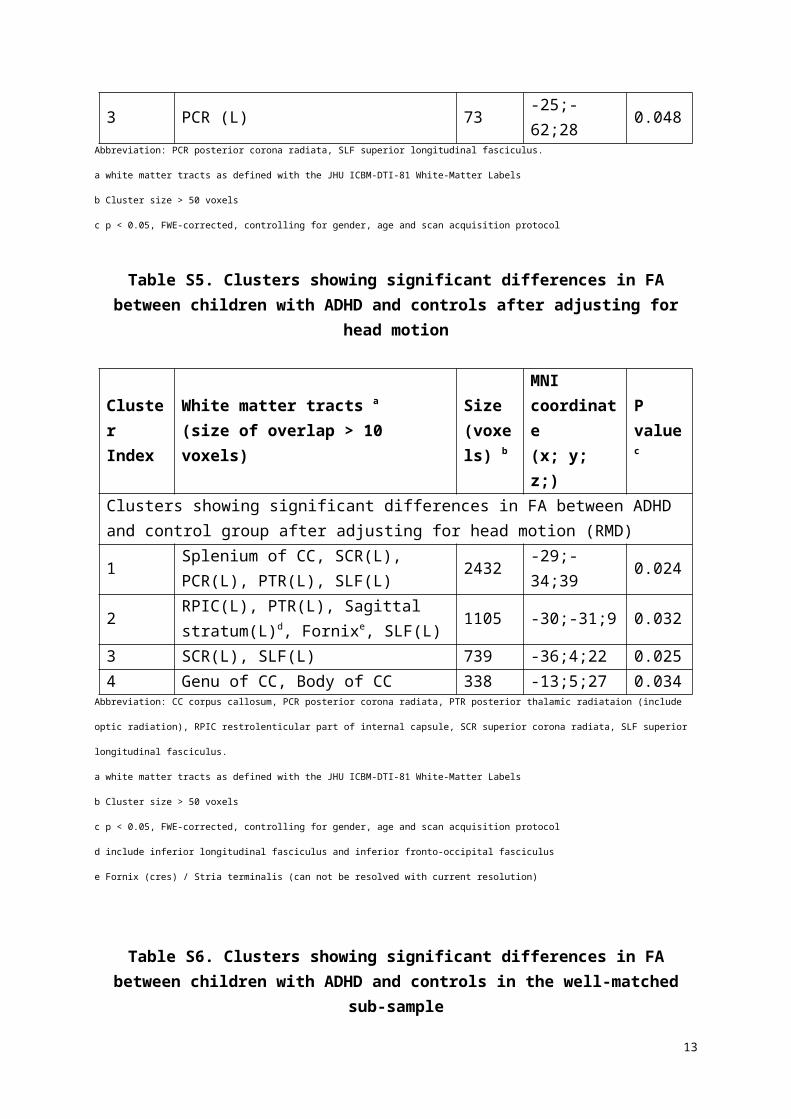
Table S5. Clusters showing significant differences in FA between children with ADHD and controls after adjusting for head motion
Cluster Index
White matter tracts a
(size of overlap > 10 voxels)
Size(voxels) b
MNI coordinate(x; y; z;)
P value c
Clusters showing significant differences in FA between ADHD and control group after adjusting for head motion (RMD)
1Splenium of CC, SCR(L), PCR(L), PTR(L), SLF(L)
2432 -29;-34;39 0.024
2RPIC(L), PTR(L), Sagittal stratum(L)d, Fornixe, SLF(L)
1105 -30;-31;9 0.032
3 SCR(L), SLF(L) 739 -36;4;22 0.0254 Genu of CC, Body of CC 338 -13;5;27 0.034
Abbreviation: CC corpus callosum, PCR posterior corona radiata, PTR posterior thalamic radiataion (include optic radiation), RPIC restrolenticular part of
internal capsule, SCR superior corona radiata, SLF superior longitudinal fasciculus.
a white matter tracts as defined with the JHU ICBM-DTI-81 White-Matter Labels
b Cluster size > 50 voxels
c p < 0.05, FWE-corrected, controlling for gender, age and scan acquisition protocol
d include inferior longitudinal fasciculus and inferior fronto-occipital fasciculus
e Fornix (cres) / Stria terminalis (can not be resolved with current resolution)
Table S6. Clusters showing significant differences in FA between children with ADHD and controls in the well-matched sub-sample
Cluster Index
White matter tracts a
(size of overlap > 10 voxels)
Size(voxels) b
MNI coordinate(x; y; z;)
P value c
8
Clusters showing significant differences in FA between ADHD and control group in a well-matched sub-sample1 SCR(L), SLF(L) 759 -36;-30;32 0.0312 SCR(L), SLF(L) 606 -36;5;21 0.0263 Forceps Minord 111 -16;41;26 0.0424 RPIC(L) 100 -30;-33;11 0.0445 ACR(L) 82 -24;21;8 0.0486 ILF(L) 59 -41;-39;-3 0.046
Abbreviation: ACR anterior corona radiata, ILF inferior longitudinal fasciculus, RPIC restrolenticular part of internal capsule, SCR superior corona radiata, SLF
superior longitudinal fasciculus.
a white matter tracts as defined with the JHU ICBM-DTI-81 White-Matter Labels
b Cluster size > 50 voxels
c p < 0.05, FWE-corrected, controlling for gender, age and scan acquisition protocol
d it was unclassified in the ICBM-DTI-81 labels and thus the Johns JHU White-Matter Tractography Atlas was used here
Table S7. Clusters showing significant differences in FA between children with ADHD and controls in the well-matched male only sub-sample
Cluster Index
White matter tracts a
(size of overlap > 10 voxels)
Size(voxels) b
MNI coordinate(x; y; z;)
P value c
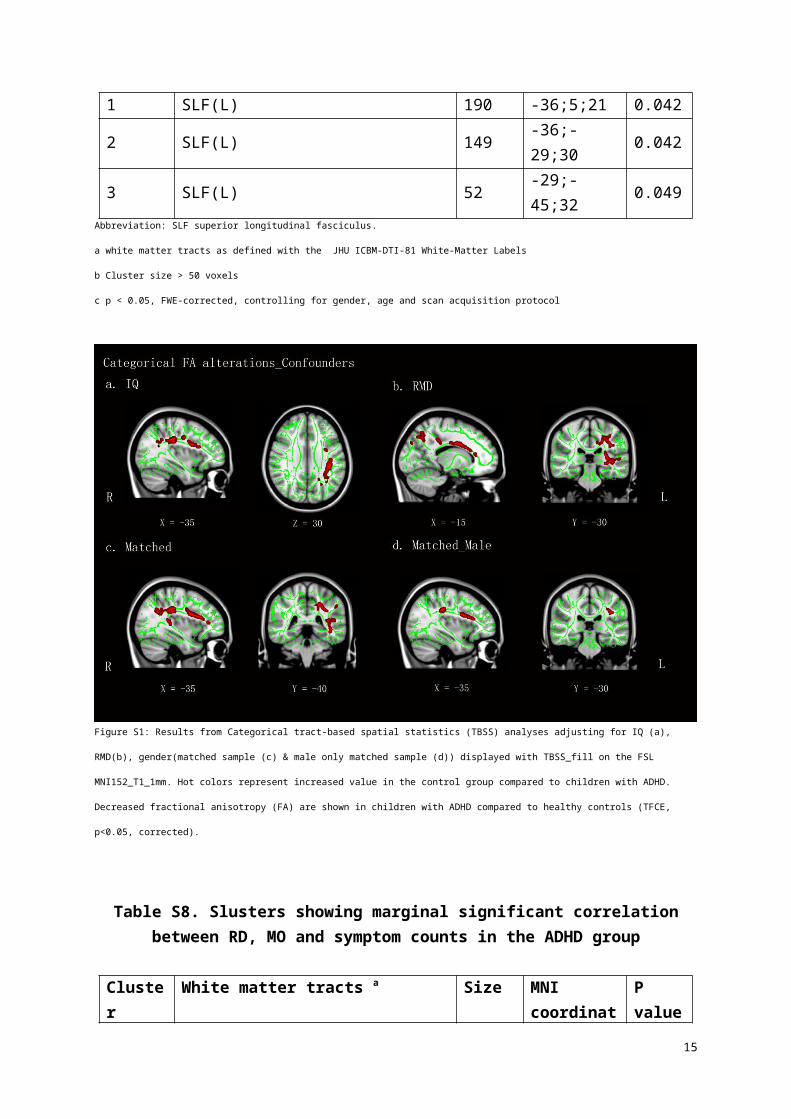
Clusters showing significant differences in FA between ADHD and control group in a well-matched male only sub-sample1 SLF(L) 190 -36;5;21 0.0422 SLF(L) 149 -36;-29;30 0.0423 SLF(L) 52 -29;-45;32 0.049
Abbreviation: SLF superior longitudinal fasciculus.
a white matter tracts as defined with the JHU ICBM-DTI-81 White-Matter Labels
b Cluster size > 50 voxels
c p < 0.05, FWE-corrected, controlling for gender, age and scan acquisition protocol
9

Figure S1: Results from Categorical tract-based spatial statistics (TBSS) analyses adjusting for IQ (a), RMD(b), gender(matched sample (c) & male only matched
sample (d)) displayed with TBSS_fill on the FSL MNI152_T1_1mm. Hot colors represent increased value in the control group compared to children with ADHD.
Decreased fractional anisotropy (FA) are shown in children with ADHD compared to healthy controls (TFCE, p<0.05, corrected).
Table S8. Slusters showing marginal significant correlation between RD, MO and symptom counts in the ADHD group
Cluster Index
White matter tracts a
(size of overlap > 10 voxels)
Size(voxels) b
MNI coordinate(x; y; z;)
P value c
RD Clusters with marginally significantly negative correlation with the Hyperactivity/impulsivity symptom counts in ADHD participants
1
Genu of CC, Body of CC, Splenium of CC, CP (R), ALIC (R), PLIC (R), RPIC (R), ACR (R), SCR (R), PCR (R), PTR (R), Sagittal Stratum (including ILF & IFOF)(R), EC, Fornix (cres) / Stria terminalis (R), SLF (R), SFOF (R), Tapetum (R)
8516 17;21;27 0.055
2 ALIC (L), ACR (L), SCR (L) 670 -21;29;1 0.0813 SLF (L)d 433 -14;16;47 0.09
4ATR (L)d, Cingulum (cingulate gyrus) (L)d, Forceps Minord, IFOF (L)d 423 -17;58;7 0.085
5 ACR (L) 92 -15;48;-8 0.0996 SCR (L) 71 -25;9;31 0.099
10
7 ATR (L)d 54 -29;41;10 0.097MO Clusters with marginally significantly positive correlation with the Hyperactivity/impulsivity symptom counts in ADHD participants1 ALIC (R), ACR (R), SCR (R), SFOF (R) 434 26;17;17 0.0552 CP (R), PLIC (R), RPIC (R) 215 23;-19;-3 0.076
Abbreviation: ACR anterior corona radiata, ATR anterior thalamic radiation, CC corpus callosum; CP cerebral peduncle, CST Corticospinal tract, EC external
capsule, FA fractional anisotropy, ILF inferior longitudinal fasciculus, IFOF inferior fronto-occipital fasciculus, PCR posterior corona radiata, RD radial
anisotropy, SCR superior corona radiata; SLF superior longitudinal fasciculus, RPIC retrolenticular part of internal capsule, PTR posterior thalamic
radiation(include optic radiation), UF Uncinate fasciculus.
a white matter tracts as defined with the JHU ICBM-DTI-81 White-Matter Labels
b Cluster size > 50 voxels
c p < 0.10, FWE-corrected, controlling for gender, age and scan acquisition protocol
d it was unclassified in the ICBM-DTI-81 labels and thus the JHU White-Matter Tractography Atlas was used here
11
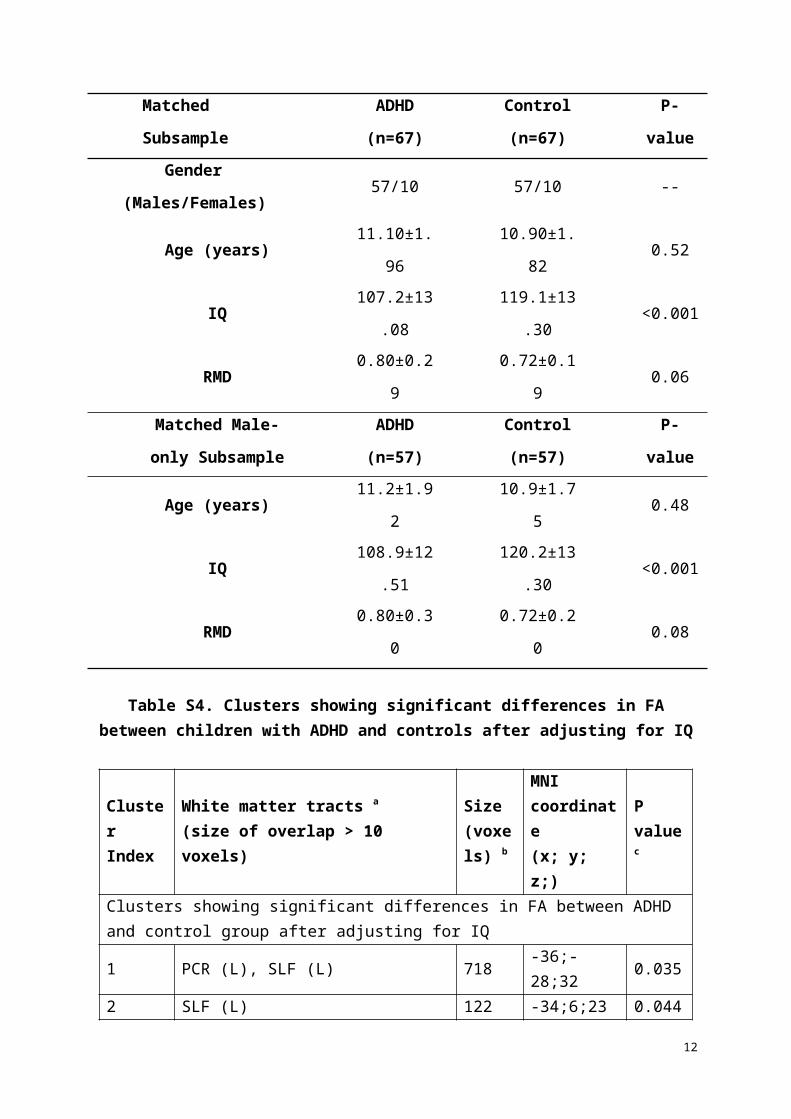
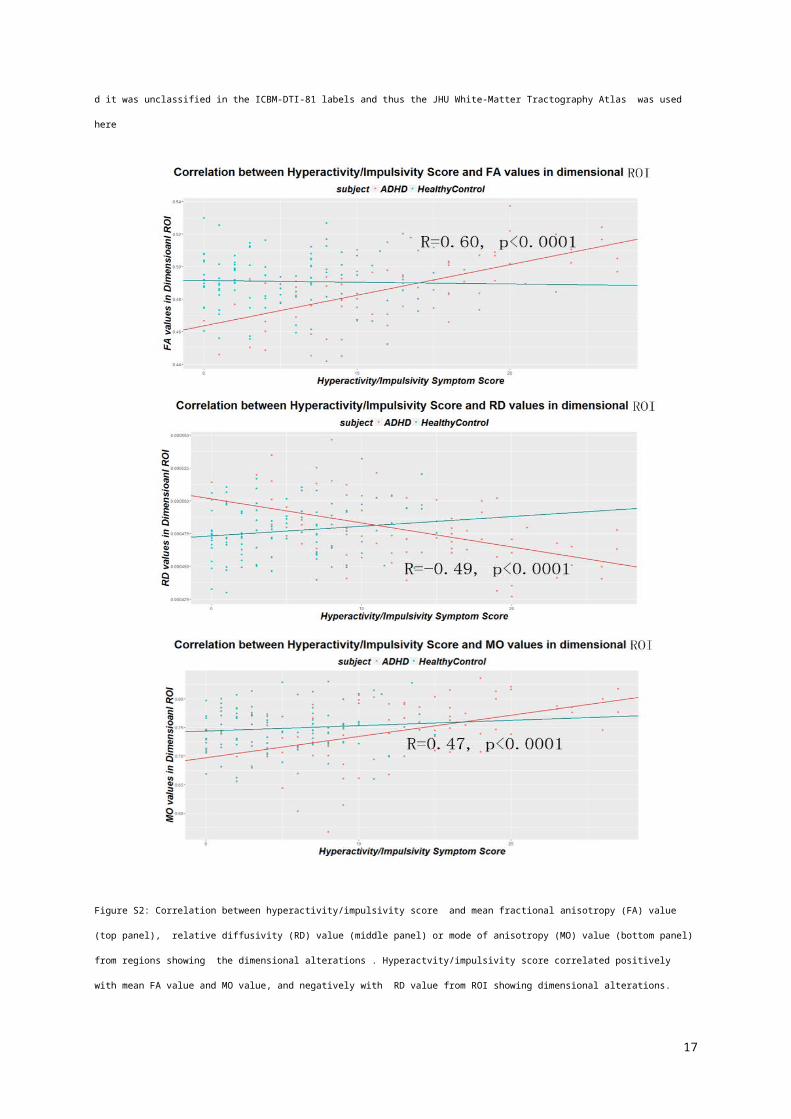
Figure S2: Correlation between hyperactivity/impulsivity score and mean fractional anisotropy (FA) value (top panel), relative diffusivity (RD) value (middle
panel) or mode of anisotropy (MO) value (bottom panel) from regions showing the dimensional alterations . Hyperactvity/impulsivity score correlated positively
with mean FA value and MO value, and negatively with RD value from ROI showing dimensional alterations.
Table S9. Clusters showing significant differences in FA between children with ADHD and controls after adjusting for ADHD symptom severity
12
Cluster Index
White matter tracts a
(size of overlap > 10 voxels)
Size(voxels) b
MNI coordinate(x; y; z;)
P value c
Clusters showing significant differences in FA between ADHD and control group after adjusting for symptom severity
1Genu of CC, Body of CC, ALIC(L), ACR(L), SCR(L), EC(L), Cingulum, SLF(L), SFOF(L)d
5001 -37;22;15 0.044
2 Splenium of CC, PCR(L), SLF(L) 787 -41;-52;18 0.049Clusters showing significant differences in FA between ADHD and control group after adjusting for symptom severity (with RMD as covariates)
1
Genu of CC, Body of CC, Splenium of CC, ALIC(L), RPIC(L), ACR(L), SCR(L), PCR(L), PTR(L), Sagittal stratume, EC(L), Cingulum, Fornixf, SLF(L), SFOF(L),
12299 -37;22;15 0.04
2Genu of CC, Body of CC, ALIC(R), ACR(R), SCR(R),SLF(R)
2253 21;38;2 0.046
Abbreviation: ACR anterior corona radiata, ALIC anterior limb of internal capsule, CC corpus callosum, ILF inferior longitudinal fasciculus, EC external capsule,
PCR posterior corona radiata, PTR posterior thalamic radiataion (include optic radiation), RPIC restrolenticular part of internal capsule, SCR superior corona
radiata, SFOF superior fronto-occipital fasciculus, SLF superior longitudinal fasciculus.
a white matter tracts as defined with the JHU ICBM-DTI-81 White-Matter Labels
b Cluster size > 50 voxels
c p < 0.05, FWE-corrected, controlling for gender, age and scan acquisition protocol
d could be a part of aneterior interal capsule
e include inferior longitudinal fasciculus and inferior fronto-occipital fasciculus
f Fornix (cres) / Stria terminalis (can not be resolved with current resolution)
13
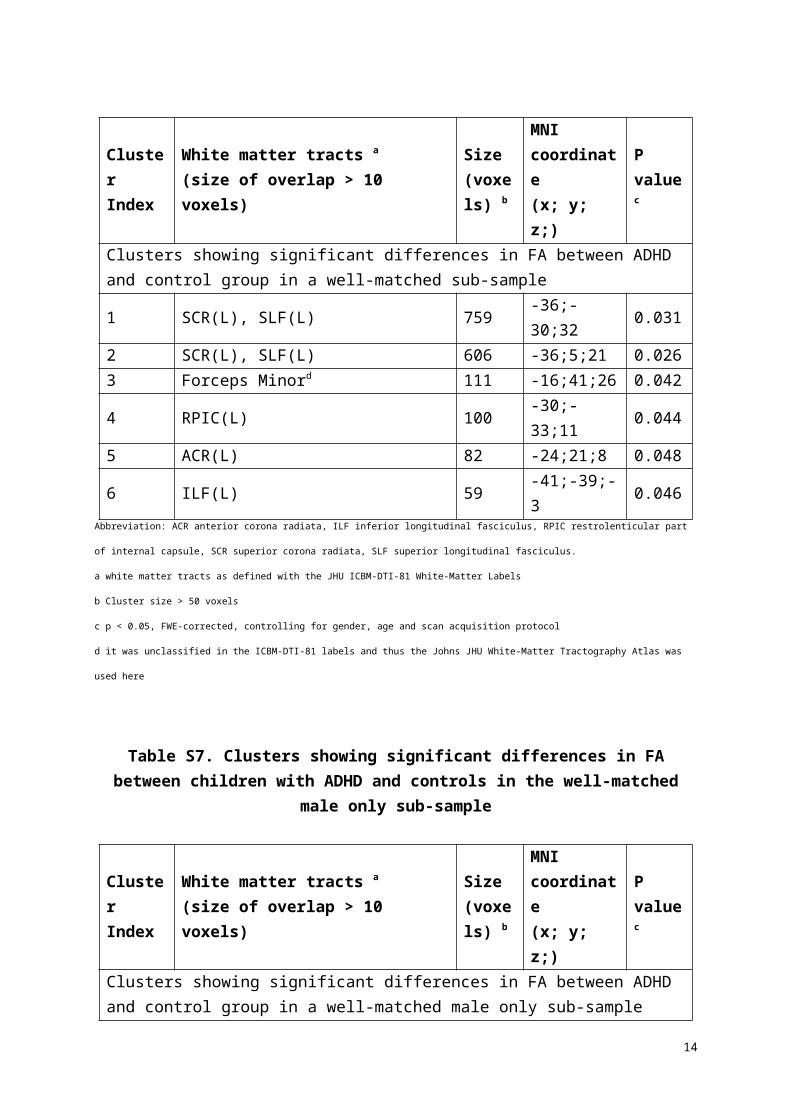
Figure S3: Results from the categorical tract-based spatial statistics (TBSS) analyses adjusting for total scores from the ADHD rating scale, without (a) or with
(b) adjusting for head motion (RMD), displayed with TBSS_fill on the FSL MNI152_T1_1mm brain. Hot colors represent increased values in the control group
compared to children with ADHD. Decreased fractional anisotropy (FA) is shown in children with ADHD compared to healthy controls (TFCE, p<0.05,
corrected).
Table S10. Correlation between extracted FA values from categorical ROIs and cognitive assessments in healthy control (HC) and children with ADHD
Indicator ROIs r in HC p in HC pfdr in HC r in ADHD p in ADHD pfdr in ADHD
Winf
ACR_L 0.01 0.93 0.93 -0.28 0.01 0.02SCR_L -0.12 0.23 0.61 -0.33 0.005 0.02PCR_L -0.05 0.64 0.93 -0.02 0.86 0.86IC_L -0.11 0.26 0.61 -0.30 0.01 0.02
SLF_L -0.02 0.87 0.93 -0.04 0.76 0.86Genu of
CC-0.19 0.06 0.42 -0.11 0.37 0.53
Body of CC
0.02 0.87 0.93 0.11 0.38 0.53
IB_P1 ACR_L 0.04 0.70 0.82 0.10 0.49 0.69SCR_L -0.07 0.51 0.82 0.14 0.33 0.58PCR_L -0.01 0.94 0.94 -0.04 0.81 0.81IC_L -0.26 0.02 0.14 0.16 0.27 0.58
SLF_L -0.05 0.68 0.82 -0.05 0.72 0.81
14
Genu of CC
-0.13 0.26 0.82 0.30 0.04 0.28
Body of CC
-0.08 0.50 0.82 0.15 0.31 0.58
WM_P1
ACR_L 0.06 0.58 0.81 0.11 0.46 0.88SCR_L -0.13 0.24 0.81 0.18 0.21 0.88PCR_L 0.10 0.35 0.81 -0.02 0.89 0.89IC_L 0.01 0.91 0.98 0.09 0.54 0.88
SLF_L 0.16 0.14 0.81 0.04 0.78 0.89Genu of
CC0.003 0.98 0.98 0.07 0.63 0.88
Body of CC
-0.08 0.49 0.81 0.14 0.32 0.88
DS
ACR_L 0.11 0.27 0.43 -0.09 0.46 0.75SCR_L 0.08 0.40 0.47 -0.02 0.92 0.92PCR_L 0.07 0.49 0.49 -0.24 0.03 0.21IC_L 0.18 0.07 0.43 -0.07 0.55 0.75
SLF_L 0.15 0.13 0.43 -0.07 0.53 0.75Genu of
CC0.11 0.27 0.43 -0.05 0.64 0.75
Body of CC
0.10 0.31 0.42 -0.15 0.21 0.74
REYSIa
ACR_L 0.04 0.55 0.92 -0.04 0.61 0.96SCR_L -0.01 0.91 0.92 0.03 0.74 0.96PCR_L 0.03 0.66 0.92 -0.09 0.28 0.77IC_L -0.08 0.23 0.81 -0.10 0.23 0.77
SLF_L -0.01 0.92 0.92 -0.02 0.82 1.00Genu of
CC0.11 0.09 0.63 0.02 0.82 0.96
Body of CC
0.02 0.77 0.92 0.08 0.33 0.77
Abbreviation: ACR anterior corona radiata, CC corpus callosum; PCR posterior corona radiata, SCR superior corona radiata; SLF superior longitudinal fasciculus
a kendall correlation analyses were used due to the fact that the scale for REYSI ranged from 0 -6
Table S11. Correlation between extracted FA from dimensional ROIs and cognitive assessments in healthy control (HC) and children with ADHD
Indicator ROIs r in HC p in HC pfdr in HC r in ADHD p in ADHD pfdr in ADHDWinf Genu of
CC0.02 0.84 0.84 -0.09 0.46 0.54
Body of -0.09 0.39 0.68 -0.02 0.85 0.85
15

CCACR_R -0.04 0.68 0.84 -0.12 0.30 0.53SCR_R -0.14 0.17 0.68 -0.13 0.28 0.53PCR_R -0.11 0.26 0.68 -0.17 0.15 0.53IC_R -0.09 0.37 0.68 -0.10 0.39 0.54
SLF_R 0.02 0.81 0.84 -0.24 0.04 0.28
IB_P1
Genu of CC
-0.18 0.11 0.15 0.19 0.19 0.25
Body of CC
-0.17 0.11 0.15 0.25 0.08 0.19
ACR_R 0.02 0.84 0.84 0.18 0.21 0.25SCR_R -0.25 0.02 0.11 0.12 0.40 0.40PCR_R -0.24 0.03 0.11 0.34 0.01 0.07IC_R -0.19 0.08 0.15 0.28 0.047 0.18
SLF_R -0.07 0.53 0.62 0.19 0.18 0.25
WM_P1
Genu of CC
-0.05 0.63 0.74 0.17 0.25 0.77
Body of CC
0.06 0.60 0.74 0.27 0.05 0.35
ACR_R -0.03 0.82 0.82 0.08 0.59 0.82SCR_R -0.10 0.36 0.74 0.14 0.33 0.77PCR_R 0.07 0.53 0.74 0.03 0.82 0.82IC_R 0.07 0.50 0.74 0.06 0.69 0.82
SLF_R 0.11 0.31 0.74 0.04 0.79 0.82
DS
Genu of CC
-0.03 0.74 0.98 -0.09 0.44 0.94
Body of CC
-0.002 0.98 0.98 -0.02 0.85 0.94
ACR_R -0.04 0.73 0.98 -0.23 0.05 0.35SCR_R -0.02 0.86 0.98 -0.12 0.29 0.94PCR_R 0.13 0.18 0.61 -0.01 0.94 0.94IC_R 0.11 0.26 0.61 -0.04 0.70 0.94
SLF_R 0.12 0.24 0.61 -0.04 0.71 0.94
REYSIa
Genu of CC
-0.11 0.10 0.28 0.02 0.84 0.84
Body of CC
-0.11 0.12 0.28 0.05 0.56 0.65
ACR_R 0.08 0.24 0.33 -0.08 0.31 0.53SCR_R -0.04 0.54 0.54 -0.12 0.14 0.53PCR_R -0.07 0.28 0.33 -0.07 0.38 0.53IC_R -0.08 0.21 0.33 -0.11 0.16 0.53
SLF_R 0.12 0.07 0.28 -0.07 0.35 0.53Abbreviation: ACR anterior corona radiata, CC corpus callosum; PCR posterior corona radiata, SCR superior corona radiata; SLF superior longitudinal fasciculus;
16
a kendall correlation analyses were used due to the fact that the scale for REYSI ranged from 0 -6
Reference
Daniel E. Ho KI, Gary King, Elizabeth A. Stuart (2011). MatchIt: Nonparametric Preprocessing for Parametric Causal Inference. Journal of Statistical Software 42(8): 1-28.
Smith SM, Jenkinson M, Johansen-Berg H, Rueckert D, Nichols TE, Mackay CE, et al (2006). Tract-based spatial statistics: voxelwise analysis of multi-subject diffusion data. NeuroImage 31(4): 1487-1505.
Zwiers MP (2010). Patching cardiac and head motion artefacts in diffusion-weighted images. NeuroImage 53(2): 565-575.
17