kccconsultations.inconsult.uk€¦ · Web viewThe Strategy will cover the period of 2017 to 2035...
69
Kent Waste Disposal Strategy 2017-2035 Evidence Base Have your say On our Ambition and Priorities for managing the disposal and recycling of Kent’s household waste
Transcript of kccconsultations.inconsult.uk€¦ · Web viewThe Strategy will cover the period of 2017 to 2035...

Kent Waste Disposal Strategy 2017-2035Evidence Base
Have your sayOn our Ambition and Priorities for managing the disposal and
recycling of Kent’s household waste
1 It is advised this Evidence Base document is read prior to the Strategy
This document can be made available in other formats or languages.
To request this, please email [email protected] or telephone 03000 421553 (text relay service 18001 03000 421553). This number goes to an answer machine, which is monitored during office hours.
2 | P a g e

ContentsIntroduction 5
Background 6 How household waste in Kent is managed 6 Closed landfill sites 7 Kent Resource Partnership and the Kent 8 Joint Municipal Waste Management Strategy
Key interdependent corporate 9 policies and strategies Kent Joint Municipal Waste Management 9 Strategy (KJMWMS) Kent Growth and Infrastructure Framework 10 Kent Minerals and Waste Local Plan 10 KCC Strategic Statement 11 KCC Commissioning Framework 11 KCC Customer Service Policy 12 Kent Environment Strategy 13
Household Waste Recycling Centres 14 and Waste Transfer Stations Background 14 Trade Waste 15 What do KCC HWRCs accept? 15 What happens to the waste? 16 Recent site improvements and development 18 HWRC policies 19 Material acceptance and charging 21 TEEP (Technically Environmentally and 22 Economically Practicable) Vehicle restrictions at HWRCs 22 Cross border use of HWRCs 23 Health and Safety 24
Waste Disposal Contracts 25
Current Performance 26
Key Legislative Drivers 28 Waste hierarchy 29 Waste Framework Directive 29 Waste (England and Wales) Regulations 30 European Directive on the Landfill of Waste 30
3 | P a g e
Material Recovery Facility (MRF) Code of Practice 31 Future legislation 31 Future targets 33
Material Markets 33 Material quality 34 Oil price 34 Shipping prices 34 Changing and uncertain export markets 35 Changing waste composition 35
Future waste projections and 35 capacity requirements Population and housing 35 Waste tonnage projections 37 HWRC network pressures 37 Future waste infrastructure requirements 39
Customer feedback 40 Customer satisfaction surveys (face-to-face) 40 Customer satisfaction surveys (online) 41 Mystery shopping 41 Complaints, comments and compliments 42
Customer education and awareness 42
Reuse 43
Flytipping and litter 43 Flytipping 43 Littering 44
Strategic Environmental Assessment 44
Appendix A: Glossary of Terms 45
Appendix B: HWRC Materials 47 Handled (tonnes)
Appendix C: Disposal Authority 48 Benchmarks 2014/15
Appendix D: Population projections 49 by district to 2031
4 | P a g e

Appendix E: HWRC land leasing 49 and ownership arrangements
IntroductionThe aim of this evidence base report is to describe the current position of Kent County Council
(KCC) Waste Management as well as the challenges and opportunities we face now and into the
future. It provides further information to support the Waste Disposal Strategy document which
sets out our approach for service delivery for the next 18 years up to 2035.
A glossary of terms used in this document can be found in Appendix A.
With sustained budget savings required across the public sector, coupled with a projected
increase in waste, fluctuations in market value for recyclate, and limited local processors, it is
important that we deliver even better services to the Kent taxpayer. A waste disposal strategy for
KCC Waste Management is needed to protect service delivery and will be achieved through;
Identifying further saving efficiencies.
Building greater flexibility to deal with and react to changes with regards to quantity,
composition and quality of waste streams and in line with economic and housing growth.
Identifying risks to local supply chains and service provision.
Making a significant contribution to the broader Outcomes Framework of the Council
(Strategic Statement).
Ensuring KCC meets its environmental compliance and public protection functions.
Helping future proof service delivery for customers including Waste Collection Authorities
(WCAs - district/ borough councils), providing equitable access to customer service for Kent
residents and compliance with the Equality Act 2010.
Equipping KCC to succeed in meeting local and national targets.
Maximising synergies between internal and external partners.
The scope of the project centres on the role and responsibilities of KCC Waste Management as
the Waste Disposal Authority (WDA) and the partnership obligations of a two-tier system.
5 | P a g e

It should be noted that the statutory and discretionary services provided by a Waste Collection
Authority are not within scope of this strategy, notwithstanding the major synergies between the
services provided. This two-tier relationship is explained in more detail below.
The Strategy will cover the period of 2017 to 2035 based on current targets, budget constraints
and some contractual commitments, however it should be noted that the strategy will be reviewed
and updated every 5 years as a minimum in what is an ever changing waste industry.
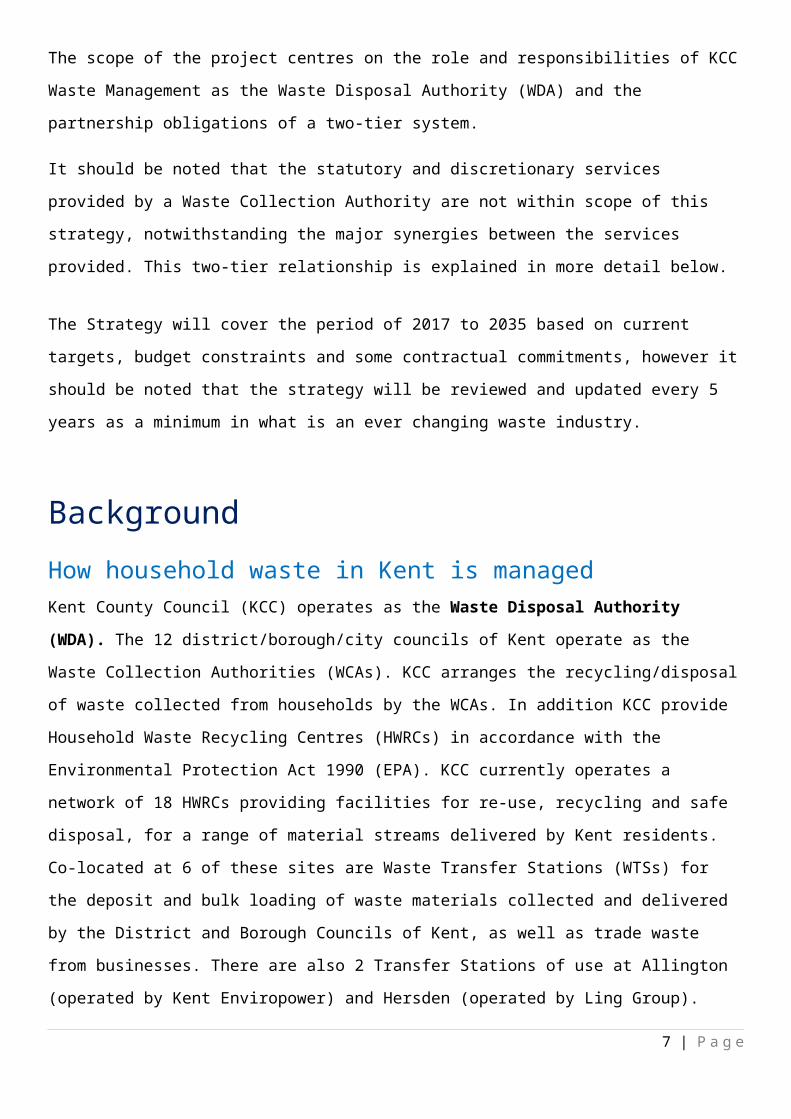
Background How household waste in Kent is managedKent County Council (KCC) operates as the Waste Disposal Authority (WDA). The 12
district/borough/city councils of Kent operate as the Waste Collection Authorities (WCAs). KCC
arranges the recycling/disposal of waste collected from households by the WCAs. In addition KCC
provide Household Waste Recycling Centres (HWRCs) in accordance with the Environmental
Protection Act 1990 (EPA). KCC currently operates a network of 18 HWRCs providing facilities for
re-use, recycling and safe disposal, for a range of material streams delivered by Kent residents.
Co-located at 6 of these sites are Waste Transfer Stations (WTSs) for the deposit and bulk loading
of waste materials collected and delivered by the District and Borough Councils of Kent, as well as
trade waste from businesses. There are also 2 Transfer Stations of use at Allington (operated by
Kent Enviropower) and Hersden (operated by Ling Group).
Map 1: KCC HWRCs and WTSs1
1 This map also shows the 3 HWRCs run by Medway Council. Medway Council is a Unitary Authority and therefore deals with its own waste collection and disposal of household waste.
6 | P a g e
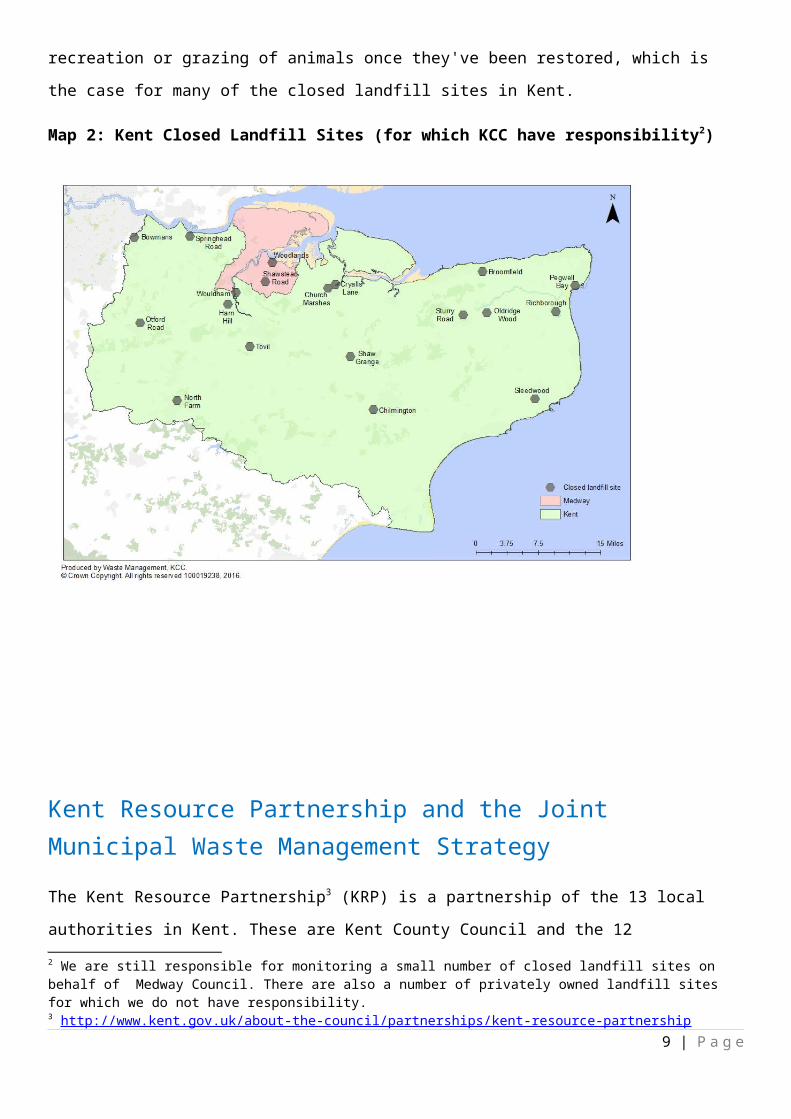
Closed landfill sitesKCC also manages and maintains 19 closed landfill sites to ensure they comply with
environmental standards.
Most of the sites have been closed and restored for 30 years (i.e. they are no longer used for
landfill) but we still need to ensure that any gasses and contaminated water caused by the rotting
down of organic wastes are collected and treated where necessary. This might be by burning off
potentially harmful gas or by treating contaminated water from the site. Landfill sites offer the
potential for informal recreation or grazing of animals once they've been restored, which is the
case for many of the closed landfill sites in Kent.
Map 2: Kent Closed Landfill Sites (for which KCC have responsibility2)
2 We are still responsible for monitoring a small number of closed landfill sites on behalf of Medway Council. There are also a number of privately owned landfill sites for which we do not have responsibility.
7 | P a g e

Kent Resource Partnership and the Joint Municipal Waste Management Strategy
The Kent Resource Partnership3 (KRP) is a partnership of the 13 local authorities in Kent. These
are Kent County Council and the 12 District/Borough/City councils of: Ashford, Canterbury,
Dartford, Dover, Gravesham, Maidstone, Sevenoaks, Shepway, Swale, Thanet, Tonbridge &
Malling and Tunbridge Wells.
The key activities of the KRP are to:
• Ensure delivery of the Kent Joint Municipal Waste Management Strategy (see ‘Key
interdependent strategies and policies’ p.9 for more detail).
• Provide a platform for cooperative and joint working to improve services.
• Act as a single voice for strategic waste issues for Kent local authorities.
3 http://www.kent.gov.uk/about-the-council/partnerships/kent-resource-partnership8 | P a g e
• Increase awareness of waste as a resource, promote waste minimisation and achieve an
economically, environmentally and socially sustainable waste strategy.
• Work with stakeholders who are developing, supporting and influencing the future direction of
sustainable waste/resource management.
The Kent Joint Municipal Waste Management Strategy (KJMWMS) has been developed by the 13
councils in the Kent Resource Partnership. The purpose of the Strategy, which was launched in
April 2007 and due to be updated in 2017, is to set out how the KRP intends to manage household
waste arisings over the period 2007-2027.i
Furthermore, there are currently two joint waste contracts in place across Kent which are designed
to maximise efficiency as well as boost recycling services and recycling quality, providing the best
value services for Kent residents. By working in partnership there are better opportunities for
service optimisation, combined resources and service innovation. Making it easier for Kent
residents to recycle will lead to inevitable improvements on both recycling quality and recycling
targets.
The first joint waste contract, the East Kent Joint Waste Partnership, was established in 2011
between Shepway, Dover, Canterbury, Thanet and KCC. The Partnership was set up under two
phases – the first saw Veolia winning the contract to provide joint collection, processing of
recycling and street cleansing services for Dover and Shepway. This was followed in 2013 when
Veolia took on processing of recycling including food and garden waste for Thanet and
Canterbury. Two years later, in 2013, a second Joint Waste Partnership was established in
mid-Kent between Ashford, Maidstone, Swale and KCC called the Mid-Kent Joint Waste
Partnership. Biffa was awarded the contract providing joint collection, processing of recycling and
street cleansing services across the partnership. The most significant change under this contract
was that Ashford Borough Council’s recycling rate almost tripled to over 50% within the first three
months of implementation. Discussions are underway regarding opportunities for joint partnerships
in West Kent. It should be noted that for optimum disposal costs, a single collection methodology
by all WCAs in Kent (and indeed nationally) would be favourable, however this is unlikely to
happen due to political and contractual variances.
Key interdependent corporate policies and strategies
9 | P a g e
There are a number of corporate policies and strategies which will have clear interdependencies
with the WDA strategy and it is vital to ensure this Waste Disposal Strategy dovetails with these
and is not at odds. These main policies and strategies are detailed below.
Kent Joint Municipal Waste Management Strategy (KJMWMS)The Kent Joint Municipal Waste Management Strategy outlines the approach for dealing with
Kent’s municipal solid waste to 2027. This strategy is owned by the Kent Resource Partnership4.
KCC fully recognises that any WDA Strategy in a two-tier system must take full account of the
ambitions and aims of district/borough councils. There is a need to ensure a 100% dovetailing with
the current, and future, Joint Municipal Waste Management Strategy agreed by all 13 councils.
A number of policies are set out in the strategy, such as promoting the use of waste as a resource,
ensuring we are delivering high quality services and seeking opportunities to change behaviours
and attitudes to waste.
A commitment was made by the KRP to achieve a minimum level of 40% recycling and
composting of household waste in Kent by 2012/13, with individual authorities reaching recycling
levels above or below this figure according to their local circumstances; and Kent County Council
increasing recycling at Household Waste Recycling Centres to 60% by 2012/13.
The KRP have since exceeded this target and as of October 2015, KCC had a Recycling rate of
70.8% across its HWRC network. Whilst many district and borough councils have improved their
recycling rate over the past few years, there are a number who are still working to reach the 40%
overall target agreed by the KRP.
KCC are committed to continue to work closely with the KRP to reach the joint outcomes of the
KJMWMS.
Kent Growth and Infrastructure FrameworkThe Growth and Infrastructure Framework (GIF), developed in close collaboration with Medway
and the 12 Kent district and borough councils, provides a framework not only for identifying and
prioritising investment in infrastructure across Kent, but also for testing the impact of innovation in
the way in which we provide public services.
The GIF brings together a clear picture over the Local Plan period to 2031 on:
Housing and economic growth planned to 2031 across Kent and Medway;4 The Kent Resource Partnership was developed from the rebranded Kent Waste Partnership in 2013.
10 | P a g e

the fundamental infrastructure needed to support this growth;
the cost of this infrastructure;
the potential funding sources across the public and private sector funding during this period:
and,
the likely public sector funding gap and work towards solutions.
The GIF draws on information and data from a range of sources to give a strategic picture of
Kent’s provisions for growth and infrastructure now and for the next 20 years.
This framework is an integral document when considering the development and delivery of the
Waste Disposal Strategy. With an increase in population, is an expected increase in waste. We
will look to the GIF to inform the future provision of waste to understand where waste tonnages
may change so that services can be provided where they are most needed.
Kent Minerals and Waste Local Plan (2013-2030)The Kent Minerals and Waste Local Plan produced by KCC as the Waste Planning Authority sets
out the vision and strategy for mineral provision and waste management in Kent, it contains a
number of development management policies for evaluating minerals and waste planning
applications and considers strategic site provision for all minerals and waste management facilities
plan to the year 2030.
The plan puts forward a number of policies as a high-level delivery strategy for waste
management in Kent up to 2031 for all waste streams and not just household waste. These
policies will inform the development of the Waste Disposal Strategy and subsequent action and
implementation plans. This is explored further in the ‘Future Waste Infrastructure Requirements’
Section p.39.
KCC Strategic Statement (2015-2020)‘Increasing opportunities, Improving Outcomes’ is the strategic statement for KCC. Its vision-
‘improving lives and ensuring every pound spent in Kent is delivering better outcomes for Kent’s
residents, communities and businesses.’
Over the past four years, KCC has made £350m in savings but with finances remaining under
pressure, people continue to have greater expectations about how to access services and how
services can be delivered.
KCC wants to be an outcome-focussed organisation. The strategic statement outlines these high-
level outcomes and how they link to the vision. The strategic outcomes are;
11 | P a g e
Children and young people in Kent get the best start in life.
Kent communities feel the benefits of economic growth by being in-work, healthy and
enjoying a good quality of life.
Older and vulnerable residents are safe and supported with choices to live independently.
The key Supporting Outcome from the statement relating to the provision of the Waste
Management service in KCC is “Kent’s physical and natural environment is protected, enhanced
and enjoyed by residents and visitors”.
This statement also includes maximising social value (or community benefits) through the
procurement and commissioning of our services by promoting the importance of apprenticeships.
The Waste Disposal Strategy will also explore opportunities to work with local communities and
the voluntary sector to deliver services.
The outcomes will be considered through the development and delivery of the Waste Disposal
Strategy.
KCC Commissioning FrameworkThe Council intends to become a strategic commissioning authority. This does not mean that KCC
will be outsourcing all of its services but will consider more carefully the best way to deliver its
services. It will develop the culture of the organisation to embed a number of core principles which
form a Commissioning Framework;
Principle 1: Focussed on outcomes for our residents.
Principle 2: A consistent commissioning approach to planning, designing and evaluating
services.
Principle 3: The right people involved at the right stage of commissioning.
Principle 4: Open-minded about how best to achieve outcomes.
Principle 5: High-quality, robust evidence informing our decisions.
Principle 6: Hold all services to account for the delivery of KCC’s strategic outcomes.
Principle 7: Customers at the heart of our commissioning approach.
Principle 8: A commitment to building capacity.
Principle 9: We will maximise social value.
Principle 10: Our supply chains will be sustainable and effective.
12 | P a g e
Commissioning forms an important part of the KCC Waste Management service and we seek to
embed these principles in our day-to-day procurement activities. We work closely with the KCC
procurement team to determine the best approach for commissioning each individual service.
We will further develop our future commissioning approach and plans around these principles,
within the Waste Disposal Strategy.
KCC Customer Service Policy (2015-2018)The Customer Service Policy sets out KCC’s commitment to its customers as we move further
towards becoming a commissioning authority.
The Policy is underpinned by three core principles; Delivering Quality, Customer Focused
Services, and Intelligent Commissioning. These three principles will help us deliver services that
support Kent’s residents, businesses and communities. They will help us to provide a consistent
service to customers ensuring we are delivering the right services, to the right people, in the right
way.
Waste Management currently places the customer at the heart of its services, and uses a number
of tools to collect feedback and measure satisfaction levels. We ensure that this commitment to
our customers is reflected in our contracts and expect this same standard from our service
providers.
Moving forwards as part of the Waste Disposal Strategy, KCC Waste Management will continue to
embed these principles when developing services and policies, consulting its customers and
stakeholders and collecting feedback to ensure the services it delivers are fit for purpose. We will
consider how people access our services, and seek opportunities for digital delivery where
possible.
Kent Environment Strategy (2011)The Kent Environment Strategy (KES) forms part of the ‘Vision for Kent’ and identifies the
challenges that Kent continues to face and developing pressures to improve the county’s natural
environment. This includes improving water and air quality, to minimise the negative impacts to
biodiversity and climate change.
The Kent Environment Strategy focuses on 3 themes;
• Living well within our environmental limits.
• Rising to the climate change challenge.
13 | P a g e

• Valuing our natural, historic and living environment.
Each of these themes presents a series of priorities and actions to be undertaken to achieve these
and the first of these identifies a specific priority for waste which should be considered;
EF Priority 3- Turn our waste into new resources and jobs for Kent
• EF 3.1 Assess ‘waste resource’ potential and harness economic opportunities.
• EF3.2 Reduce key wastes going to landfill.
• EF3.3 Conversation with waste resource businesses in or moving to Kent .
This priority recognises that waste has the potential to be valuable resource and this will help us to
create jobs and a low carbon economy.
It also stresses that businesses and communities must take responsibility for minimising the
amount of waste they produce and makes a commitment to use sustainable construction
techniques and materials, minimise waste and maximise reuse and recycling.
This priority falls in line with the thinking behind a number of elements of the Waste Disposal
Strategy. The KES has developed an implementation plan and some of the activities undertaken
to meet the outcomes of the waste strategy will link into those of the KES.
Household Waste Recycling Centres and Waste Transfer StationsBackground KCC operates 18 HWRCs within Kent for Kent residents to dispose of their household waste. In
addition, 6 of these sites also operate WTSs for the deposit and bulk loading of waste materials
collected and delivered by the District and Borough Councils of Kent, as well as trade waste from
businesses.
Kent’s 18 HWRCs are currently managed by 4 private waste management companies. These
organisations manage the day-to-day operation of the HWRCs on behalf of KCC.
14 | P a g e
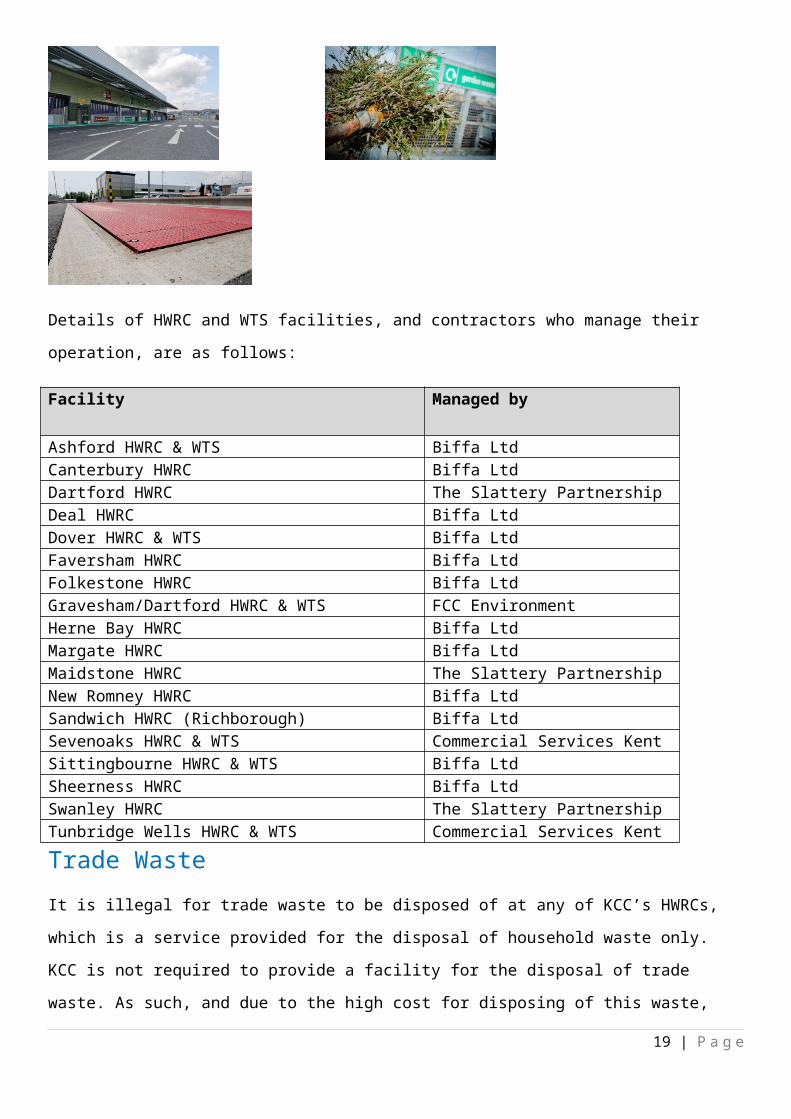
Details of HWRC and WTS facilities, and contractors who manage their operation, are as follows:
Facility Managed by
Ashford HWRC & WTS Biffa LtdCanterbury HWRC Biffa LtdDartford HWRC The Slattery PartnershipDeal HWRC Biffa LtdDover HWRC & WTS Biffa LtdFaversham HWRC Biffa LtdFolkestone HWRC Biffa LtdGravesham/Dartford HWRC & WTS (Pepperhill) FCC EnvironmentHerne Bay HWRC Biffa LtdMargate HWRC Biffa LtdMaidstone HWRC The Slattery PartnershipNew Romney HWRC Biffa LtdSandwich HWRC (Richborough) Biffa LtdSevenoaks HWRC & WTS Commercial Services Kent LtdSittingbourne HWRC & WTS Biffa LtdSheerness HWRC Biffa LtdSwanley HWRC The Slattery PartnershipTunbridge Wells HWRC & WTS Commercial Services Kent Ltd
Trade WasteIt is illegal for trade waste to be disposed of at any of KCC’s HWRCs, which is a service provided
for the disposal of household waste only. KCC is not required to provide a facility for the disposal
of trade waste. As such, and due to the high cost for disposing of this waste, KCC has a number of
policies in place to prevent trade waste from coming through its HWRCs, (see ‘HWRC Policies’
p.19 for details) coupled with a reliance upon monitoring and enforcement.
Currently, anyone suspected of disposing of trade waste at an HWRC is asked to complete a
‘Non-Trade Waste Declaration Form’, and KCC Waste Management will investigate anyone who is
identified as a persistent offender. CCTV and Automatic Number Plate Recognition (ANPR) is in
place across sites, which can be used to assist in these investigations where necessary.
15 | P a g e

However, despite businesses and organisations having a ‘duty of care’ to ensure their waste is
disposed of correctly, in order to mitigate against environmental crime such as flytipping, KCC
Waste Management have facilities in place to ensure businesses can dispose of their waste
responsibly.
A trade waste service is offered at a number of KCC’s WTSs; Dover, Pepperhill, Sevenoaks,
Sittingbourne and Tunbridge Wells. Both residents and businesses are able to use this service,
which is offered by the WTS operators, who make a charge for disposal of this waste.
A number of HWRCs within Kent have permits that allow for the acceptance of trade waste should
KCC Waste Management choose to provide this service in the future. In 2006, a trade waste
service was trialed at Canterbury HWRC with little success, however there is no data to support
why the opportunity wasn’t taken up by traders or understand how well marketed this was.
KCC Waste Management also put together a business waste guide, which is available via the
KCC website. This is provided for those wishing to dispose of trade waste, hazardous waste or
large amounts of waste that are not accepted at HWRCs.
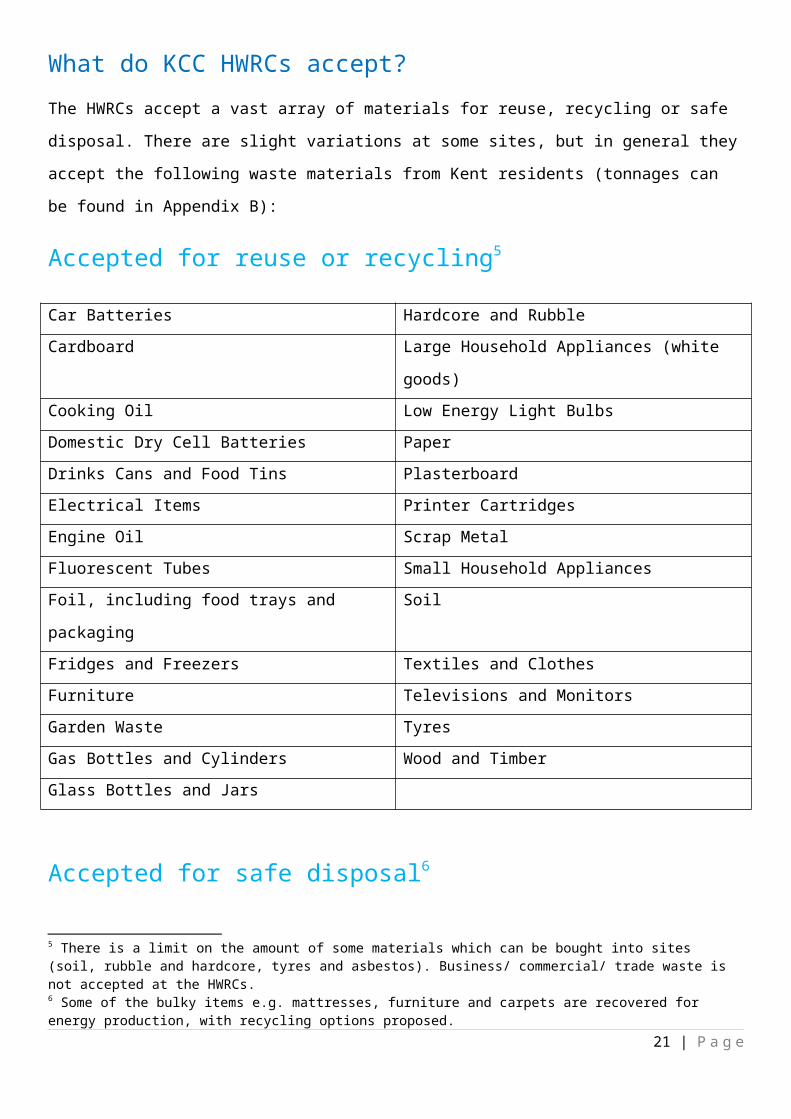
What do KCC HWRCs accept?The HWRCs accept a vast array of materials for reuse, recycling or safe disposal. There are slight
variations at some sites, but in general they accept the following waste materials from Kent
residents (tonnages can be found in Appendix B):
Accepted for reuse or recycling5
Car Batteries Hardcore and Rubble
Cardboard Large Household Appliances (white goods)
Cooking Oil Low Energy Light Bulbs
Domestic Dry Cell Batteries Paper
Drinks Cans and Food Tins Plasterboard
Electrical Items Printer Cartridges
Engine Oil Scrap Metal
Fluorescent Tubes Small Household Appliances
Foil, including food trays and packaging Soil
Fridges and Freezers Textiles and Clothes
5 There is a limit on the amount of some materials which can be bought into sites (soil, rubble and hardcore, tyres and asbestos). Business/ commercial/ trade waste is not accepted at the HWRCs.
16 | P a g e

Furniture Televisions and Monitors
Garden Waste Tyres
Gas Bottles and Cylinders Wood and Timber
Glass Bottles and Jars
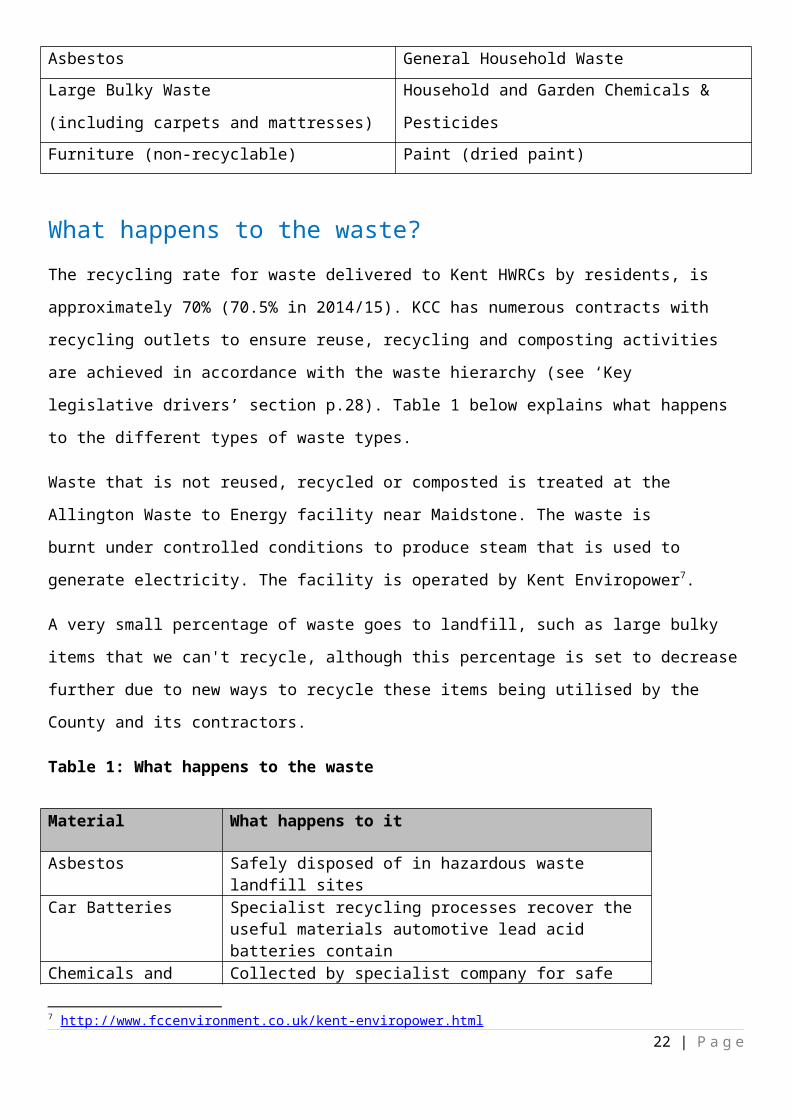
Accepted for safe disposal6
Asbestos General Household Waste
Large Bulky Waste
(including carpets and mattresses)
Household and Garden Chemicals & Pesticides
Furniture (non-recyclable) Paint (dried paint)
What happens to the waste?The recycling rate for waste delivered to Kent HWRCs by residents, is approximately 70% (70.5%
in 2014/15). KCC has numerous contracts with recycling outlets to ensure reuse, recycling and
composting activities are achieved in accordance with the waste hierarchy (see ‘Key legislative
drivers’ section p.28). Table 1 below explains what happens to the different types of waste types.
Waste that is not reused, recycled or composted is treated at the Allington Waste to Energy facility
near Maidstone. The waste is burnt under controlled conditions to produce steam that is used to
generate electricity. The facility is operated by Kent Enviropower7.
A very small percentage of waste goes to landfill, such as large bulky items that we can't recycle,
although this percentage is set to decrease further due to new ways to recycle these items being
utilised by the County and its contractors.
Table 1: What happens to the waste
Material What happens to it
Asbestos Safely disposed of in hazardous waste landfill sitesCar Batteries Specialist recycling processes recover the useful materials
automotive lead acid batteries containChemicals and Pesticides
Collected by specialist company for safe disposal
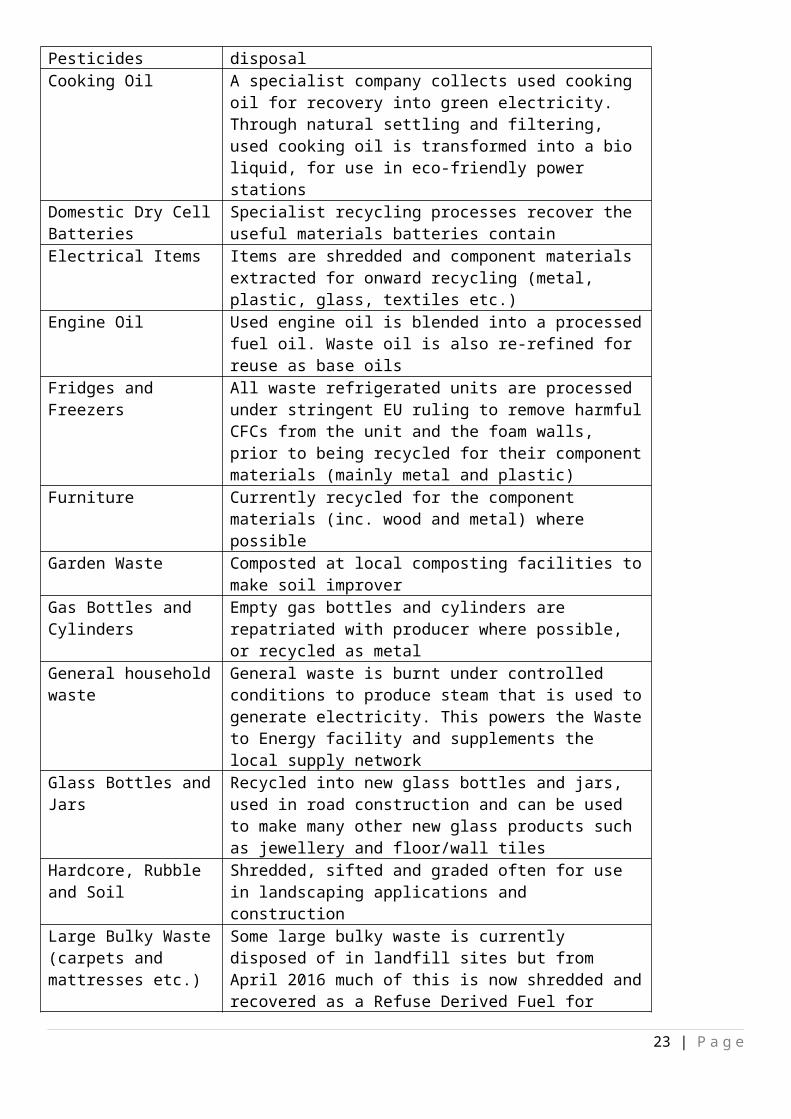
Cooking Oil A specialist company collects used cooking oil for recovery into green electricity. Through natural settling
6 Some of the bulky items e.g. mattresses, furniture and carpets are recovered for energy production, with recycling options proposed.7 http://www.fccenvironment.co.uk/kent-enviropower.html
17 | P a g e
and filtering, used cooking oil is transformed into a bio liquid, for use in eco-friendly power stations
Domestic Dry Cell Batteries
Specialist recycling processes recover the useful materials batteries contain
Electrical Items Items are shredded and component materials extracted for onward recycling (metal, plastic, glass, textiles etc.)
Engine Oil Used engine oil is blended into a processed fuel oil. Waste oil is also re-refined for reuse as base oils
Fridges and Freezers All waste refrigerated units are processed under stringent EU ruling to remove harmful CFCs from the unit and the foam walls, prior to being recycled for their component materials (mainly metal and plastic)
Furniture Currently recycled for the component materials (inc. wood and metal) where possible
Garden Waste Composted at local composting facilities to make soil improver
Gas Bottles and Cylinders
Empty gas bottles and cylinders are repatriated with producer where possible, or recycled as metal
General household waste
General waste is burnt under controlled conditions to produce steam that is used to generate electricity. This powers the Waste to Energy facility and supplements the local supply network
Glass Bottles and Jars Recycled into new glass bottles and jars, used in road construction and can be used to make many other new glass products such as jewellery and floor/wall tiles
Hardcore, Rubble and Soil
Shredded, sifted and graded often for use in landscaping applications and construction
Large Bulky Waste (carpets and mattresses etc.)
Some large bulky waste is currently disposed of in landfill sites but from April 2016 much of this is now shredded and recovered as a Refuse Derived Fuel for power stations
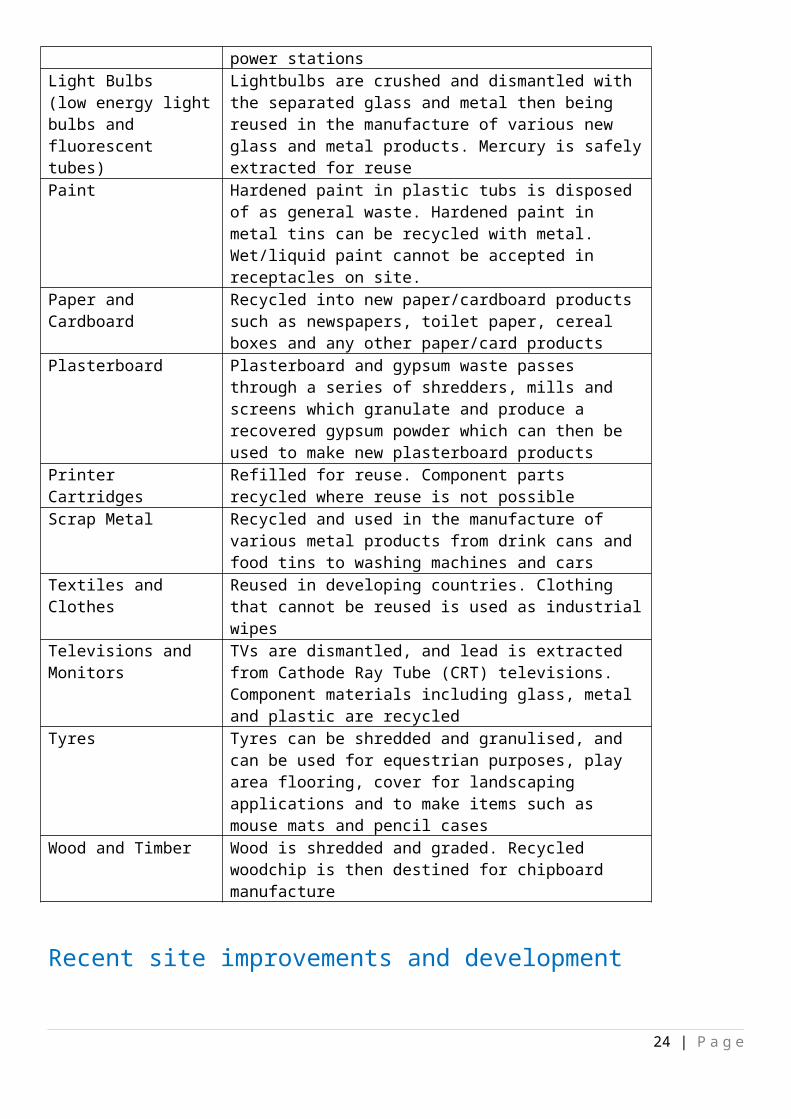
Light Bulbs(low energy light bulbs and fluorescent tubes)
Lightbulbs are crushed and dismantled with the separated glass and metal then being reused in the manufacture of various new glass and metal products. Mercury is safely extracted for reuse
Paint Hardened paint in plastic tubs is disposed of as general waste. Hardened paint in metal tins can be recycled with metal. Wet/liquid paint cannot be accepted in receptacles on site.
Paper and Cardboard Recycled into new paper/cardboard products such as newspapers, toilet paper, cereal boxes and any other paper/card products
Plasterboard Plasterboard and gypsum waste passes through a series of shredders, mills and screens which granulate and produce a recovered gypsum powder which can then be used to make new plasterboard products
Printer Cartridges Refilled for reuse. Component parts recycled where reuse is not possible
Scrap Metal Recycled and used in the manufacture of various metal products from drink cans and food tins to washing machines and cars
Textiles and Clothes Reused in developing countries. Clothing that cannot be reused is used as industrial wipes
18 | P a g e
Televisions and Monitors
TVs are dismantled, and lead is extracted from Cathode Ray Tube (CRT) televisions. Component materials including glass, metal and plastic are recycled
Tyres Tyres can be shredded and granulised, and can be used for equestrian purposes, play area flooring, cover for landscaping applications and to make items such as mouse mats and pencil cases
Wood and Timber Wood is shredded and graded. Recycled woodchip is then destined for chipboard manufacture
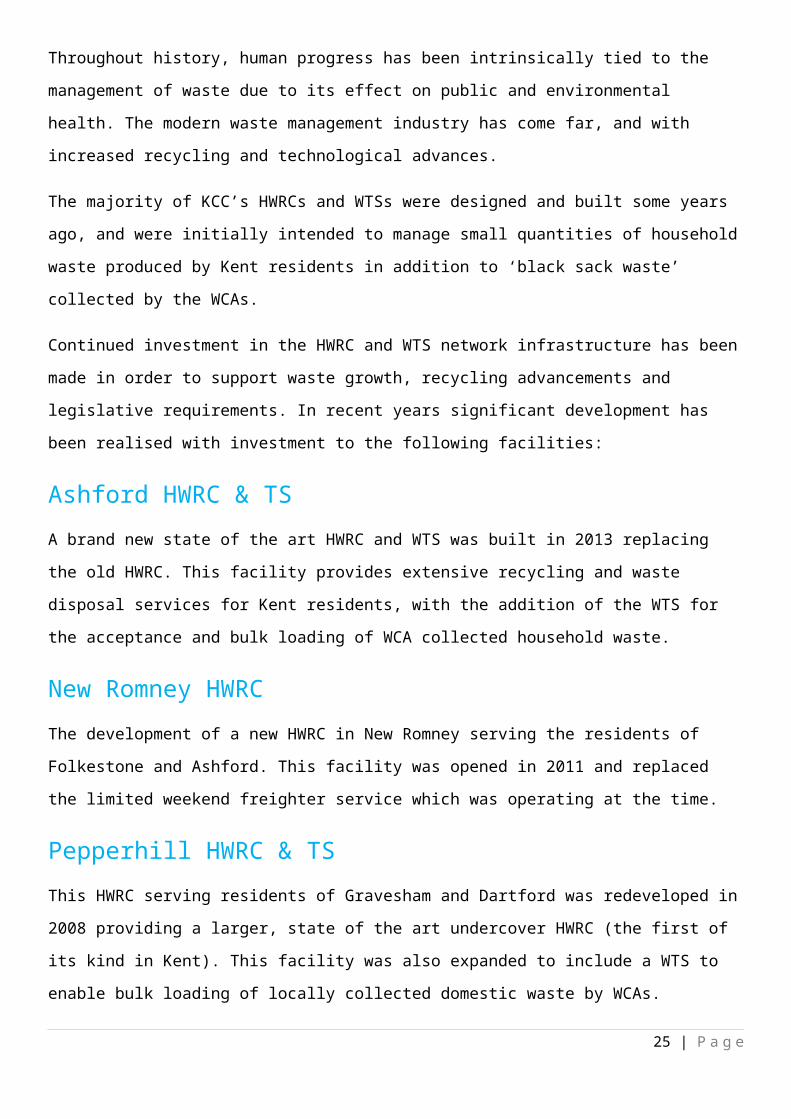
Recent site improvements and developmentThroughout history, human progress has been intrinsically tied to the management of waste due to
its effect on public and environmental health. The modern waste management industry has come
far, and with increased recycling and technological advances.
The majority of KCC’s HWRCs and WTSs were designed and built some years ago, and were
initially intended to manage small quantities of household waste produced by Kent residents in
addition to ‘black sack waste’ collected by the WCAs.
Continued investment in the HWRC and WTS network infrastructure has been made in order to
support waste growth, recycling advancements and legislative requirements. In recent years
significant development has been realised with investment to the following facilities:
Ashford HWRC & TS
A brand new state of the art HWRC and WTS was built in 2013 replacing the old HWRC. This
facility provides extensive recycling and waste disposal services for Kent residents, with the
addition of the WTS for the acceptance and bulk loading of WCA collected household waste.
New Romney HWRC The development of a new HWRC in New Romney serving the residents of Folkestone and
Ashford. This facility was opened in 2011 and replaced the limited weekend freighter service which
was operating at the time.
Pepperhill HWRC & TS This HWRC serving residents of Gravesham and Dartford was redeveloped in 2008 providing a
larger, state of the art undercover HWRC (the first of its kind in Kent). This facility was also
expanded to include a WTS to enable bulk loading of locally collected domestic waste by WCAs.
19 | P a g e
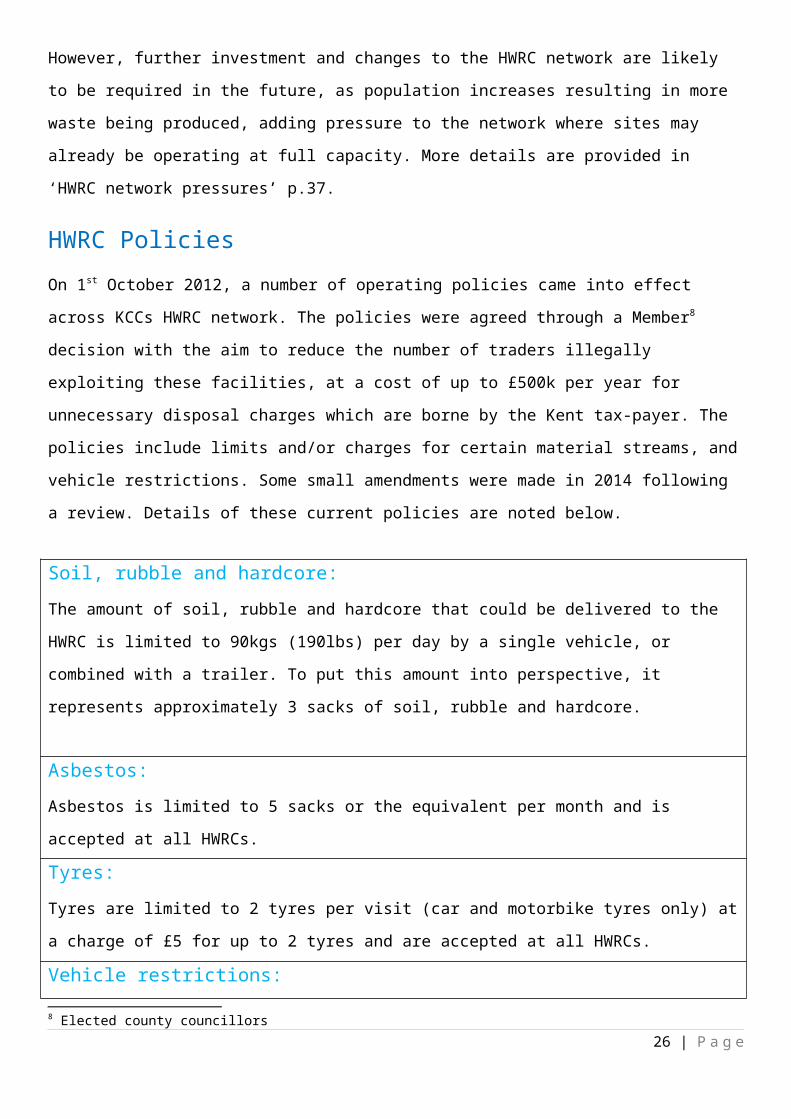
However, further investment and changes to the HWRC network are likely to be required in the
future, as population increases resulting in more waste being produced, adding pressure to the
network where sites may already be operating at full capacity. More details are provided in ‘HWRC
network pressures’ p.37.
HWRC PoliciesOn 1st October 2012, a number of operating policies came into effect across KCCs HWRC
network. The policies were agreed through a Member8 decision with the aim to reduce the number
of traders illegally exploiting these facilities, at a cost of up to £500k per year for unnecessary
disposal charges which are borne by the Kent tax-payer. The policies include limits and/or charges
for certain material streams, and vehicle restrictions. Some small amendments were made in 2014
following a review. Details of these current policies are noted below.
Soil, rubble and hardcore:The amount of soil, rubble and hardcore that could be delivered to the HWRC is limited to 90kgs
(190lbs) per day by a single vehicle, or combined with a trailer. To put this amount into
perspective, it represents approximately 3 sacks of soil, rubble and hardcore.
Asbestos:Asbestos is limited to 5 sacks or the equivalent per month and is accepted at all HWRCs.
Tyres:Tyres are limited to 2 tyres per visit (car and motorbike tyres only) at a charge of £5 for up to 2
tyres and are accepted at all HWRCs.
Vehicle restrictions:Vehicle restrictions are in place to prevent trade waste from entering the HWRCs. Some vehicles
may require vouchers to gain access.
Vehicles allowed without needing vouchers:
Cars and estate cars with windows all the way round and seats throughout.
People carriers, 4x4s and minibuses (excluding open backed vehicles) with windows all the
way round and seats throughout (maximum 9 seats).
Taxis and sign-written cars with windows and seats throughout.
8 Elected county councillors20 | P a g e
Vehicles needing vouchers:
To get vouchers for the vehicle types noted below, it must be the only vehicle in the household,
no more than 2m tall (unless a campervan or minibus) and have a maximum gross vehicle weight
(GVW) of less than 3.5 tonnes.
People carriers, 4x4s, minibuses with panels in place of windows and/or no rear seats.
Pick-up trucks or open back vehicles (including those with a removable top).
Minibuses with 10 seats or more.
Van – car derived (at manufacture stage or modified). Panels in place of windows and/or
no rear seats.
Panel vans.
Campervans or minibuses over 2m high (but less than 3.5 tonnes), with windows and seats
throughout.
Vehicles not allowed:
Vehicles with a maximum gross vehicle weight (GVW) of more than 3.5 tonnes.
Vehicles more than 2m tall (unless a disability adapted vehicle or campervan/ minibus).
Hire vehicles.
Horseboxes and agricultural trailers.
Trailer size:Trailers bodies of the following size are permitted:
Maximum 2.05 metres (6ft 8inches) long.
Not more than 1 cubic metre (35cubic feet) capacity.
No wider than the domestic vehicle towing the trailer.
No agricultural trailers or horse boxes are permitted.
Disability Adapted Vehicles:Kent residents should contact KCC to make arrangements to access HWRCs in disability adapted
vehicles. A height restriction of 2 metres (6ft 6 inches) applies at Sevenoaks, Swanley and
Faversham HWRCs. At all other HWRCs the height barrier can be opened for over-height
disability vehicles following arrangements made with KCC.
Material acceptance and charging
21 | P a g e
A range of materials are accepted across the KCC HWRC network for reuse, recycling or safe
disposal. The HWRCs aim to deliver comprehensive, easy to access services for Kent residents,
to enable responsible and safe management of household waste.
However, the requirement to separate more and more material streams in accordance with
legislation and environmental best practice can prove quite challenging. Many KCC HWRCs are
small and were built many years ago when waste management practices were not as extensive as
they are today.
In the current economic climate many local authorities consider increased budget savings and
income generation opportunities a critical requirement in order to provide continued, sustainable
services.
With this in mind, local authorities seek options to support affordable service delivery including
policies such as those outlined above (‘HWRC Policies’ p.19) with regards to material limits and
charging, and robust site management practices including the prevention of illegal deposits of
waste.
There has been widespread discussion of this issue and Government has issued guidance in
respect of household wastes for which local authorities may levy a charge. It is appreciated that
charges for certain material streams (mainly construction waste such as rubble, soil and
plasterboard, as well as tyres) can be applied to householders wishing to dispose of these wastes
at HWRCs, and many authorities exercise this right.
Legislation does however stipulate that charging local residents a fee to use their local HWRC
facilities is prohibited. The Governments recent consultation “Preventing ‘backdoor’ charging at
HWRCs”9 considered this issue as many authorities regard their position to be ‘charge or close’.
However, the decision to uphold the availability of ‘free to use’ facilities for local residents (as
detailed in the Environmental Protection Act 1990 (EPA)) has been adopted, and local authorities
are now forced to consider alternative solutions to remaining ‘open’. For specific material charge
details adopted by KCC, see ‘HWRC Policies’ p.19.
TEEPSince January 2015, new regulations for public and private waste collectors require the 'separate
collection' of paper, plastic, metals & glass for recycling. The aim is to increase the quality and
quantity of recycled material by reducing contamination.
9https://www.gov.uk/government/uploads/system/uploads/attachment_data/file/ 414404/150304_Government_Response_to_the_consultation_preventing_backdoor_charging_at_HWRCs_Final.pdf
22 | P a g e
In order to collect the specified materials mixed together or within the residual waste stream,
separate collections must be assessed as not being Technically Environmentally and
Economically Practicable (TEEP). TEEP is primarily applicable to Waste Collection Authorities i.e.
how waste is collected from the kerbside, however KCC considered it best practice to undertake
its own TEEP assessment in relation to material collection at HWRC’s, which returned a
satisfactory compliance result.
With more WCAs offering easily accessible comprehensive kerbside collection services for these
materials, KCC may wish to consider its position in relation to the acceptance of these material
streams at HWRCs (as well as considering associated costs and any income) and if their
acceptance at these facilities is still appropriate.
Vehicle restrictions at HWRCs
Height barriers have been in operation across all HWRCs since 1997 when they were first
introduced to reduce the number of traders illegally exploiting these facilities for the free disposal
of waste.
Height barriers are set at 2 metres (6ft 6 inches). The barriers remain firm and fixed and are only
opened by site staff to enable waste collection vehicle access, or access by customers in disability
adapted vehicles who have made prior arrangement with KCC. For specific vehicle restrictions,
see ‘HWRC Policies’ p.19.
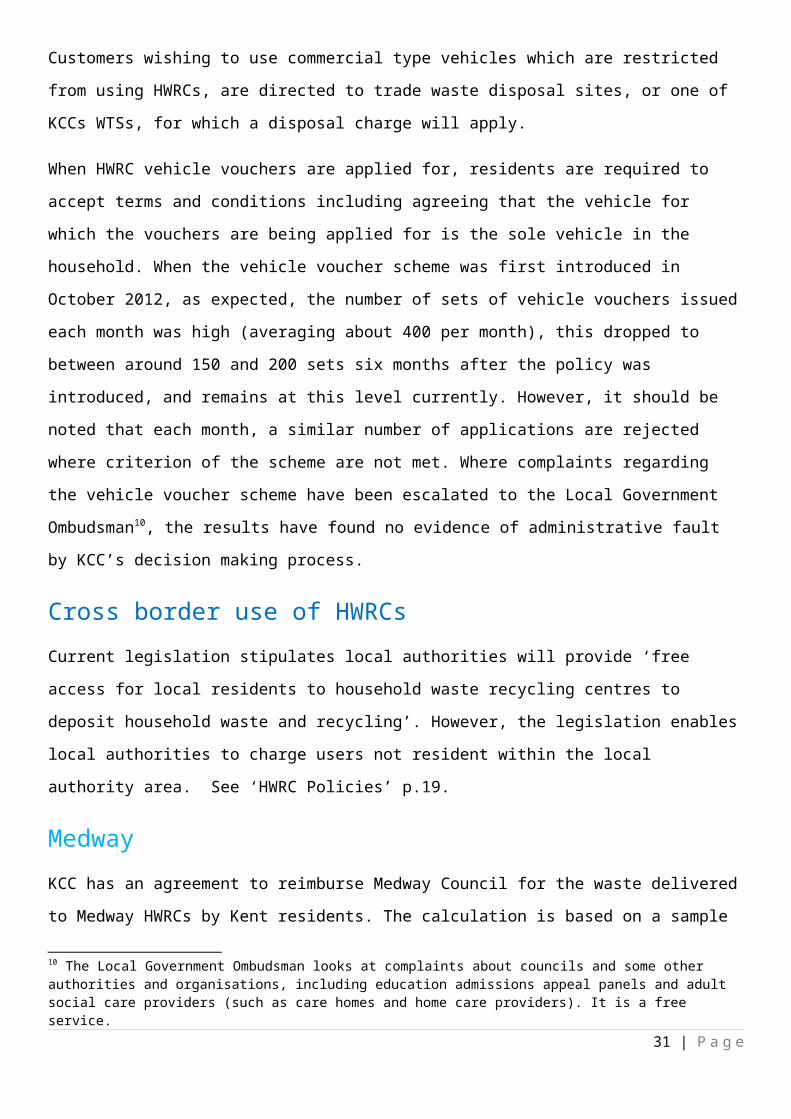
Customers wishing to use commercial type vehicles which are restricted from using HWRCs, are
directed to trade waste disposal sites, or one of KCCs WTSs, for which a disposal charge will
apply.
When HWRC vehicle vouchers are applied for, residents are required to accept terms and
conditions including agreeing that the vehicle for which the vouchers are being applied for is the
sole vehicle in the household. When the vehicle voucher scheme was first introduced in October
2012, as expected, the number of sets of vehicle vouchers issued each month was high
(averaging about 400 per month), this dropped to between around 150 and 200 sets six months
after the policy was introduced, and remains at this level currently. However, it should be noted
that each month, a similar number of applications are rejected where criterion of the scheme are
not met. Where complaints regarding the vehicle voucher scheme have been escalated to the
23 | P a g e
Local Government Ombudsman10, the results have found no evidence of administrative fault by
KCC’s decision making process.
Cross border use of HWRCs Current legislation stipulates local authorities will provide ‘free access for local residents to
household waste recycling centres to deposit household waste and recycling’. However, the
legislation enables local authorities to charge users not resident within the local authority area.
See ‘HWRC Policies’ p.19.
MedwayKCC has an agreement to reimburse Medway Council for the waste delivered to Medway HWRCs
by Kent residents. The calculation is based on a sample of customer postcode data which
Medway Council collect during specific on-site customer surveys. For example, Cuxton HWRC
experiences the highest volume of cross border customers with approximately 31% of site users
being from the KCC administrative area. Using an agreed cost matrix, KCC pay Medway Council
each year for the approximate disposal costs.
Dartford permit scheme
In October 1998 KCC implemented a permit scheme system at the Dartford HWRC. The purpose
of the permit scheme is to limit ‘free use’ of the site to Kent residents only. Dartford is bordered by
Bexley and Bromley, and as such some non-Kent residents use Kent facilities, and vice-versa.
Many authorities operate a permit scheme which provides free use to their residents, whilst cross
border customers are required to pay a fee (£5 per visit at Dartford HWRC). This charge goes
some way to offsetting the costs borne to the Kent tax payer, of paying for non-Kent waste
disposal. Since the scheme has been in operation, usage by non-Kent residents has significantly
reduced resulting in cost savings for KCC.
Future permit scheme options
A recent study was undertaken at other Kent HWRCs which may experience potential cross
border usage. The results demonstrate that at most sites although there is some waste received
by non-Kent residents, it is minimal, and the cost of implementing a permit scheme would
outweigh any potential savings. However, the results for the Sevenoaks area (serviced by Dunbrik
and Swanley HWRCs) suggest significant savings, to the value of approximately £100,000 per 10 The Local Government Ombudsman looks at complaints about councils and some other authorities and organisations, including education admissions appeal panels and adult social care providers (such as care homes and home care providers). It is a free service.
24 | P a g e
year, could be realised with the introduction of a permit scheme, should the network of HWRCs
stay exactly as it is.
Health and safety
A number of Health & Safety activities are enforced across the HWRC network to ensure the
safety of site users and contractors. These are in addition to operational Health & Safety
requirements which ensure and monitor safe working practices. These activities are detailed
below:
Children & animals:Children and animals (pets) are required to remain in vehicles whilst at the HWRCs.
Walking in waste:The walking (or wheel barrowing) in of waste is prohibited.
Smoking:Smoking at the HWRCs is discouraged due to Health and Safety implications;
however this is not an enforceable policy. Designated smoking areas are identified
for site staff.
Removal of waste by site users:KCC adopts the policy that once items have been deposited at the HWRC by site
users, the items become the property of KCC. Site users or staff may not remove
any waste items from the HWRCs, at present.
Waste Disposal Contracts KCC has numerous contracts with recycling outlets, for HWRC and kerbside collected waste, to
ensure maximum reuse, recycling and composting activities are achieved in accordance with the
waste hierarchy. Where possible this waste is sent to facilities within Kent.
There are a number of waste disposal contracts managed directly by KCC. In some
circumstances, where material ‘ownership’ has been passed to our HWRC providers, they are
responsible for procuring and managing those contracts and any associated risks and rewards. A
number of these contracts will need to be renewed within the timeframe of the Waste Disposal
Strategy.
Some of the main recycling contracts managed by KCC include;
25 | P a g e
a) Dry Recyclables e.g. card, plastic bottles and glass are sent to a Material Recycling Facility
(MRF) which is a specialised plant that receives, separates and prepares recyclable
materials for marketing to end-user manufacturers.
b) Organic Waste e.g. food and garden goes to various outlets around Kent to be composted.
c) Wood waste is shredded and graded.
d) Waste Electrical and Electronic Equipment (WEEE) is sent to various outlets for recycling
and reprocessing and is managed through a specialised contract with a Producer
Compliance Scheme.11
Waste that is not reused, recycled or composted is dealt with through one of two ways, as follows:
Recovery: A significant proportion of Kent’s household waste is currently treated at the Allington
Waste to Energy Facility operated by Kent Enviropower (see ‘What happens to the waste’ p.16).
This recovery contract is long-term and runs out in 2030. The current contract will underpin KCC’s
waste management services between now and 2030. Therefore, through the Waste Disposal
Strategy delivery, consideration and solutions will need to be found, to be able to deal with this
waste beyond this time, and in line with national targets which are as yet unknown.
Final disposal: A very small percentage of waste goes to landfill, such as large bulky items that
we can't recycle, although this percentage is set to decrease further due to new ways to recycle
these items being utilised by the County and its contractors.
It should be noted, the waste collection and disposal market is becoming increasing commercially
volatile. In particular suppliers are finding it challenging to meet contract requirements, whilst
becoming increasingly reluctant to take up new opportunities in the current waste market. This will
require KCC to identify these market risks to local supply chains and service provision to plan
accordingly.
Current performanceIn 2014/15 540,900 tonnes of waste was collected by Kent WCAs for disposal by KCC as the
WDA. A further 172,000 tonnes of waste was collected at Kent’s HWRCs, of which 70.5% was
recycled or composted (Table 2).
11 A producer compliance scheme (PCS) is a membership organisation. The members are producers of electrical and electronic equipment (EEE). A PCS is responsible for registering all its members every year and must ensure it meets its financial obligations under the WEEE regulations and fulfill its data reporting obligations.
26 | P a g e

Table 2: Waste tonnage data 2012-2015
2012/13 2013/14 2014/15
HWRC Collected 165,700 163,300 172,000
WCA collected (kerbside) 522,000 533,500 540,900
Total Collected 687,700 696,800 712,900
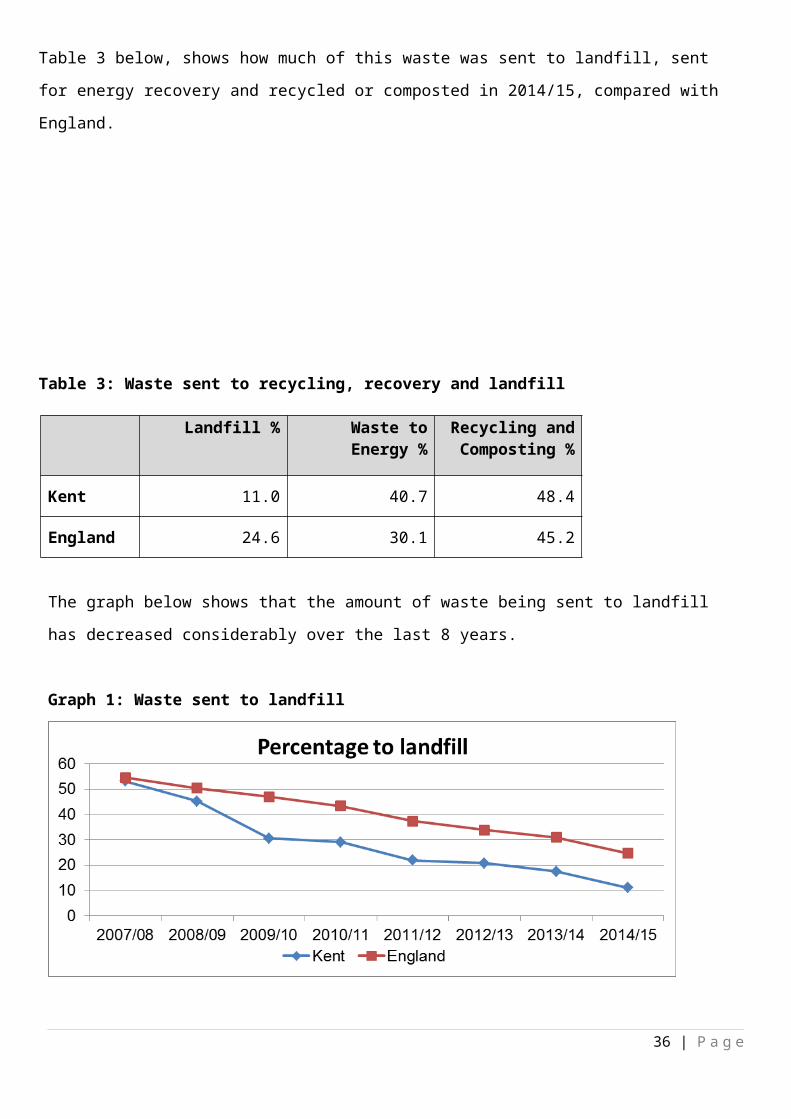
Table 3 below, shows how much of this waste was sent to landfill, sent for energy recovery and
recycled or composted in 2014/15, compared with England.
Table 3: Waste sent to recycling, recovery and landfill
Landfill % Waste to Energy %
Recycling and Composting %
Kent 11.0 40.7 48.4
England 24.6 30.1 45.2
The graph below shows that the amount of waste being sent to landfill has decreased
considerably over the last 8 years.
Graph 1: Waste sent to landfill
27 | P a g e

It should be noted that the percentage sent to landfill has decreased even further during the
months of 2015/16, on occasion achieving 5% and projected to decrease further still due to a new
contract for dealing with waste materials that would have previously been sent to landfill. This has
the potential for KCC to be one of the top performers in regards to the small amount of waste
being sent to landfill; Table 4 below shows the authorities with the lowest percentage of waste sent
to landfill in 2014/15. Further WDA benchmark data can be found in Appendix C.
Table 4: Lowest 5 local authorities % waste sent to landfill
Western Riverside Waste Authority 0%
Staffordshire County Council 2%
East Sussex County Council 3%
Lincolnshire County Council 4%
Hampshire County Council 5%
The percentage of waste sent to be burnt to recover energy or recycled or composted has
increased considerably over the last 8 years (Graph 2 and 3 respectively).
Graph 2: Waste to energy
28 | P a g e

Graph 3: Recycled or composted
Key Legislative Drivers The way waste is managed has evolved over the last couple of decades, with greater focus on reducing the amount produced and managing it in a more sustainable manner. Waste services are influenced primarily by legislation, targets and requirements that are passed down from the European Union and transposed in to national law, policies and strategies. The long term impact of the EU referendum or any shift in the UK’s relationship with Europe, on UK waste targets are presently unclear, so this evidence base continues to identify and consider a number of key legislation that may be relevant.
A number of the key legislations are identified and discussed below.
Waste hierarchy
29 | P a g e

The European Union's approach to waste management is based on the "waste hierarchy”. The
hierarchy ranks waste management options according to what is best for the environment.
It gives top priority to preventing waste in the first place. When waste is created, it gives priority to
preparing it for re-use, then recycling, then recovery, and last of all disposal (e.g. landfill).
Waste Framework DirectiveThe principal legislation affecting waste management to come out of Europe over the last few
years is the revised Waste Framework Directive (Directive 2008/98/EC on waste). The Directive
sets the basic concepts and definitions related to waste management, such as definitions of
waste, recycling, recovery. It explains when waste ceases to be waste and becomes a secondary
raw material (so called end-of-waste criteria), and how to distinguish between waste and
by-products.
The Directive also introduces the "polluter pays principle" and the "extended producer
responsibility". It incorporates provisions on hazardous waste and waste oils, and includes two
new recycling and recovery targets to be achieved by 2020:
• 50% preparing for re-use and recycling of certain waste materials from households and
other origins similar to households; and,
• 70% preparing for re-use, recycling and other recovery of construction and demolition
waste.
Interpretation of the Directives has been handed down to the devolved Governments in the UK.
Within England the current strategy is the Waste Management Plan for England, which was
released in December 2013. It is based on the Government Review of Waste Policy in England
2011 and the targets are as per the Waste Framework Directive requirements.
Waste (England and Wales) Regulations 2011/12
30 | P a g e
The Waste Framework Directive is implemented in England by the Waste (England & Wales)
Regulations 2011. A key part of this regulation is, that from 1 January 2015, local authorities need
to collect waste paper, metal, plastic or glass by way of separate collection where this is
necessary to ensure that waste undergoes recovery operations in accordance with Waste
Framework Directive and to facilitate or improve recovery; and where such separate collection is
technically, environmentally and economically practicable (TEEP).
Given the Council currently collects these materials via its HWRC network it is important to
understand the implication of this guidance. Many materials are already collected separately at the
HWRCs. Under Regulation 13 where materials are not collected separately the collection system
needs to be changed to provide all householders with separate collections for these materials.
However, under the Regulations co-mingled collections may be permitted if:
• The quality and quantity of the material collected is the same or better than could be
achieved by a separate collection (i.e. separate collection isn’t necessary to improve or
facilitate recovery of the material – the ‘Necessity Test’); or
• Separate collection is not Technically, Environmentally or Economically Practicable (the
‘TEEP Test’).
European Directive on the Landfill of Waste
The European Directive 1999/31/EC on the Landfill of Waste (Landfill Directive had wide reaching
implications for those producing, collecting and disposing of waste in the UK, as Landfill until
recently has been the dominant waste management option in the UK for many years. The Landfill
Directive’s aim is to reduce reliance on landfill as a disposal option.
It seeks to decrease the environmental impacts of landfills and reduce the risk to human health
while imposing a consistent minimum standard for landfills across the EU. The Landfill Directive:
• Sets minimum standards for the location, design, construction and operation of landfills.
• Sets targets for the diversion of Biodegradable Municipal Waste (BMW).
o By 2010 reduce the biodegradable waste landfilled to 75% of that produced in 1995
o By 2013 reduce the biodegradable waste landfilled to 50% of that produced in 1995
o By 2020 reduce the biodegradable waste landfilled to 35% of that produced in 1995
• Controls the nature of waste accepted for landfill.
31 | P a g e
• It defines the different categories of waste (municipal waste, hazardous waste,
non-hazardous waste and inert waste) and applies to all landfills, defined as waste disposal
sites for the deposit of waste onto or into land.
In order to help achieve the targets two initiatives were established, firstly the Landfill Allowance
Trading Scheme (LATS), which was revoked in 2014, and also the landfill tax. However, EU
diversion targets for biodegradable waste are still in place for Member States and so there is a
need to use alternative waste management techniques to landfill.
The national Landfill Tax is currently (financial year 2015/2016) levied at £82.60 on every tonne of
waste sent to landfill. The government announced in the 2014 budget, that from April 2015 the
standard and lower rates of landfill tax will increase in line with the Retail Price Index (RPI).
Material Recovery Facility (MRF) Code of Practice
A more recent regulation is the Materials Recovery Facility (MRF) Code of Practice Regulations,
which was introduced by the Government to comply with the revised Waste Framework Directive
and its objective to promote high quality recycling and separate collections. The requirements of
these regulations began in October 2014 and are incorporated into the Environmental Permitting
(England and Wales) (Amendment) Regulations 2013. They require that every MRF that accepts
in excess of 1,000 tonnes of mixed recyclables a year to report on the quality of the input, output
and residual waste every three months. The regulations intend to provide confidence to the
reprocessing market of materials coming out of MRFs. This is a much more detailed form of
measuring contamination than we have had previously and aims to address the concern that
contamination levels (and thus recycling rates) were not being reported accurately. It is possible
that as the data reporting improves we could see a fall in recycling rates for some local authorities
with commingled collections, due to more accurate recording of contamination levels.
Future Legislation
There are new waste legislation proposals coming from Europe that may impact the longer term
waste management services within the County. The proposals are to amend:
• Directive 2008/98/EC on waste.
• Directive 94/62/EC on packaging and packaging waste.
• Directive 1999/31/EC on the landfill of waste.
• Directive 2000/53/EC on end-of-life vehicles.
32 | P a g e
• Directive 2006/66/EC on batteries and accumulators and waste batteries and accumulators
and;
• Directive 2012/19/EU on waste electrical and electronic equipment.
These form part of a Circular Economy Package which also includes a Commission
Communication "Closing the loop – An EU action plan for the Circular Economy". The aim of the
proposal is to help turn Europe into a circular economy12, boost recycling, secure access to raw
materials and create jobs and economic growth. It did so by setting ambitious targets and adding
key provisions on the instruments to achieve and to monitor them. The proposal was presented as
part of the circular economy package.
The main elements of the proposals to amend EU waste legislation are:
• A common EU target for recycling 65% of municipal waste by 2030.
• A common EU target for recycling 75% of packaging waste by 2030.
• A binding landfill target to reduce landfill to maximum of 10% of all waste by 2030.
• A ban on landfilling of separately collected waste.
• Promotion of economic instruments to discourage landfilling.
• Simplified and improved definitions and harmonised calculation methods for recycling rates
throughout the EU.
• Concrete measures to promote re-use and stimulate industrial symbiosis – turning one
industry's by-product into another industry's raw material.
• Economic incentives for producers to put greener products on the market and support
recovery and recycling schemes (e.g. for packaging, batteries, electric and electronic
equipment, vehicles).
As defined within the Directive, the term “municipal waste” means:
“(a) mixed waste and separately collected waste from households including:
o paper and cardboard, glass metals, plastics, bio-waste, wood, textiles, waste
electrical and electronic equipment, waste batteries and accumulators.
o Bulky waste, including white goods, mattresses, furniture.
o Garden waste, including leaves, grass clippings.
(b) Mixed waste and separately collected waste from other sources that is comparable to
household waste in nature, composition and quantity.12 A circular economy is an alternative to a traditional linear economy (make, use, dispose) in which we keep resources in use for as long as possible, extract the maximum value from them whilst in use, then recover and regenerate products and materials at the end of each service life’. Definition from WRAP.
33 | P a g e

(c) Market cleansing waste and waste from street cleaning services, including street
sweepings, the content of litter containers, waste from park and garden maintenance.
Municipal waste does not include waste from sewage network and treatment, including
sewage sludge and construction and demolition waste”.
Therefore the proposed ban on the landfilling of separately collected waste could include any of
the above ‘municipal waste’. Further to this, the revised municipal landfill target includes “Member
States shall take the necessary measures to ensure that by 2030 the amount of municipal waste
landfilled is reduced to 10% of the total amount of municipal waste generated”.
Future TargetsIf adopted, these new circular economy targets could have significant impact upon KCC as the
WDA; whilst the target amount sent to landfill is more than achievable (indeed, we already meet
the 2030 target), the amount of waste we currently send for burning for energy recovery would
need to be reduced substantially to 30% and more waste sent for recycling or composting. An
alternative target might be to increase reuse at the sites. WRAP research13 has identified that 36%
of items assessed at HWRCs were reusable rising to 51% if a slight repair taken into account
increasing reuse and recycling at HWRCs would be complementary. In regards to recycling
targets at the HWRCs, a target of 80% recycling should be achievable by 2030. Specific targets
will be set as part of the refresh of the Kent Joint Municipal Waste Management Strategy due to be
undertaken in 2017.
Material MarketsThe markets for recyclable materials have been uncertain for several years, with low prices,
market crashes and corresponding impacts on revenues for authorities and waste management
companies. This uncertainty can be seen in material pricing data (from Letsrecycle.com) which
show considerable market fluctuations in the last 5-10 years for a range of key materials. As these
fluctuations can have a significant impact on revenue, it is necessary to take market uncertainty
into account when developing a long-term waste and recycling strategy.
Table 5: Prices of key recyclable materials (Jan 2010 – Dec 2015)13 http://www.wrap.org.uk/sites/files/wrap/UK%20bulky%20waste%20summary.pdf
34 | P a g e

Material
Highest average monthly
price
Lowest average monthly
price
Currentaverage price
(Jan 2015)
Averageprice since
Jan 2010
Steel cans £165 £22.2 £22.5 £122.5Aluminium cans £1040 £600 £645 £786.9Natural plastic e.g. plastic bottles and containers
£415 £275 £315 £337.1
Mixed colour plastic e.g. plastic bottles and containers
£225 £135 £135 £171.8
Mixed papers £100 £35 £51 £59.9Old cardboard boxes £114.5 £57 £70 £76.2
Newspapers and pamphlets £135 £47.5 £68.5 £95.5
Clear glass £40 £18 £19 £28.9Green glass £32.5 £4 £5 £14.3Brown glass £35 £11.5 £11.5 £24.1Mixed glass £27.5 £-10 £-10 £6.7
There are many causes of changes in the market, some of which may be specific to a small
number of materials while others can influence a wide range of streams. Factors include:
Material qualityWhether market prices are high or low, quality is the key driver of price. High quality materials will
achieve a greater market value than those of a low quality. Furthermore, high quality materials
also appear to have greater protection from price fluctuations and market crashes.
Oil priceOil market trends appear to mirror the plastics market.
Shipping pricesWith the UK recycling markets experiencing difficulty, there is an increasing reliance on the export
of materials to the global commodities market. Exports however, are affected by the cost of
shipping (including transport to and from the port, port fees, and so on) which can also fluctuate.
Combining low market prices for recyclable materials with high shipping costs can have a
significant impact on material revenues.
Changing and uncertain export markets
35 | P a g e
High quality is crucial for recyclable material being exported from the UK and as a result, lower
quality materials may attract reduced prices or may not be appropriate for export. There have
been a number of prosecutions by the Environment Agency due to breaches of quality standards.
For the European market, quality requirements are high and inspections are stringent therefore,
only the highest quality material is likely to be purchased, leading to low prices for other material.
The Chinese market has also seen a tightening of quality requirements, which had a considerable
effect in the UK.
Changing waste compositionComposition of waste is changing in a number of ways and for a number of reasons. For example,
the rise in digital media has resulted in a corresponding drop in the demand for newsprint. These
trends in turn, have an impact on the markets. In the case of paper, the UK has seen some high
profile closures of paper mills including Aylesford Newsprint, which made 100% recycled
newsprint using paper from the largest paper recycling factory in Europe. As a result, demand from
UK-based reprocessors for paper to be recycled has reduced, making it more challenging to
secure sale of material at a high price.
These factors are likely to continue to influence the recyclable material markets for the foreseeable
future and therefore it is necessary for a long-term waste and recycling strategy to mitigate against
the impacts as far as possible, particularly by maximising recycling quality.
Future waste projections and capacity requirementsPopulation and HousingIt is forecast that an average of 7,800 houses will be built every year in Kent until 2031. This will
result in a population growth of 22% over 20 years (from 2011) and 18% growth from 2015. The
Table below shows the projected dwellings and population.
Table 6: Dwelling and population projections14
14 Source: KCC Housing Lead Population Forecast October 201536 | P a g e

2011 2015 2021 2031
Dwellings 633,300 649,900 703,900 789,900
Population 1,466,500 1,522,700 1,632,000 1,795,600
Table 7 below outlines the most significant areas of development taking place across Kent, as
‘hotspots’ where population is most likely to increase.
Table 7: Significant areas of development
District Development Location No. of new dwellingsAshford Chilmington Green Great Chart with
Singleton North5,750
Canterbury Site 1 Land at South Canterbury
Barton 4,000
Dartford Castle Hill, Eastern Quarry
Greenhithe 6,100
Dartford Ebbsfleet Greenhithe 950Dartford Ebbsfleet Swanscombe 2,320Dover Whitfield Eastry 5,676
Projected population figures vary greatly from district to district, with some projected increases
significantly higher than others. Appendix D shows the population forecasts from 2011 (actual
census data) to 2031 (projections) by district. The graph below shows the projected percentage
increase in population between 2015 and 2031 by district. The largest increase is expected in
Dartford (39%) and the smallest increase projected in Shepway.
Graph 4: Projected population increases by district between 2015 and 2031
37 | P a g e

Ashford
Canter
bury
Dartford
Dover
Gravesh
am
Maidsto
ne
Seven
oaks
Shep
waySw
aleTh
anet
Tonbrid
ge & M
alling
Tunbrid
ge W
ells0%
5%
10%
15%
20%
25%
30%
35%
40%
45%Pe
rcen
tage
incr
ease
201
5-20
31
Waste Tonnage ProjectionsWaste tonnage produced per dwelling has been declining from some years but now appears to be
more stable and may increase in the future.
The projected waste tonnage figures for the years 2021 and 2031 are shown below. The 2015
figures are an estimate based on best available data. These projections suggest an increase of
22% of waste between 2015 and 2031.
Table 815: Waste tonnage projections
2015 2021 2031
Waste Tonnage 710,900 770, 270 864,200
HWRC network pressuresWhilst there is currently capacity across the HWRC network to accommodate present waste
tonnages and those projected for the near future (see ‘Waste tonnage projections’ p.37), this
capacity is currently displaced. As such there are some significant pressures on a number of our
15 The table assumes that waste tonnage produced by household/dwelling remains the same between 2015 and 2031.
38 | P a g e

HWRCs. The red dots on the map below shows the HWRCs that are the highest risk. It is clear
that these pressures are focussed in the West Kent area.
Map to show current network pressures
There are a number of factors affecting these sites which put them at risk;
Population growth- West Kent is going to experience a large amount of population growth
in the next 10 years. This puts pressure on these particular sites which are already
operating at full capacity. Much of this growth can be attributed to the Ebbsfleet Garden City
development. (See ‘Population and housing’ p.35)
Leases and land ownership- The Council does not own the land a number of these sites
currently sit on, and leases this from a third party. Land values in this area are high and
moving forward, taking into account financial pressures, the Council may not be able to
sustain paying these costs. Further details of site leasing and land ownership arrangements
can be found in Appendix E.
Infrastructure- A number of the sites require major improvement works in order to continue
to operate effectively. Aside from the financial investment required to make these
improvements, issues of space and local infrastructure make a number of these
improvements impossible.
It is also worth noting that whilst the surrounding HWRCs (those denoted with the green dots) are
currently operating well, they themselves will have further pressures placed upon them in within
the next 5 years, more so when taking into account the current issues outlined above.
39 | P a g e
Site currently under significant pressure
Site facing pressure within the next 5 years
Key
Future waste infrastructure requirementsThe Kent Minerals and Waste Local Plan (KMWLP) 2013-30 produced by KCC as the Waste
Planning Authority identifies a number of requirements for waste infrastructure up to 2030. The
KMWLP describes the overarching strategy and planning policies for waste management of all
waste streams that are generated or managed in Kent.
The key points to note, which will have an impact on the development of the waste management
service, are noted below;
Move waste up the waste hierarchy and reduce the amount of non-hazardous waste sent to
landfill.
Make provision for a variety of waste management facilities to ensure solutions for all major
waste streams.
The plan states that priority will be given to facilities that will increase amounts of waste for
re-use or recycling in a sustainable manner. Any plans put forward must demonstrate how
any development will contribute to moving waste up the waste hierarchy.
Any building and waste infrastructure developments must minimise the amount of
construction waste produced. All plans submitted must outline how this construction waste
will be dealt with, including details of end destinations.
Kent should be net self-sufficient and able to deal with waste close to its source of
production in a sustainable manner. It is noted that Kent should not be totally reliant on
other Authorities to deal with its waste.
The plan also states that it will safeguard existing waste management facilities, with
permanent planning permission from non-waste management uses.
A high standard of restoration of sites which involve the deposit of waste.
In addition to the above, the KMWLP has undertaken a needs assessment for waste, identifying a
need for additional waste facilities up to 2030.
The plan also discusses the diminishing capacity to deal with waste in East London, due to the
closure of the non-hazardous landfill site in Havering. This is estimated to close by 2018. As such,
Kent (and other surrounding authorities) has a duty to make provision to accept a share of this
waste - approximately 87,000 tonnes a year between 2018 and 2030. This is a requirement of
KCC as the Waste Planning Authority rather than as the Waste Disposal Authority.
In respect of identifying sites for HWRCs, the KMWLP recognises the established network and the
role they play in meeting waste recovery and landfill diversion targets. It also recognises that
during the lifetime of the KMWLP, there will be a need to rationalise facilities, whilst still meeting 40 | P a g e
local population needs. Furthermore, as part of the Waste Disposal Strategy delivery and in-line
with the KMWLP, consideration will need to be given to the requirement for enough capacity at
transfer stations and final disposal points for the household waste managed by KCC as the WDA.
Customer feedbackKCC has a duty to ensure that all of its services are organised around the needs of their service
users and residents. As such, KCC Waste Management is committed to providing the best
possible service to our customers.
In order to ensure that we are meeting the needs of our customers, KCC Waste Management
uses a number of tools to gain insight into their experiences and levels of satisfaction, as well as
gathering important feedback to make improvements and identify when we are performing well.
Where possible, the results collected and feedback gathered is shared with our customers, so that
they are able to understand how this data is used and we are able demonstrate that we value their
comments and suggestions, and will work, as far as is possible, to use these to improve their
services.
Customer Satisfaction Surveys (face-to-face)
KCC Waste Management undertake customer satisfaction surveys twice per year across all of its
HWRCs. These are undertaken onsite, face-to-face with customers by a third party. Procured by
KCC, in addition to undertaking the fieldwork, the third party are also responsible for analysing the
results and feedback. This ensures the feedback is objective.
Feedback is gathered at two seasonal sample points in spring and autumn to allow for seasonality
in results and gain an overall picture of the service. A minimum of 6,84016 surveys/ interviews are
required to be undertaken each year.
Customers are invited to give comment on a number of areas of the HWRC service, which reflect
their experience on that particular visit, ranking their satisfaction with both the operational aspects
of the service and the site staff. There is facility for customers to give open, honest feedback and
make recommendations for improvement. The current satisfaction level across the network is high,
at 94%17.
16 This is the minimum number required to ensure results are statistically valid within a 5% confidence rate. In 2015 a total of 7180 surveys were undertaken.17 Based on 2015 results- 94% of customers being ‘satisfied’ or ‘very satisfied’ overall with their visit to the HWRC.
41 | P a g e
In addition to understanding levels of satisfaction, the questionnaire also helps KCC Waste
Management to understand our customer behaviours such as how often they visit and when, the
types of waste that are being brought onto site, and how familiar they are with on-site policies and
procedures. Data is also collected to reflect who our customers are and where they are coming
from.
All of this data is integral in informing any changes to the service and helps us to determine the
best way to communicate with our customers.
Customer Satisfaction Surveys (online)
Customers have the facility to provide feedback on the HWRC service online, via kent.gov18. As
with on-site surveys, customers are asked to rate their levels of satisfaction and are able to
provide verbatim comments on the HWRC service.
It is important that this facility is available for customers to feedback at their own convenience at
any time of the year, minded that not everyone would be visiting site during the seasonal sampling
points.
Mystery ShoppingA programme of mystery shopping is undertaken across the HWRC network in order to
understand the customer experience. Unlike customer satisfaction surveys, mystery shopping
provides ‘real-life’ feedback that paints a full picture of the customer journey. Used extensively in
the private sector, mystery shopping is an important method for measuring both the quality of a
service and ensuring that we are complying with regulations.
Mystery shopping at the HWRCs is undertaken by a third party, procured by KCC. The provider
undertakes 4 ‘shops’ per month at each HWRC and results are published live via an online portal
which is accessible to both KCC and its HWRC providers to review.
A mystery shopper will look at a number of factors on their ‘shop’ including; entering the facility,
site and colleague presentation (to include Health and Safety), compliance to HWRC operating
policies, customer service and staff knowledge.
Mystery shopping is identified in KCC’s Commissioning Framework as an effective analysis tool
and it allows KCC to work with its service providers to drive operational and customer service
standards and improve site staffs morale and productivity. Undertaking mystery shopping not only
highlights areas for improvement but also enables us to celebrate successes.
18 https://kentcc.firmstep.com/default.aspx/RenderForm/?F.Name=MhQSJwjYgp6&HideAll=142 | P a g e
Complaints, comments and compliments
KCC Waste Management closely manages all compliments, comments and complaints concerning
the services it offers. This includes the HWRC service, issues with our policies and procedures,
and general enquiries.
All complaints, comments and compliments which come into KCC Waste Management are logged
onto a specialised system and assigned to the most appropriate officer for response.
In accordance with KCCs corporate policy, written complaints are acknowledged within 3 working
days and a full response is provided within 20 working days.
Calls, which come in either directly or from the Contact Point19, are also logged and monitored.
Waste Management work closely with the Contact Point to ensure that they are provided with the
most up to date information and able to provide full responses to any enquiries and issues.
Customer education and awarenessKCC has a strong track record of providing education and awareness campaigns to increase
waste awareness, waste reduction and recycling activity amongst Kent residents. With a range of
recycling services available to Kent residents, including HWRCs, bring banks and kerbside
recycling, collecting a range of materials, further inroads to reduction, reuse and recycling will rely
more on awareness campaigns.
Increased recycling and waste reduction habits amongst residents have become more the ‘norm’
as recycling services and ‘good practice’ communications and campaigns have been delivered.
The KRP now takes the lead on delivering countywide campaigns.
Campaign messages are devised through an understanding of what drives residents' attitudes,
and working to overcome existing barriers. The KRP seek a deepened understanding of
motivators and barriers to people's recycling activity, to inform future services and campaigns to
encourage greater responsible waste management practices by Kent residents.
Specific campaigns which have previously been undertaken by either KCC or the KRP include
War on Waste, Recycle for Kent, and more recently Metal Matters (produced by the KRP) and
Waste Electrical & Electronic Equipment (WEEE) recycling awareness messages (KCC led).
Reuse 19 Contact Point is KCC’s customer services centre, where initial calls from customers are taken.
43 | P a g e
Reuse sits higher in the waste hierarchy than recycling. It is where items are reused as they are,
or undergo minor repair or refurbishment in order to be reused, rather than undergoing treatment
or reprocessing into new items. At HWRCs, typical items that may be captured for reuse are:
furniture, waste electrical & electronic equipment (WEEE), textiles and bicycles.
Reuse is an area which should be considered further by KCC as activities are currently limited.
Some authorities currently take a light touch approach of directing householders to charities or
online reuse networks, and/or providing containers on site to segregate furniture for reuse, whilst
others take more in-depth approaches such as the provision of reuse shops.
In addition to meeting legislative drivers, there are a number of different benefits of increasing
reuse, including; reduced disposal costs, diversion from landfill and associated carbon benefits,
maximising value and use of resources already extracted, possible employment, training, reskilling
and volunteering opportunities and availability of low cost goods.
There are however a number of other considerations including; available budget for development
and ongoing running costs, the availability of suitable sites for reuse activities, availability of local
reuse opportunities, assessing the sustainability of such projects, and the role of KCC, third sector
organisations and waste management companies in any reuse activities.
Flytipping and litter
FlytippingKCC Waste Management has no statutory responsibility to remove waste from public or private
land, which includes both flytipping and litter. However, in accordance with the Environmental
Protection Act (1990), as the Waste Disposal Authority (WDA), KCC has a duty to cover the
disposal costs of waste collected by WCAs and provide a Household Waste Recycling Centre
service. In addition, the enforcement powers also remain with the WCA and the Environment
Agency, not the WDA, in this case Kent County Council.
Despite having no statutory responsibility to enforce against flytipping, KCC are able to support
district councils with enforcement against flytipping (through the sharing of legal powers), through
consultation with our Waste Enforcement Advisor. KCC are working as part of the KRP to tackle
flytipping in Kent.
KCC’s Waste Enforcement Advisor, is able to provide training and advice, supporting districts with
large scale/persistent offender investigation, cross border cases, covert surveillance, case file
preparation and prosecution. 44 | P a g e

It is important to note that KCC Highways and Public Rights of Way (PROW) have a duty to
ensure that the highway is safe for users (Highways Act 1980) and therefore has a responsibility to
ensure that there is no danger to the travelling public as a direct result of fly-tipped material on the
highway or a public right of ways e.g. by the use of traffic management. They will also assist with
the clearance of large scale flytips.
LitteringKCC Waste Management has no statutory responsibility to clear litter as this falls to the WCAs.
As with flytipped waste, waste management are still responsible for the disposal of this waste.
The KRP is working hard to tackle the issue of littering within Kent through numerous campaigns,
recognising that this is an environmental anti-social behaviour. District and Borough Councils are
able to apply Fixed Penalty notices to anyone who is caught littering.
Strategic Environmental AssessmentA Strategic Environmental Assessment (SEA) has not been completed for this Waste Strategy as
it is not a statutory requirement to have one (but is being undertaken as best practice) and
therefore does not fall under SEA regulations. The KJMWMS did require an SEA as under
regulations there was a statutory requirement for 2-tier authorities to develop a joint municipal
waste strategy.
45 | P a g e
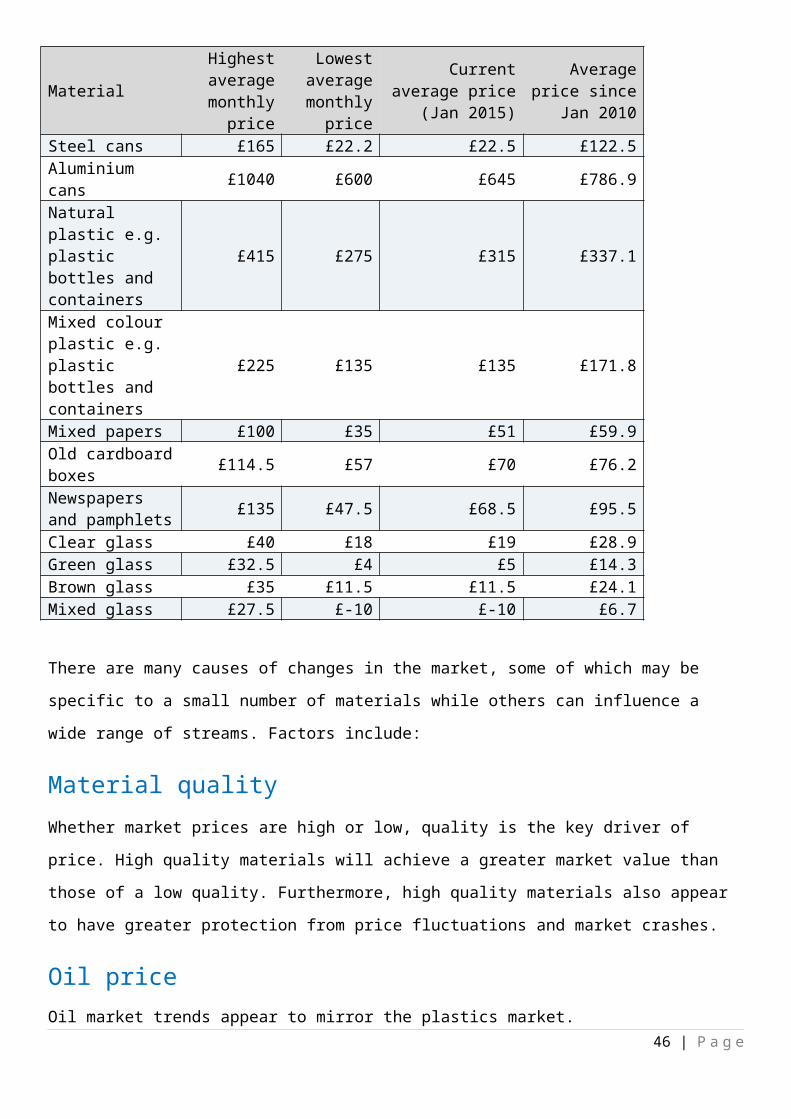
Appendix A: Glossary of TermsTerm Definition
Automatic Number Plate Recognition (ANPR)
A technology that uses optical character recognition to automatically read number plate characters.
Bring banks Recycling facilities often provided by District and Borough Councils in public areas such as supermarket car parks
Circular Economy A circular economy keeps resources in use for as long as possible, extracting the maximum value from them whilst in use, then recovering and regenerating products and materials at the end of each service life.
Commissioning
The process of planning how services are to be delivered, and the day-to-day management of these services.
Digital Delivery Providing information and access to services primarily online.
Dwellings A house, a flat or other place of residence.Environmental Crime The crime of flytipping and illegal deposit of trade
waste at HWRCs.GVW Gross Vehicle WeightHousehold Waste Recycling Centre (HWRC)
A building or site where household waste can be deposited by residents for recycling or disposal.
Kent Joint Municipal Waste Management Strategy (KJMWMS)
The strategy for the Kent Resource Partnership.
Kent Resource Partnership (KRP) A Partnership between KCC and the 12 District/Borough/City Councils of Kent. The Partnership looks at how waste management services can be improved in Kent.
Low Carbon Economy Reducing costs by cutting emissions.Materials Recycling Facility (MRF) A specialised plant that receives separates and
prepares recyclable materials for marketing to end-user manufacturers.
Organic wastes Organic waste, or green waste, is organic material such as food, garden and lawn clippings. It can also include animal and plant based material and degradable carbon such as paper, cardboard and timber.
Recyclate Any material that is able to be recycled.Recycling Turning waste into a new product or substance,
including composting.Recycling outlets A building or site for the treatment and processing
of waste for recycling.Refuse Derived Fuel A fuel produced by shredding and dehydrating solid
waste with a Waste converter technology.Re-use Checking, cleaning, repairing, and refurbishing
whole items or spare parts.Trade Waste Waste produced by businesses or commercial
activities.
46 | P a g e
Unitary Authority A council established in place of, or as an alternative to, a two-tier system of local councils e.g. Medway Council will act as the WCA and WDA.
Waste Collection Authority (WCA) District, Borough and City Councils responsible for the collection of household waste from the kerbside and delivery to a nominated delivery point.
Waste Disposal Landfilling waste.Waste Disposal Authority (WDA) Responsible for the receipt and onward processing/
disposal of household waste, providing a Household Waste Recycling Centre Service and monitoring closed landfills.
Waste Recovery Includes burning waste to produce energy.Waste Transfer Station (TS) A building or site for the temporary holding of
waste, where district/ borough councils will deposit waste prior to loading on to larger vehicles for transfer to final disposal point.
47 | P a g e

Appendix B: HWRC Materials Handled (tonnes)
Waste Type 2012/13 2013/14 2014/15
Garden Waste 33,209 32,854 32,219
Bicycles 5 3 1Bric A Brac 68 4 28Car Batteries 327 362 301Cardboard 432 413 425Cooking Oil 24 18 27Engine Oil 110 118 121Furniture 15 11 2Gas Bottles 0 0 35Glass - Amber 160 27 34Glass - Clear 470 85 66Glass - Green 172 97 93Glass - Mixed 1,162 1,446 1,193Metal 7,876 8,637 9,293Non Automotive Batteries 21 18 40Paper & Card 6,220 5,916 6,433Plasterboard 1,485 1,293 1,420Soil Hardcore 36,048 34,035 36,526Spectacles 1 1 0Textiles & Shoes 1,368 1,459 1,345Toner Cartridges 1 1 3Tyres 265 30 29WEEE CRT 2,970 2,101 1,911WEEE Fluorescent Tubes 21 23 25WEEE Fridges & Freezers 1,081 1,311 1,465WEEE LDA 51 267 157WEEE SDA 2,558 2,788 2,657Wood 23,043 24,453 25,585Dry Recycling 85,954 84,918 89,216
Residual 46,493 45,538 50,639
Total 165,656 163,311 172,076
Appendix C: Disposal Authority Benchmarks – 2014/1548 | P a g e
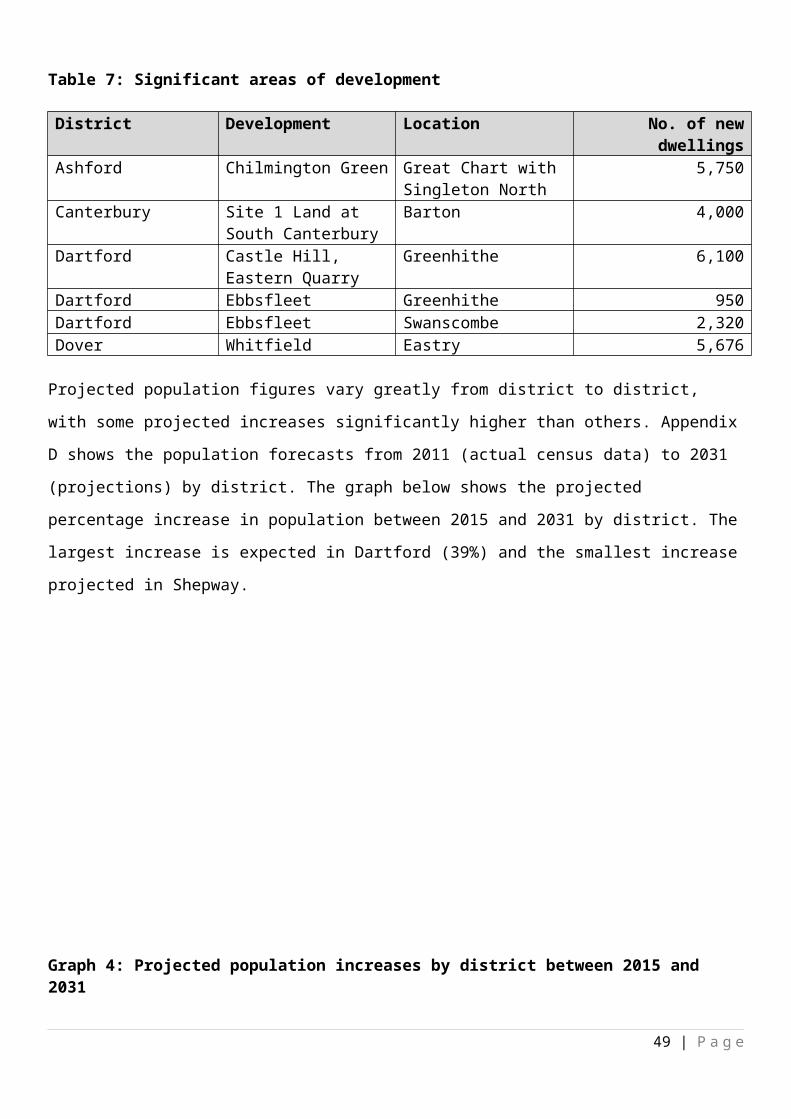
Top 5 recyclers
Authority Percentage Recycled
Cambridgeshire County Council 59%Oxfordshire County Council 58%Warwickshire County Council 54%Devon County Council 54%Surrey County Council 53%
Lowest 5 landfill
Authority Percentage to Landfill
Western Riverside Waste Authority 0%Staffordshire County Council 2%East Sussex County Council 3%Lincolnshire County Council 4%Hampshire County Council 5%
Highest 5 waste to energy
AuthorityPercentage
Waste to Energy
Western Riverside Waste Authority 81%North London Waste Authority 56%East Sussex County Council 55%Hampshire County Council 54%Lincolnshire County Council 45%
Appendix D: Population projections by district to 2031
49 | P a g e

District 2011 2015 2021 2031
Ashford 118,400124,60
0 137,900 150,900
Canterbury 150,600157,90
0 170,700 185,500
Dartford 97,600103,50
0 125,000 143,500
Dover 111,700113,40
0 121,500 130,900
Gravesham 101,800106,10
0 111,100 116,400
Maidstone 155,800163,70
0 178,900 197,500
Sevenoaks 115,400118,80
0 124,200 141,800
Shepway 108,200110,00
0 114,400 118,400
Swale 136,300142,50
0 150,100 166,700
Thanet 134,400139,60
0 143,200 158,200
Tonbridge & Malling 121,100125,60
0 134,700 148,700
Tunbridge Wells 115,500118,50
0 122,300 138,800
Appendix E: HWRC land leasing and ownership arrangementsHWRC Land statusAshford KCC ownedCanterbury Leased from 3rd PartyDartford Leased from 3rd PartyDeal Part KCC owned/ Part leased from 3rd PartyDover KCC ownedFaversham KCC ownedFolkestone KCC ownedHerne Bay Leased from 3rd PartyMaidstone KCC ownedMargate Leased from 3rd PartyNew Romney KCC ownedPepperhill KCC ownedRichborough KCC ownedSevenoaks Leased from 3rd PartySheerness Leased from 3rd PartySittingbourne KCC ownedSwanley KCC ownedTunbridge Wells KCC owned
50 | P a g e
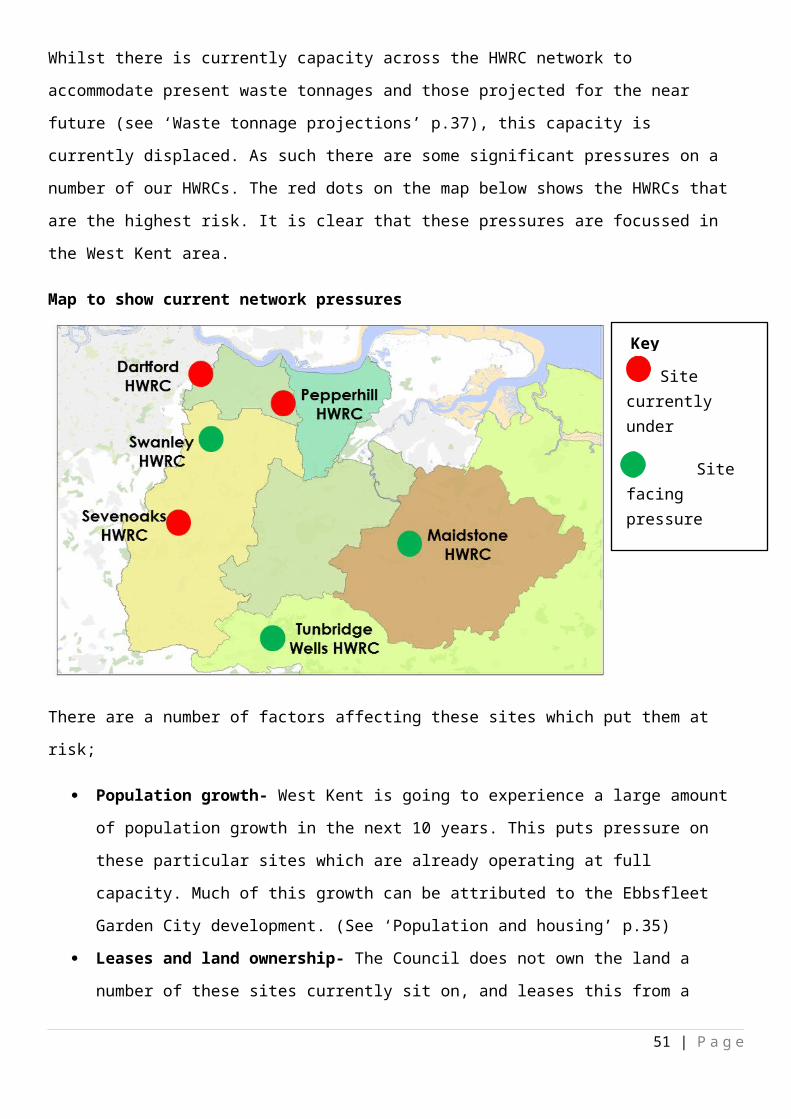
Kent Waste Disposal Strategy 51 | P a g e

2017-2035
Evidence Base
52 | P a g e
i