datascienceplus.com file · Web viewSaved Datasets are the datasets that you will upload to your...
15
A lots of people are unfamiliar with one of the best Predictive Modeling tool of Microsoft. It's called Azure Machine Learning Studio. I am going to give a basic hands-on with Azure ML studio. What I am going to build is a censor income predictor. We will be using classification technique to predict income on the top of a sample dataset already in Azure Machine Learning Studio. Data Transformation Let's go step by step. Make a free account at https://studio.azureml.net. The trial free version gives you enough space for experimentation. Go to New Experiment and you'd see your work space as follow.
Transcript of datascienceplus.com file · Web viewSaved Datasets are the datasets that you will upload to your...

A lots of people are unfamiliar with one of the best Predictive Modeling tool of Microsoft. It's called Azure Machine Learning Studio.
I am going to give a basic hands-on with Azure ML studio.
What I am going to build is a censor income predictor. We will be using classification technique to predict income on the top of a sample dataset already in Azure Machine Learning Studio.
Data Transformation
Let's go step by step.
Make a free account at https://studio.azureml.net. The trial free version gives you enough space for experimentation.
Go to New Experiment and you'd see your work space as follow.
This is how your work space would look like. At the left are the modules that you would be using to transform, build, the data.
I wouldn't go in technical details. I will keep the tutorial as simple as possible.

At the top right, you can see Saved Data sets. Click on it and you will see two drop downs.
1. Saved Datasets2. Samples
Saved Datasets are the datasets that you will upload to your Workspace. They would be available to use at any instance over a click. The Samples are the datasets that come up with Azure Machine Learning Studio in Default.
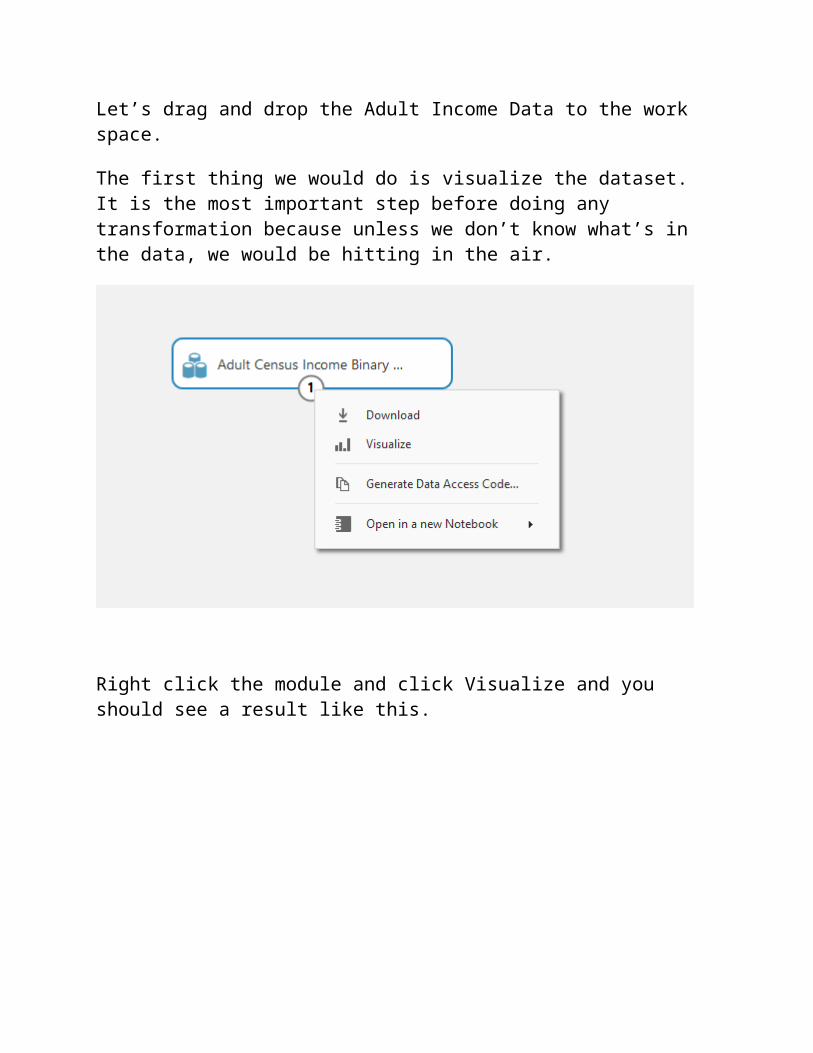
Let’s drag and drop the Adult Income Data to the work space.
The first thing we would do is visualize the dataset. It is the most important step before doing any transformation because unless we don’t know what’s in the data, we would be hitting in the air.
Right click the module and click Visualize and you should see a result like this.
You can click on each variable/column to see the histograms at the right hand side. You would also come across descriptive statistics as follow.
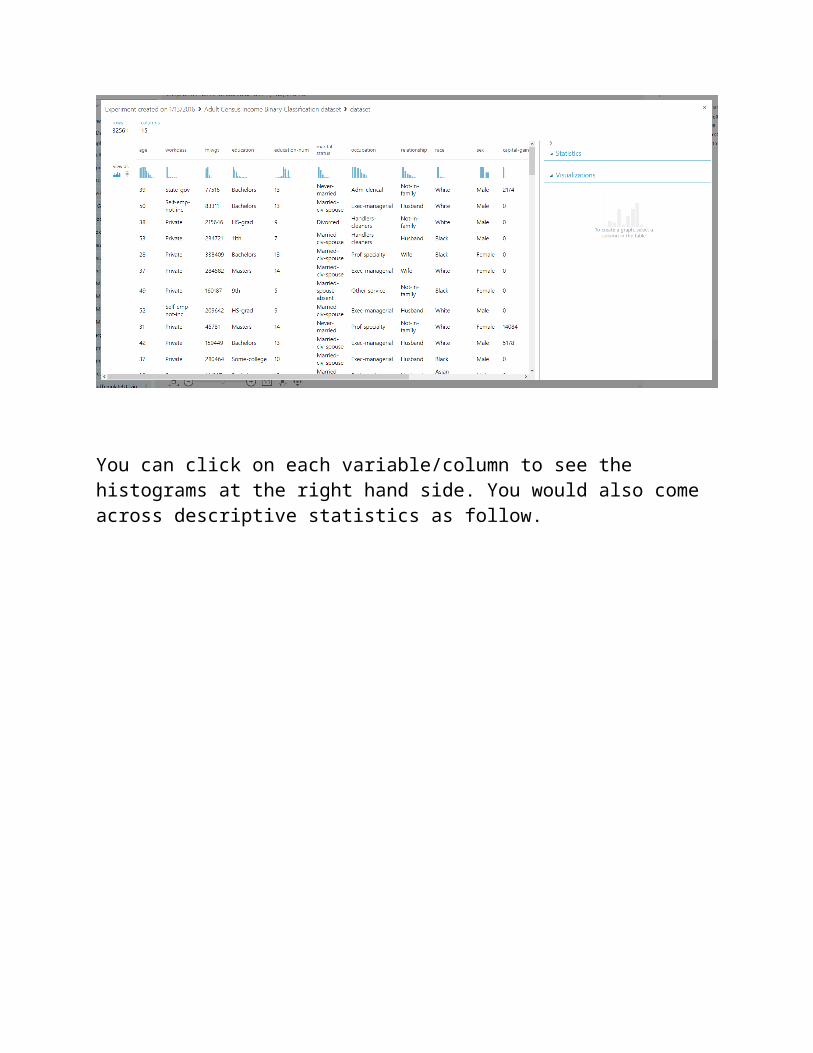
These statistics can give you a quick peek into your data.Let’s now move on to next step.
As you are well aware of the fact that world is full of noise, dirt and mess. So there’s no data which comes with flowers, but most of the data comes with tangible thorns. The missing values are cancer to the data and we should always get rid of them.
Azure ML provides a missing value scrubber module for that.

Drag the module to the work space and connect the dataset node with it.
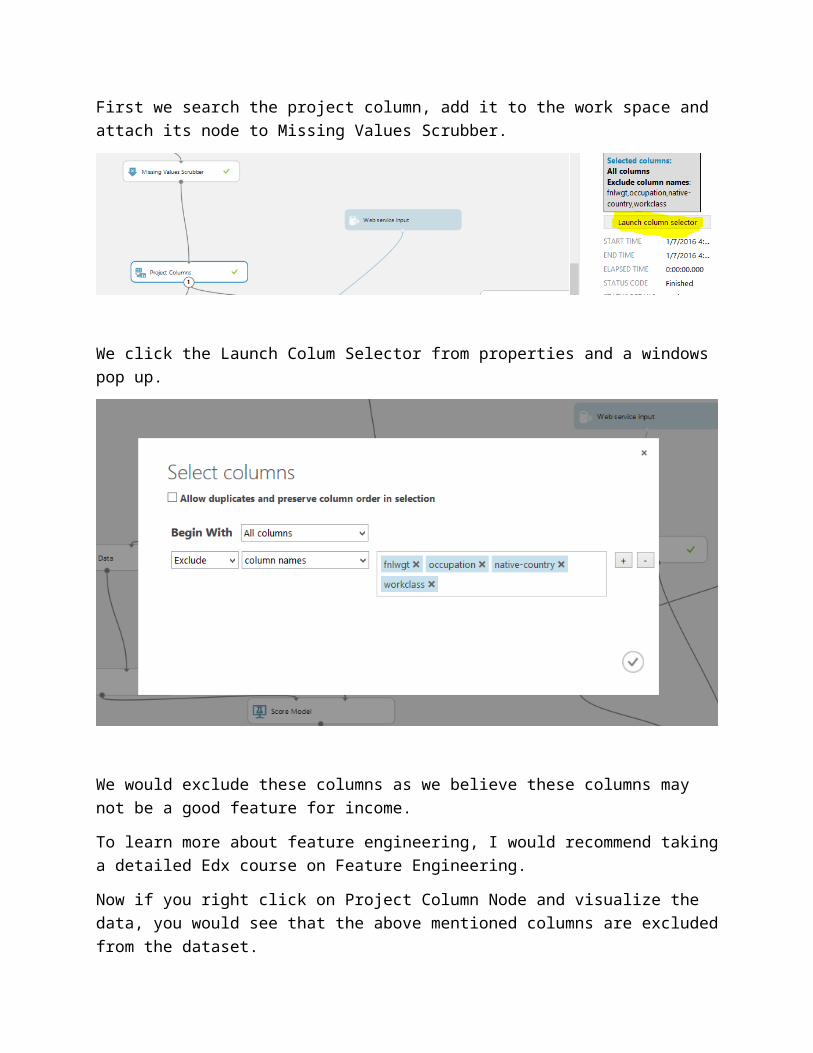
Click on it and at the right hand side, you would see the properties of it.Select Custom Substitution Value and replace all the missing value with 0.Continuing the steps in data transformation. One of the most important module that you will be working with all your life is Project Columns. This module is used to project, include, and exclude columns. We necessarily have to see for income prediction, which of the columns are necessary for us and which are not. First we search the project column, add it to the work space and attach its node to Missing Values Scrubber.

We click the Launch Colum Selector from properties and a windows pop up.
We would exclude these columns as we believe these columns may not be a good feature for income. To learn more about feature engineering, I would recommend taking a detailed Edx course on Feature Engineering.Now if you right click on Project Column Node and visualize the data, you would see that the above mentioned columns are excluded from the dataset.
ModellingNow when we are done with Data Transformation, it’s time to kick into modelling.
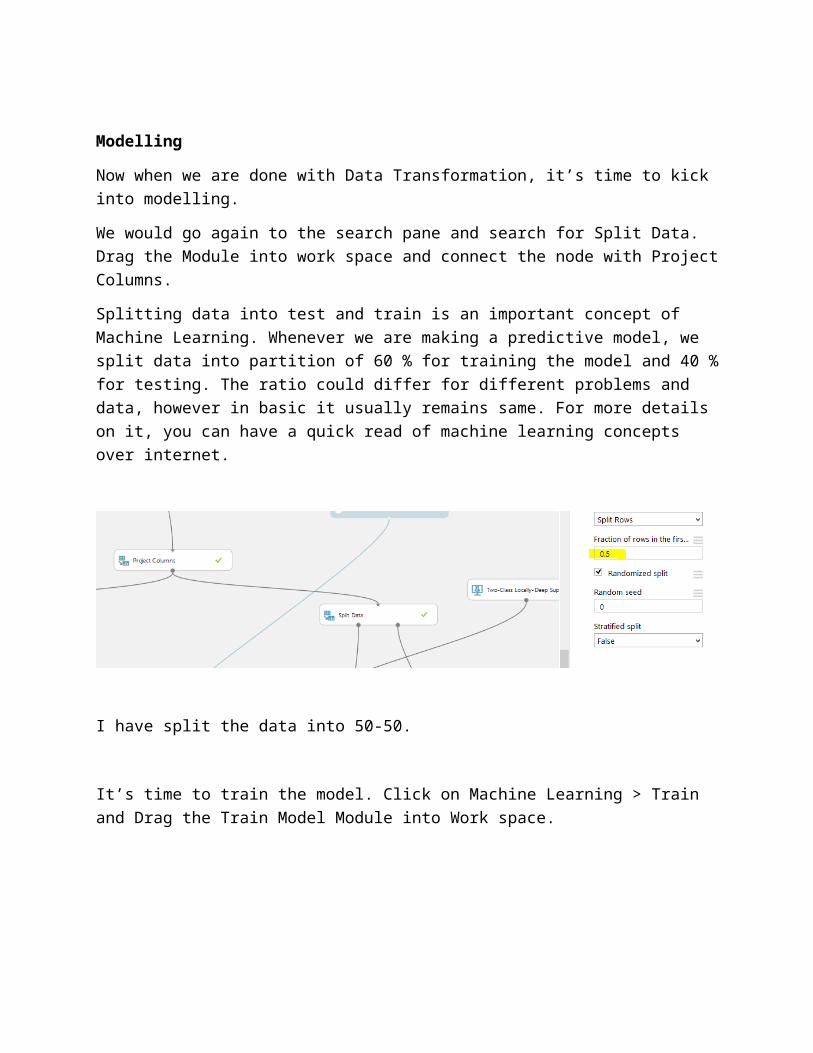
We would go again to the search pane and search for Split Data. Drag the Module into work space and connect the node with Project Columns.Splitting data into test and train is an important concept of Machine Learning. Whenever we are making a predictive model, we split data into partition of 60 % for training the model and 40 % for testing. The ratio could differ for different problems and data, however in basic it usually remains same. For more details on it, you can have a quick read of machine learning concepts over internet.
I have split the data into 50-50.
It’s time to train the model. Click on Machine Learning > Train and Drag the Train Model Module into Work space.
Remember, the split module would have two output nodes, one would go into train model and about the other one, I would explain later in the post. Click on train model, go to right hand side properties, you’d see a Launch Column Selector. Click it and a window will pop it. You would have to mention your target variable here. For our case, its income.
Now that you have specified the target Variable, its time to identify an algorithm for training. Since our is a classification problem that is we want to see if the income of an individual is greater than or less than 50k. We would use a classification algorithm. I would use Boosted Decision Trees.

We would connect the algorithm to the other node of train model. The next step would be to score the model results. Scoring model would give us an output column of the scored prediction results. What is Decision Trees?In simple words, it finds a probability of happening of an event by making trees. More details about the algorithm can be read here.

Now is the time when I would tell you that the other node of Split Colum that would be the test data would go into the right hand side node of Score Model and at the left hand side, we would connect train model.
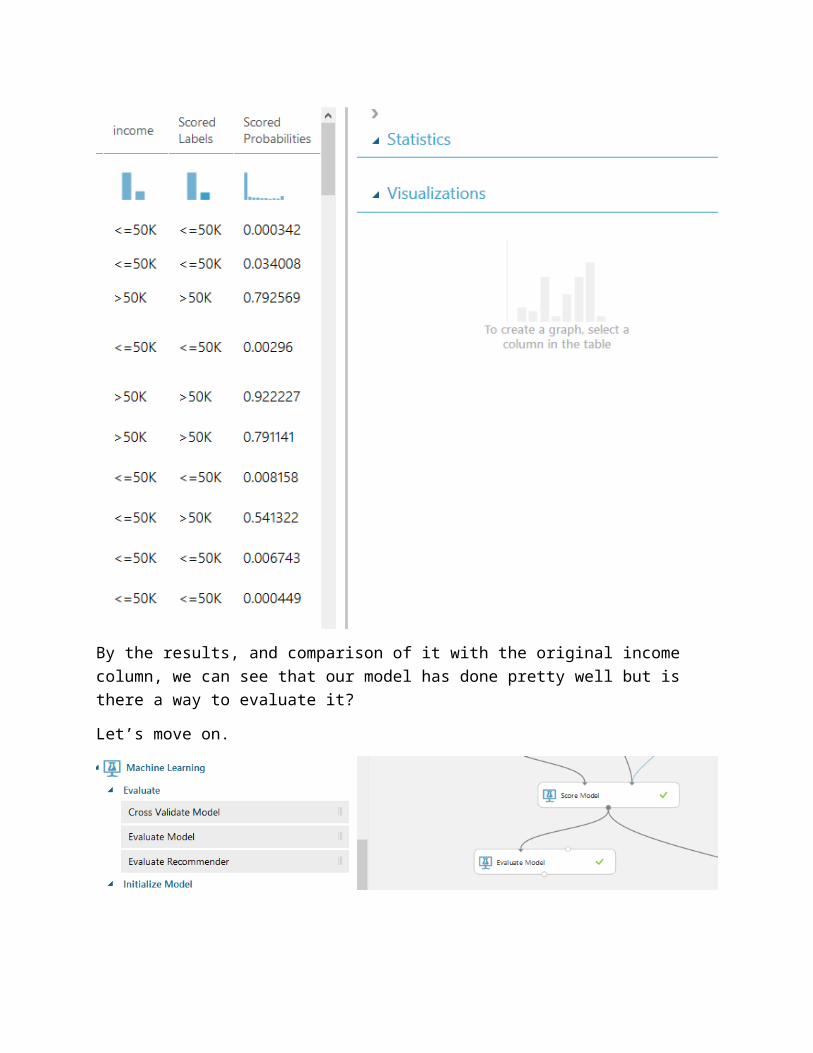
Run the model and wait until you find green ticker signs at the modules. Once it is done, right click on Score Model and Visualize it. You would find two more column names at the end, One with Score Labels and other with Scored Probabilities.

By the results, and comparison of it with the original income column, we can see that our model has done pretty well but is there a way to evaluate it? Let’s move on.
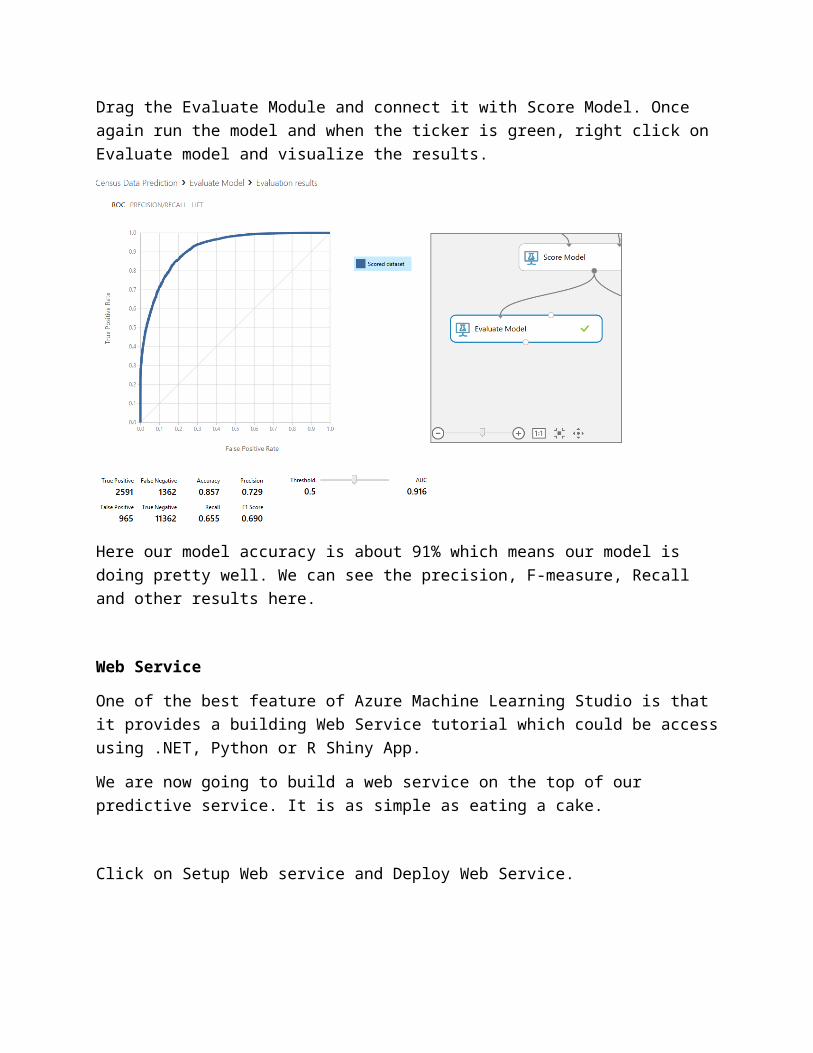
Drag the Evaluate Module and connect it with Score Model. Once again run the model and when the ticker is green, right click on Evaluate model and visualize the results.
Here our model accuracy is about 91% which means our model is doing pretty well. We can see the precision, F-measure, Recall and other results here.
Web ServiceOne of the best feature of Azure Machine Learning Studio is that it provides a building Web Service tutorial which could be access using .NET, Python or R Shiny App.We are now going to build a web service on the top of our predictive service. It is as simple as eating a cake.
Click on Setup Web service and Deploy Web Service.
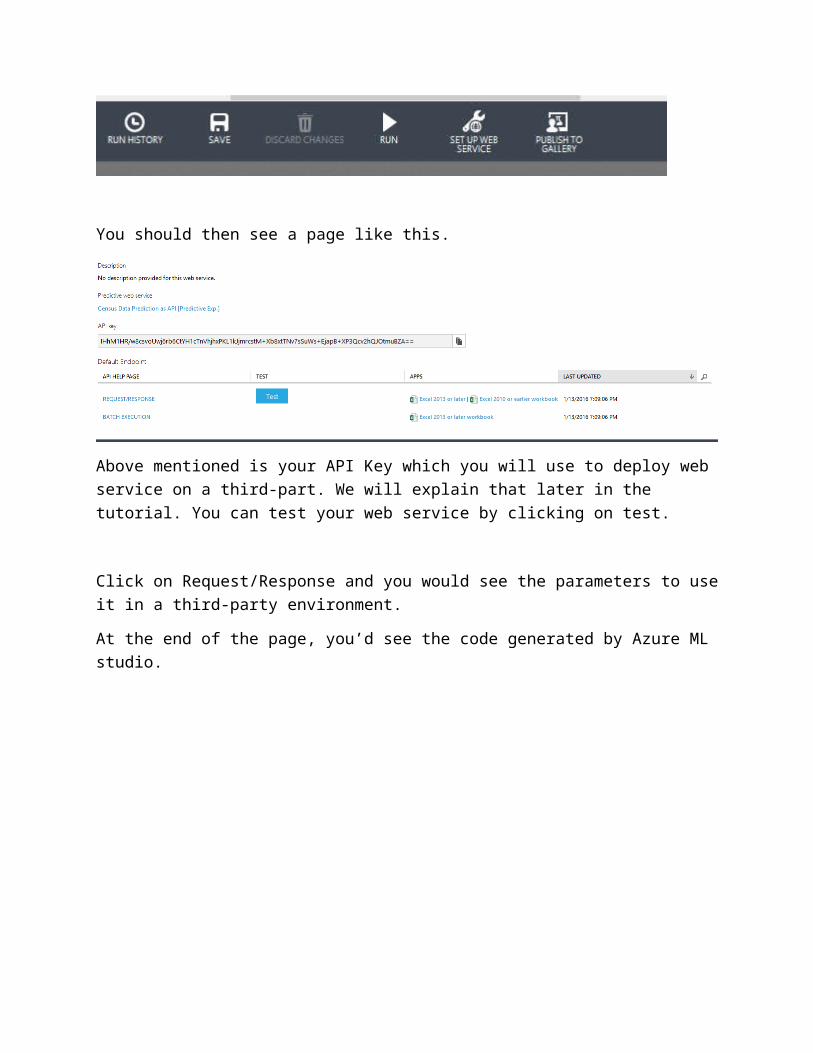
You should then see a page like this.
Above mentioned is your API Key which you will use to deploy web service on a third-part. We will explain that later in the tutorial. You can test your web service by clicking on test.
Click on Request/Response and you would see the parameters to use it in a third-party environment. At the end of the page, you’d see the code generated by Azure ML studio.
To make a real-time web application, we would be using Python for this tutorial. You can make use of .NET and R Shiny as per your skills.