€¦ · Web viewMID-TERM REVIEW OF THE EU BIODIVERSITY STRATEGY to 2020. EU Assessment of Progress...
45
EN EN EUROPEAN COM M ISSION Brussels, 2.10.2015 SW D (2015)187 final PA RT 1/3 CO M M ISSIO N STAFF W O RK IN G DOCUM ENT EU ASSESSM ENT O F PR O G R ESS IN IM PLEM ENTING TH E EU BIO D IV ER SITY STRATEG Y TO 2020 Accompanying the document R eportfrom theC om m ission to the European Parliam entand the C ouncil TheM id-Term R eview ofthe EU Biodiversity Strategy to 2020 {CO M (2015)478 final}
Transcript of €¦ · Web viewMID-TERM REVIEW OF THE EU BIODIVERSITY STRATEGY to 2020. EU Assessment of Progress...

EN EN
EUROPEAN COMMISSION
Brussels, 2.10.2015 SWD(2015) 187 final
PART 1/3
COMMISSION STAFF WORKING DOCUMENT
EU ASSESSMENT OF PROGRESS IN IMPLEMENTING THE EU BIODIVERSITY STRATEGY TO 2020
Accompanying the document
Report from the Commission to the European Parliament and the Council
The Mid-Term Review of the EU Biodiversity Strategy to 2020
{COM(2015) 478 final}

MID-TERM REVIEW OF THE EU BIODIVERSITY STRATEGY TO 2020
EU ASSESSMENT OF PROGRESS IN IMPLEMENTING THE EU BIODIVERSITY STRATEGY TO 2020
Table of Contents of the documents
I. INTRODUCTION.............................................................................................................................PART 1/3
II. BIODIVERSITY IN THE EU.........................................................................................................PART 1/3
III. PROGRESS SINCE 2011...............................................................................................................PART 1/3
2020 Biodiversity Headline Target..........................................................................................PART 1/3
Target 1 – Fully Implement the Birds and Habitats Directives...............................................PART 1/3
Target 2 – Maintain and Restore Ecosystems and their Services............................................PART 2/3
Target 3a – Increase the contribution of agriculture to maintaining and enhancing biodiversity..............................................................................................................................PART 2/3
Target 3b – Increase the contribution of forestry to maintaining and enhancing biodiversity .............................................................................................................................PART 2/3
Target 4 – Ensure the sustainable use of fisheries resources and good environmental status........................................................................................................................................PART 3/3
Target 5 – Combat Invasive Alien Species..............................................................................PART 3/3
Target 6 – Help avert global biodiversity loss.........................................................................PART 3/3
IV. HORIZONTAL MEASURES........................................................................................................PART 3/3
Mobilising resources to support biodiversity...........................................................................PART 3/3
Partnerships for Biodiversity...................................................................................................PART 3/3
Building on the biodiversity knowledge..................................................................................PART 3/3
ANNEX I: 'DASHBOARD'
ANNEX II: INDICATIVE LIST OF RESEARCH PROJECTS
ANNEX II: INDICATIVE LIST OF DEVELOPMENT COOPERATION PROJECTS

Table of Contents of PART 1/3
I. INTRODUCTION.......................................................................................................................4
II. BIODIVERSITY IN THE EU.....................................................................................................7
III. PROGRESS SINCE 2011............................................................................................................8
2020 Biodiversity Headline Target..............................................................................................8
Target 1 – Fully Implement the Birds and Habitats Directives.................................................15PROGRESS IN IMPLEMENTING ACTIONS............................................................................................19
Page 3 of 31

I. INTRODUCTIONBiodiversity – the variety of life on the planet – underpins our economy and wellbeing. It is our life
insurance and our natural capital. It delivers a wide range of essential benefits to human society such as food,
materials, clean water, clean air and medicines as well as protecting us from the consequences of extreme
weather events and mitigating the impacts of climate change. Up to 50% of our prescription medicines use
naturally occurring substances from plants. The value of insect pollination services alone has been estimated
at €15 billion per year in the EU1. One in six jobs in the EU depends to some extent on nature and
biodiversity2.
The World Economic Forum listed 'biodiversity loss and ecosystem collapse' among the top 10 risks in the
Global Risks Perception Survey 20143. Scientists further identify biodiversity loss and climate change as the
two core planetary boundaries that have already been crossed by humanity4. Together with climate change -
another major global challenge - it increases the risk of irreversible changes5, undermining economic devel-
opment and societies' resilience in the face of new challenges. Furthermore, the risk of extensive global biod-iversity loss could increase if action is not taken to limit climate change to below 2°C. The most recent sci-
entific research into species extinction rates concludes that even when the most conservative estimates
are applied, species are found to be disappearing about 100 times faster than the 'normal' rate between
mass extinctions, known as the background rate. It also finds that this is mainly the result of human ac -
tivity and confirms that if current rates of extinction continue unchecked, the social and economic conse-
quences for humanity will be enormous6. For the EU, the opportunity cost of not reaching the 2020 EU biod-
iversity headline target of halting the loss of biodiversity and ecosystem services by 2020 has been estimated
at 50 billion EUR per year7. In addition to undermining these economic benefits, loss of biodiversity means
that ecosystems and societies that rely upon them are more fragile and less resilient in the face of challenges
such as climate change, pollution and habitat destruction. For example, economic losses from natural dis-
asters, such as floods and droughts, amounted to around €100 billion in the period 2002-2014 in the EU and
caused over 80,000 deaths8, and are likely to increase due to demographic trends and the impacts of climate
change. In many situations, healthy wetland and forest ecosystems can provide effective and cost-efficient
protection against extreme weather events.
1 Gallai et al, 20092 GHK et al. 2007, box 15 TEEB – The Economics of Ecosystems and Biodiversity for National and International Policy Makers – Summary: Responding to the Value of Nature 2009http://www.teebweb.org/media/2009/11/National-Executive-Summary_-English.pdf3 Global Risks Perception Survey 2014http://reports.weforum.org/global-risks-2015/part-1-global-risks-2015/environment-high-concern-little-progress/ 4 Steffen W, et al. (2015) Planet Boundaries: Guiding human development on a changing planet. Science. 13 February 2015. Vol. 347 n° 6223.5 Steffen W, et al. (2015) Planet Boundaries: Guiding human development on a changing planet. 6 http://advances.sciencemag.org/content/1/5/e1400253.full 7 The costs of not implementing the environmental acquis, COWI et al, 2011. http://ec.europa.eu/environment/enveco/economics_policy/pdf/report_sept2011.pdf8 Cf. Centre for Research on the Epidemiology of Disasters (CRED)
Page 4 of 31
Figure 1 – Number of exctinct species over time at global level
.
Page 5 of 31

The window of opportunity for halting and reversing biodiversity loss is rapidly closing. Human-induced
impacts and pressures on biodiversity such as land clearing for farming, logging and settlement, intro-
duction of invasive species, carbon emissions that drive climate change and ocean acidification, and tox-
ins that alter and poison ecosystems are exacerbated by world population growth, rising per capita con -
sumption and economic inequity9.
Recognising this challenge, in 2011, the Commission adopted the EU Biodiversity Strategy to 2020 10 with
the headline target set by EU Heads of State and Government in 2010 to 'halt the loss of biodiversity and
ecosystem services by 2020, to restore ecosystems in so far as is feasible, and to step up the EU
contribution to averting global biodiversity loss’. The strategy is built around six operational targets
addressing the implementation of EU nature legislation as well as the main pressures on biodiversity in the
EU and beyond, with 20 associated supporting actions over the period 2011-2020. The EU Strategy also
emphasises the need to take full account of the economic and social benefits provided by nature contribution
and to integrate these benefits into reporting and accounting systems.
The EU Biodiversity Strategy to 2020 is an integral part of the Europe 2020 Strategy11, and in particular the
resource efficient Europe flagship initiative12, and contributes to the implementation of the 7 th Environmental
Action Programme13. The Strategy is a crucial instrument to secure and sustain the natural resource base
which our economy needs to thrive, and is therefore fully relevant in the context of the circular economy
debate. The Strategy is also designed to deliver on the EU international commitments under the Convention
on Biological Diversity. It is linked to policy objectives which are a prerequisite for delivery on the EU
Biodiversity Strategy, notably related to climate policies, legislation in the field of air and chemicals, the
Water Framework Directive, the Marine Strategy Framework Directive, and the EU Thematic Strategy for
Soil Protection.
The preliminary results from the 2015 Biodiversity Eurobarometer survey indicate that three out of four
Europeans "agree totally" that it is important to stop biodiversity loss because it is our responsibility to look
after nature., which gives a clear public support to pursue the implementation of the EU 2020 Biodiversity
Strategy.
The EU Biodiversity Strategy to 2020 foresees that a mid-term review will be undertaken to take stock of
progress under the strategy targets and actions, drawing on the best set of information sources. Identifying
gaps in implementation is necessary in order to inform decision-makers of areas in which increased efforts
are needed to ensure that the EU meets its biodiversity commitments by 2020.
9 Steffen W, et al. (2015) Planet Boundaries: Guiding human development on a changing planet. Science. 13 February 2015. Vol. 347 n° 6223.10 COM(2011)244 final11 COM(2010) 2020 final12 COM(2011) 21 final13 Decision No 1386/2013/EU
Page 6 of 31

II. BIODIVERSITY IN THE EUThe countries of the EU are extremely diverse in terms of their climate, geology and topography and
centuries of diverse farming and forestry traditions have shaped a wealth of multifunctional landscapes and
contributed significantly to Europe’s biodiversity and cultural diversity However, developments, particularly
during the 20th century, have also resulted in large-scale destruction of Europe's natural heritage, including
the loss of two thirds of its wetlands, and of almost three-quarters of its sand dunes and heaths, through a
combination of land-use change, over-exploitation of biodiversity, infrastructure developments, pollution,
the spread of invasive alien species and climate change.14
The EU 2010 Biodiversity Baseline15 provides a reference point against which to assess changes in
biodiversity over time. The 2010 baseline suggested that, although species extinction in the EU is not
occurring nearly as rapidly as in other regions and continents, the percentage of species threatened with
extinction is a matter of concern.
The main ecosystems in Europe16 are forest and woodland (covering 41 % of the territory), cropland (25 %),
and grassland (19 %). Freshwater ecosystems (open water and wetlands) cover only less than 5% of EU28
area but hold a higher number of species per unit area than land or sea, and provide a number of key
ecosystem services.
Figure 2 – Land cover in the EU-27
Europe is also home to a considerable diversity of species: there are 260 species of mammals (of which 40
are marine mammals), 500 species of fish, 500 of breeding birds, 150 of reptiles, 84 of amphibians and
90 000 species of insects, including 10 000 of butterflies and moths, 30 000 of beetles and 20 000 species of
vascular plants. These figures do not include the EU’s Outermost Regions and Europe’s Overseas Countries
and Territories, which host more than twice the number of species present in continental Europe...
14 EEA Technical report on State of Nature in the European Union, May 2015 http://www.eea.europa.eu/highlights/state-of-nature-in-the 15 http://www.eea.europa.eu/publications/eu-2010-biodiversity-baseline/16 Source: Eurostat LUCAS 2012 survey (http://ec.europa.eu/eurostat/statistics-explained/index.php/Land_cover_statistics )
Page 7 of 31

III. PROGRESS SINCE 2011
2020 Biodiversity Headline Target
Halt the loss of biodiversity and the degradation of ecosystem services in the EU by 2020, and restore
them in so far as feasible, while stepping up the EU contribution to averting global biodiversity loss.
State of Nature in the EU
Compared to the findings as illustrated in the EU 2010 Biodiversity Baseline, the most recent assessment of
conservation status of species of Community interest17 shows that overall 23% of species assessments are
favourable and 4% are improving, 20% are stable 22% are deteriorating and 14% are without a known trend.
The proportion of assessments which are unfavourable and deteriorating is particularly high for fish,
molluscs and amphibians, all associated with wetlands and freshwater (rivers, lakes).
Only 16% of the fish species protected under the Habitats Directive are assessed as having a favourable
status, while over a quarter of vascular plants are considered favourable. Looking at the conservation status
trends, fish molluscs and amphibians appear to have a particularly high proportion of species with a
deteriorating trend. These species are depending on aquatic environments, such as rivers, lakes and wetlands,
which mostly have an unfavourable-inadequate conservation status. The main identified threats are human-
induced changes to hydrologic functioning, loss of connectivity, canalisation, removed of sediment, and
eutrophication and pollution.
On the positive side, 6% of assessments for mammal species are unfavourable but improving and only 12%
show a deteriorating trend. Some species like the Otter, Lutra lutra, are showing signs of improvement. In
the Atlantic region, it has made a steady recovery over the last 20 years thanks to a decrease in certain
waterborne pollutants such as PCBs and mercury, protection from hunting and improvements in aquatic
habitats.
17 EEA Technical report on State of Nature in the EU, May 2015 http://www.eea.europa.eu/highlights/state-of-nature-in-the
Page 8 of 31
Figure 3 - Conservation status of and trends for species
23%
4%
20%21%
14%
17%
FavourableUnfavourable-improvingUnfavourable-stableUnfavourable-deterioratingUnfavourable-unknown trendUnknown
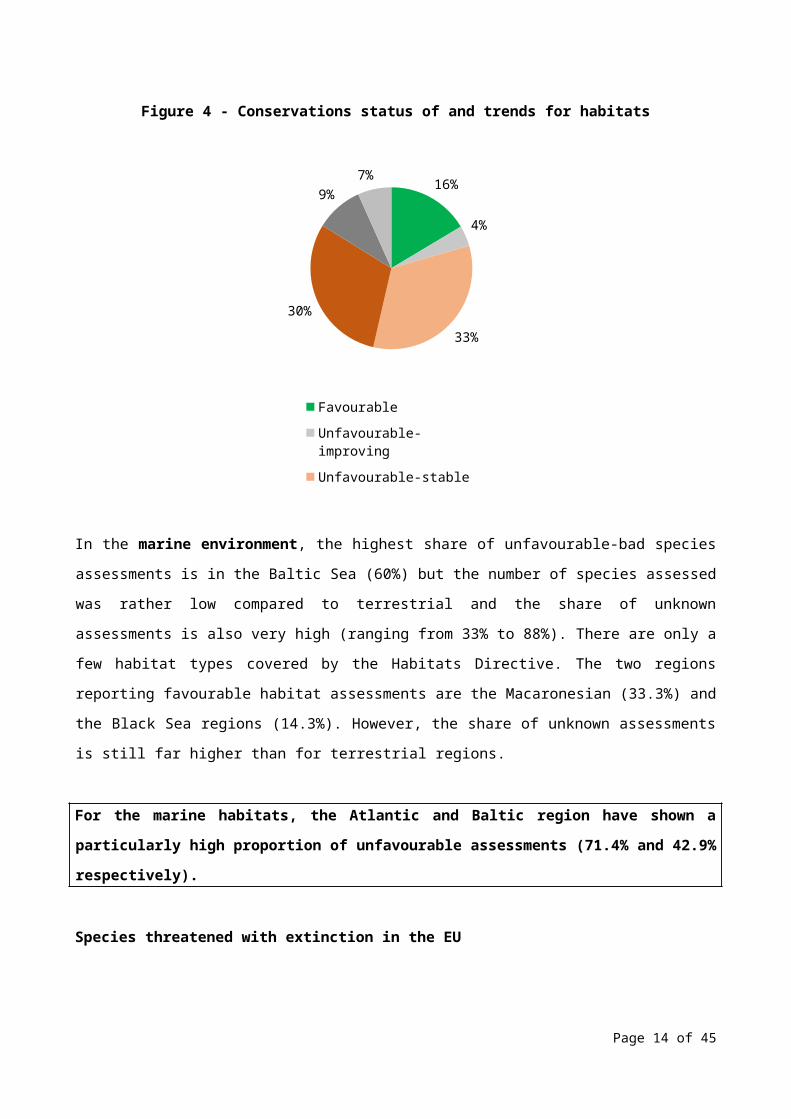
Results of the assessments of habitats' conservation status indicate that in total, 16% of the habitat
assessments are favourable and 4% are improving and 33% are unfavourable but stable. However, a further
30% are still deteriorating, which is a serious cause for concern. Only 7% of the assessments are unknown.
The proportion of assessments which are unfavourable and deteriorating is particularly high for bogs,
mires and fens, but also dune habitats and grassland, all associated with wetlands, coastal and
agricultural ecosystems.
Page 9 of 31
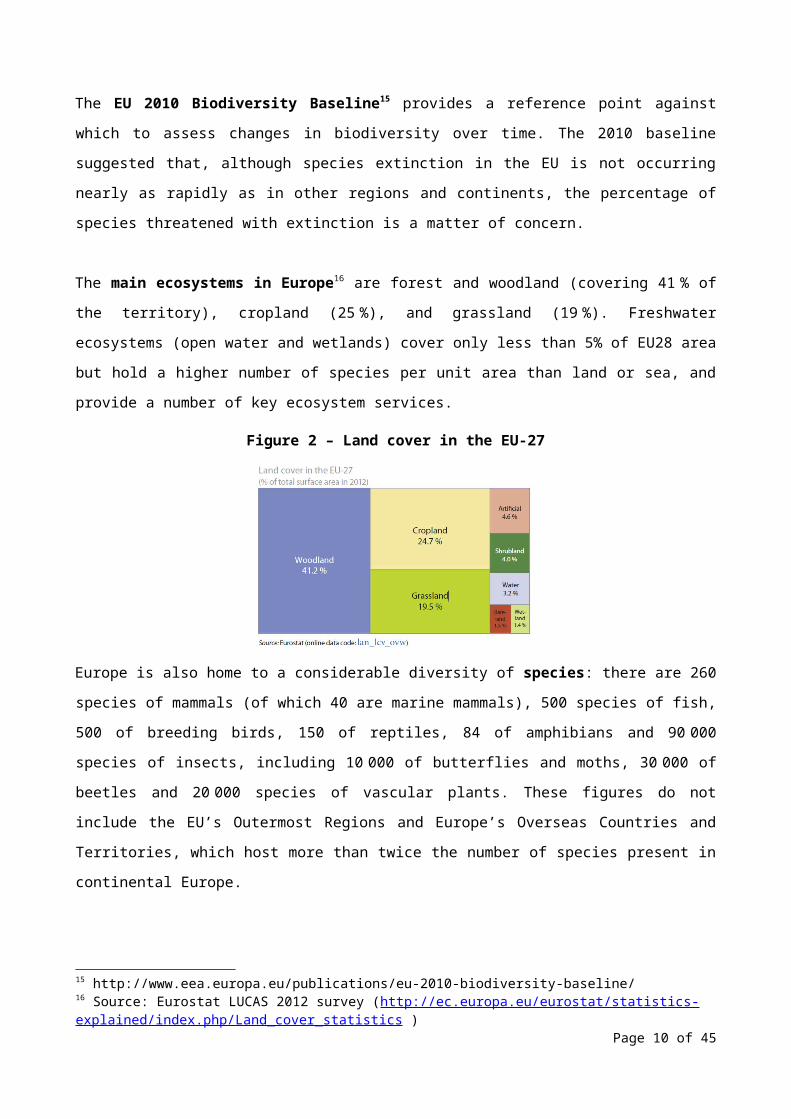
Figure 4 - Conservations status of and trends for habitats
16%
4%
33%
30%
9%7%
FavourableUnfavourable-improvingUnfavourable-stableUnfavourable-deterioratingUnfavourable-unknown trendUnknown
In the marine environment, the highest share of unfavourable-bad species assessments is in the Baltic Sea
(60%) but the number of species assessed was rather low compared to terrestrial and the share of unknown
assessments is also very high (ranging from 33% to 88%). There are only a few habitat types covered by the
Habitats Directive. The two regions reporting favourable habitat assessments are the Macaronesian (33.3%)
and the Black Sea regions (14.3%). However, the share of unknown assessments is still far higher than for
terrestrial regions.
For the marine habitats, the Atlantic and Baltic region have shown a particularly high proportion of
unfavourable assessments (71.4% and 42.9% respectively).
Species threatened with extinction in the EU
The overview of the latest results of the IUCN Red List assessments, show that freshwater species -
molluscs (55%) and freshwater fish (43%) - are the groups with the highest proportion of threatened
species, together with marine mammals (43%), followed by amphibians (22%), reptiles (21%) and birds
(18%).
Page 10 of 31

Figure 5 - Species facing the risk of extinction for the ten taxonomic groups which have had a complete
assessment at EU level between 2007 and 2015 (IUCN, 2015)
Medicinal plants*
Aquatic plants*
Crop wild relatives*
Saproxylic beetles*
Terrestrial molluscs*
10 Butterflies
09 Bees
08 Terrestrial mammals
07 Dragonflies
06 Birds
05 Reptiles
04 Amphibians
03 Freshwater fishes
02 Marine mammals
01 Freshwater molluscs
0% 10% 20% 30% 40% 50% 60% 70% 80% 90% 100%
2.5%
5.4%
14.4%
18.2%
23.1%
7.2%
9.1%
18.2%
16.8%
18.2%
21.4%
22.0%
42.8%
42.8%
54.5%
5.0%
8.6%
11%
13.8%
13.7%
11.0%
5.4%
11.0%
13.4%
5.8%
12.5%
18.3%
4%
4.0%
8.4%
5.8%
10.8%
1%
23.1%
10.5%
1.0%
55.6%
5.0%
2.2%
1.6%
1.2%
44%
44.0%
24.3%
Threatened
Near Threatened
Data Deficient
Percentage of species
* Only a selection of species was as-sessed
Box 1: Threatened marine fishes
The European Red List of Threatened Species published by IUCN on 3 June 2015 shows that 7.5% of all
European marine fish species are threatened with extinction in European waters. While some fishes are
recovering, marine management has been less successful for many other commercial species. 40.4% of
European sharks, rays and chimaeras face an elevated risk of extinction. The population trend for 68.4% of
the species is unknown, while 8.4% of the populations are declining, 21.5% are considered stable and 1.7%
are increasing. The report, financed by the European Commission, is the first ever complete assessment of
marine fishes native to Europe, assessing all of the 1,220 species present in the Mediterranean Sea, Black
Sea, Baltic Sea, North Sea, and the Northeast Atlantic Ocean, including many highly exploited species that
support large commercial, recreational, and artisanal fisheries. Most of these species are not covered by the
nature legislation. The highest number of threatened species can be found in the Mediterranean Sea, the
western coast of the Iberian Peninsula and the Macaronesian islands. The report identified overfishing as the
main threat to marine fishes in Europe, both in targeted fisheries and as by-catch. Other major threats include
coastal development, energy production and mining, pollution and climate change.
Page 11 of 31

Trends in common species in the EU
Since 1990, common bird populations have decreased by around 11%; more recently and as compared to the
EU 2010 Biodiversity Baseline, populations have been stabilised. However, the decline of common farmland
birds, which was more pronounced at nearly 30% since 1990, is not reversed yet and populations are still
declining as compared to the EU 2010 Biodiversity Baseline.
Figure 6 - Common bird indices, EU, 1990-2012 (*)
(index 1990 = 100)
1990
1991
1992
1993
1994
1995
1996
1997
1998
1999
2000
2001
2002
2003
2004
2005
2006
2007
2008
2009
2010
2011
2012
70
80
90
100
110
Common bird index — all common speciesCommon bird index — common forest speciesCommon bird index — common farmland species
(*) Estimates. EU: aggregate changing according to the context. All common species covers information on 163 differ-
ent bird species. Common farmland species covers 39 bird species. Common forest species covers 33 bird species.
Source: EBCC / RSPB / BirdLife / Statistics Netherlands; Eurostat (online data code: env_bio3)
Status and trends of ecosystem and their services in the EU
The long-term well-being of Europe’s economies and societies is underpinned by its natural capital. Its
genetic resources, species and ecosystems provide essential goods and services. These include fertile soils,
multi-functional forests and productive seas, fresh water and air, biomass for multiple uses and ecosystem-
based climate mitigation and adaptation. Unfortunately, many of Europe’s ecosystems are now being
degraded and their ability to deliver these valuable services is being reduced. One issue alone — insect
pollination, which is being heavily degraded in Europe — has an estimated economic value of EUR 15 billion
a year in the EU18. This presents an important problem that differs from the case of economic and human
capital. The value of natural capital to our economies and societies, and the interdependencies of nature with
other societal objectives, is often not reflected in private and public decisions, indicators, or accounting
systems and economic signals in our market economies.
18 Gallai et al, 2009Page 12 of 31

Figure 7 - Trends in pressures on ecosystems
Ecosystem type Habitat changes Climate change Exploitation Invasive speciesPollution and
nutrient enrichment
Urban
Cropland
Grassland
Woodland and forest
Heathland, shrub and sparsely vegetated land
Wetlands
Freshwater (rivers and lakes)
Marine (transitional and marine waters, combined)*
Source: adapted from ETC/SIA, 2014
Key: Projected future trends in pressure
Decreasing Continuing Increasing Very rapid
increaseObserved impact on biodiversity to date
Low Moderate High Very high
For the periods 1950-2010, the majority of ecosystem services show either a degraded or mixed (i.e.
degraded in some regions, enhanced in other) status across Europe. However, there are some positive
exceptions such as timber production and climate regulation in forests (Source: EU2010 Baseline, EEA). A
recent analysis confirms increasing trends between 2000 and 2010 for some provisioning services but
decreasing of services directly related to biodiversity. Between 2000 and 2010, increasing extent of forests
resulted in positive influences on erosion control, carbon storage, water retention, air quality regulation and
recreation. But, pollination is the most degraded for Woodland and forest, Heathland and shrub, and
grasslands. (Source: Maes et al, 2015).
Main pressures on and drivers of change to biodiversity (direct and indirect)
Habitat fragmentation, degradation and destruction due to land-use change, climate change and use of the
seas are some of the main pressures and drivers causing biodiversity loss. Natural grasslands are still being
turned into arable land and built-up areas; extensive agricultural land is being converted into forms of more
intensive agriculture and, mainly as a result of abandonment, into forest. These are a major concern. They are
leading to the loss of farming practices that support biodiversity and 70 % of EU species (dragonflies,
butterflies, mammals, amphibians, reptiles) are threatened by the loss of their habitat. Fragmentation due to
urban sprawl and infrastructure development — nearly 30 % of the EU land mass shows signs of moderately
Page 13 of 31
high to very high fragmentation — severely affects ecosystem connectivity and their health and ability to
provide services.
Some 30 % of species are threatened by overexploitation of forests, oceans, rivers, lakes and soils. Pollution
from pesticides and fertilisers, such as nitrates and phosphates, is threatening 26 % of species. Agricultural
nitrogen balance is generally declining but is still high in some countries, particularly in lowland Western
Europe. It is estimated that some 50-80 % of the total nitrogen load in freshwater originates from farming,
contributing to biodiversity loss in freshwater ecosystems and coastal waters.19 In particular, half of the
geographical range of natural and semi-natural habitats across the European Union was exposed to
atmospheric nitrogen deposits above the critical load in 2004.
Invasive alien species represent an increasing threat to biodiversity with about 12 000 alien species that have
been found in the environment of the EU, 10-15 % of them becoming invasive. Their number is steadily
rising, in particular in marine and estuarine systems.
Figure 8 - Cumulative number of marine non-indigenous species
Figure 8 shows the cumulative number of marine Non-Indigenous Species (NIS). Analysis is made at Pan-
European level and shown per decade. The most recent period covers 2011 to 2014.
19 European Environment Agency. European waters — assessment of status and pressures. EEA Report No 8/2012. http://www.eea.europa.eu/publications/european-waters-assessment-2012.
Page 14 of 31

Climate change represents another increasing threat to biodiversity; for instance negative impacts have been
recorded already for a majority of widespread bird species20.
Global biodiversity loss is still a big concern. Europe is committed to reduce indirect drivers of biodiversity
loss. The ecological footprint for the EU-28 countries increased rapidly during the 1960s and 70s, and has
remained relatively constant since the 1980s. The region’s total biocapacity, however, has changed very little
since 1961. The EU-28 region’s footprint in 2010 was over twice the size of its biocapacity as it was in 2000
(Source: SEBI02621, EEA). Given that this ratio has hardly changed since the mid-seventies, it is very
unlikely that any improvement will be made by 2020.
Globally, multiple anthropogenic pressures on coral reefs and other vulnerable ecosystems (seagrass habitats,
mangroves or mountains) impacted by climate change or ocean acidification are still increasing (cf. 4th
Global Biodiversity Outlook, 2014 https://www.cbd.int/gbo4/).
Figure 9 – Target elements (by 2020)
Target 1 – Fully Implement the Birds and Habitats Directives
To halt the deterioration in the status of all species and habitats covered by EU nature legislation and
achieve a significant and measurable improvement in their status so that, by 2020, compared to
current assessments: (i) 100% more habitat assessments and 50% more species assessments under the
Habitats Directive show an improved conservation status; and (ii) 50% more species assessments
under the Birds Directive show a secure or improved status.
Socio-economic benefits of reaching this target: Socio-economic benefits of reaching this target: the
EU Natura 2000 network delivers economic benefits of the range of 200-300 billion EUR per year through
the provision of ecosystem services such as carbon storage, flood mitigation, water purification, pollination
and fish protection22. A range of local socio-economic activities and almost 4.5 million jobs depend on the
20 Gregory R.D., Willis S.G., Jiguet F., Voříšek P., Klvaňová A., van Strien, A., Huntley, B., Collingham, Y.C., Couvet, D., Green, R.E. (2009) An Indicator of the Impact of Climatic Change on European Bird Populations. PLoS ONE 4(3): e4678 (DOI:10.1371/journal.pone.0004678). http://journals.plos.org/plosone/article?id=10.1371/journal.pone.000467821 http://www.eea.europa.eu/data-and-maps/indicators/ecological-footprint-of-european-countries/ecological-footprint-of-european-countries-222 ten Brink P., Badura T., Bassi S., Daly, E., Dickie, I., Ding H., Gantioler S., Gerdes, H., Hart, K., Kettunen M., Lago, M., Lang, S., Markandya A., Mazza, L., Nunes P.A.L.D., Pieterse, M., Rayment M., Tinch R., (2011). Estimating the Overall Economic Value of the Benefits provided by the Natura 2000 Network. Final Synthesis Report to the European Commission, DG Environment on Contract ENV.B.2/SER/2008/0038. Institute for European Environmental Policy / GHK / Ecologic, Brussels 2011
Page 15 of 31

ecosystems that Natura 2000 protects. These benefits outweigh significantly the costs of managing and
protecting Natura 2000, which are estimated at around €5.8 billion/year23 - a tiny fraction of the network's
worth to society. For example, the full implementation of Natura 2000 in Spain is expected to result in a
GDP increase between 0.1 - 0.26%, and to generate over 12,000 new jobs24.
The Birds and Habitats Directives do not contain specific deadlines for achieving favourable or good
conservation status. However, Target 1 of the Strategy sets measurable goals to be achieved by 2020. These
goals were based on an ambitious but achievable scenario that assumed full implementation by Member
States of measures under the directives to improve conservation status, supported by common actions at EU
level. Using the 2009 report drawn up under the Habitats Directive and the 'Birds in the EU' status
assessment of 200425 as benchmarks, the assessment of progress under Target 126 is drawn mainly from the
Report on the State of Nature in the EU27, which was adopted by the Commission on 20 May 2015 and
provides the most comprehensive assessment to date.
Since the last reporting period, the number of assessments of species and habitats carried out under both the
Habitats and Birds directives which show a secure or improved conservation status has slightly increased.
The findings also show that the majority of birds have a secure status, and some species and habitats are
doing better (see Error: Reference source not found).
The Habitats Directive protects over 1200 rare, threatened or endemic species of wild animals (except
birds) and plants – often collectively referred to as 'species of European importance'. The directive also
protects some 230 natural and semi-natural habitat types. The Bird Directive covers all bird species that are
naturally present in the EU. In total this amounts to around 450 species, ranging from familiar garden birds
to much rarer migratory species that spend an important part of their annual cycle in the EU.
http://www.ieep.eu/assets/955/Economic_Benefits_of_Natura_2000_Network_Synthesis_report.pdf23 Gantioler et al., 2010.24 Fernandez et al., 200825 BirdLife International (2004). Birds in the European Union: a status assessment. Wageningen, The Netherlands.26 To quantitatively measure this target a methodology was developed by the Expert Group on Reporting under the Nature Directives and further validated by the Group of experts on the Birds and the Habitats Directive. It is based on a changes matrix which displays the different possible combinations of changes in EU conservation status assessments (for Art. 17) between the two reporting periods (i.e. 2001-06 and 2007-12) or changes in bird population status (for Art 12) since 2004 when ‘Birds in the European Union’ (BirdLife 2004) was published.27 See http://eur-lex.europa.eu/legal-content/EN/TXT/?uri=COM:2015:219:FIN
Page 16 of 31

Figure 10 - Progress towards Target 1: % of secure/favourable or improving assessments for birds (Birds Directive) and for habitats and species (Habitats Directive)
Source: EEA 2015
In 2007-12 the percentage of species assessments either in favourable (23%) or improved (4%) status was of
27 % while the 2020 target is 34.5%. However, 22% are still deteriorating and 14% are without a known
trend.
Box 2: Species recovery - some success stories
Largely thanks to conservation measures undertaken with the support of EU LIFE projects, some species are
showing signs of improvement. The Large Copper butterfly, Lycaena dispar, is improving across the
Continental region thanks to targeted conservation measures. The European Bison, Bison bonasus, in the
Alpine region, the Grey Seal, Halichoerus grypus, in the marine Baltic region and the Mediterranean
Horseshoebat, Rhinolophus Euryale, in the Mediterranean region are also improving. Several species of birds
of prey, including the Carpathian Basin populations of the Eastern Imperial Eagle Aquila heliaca, have
increased as a result of measures, such as protection of nesting sites and habitat management.
The assessments of habitat types show that 16.4% of assessments are favourable and 4.4% have improved,
while 30% are still deteriorating since 2006. This means that about 20 % reached the target condition, while
the 2020 target is 34%. On the whole, habitat types show a worse conservation status and trend than species.
It is widely recognised that restoration of habitats can often take a long time from the implementation of
measures to the achievement of tangible improvement in biodiversity.
Page 17 of 31

Box 3: Threatened habitats – grassland, wetland and dunes
Grassland, wetlands and dune habitats are of particular concern; the proportion of assessments which are
unfavourable and deteriorating is particularly high for bogs, mires and fens, all associated with wetlands,
coastal and agricultural ecosystems. The main threats to habitats identified are certain agricultural practices
(including modification of cultivation practices, over-grazing, abandonment of pastoral systems, fertilisation
and pesticides), and human-induced modifications of natural conditions, mostly related to hydrological
changes.
For birds, the proportion of bird species assessments with a ‘secure’ status remains the same as in 2004
(52%) and 8.5% are non-secure but improving. Therefore, approximately 61 % of species are in the target
condition. This means that a further 17 % of species need to become secure or improving by 2020 to reach
the birds’ component of Target 1 (i.e. 78 %).
Box 4: Farmland and woodland birds
Some bird species appear to be benefiting from targeted conservation measures aimed at adapting land-use
practices, especially in Natura 2000 sites. For instance, agri-environmental and land management
programmes successfully implemented in Spain, Portugal, Austria, Hungary and Germany have helped the
recovery of the Great Bustard Otis tarda, a species dependent on open landscapes (grassland, steppes and
undisturbed cultivated areas), which is declining elsewhere in Europe. Despite suffering a marked population
decline in some EU countries, the White-backed Woodpecker Dendrocopos leucotos, which is heavily
dependent on old and dead deciduous trees, has increased in Finland, where it has benefited from changing
forest management practices in Natura 2000 sites. However, among the 17% of the bird species, which are
still threatened and the 15% which are near threatened, declining, or depleted, are many common farmland
species like the Skylark, Alauda arvensis and the Black Tailed Godwit, Limosa limosa.
In conclusion, the overall trend for habitats and species is that those that are already favourable/secure
remain stable or are improving further. A small proportion of unfavourable/non-secure assessments is
improving, and a larger proportion of those previously determined as unfavourable continues to deteriorate.
Box 5: Marine habitats and species – knowledge is growing, but still many gaps
Due to the complexity of working in the marine environment and the relative lack of data as compared to ter-
restrial species and habitats, conservation status and trends vary considerably and assessment results are less
conclusive. The main pressures are the impact of fisheries by-catch and marine pollution. Measures aimed at
better and more sensitive management of sites and prohibiting damaging activities are being developed and
can translate into rapid improvements. In Ireland for example, the recent positive trend in conservation status
Page 18 of 31

of the alga Maerl Lithothamnium coralloides is linked to the protection regime of the Habitats Directive.
Some threatened seabirds have also benefited from conservation measures in the Natura network: The
Roseate Tern Sterna dougalli population has significantly increased in the EU thanks to the protection and
management of breeding sites, including the control of predators.
PROGRESS IN IMPLEMENTING ACTIONS
1a) Member States and the Commission will ensure that the phase to establish Natura 2000, including in the
marine environment, is largely complete by 2012.
Within the legal framework provided by the Birds and Habitats Directives,28 the EU has built up a vast
network of more than 27 000 protected areas throughout its Member States, encompassing nine
biogeographical regions and five marine regions. Known as Natura 2000, the network covers an area of
1.292.000 km2, which is 18% of the EU’s land area and equivalent to the combined area of France, Germany
and Italy. As concerns the designation of Natura 2000 sites in Europe, the establishment of Natura 2000 on
land is largely complete and since 2011the marine surface area covered by Natura 2000 has increased by
50%, covering more than 4% of European seas.29
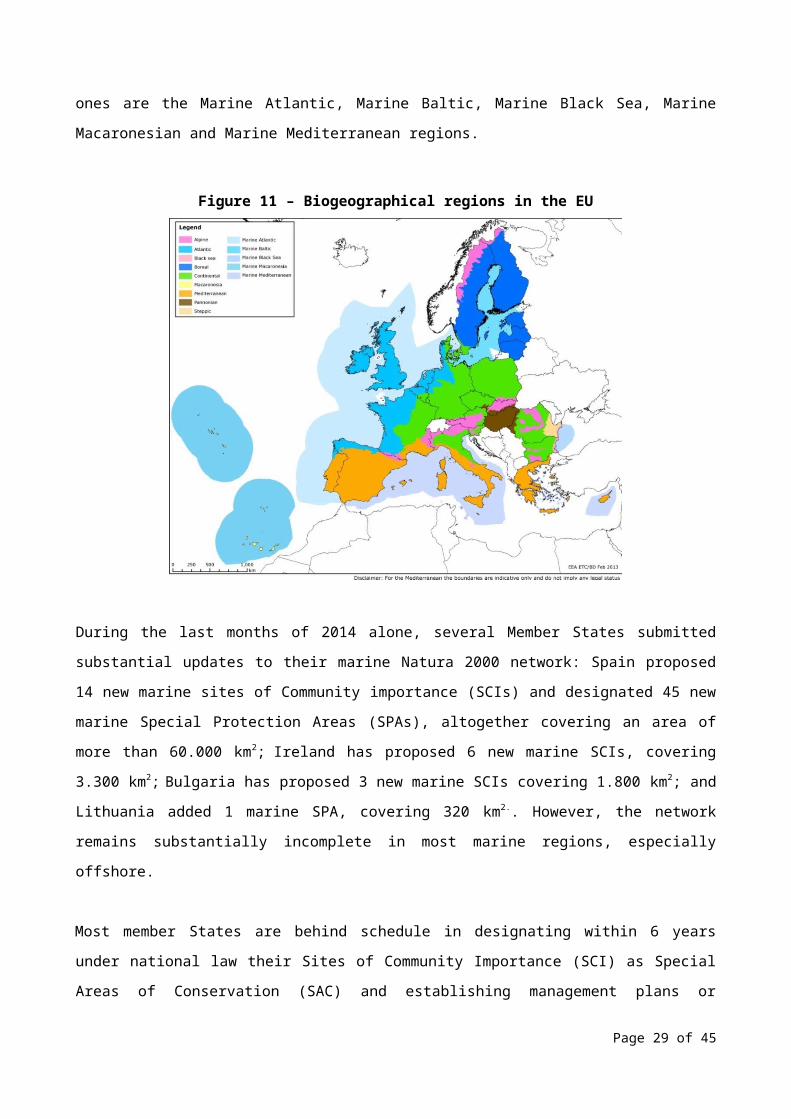
EU Biogeographical regions
To support the implementation of the Habitats Directive, the European Union is divided into nine terrestrial
and five marine biogeographic regions sharing similar ecological conditions. The nine terrestrial regions are
the Alpine, Atlantic, Black Sea, Boreal, Continental, Macaronesian, Mediterranean, Pannonian, Steppic
regions; the five marine ones are the Marine Atlantic, Marine Baltic, Marine Black Sea, Marine
Macaronesian and Marine Mediterranean regions.
28 http://ec.europa.eu/environment/nature/legislation/index_en.htm . 29 See http://www.eea.europa.eu/publications/protected-areas-in-europe-2012, page 112, Table 7.1.
Page 19 of 31
Figure 11 – Biogeographical regions in the EU
During the last months of 2014 alone, several Member States submitted substantial updates to their marine
Natura 2000 network: Spain proposed 14 new marine sites of Community importance (SCIs) and designated
45 new marine Special Protection Areas (SPAs), altogether covering an area of more than 60.000 km 2;
Ireland has proposed 6 new marine SCIs, covering 3.300 km2; Bulgaria has proposed 3 new marine SCIs
covering 1.800 km2; and Lithuania added 1 marine SPA, covering 320 km2.. However, the network remains
substantially incomplete in most marine regions, especially offshore.
Most member States are behind schedule in designating within 6 years under national law their Sites of
Community Importance (SCI) as Special Areas of Conservation (SAC) and establishing management plans
or equivalent instruments with clear conservation and restoration objectives and measures (see also action
1c). This step is crucial in order to put in place all necessary measures and ensure full legal protection.
Important delays and gaps occurred in many Member States and several had not designated any SACs by the
end of 201230. An overview of the state of play for Natura 2000 site designations under the Birds31 and
Habitats32 Directives, in terms of area and number of sites, is provided in the barometer, which provides a
breakdown by Member State and differentiates between terrestrial and marine sites. Updated information
30 EEA Technical report on State of Nature in the EU, May 2015 http://www.eea.europa.eu/publications/state-of-nature-in-the-eu 31 Directive 2009/147/EC of the European Parliament and of the Council of 30 November 2009on the conservation of wild birds (codified version replacing Directive 79/409/EEC), OJ L 20, 26.1.2010.32 Council Directive 92/43/EEC of 21 May 1992 on the conservation of natural habitats and of wild fauna and flora. OJ L 206, 22.7.1992.
Page 20 of 31

about remaining insufficiencies for each Member State, as regards sites to be proposed under the Habitats
Directive, can be found online33.
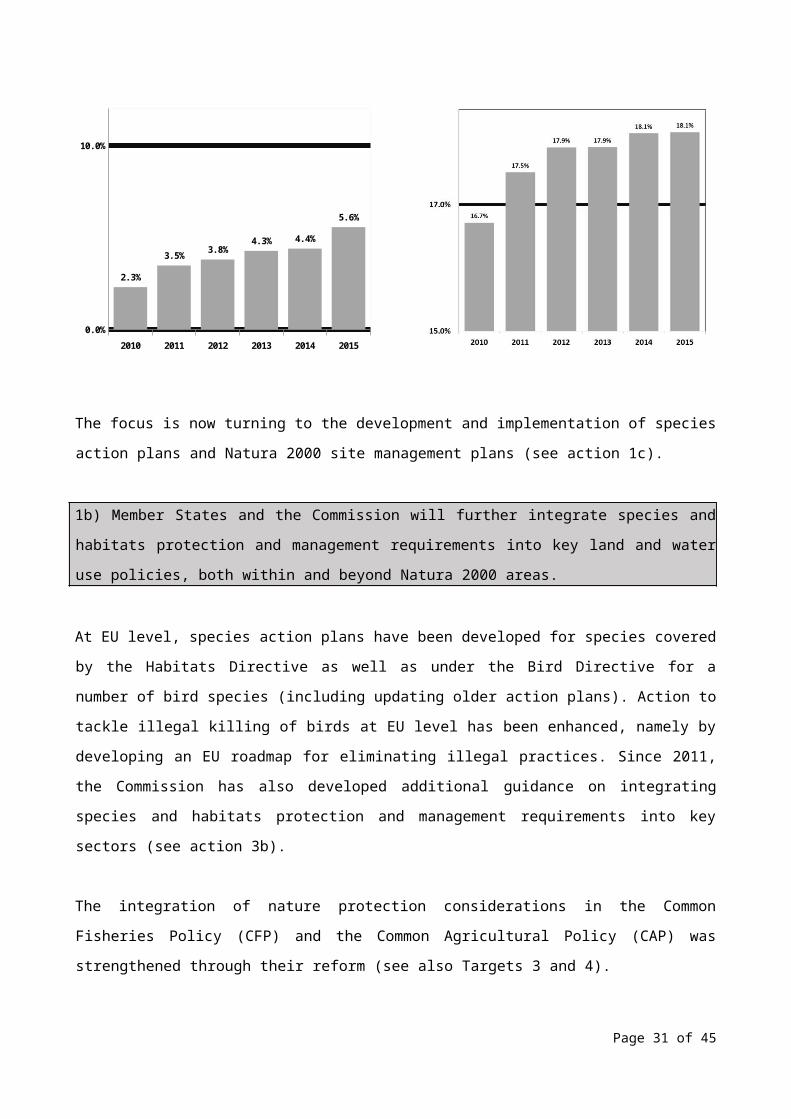
Figure 12 - Progress in designation of Natura 2000 sites (terrestrial and marine) since 2010 and compared to global Aichi Target 11 of at least 17% of terrestrial (and inland water) areas and 10% of marine areas (and coastal) are conserved by 2020 (EC, May 2015)
Marine (and coastal) Natura 2000 sites Terrestrial (and freshwater) Natura 2000 sites
2010 2011 2012 2013 2014 20150.0%
10.0%
2.3%
3.5%3.8%
4.3% 4.4%
5.6%
The focus is now turning to the development and implementation of species action plans and Natura 2000
site management plans (see action 1c).
1b) Member States and the Commission will further integrate species and habitats protection and
management requirements into key land and water use policies, both within and beyond Natura 2000 areas.
At EU level, species action plans have been developed for species covered by the Habitats Directive as well
as under the Bird Directive for a number of bird species (including updating older action plans). Action to
tackle illegal killing of birds at EU level has been enhanced, namely by developing an EU roadmap for
eliminating illegal practices. Since 2011, the Commission has also developed additional guidance on
integrating species and habitats protection and management requirements into key sectors (see action 3b).
The integration of nature protection considerations in the Common Fisheries Policy (CFP) and the Common
Agricultural Policy (CAP) was strengthened through their reform (see also Targets 3 and 4).
33 http://ec.europa.eu/environment/nature/natura2000/barometer/index_en.htm Page 21 of 31

Figure 13 - Illustrating the proportion (%) of SCIs that have been designated as SACs, by Member
State34
1c) Member States will ensure that management plans or equivalent instruments which set out conservation
and restoration measures are developed and implemented in a timely manner for all Natura 2000 sites.
Management plans
Although not obligatory under the nature directives, management plans are strongly recommended by the
European Commission, and are even obligatory under national legislation in some countries (e.g. Denmark,
France, Netherlands and a number of German Länder). In 2012, the total number of sites with plans under
the Habitats Directive for the EU-27 was 9271, with an additional 4229 plans under preparation. For birds,
about 30% of Special Protection Areas have management plans with a further 25% in preparation. Overall, in
2012 across the entire Natura 2000 network, 58% of sites either had management plans or such plans were
being developed. At Member State level the situation is diverse ranging from Slovenia with 100% of sites
under comprehensive management plans to others that have no plans at all35.
Conservation and restoration measures
34 EEA Technical report on State of Nature in the EU, May 2015 http://www.eea.europa.eu/publications/state-of-nature-in-the-eu 35 EEA Technical report on State of Nature in the EU, May 2015 http://www.eea.europa.eu/publications/state-of-nature-in-the-eu
Page 22 of 31
As the responsibility for managing Natura 2000 sites lies with the countries and regions concerned, Member
States are required to draw up the necessary conservation measures designed for each site, including
restoration measures. Member States were asked to report on conservation measures implemented for each
species and habitat type. Measures related to ‘Spatial planning’ (such as establish protected areas, legal
protection of habitats and species), dominate the reported conservation measures. Further significant
categories include measures related to wetland, freshwater and coastal habitats (e.g. "Restoring/improving
the hydrological regime"), agriculture (e.g. "maintaining grasslands and other open habitats") as well as
forests and wooded habitats.
Member States were also asked in their reporting to evaluate the impact of the conservation measures.
Results suggest that conservation measures, which in some sites have only started recently, might achieve
their goals only in the middle to long term.
Figure 14 - Conservation measures taken for habitats and species reported by MS as highly
important36
Source: EEA
1d) The Commission, together with Member States, will establish by 2012 a process to promote the sharing
of experience, good practice and cross-border collaboration on the management of Natura 2000, within the
biogeographical frameworks set out in the Habitats Directive.
Major progress has been made in establishing the Natura 2000 Biogeographical Process in 2011, which aims
at improving and strengthening the implementation of Natura 2000 through enhanced cooperation and
networking on practical habitat management and restoration. Seminars have been organised from 2012
36 EEA Technical report on State of Nature in the EU, May 2015 http://www.eea.europa.eu/publications/state-of-nature-in-the-eu
Page 23 of 31
onwards in the Boreal, Atlantic, Alpine and Mediterranean regions, as well as the organisation of a Marine
seminar in 2015. Future development includes the launch of the process in the Continental, Pannonian, Black
Sea, Steppic and Macaronesian regions, and follow-up activities in the Boreal, Atlantic, Alpine and
Mediterranean regions in 2015, as well as working on establishing biogeographical level conservation and
restoration objectives as well as on favourable reference values. Detailed information on all events is
available on the Natura 2000 Communication Platform:
http://ec.europa.eu/environment/nature/natura2000/platform/index_en.htm.
2) The Commission and Member States will provide the necessary funds and incentives for Natura 2000,
including through EU funding instruments, under the next multiannual financial framework. The
Commission will set out its views in 2011 on how Natura 2000 will be financed under the next multi-annual
financial framework.
In response to this commitment the Commission issued a staff working paper in December 2011 "Financing
Natura 2000: Delivering benefits for nature and people"37 which presented an evaluation of the effectiveness
of the so called "integration approach"38 to EU co-financing of Natura 2000 as well as an early overview of
the opportunities for financing nature protection in the next multi-annual financial framework (MFF) 2014-
2020, such as Partnership Agreements and Operational Programmes. The paper provided as well an updated
estimate of Natura 2000 costs and underlined the benefits offered by the network. The document also
stressed the importance of developing prioritised action frameworks (PAFs) pursuant to Article 8 of the
Habitats Directive as tools for streamlined and comprehensive planning of investments necessary for
management of the network.
In 2012 the Commission developed a format and methodology for the PAFs and invited the Member States
to submit their PAFs in time to influence the process of adopting the programmes for EU funds. The large
majority of Member States submitted their PAFs in 2013 and early 2014. The PAFs have been instrumental
in ensuring the best possible integration of investment in nature in the programmes for relevant EU funds.
On the national level, the PAFs also contributed to integration of Natura 2000 into planning of other policies
(agriculture, forestry, fisheries, cohesion etc.) and to a wider discussion, with different stakeholders, on the
choice of priorities and measures as well as the means of their implementation and financing.
In order to help the Member States to better understand the opportunities for financing nature protection in
the next MFF the Commission published the "Guidance handbook on financing Natura 2000"39. The
handbook presents all relevant EU funds and their potential for financing nature and biodiversity together 37 SEC (2011) 1573 final.38 Integration approach is understood as a method of financing set out in the 2004 "Communication on financing Natura 2000" whereby financing of the network on the EU level is integrated into different sectoral EU funds as opposed to setting up a dedicated fund.39 http://ec.europa.eu/environment/nature/natura2000/financing/index_en.htm#guidancehandbook
Page 24 of 31

with examples of best practice in this area. In addition, the Commission together with the national authorities
organised financing seminars in 24 Member States. The seminars have been successful in identifying the
most important needs for financing nature protection and discussing ways of allocating resources to this
purpose.
As regards resource allocated to financing Natura 2000 in individual EU funding streams it has to be noted
that the majority of the EU funds operate according to a programming process with shared management of
funds between the EU and the Member States. This means that decisions on funding priorities are taken at
national and regional level in discussion with the European Commission. Then the Commission entrusts the
Member States with implementing programmes at national or regional levels following certain rules.. Only
the LIFE programme is directly managed by the Commission. From LIFE+ 2010-2013, co-financing for
nature and biodiversity has increased to about € 548 million.
With regard to funds managed under the shared management principle by the EU the Member States, as of
16 February 2015 266 cohesion policy (out of 387 operational programmes - OPs) have been adopted by the
Commission. As the programming process was ongoing at the time of drafting this report, it was not possible
to precisely indicate how much funding has been allocated to nature and biodiversity. However, the draft
OPs and those already adopted by the Commission indicate that the allocations for categories of expenditure
related to nature and biodiversity have increased.
As regards rural development programmes (RDPs) developed to implement the priorities of the European
Agricultural Fund for Rural Development (EAFRD) as of 13 February 2015 the Commission had approved
27 out of 118 RDPs. Restoring, preserving and enhancing ecosystems related to agriculture and forestry,
with a focus on biodiversity, including Natura 2000 areas is one of the priorities of the RDPs (priority no. 4).
Member States are also required to reserve a minimum of 30 % of the total contribution from the EAFRD to
each RDP for measures supporting investments related to the environment and climate. The most relevant
measures from the nature perspective are agri-environment payments and Natura 2000 payments. Payments
to areas facing natural constraints and investments in physical assets are also generally relevant for financing
nature protection. Due to the fact that not all RDPs have been adopted yet and bearing in mind that the
methodology for calculation of the contribution of individual measures to preserving biodiversity is still
being discussed between relevant Commission services it is not possible to provide specific figures on
allocations from the EAFRD to Natura 2000.
Programming of marine and fisheries OPs is not advanced enough to provide estimations on allocations at
this stage. However, the Regulation establishing the European Maritime and Fisheries Fund (EMFF)
stipulates that where appropriate the specific needs of Natura 2000 areas should be integrated into the EMFF
Page 25 of 31

OPs. According to the Regulation, dedicated support in accordance with PAFs is also envisaged for the
management, restoration and monitoring of coastal and marine Natura 2000 sites.
With regard to the Programme for the Environment and Climate Action LIFE, which is the only relevant
fund under the direct Commission management, the multiannual work programme for 2014-17 was agreed in
February 2014 and is now operational. The allocation for the priority area "Nature and Biodiversity" during
this period was agreed at approximately 611 million EUR (whereas the commitment for the whole period
2014-2020 is approximately 1.27 billion EUR). A new category of projects, i.e. "integrated projects" have
been included in the programme pursuant to the LIFE 2014-2020 Regulation. These projects will be carried
out on a larger geographical scale and will be aimed at implementation of plans and programmes. In the
priority area "Nature and Biodiversity", PAFs are considered as relevant plans to frame Integrated Projects to
be implemented.
3a) The Commission, together with Member States, will develop and launch a major communication
campaign on Natura 2000 by 2013.
A 2010 Eurobarometer survey showed that citizens' awareness of the threats and challenges for biodiversity
and Natura 2000 was not very high. According to the 2013 EU Flash Eurobarometer on Attitudes towards
biodiversity, more than two thirds (74 %) of EU citizens had heard of biodiversity but less than half knew the
meaning of the word. This, however, is still 10 % more than in 2007.40 This shows that while EU citizens are
gradually becoming more aware, greater communication efforts and activities focused on biodiversity are
needed. In 2015, a Eurobarometer on biodiversity will provide an overview of current public attitudes to
biodiversity.
40 http://ec.europa.eu/public_opinion/flash/fl_379_sum_en.pdf.Page 26 of 31

Figure 15- Familiarity with the term biodiversity41
Figure 16 - Awareness of the Natura 2000 Network
Source: EEA (2015) Public awareness (SEBI026) (http://www.eea.europa.eu/data-and-maps/indicators/public-
awareness/public-awareness-assessment-published-may-1)
41 http://www.eea.europa.eu/data-and-maps/indicators/public-awareness/public-awareness-assessment-published-may-1 Page 27 of 31

In order to enhance public awareness about biodiversity and Natura 2000, the European Commission has
launched a new award designed to celebrate and promote best practices for nature conservation in Europe.
The European Natura 2000 Award42 aims to bring the success of the Natura 2000 network to the public’s
attention and to demonstrate its importance for protecting biodiversity across Europe. The initiative rewards
excellence in the management and promotion of the network and its objectives. Natura 2000 works to assure
the long-term survival of Europe’s most valuable and threatened species and habitats, and is the centrepiece
of the EU’s nature and biodiversity policy. In its first year, 2014, the Natura 2000 Award attracted
considerable interest from Natura 2000 site managers and others working with the Natura 2000 network,
with 163 applications received from 26 Member States, distributed across the 5 Award categories
(conservation, communication, socio economic benefits, reconciling interests, networking and cross-border
cooperation). In 2015, an additional category, the “European Citizens’ Award” was added, for which the
public was able to vote directly online.
3b) The Commission and Member States will improve cooperation with key sectors and continue to develop
guidance documents to improve their understanding of the requirements of EU nature legislation and its
value in promoting economic development.
A series of guidance documents promoting integration of Natura 2000 in different sectors have been prepared
including Farming for Natura 2000, Aquaculture and Natura 2000, Inland waterway transport and Natura
2000, the implementation of the Birds and Habitats Directives in estuaries and coastal zones, Integrating
biodiversity and nature into port development, Wind energy developments and Natura 2000, Non-energy
mineral extraction and Natura 2000 and Climate change and Natura 200043 and on managing fisheries
impacts within Natura 2000 sites44. The Commission is also in the process of finalising sector-specific
guidance on forests, on energy transmission facilities and on hydropower, which are all expected to be
finalised during 2015. All these guidance documents were or are developed in cooperation with
representatives of the sectors concerned. An update of the Article 6 interpretation guidance is also being
prepared.
An EU Platform on Coexistence between People and Large Carnivores45 has been established in 2014 to
support a constructive dialogue between stakeholders and promote a peaceful coexistence of human activity
with large carnivores in Europe. As part of the EU Large Carnivore Initiative, a set of documents describing
key actions for four species of large carnivores in Europe, including at the population level, have been
finalised and published on the large carnivores' webpage of DG ENV46.
42 http://ec.europa.eu/environment/nature/natura2000/awards/index_en.htm 43 http://ec.europa.eu/environment/nature/natura2000/management/guidance_en.htm. 44http://ec.europa.eu/environment/nature/natura2000/marine/index_en.htm 45 http://ec.europa.eu/environment/nature/conservation/species/carnivores/coexistence_platform.htm46 http://ec.europa.eu/environment/nature/conservation/species/carnivores/pdf/key_actions_large_carnivores_2015.pdf
Page 28 of 31
A set of pilot actions on large carnivores has also been carried out and will be available on the large
carnivores' webpage of DG ENV47.
The Commission is also in the process of developing sector-specific guidance in the following policy areas:
non-energy extractive industries, wind farm development, ports and estuaries, inland waterway transport,
aquaculture. The overall objective of these guidance documents is to establish a better understanding of how
to apply the Article 6 procedure to developments plans and projects in each of these sectors and to provide
further advice on how to carry out an Appropriate Assessment in particular. A Guidance document
promoting integration of Natura 2000 in agriculture "Farming for Natura 2000" (2014) has been prepared
and another one on forests is currently being finalised.
3c) The Commission and Member States will facilitate enforcement of the nature directives by providing
specific training programmes on Natura 2000 for judges and public prosecutors, and by developing better
compliance promotion capacities
Specific training sessions for judges and prosecutors have been organised with EU support on key provisions
of the nature legislation.
Coordinated action at EU level has also been launched, in cooperation with the Council of Europe, to address
illegal trapping, killing and trade of birds, which also specifies actions on monitoring and data collection48.
Meanwhile, the Commission has continued to pursue cases of non-compliance with EU nature legislation,
including through infringement procedures, with a focus on systemic failures. These include the insufficient
designation of SCIs and SPAs (especially in the marine environment), the designation of SACs, as well as
the non-respect of provisions in the legislation regarding the species protection, the non-deterioration of
Natura 2000 sites and the permitting procedures for plans and projects which might negatively affect the
integrity of the sites.
4a) The Commission, together with Member States, will develop by 2012 a new EU bird reporting system,
further develop the reporting system under Article 17 of the Habitats Directive and improve the flow,
accessibility and relevance of Natura 2000 data
For the first time, reporting under Article 17 of the Habitats Directive and Article 12 of the Birds Directive
have been streamlined and aligned. Article 12 requires Member States to report about the progress made with
the implementation of the Birds Directive. In 2011, the Commission in agreement with Member States has
47http://ec.europa.eu/environment/nature/conservation/species/carnivores/promoting_dialogue.htm 48 http://ec.europa.eu/environment/nature/conservation/wildbirds/illegal_killing.htm
Page 29 of 31

revised the reporting procedure and frequency in order to focus the reporting obligations on data that inform
about the status and trend of bird populations4950.
After receipt of the national reports, the EEA and its Topic Centre on Biological Diversity produced national
summaries with overview statistics for each Member State, a web tool to view easily the assessments of
Member States as well as the EU-biogeographic assessments by species and habitats under Art.17. 51 , and a
paper setting out the method on how to assess progress towards Target 1 of the EU 2020 Biodiversity
Strategy. The final report on the State of Nature in the EU and related data are available on the web 52 for
further analysis.
4b) The Commission will create a dedicated ICT tool as part of the Biodiversity Information System for
Europe to improve the availability and use of data by 2012.
The Biodiversity Information System for Europe (BISE)53 is a single entry point for published data and
information supporting the implementation and monitoring of the EU 2020 Biodiversity Strategy. Bringing
together data on biodiversity and ecosystem services, it links to related policies, environmental data centres,
assessments and research findings from various sources. It is being developed to strengthen the knowledge
base and to support decision-making on biodiversity. BISE has integrated within its structure the European
Biodiversity Clearing House Mechanism in support of the Convention on Biological Diversity. BISE is a
partnership between the European Commission and the European Environment Agency. BISE also
contributes to the further development of monitoring of progress and streamlining of reporting at
international level. For instance, the European Environment Agency (EEA) has developed a target
crosslinking tool that allows countries to interconnect national, EU and global biodiversity targets and
indicators to facilitate reporting. This tool has been made available to its 28 Member States and 28 African
countries.
Within BISE, the Biodiversity data centre (BDC) 54 provides access to data and information on
species, habitat types and sites of interest in Europe and to related products for biodiversity
indicators and assessments. Priority is given to policy-relevant data and information for European
and national institutions, professionals, researchers and the public. This includes the data supporting
the assessments from Article 12 and Article 17 reporting under the nature directives, which is a unique
dataset in the world. Also with the assistance of the European Environment Agency, the European
Commission has developed a public Natura 2000 viewer which makes it possible to explore Natura
49 http://ec.europa.eu/environment/nature/knowledge/rep_birds/index_en.htm50 http://bd.eionet.europa.eu/activities/Reporting/Article_1251 http://art17.eionet.europa.eu/article17/reports2012/ and Art.12 tool http://bd.eionet.europa.eu/article12/ 52 http://www.eea.europa.eu/highlights/state-of-nature-in-the 53 http://biodiversity.europa.eu/ 54 http://www.eea.europa.eu/themes/biodiversity/dc
Page 30 of 31
2000 sites in every part of the EU at the press of a button. The public viewer is an interactive and
user-friendly tool that allows the user to travel seamlessly through the Natura 2000 sites over
different types of backgrounds (street maps, satellite imagery, bio-geographical regions, Corine
Land Cover, etc.) and to quickly locate sites and related information on species and habitats of
interest. The tool is intended to help raise awareness of Natura 2000 amongst the general public as
well as provide a useful instrument for developers, land use planners, landowners, government
authorities, NGOs, researchers and educationalists, amongst others.
Page 31 of 31