The “Compromise” of 1850. Indian Territory Louisiana Territory.

LEGISLATIVE ASSEMBLY OF THE NORTHERN TERRITORY
WRITTEN QUESTION 325
Mr Mills to Minister for Police, Fire and Emergency Services, in relation to the portfolio areas within the Northern Territory Police, Fire and Emergency Services.
Northern Territory Police, Fire and Emergency Services
HR Questions:
1. What is the NTG FTE Cap for your Agency.
The NTPFES FTE cap is 1,911 for 2011-12.
2. At Pay day 20, 28 March 2012, what is the current FTE staffing of the department, by level.
State Code State Description Total FTEF PFE Police Fire and Emergency Services 1910.31
Breakdown by level
Classification Classification Description TotalPolice
COPC COMMISSIONER OF POLICE 1.00DCOPC DEPUTY COMMISSIONER 1.14ACOPC ASSISTANT COMMISSIONER 3.43COMC COMMANDER 9.20SUPT SUPERINTENDENT 34.34SSGT SNR SERGEANT 63.83SGT SERGEANT 178.31RSGT REMOTE SERGEANT 38.43SC1C SNR CONSTABLE 1/C 111.88SCONT SNR CONSTABLE 248.27CON1C CONSTABLE 1/C 144.86PXAMR PRINCIPAL EXAMINER 10.73EXAMR EXAMINER 1.57CONST CONSTABLE 238.97CONTA CONSTABLE RECRUIT 23.00SACP SNR ACPO 27.33ACP1C ACPO 1/C 19.25ACPO ACPO 21.42ACPR ACPO RECRUIT 3.66SPAUX SNR POLICE AUXILIARY 62.21PAX1C POLICE AUXILIARY 1/C 15.29PAUX POLICE AUXILIARY 54.41PAUXR POLICE AUXILIARY RECRUIT 21.26 1333.79
Fire DOF DISTRICT OFFICER 8.57SSO SNR STATION OFFICER 15.47SO STATION OFFICER 26.70LFF LEADING FIREFIGHTER 33.03SFF SNR FIREFIGHTER 36.46FFA FIREFIGHTER A CLASS 20.97FFC FIREFIGHTER C CLASS 14.86

Classification Classification Description TotalFFD FIREFIGHTER D CLASS 10.14FFREC FIREFIGHTER RECRUIT 16.14FAC FIRE AUXILIARY 0.91FA2 FIRE AUXILIARY 1.15FA1 FIRE AUXILIARY 6.42
190.82
Public Servants EO4C EXECUTIVE CONTRACT OFFICER 4 1.00EO3C EXECUTIVE CONTRACT OFFICER 3 1.00EO2C EXECUTIVE CONTRACT OFFICER 2 2.57EO1C EXECUTIVE CONTRACT OFFICER 1 6.14SAO2 SNR ADMIN OFFICER 2 2.00SAO1 SNR ADMIN OFFICER 1 18.43AO7 ADMIN OFFICER 7 21.64AO6 ADMIN OFFICER 6 28.74AO5 ADMIN OFFICER 5 36.29AO4 ADMIN OFFICER 4 35.84AO3 ADMIN OFFICER 3 100.47AO2 ADMIN OFFICER 2 51.23AO1 ADMIN OFFICER 1 2.56AQF3A NTPS APPRENTICE 1.41GOVA1 NTPS APPRENTICE 1.00SP2 SNR PROFESSIONAL 2 1.85SP1 SNR PROFESSIONAL 1 3.71P3 PROFESSIONAL 3 10.17P2 PROFESSIONAL 2 3.47P1 PROFESSIONAL 1 4.04PH6R PHYSICAL 6 - RDO 1.00PH5 PHYSICAL 5 1.00PH3 PHYSICAL 3 4.14PH2 PHYSICAL 2 6.57CPIL CHIEF PILOT 1.00SPIL SNR PILOT 4.56T6 TECHNICAL 6 3.54T5 TECHNICAL 5 4.29T4 TECHNICAL 4 10.88T3 TECHNICAL 3 7.00T2 TECHNICAL 2 8.14 385.70
Total 1910.31
3. Is this figure in line with the NTG FTE Cap.
Yes, this figure is in line with the NTG FTE cap.
4. At Pay day 20, 28 March 2012, how many funded permanent positions are there in your department?
State Code State Description Permanent Positions
F PFE Police Fire and Emergency Services 1847

5. At Pay Day 20, 28 March 2012, how many of these positions were nominally filled and how many were filled by persons acting in positions or are temporary appointments?
- Please separate by permanent/temporary/acting by level
State Code State Description
Permanent Employees
Held in Nominal Positions
Permanent Employees
Acting in Temporary Positions
Temporary Employment
ContractsF PFE Police Fire and Emergency Services 1276 293 69
6. In the period 01 July 2011 to 31 March 2012, what was the turnover rate of staff in the Agency?
State Code State Description Turnover Rate (%)F PFE Police Fire and Emergency Services 12.23%
Footnote: Turnover includes cessations and transfers (temporary and permanent) of employees to other NTG Agencies.
7. What is the rate per level.
Classification Classification Description Turnover Rate (%)Police
COPC COMMISSIONER OF POLICE 0.00DCOPC DEPUTY COMMISSIONER 0.00ACOPC ASST COMMISSIONER 0.00COMC COMMANDER 29.88SUPT SUPERINTENDENT 8.76SSGT SNR SERGEANT 4.73SGT SERGEANT 2.74BRSGT BREVET SERGEANT 0.00SC1C SNR CONSTABLE 1/C 6.37SCONT SNR CONSTABLE 4.58CON1C CONSTABLE 1/C 6.40EXAMR POLICE EXAMINER 54.04CONST CONSTABLE 2.86CONTA CONSTABLE RECRUIT 9.58SACP SNR ACPO 10.58ACP1C ABORIGINAL COMMUNITY POLICE 1/C 0.00ACPO ABORIGINAL COMMUNITY POLICE 12.06ACPR ACPO RECRUIT 15.63SPAUX SNR POLICE AUXILIARY 10.10PAX1C POLICE AUXILIARY 1/C 13.01PAUX POLICE AUXILIARY 15.22
Fire DOF DISTRICT OFFICER 12.74SSO SNR STATION OFFICER 11.93SO STATION OFFICER 3.88LFF LEADING FIREFIGHTER 3.06SFF SNR FIREFIGHTER 0.00FFA FIREFIGHTER QUALIFIED 9.12FFB FIREFIGHTER B 0.00

Classification Classification Description Turnover Rate (%)FFC FIREFIGHTER C 22.86FFD FIREFIGHTER D 12.01FFREC FIREFIGHTER RECRUIT 0.00FAC FIRE AUXILIARY CAPTAIN 101.63FA2 FIRE AUXILIARY LEVEL 2 260.53FA1 FIRE AUXILIARY LEVEL 1 114.30
Public Servants EO4C EXECUTIVE CONTRACT OFFICER 4 0.00EO3C EXECUTIVE CONTRACT OFFICER 3 0.00EO2C EXECUTIVE CONTRACT OFFICER 2 51.28EO1C EXECUTIVE CONTRACT OFFICER 1 28.99SAO2 SNR ADMIN OFFICER 2 35.71SAO1 SNR ADMIN OFFICER 1 0.00AO7 ADMIN OFFICER 7 30.58AO6 ADMIN OFFICER 6 26.91AO5 ADMIN OFFICER 5 29.28AO4 ADMIN OFFICER 4 45.11AO3 ADMIN OFFICER 3 37.01AO2 ADMIN OFFICER 2 59.82AO1 ADMIN OFFICER 1 93.68AQF3A NTPS APPRENTICESHIP 79.83SPIL SNR PILOT 20.64GOVA1 AUTOMOTIVE APPRENTICE (MHRT) 0.00SBA SCHOOL BASED APPRENTICE 493.83SP2 SNR PROFESSIONAL OFFICER 2 0.00SP1 SNR PROFESSIONAL OFFICER 1 65.47P3 PROFESSIONAL 3 25.32P2 PROFESSIONAL 2 27.87P1 PROFESSIONAL 1 87.72PH6R PHYSICAL 6 - RDO 0.00PH5 PHYSICAL 5 0.00PH3 PHYSICAL 3 21.54PH2 PHYSICAL 2 15.96T6 TECHNICAL 6 0.00T5 TECHNICAL 5 0.00T4 TECHNICAL 4 0.00T3 TECHNICAL 3 29.85T2 TECHNICAL 2 11.61T1 TECHNICAL 1 0.00
Footnote: Turnover includes cessations and transfers (temporary and permanent) of employees to other NTG Agencies.
8. At Pay day 20, 28 March 2012, how many funded positions are vacant in the Agency.
State Code State Description Vacant PositionsF PFE Police Fire and Emergency Services 110
Footnote: A position is counted as ‘vacant’ where no employee is held nominally or actually against the position. Vacant positions do not count absent employees.

9. How long, in total days, have funded positions been vacant since 01 July 2011.
Due to the nature of our business and the need to deploy staff as situations arise, the measure of the total number of days for Police and Fire is not a meaningful figure.
Public Servant Vacant Days
Classification Classification DescriptionTotal Days
VacantAO5 ADMIN OFFICER 5 87AO5 ADMIN OFFICER 5 55AO3 ADMIN OFFICER 3 9AO3 ADMIN OFFICER 3 30AO3 ADMIN OFFICER 3 58AO3 ADMIN OFFICER 3 13AO3 ADMIN OFFICER 3 13AO2 ADMIN OFFICER 2 56SP1 SENIOR PROFESSIONAL 1 13P3 PROFESSIONAL 3 271P3 PROFESSIONAL 3 9P2 PROFESSIONAL 2 179P2 PROFESSIONAL 2 16P2 PROFESSIONAL 2 88P1 PROFESSIONAL 1 23P1 PROFESSIONAL 1 166SPIL SENIOR PILOT 43T3 TECHNICAL 3 135T3 TECHNICAL 3 27T2 TECHNICAL 2 118
10. At Pay day 20, 28 March 2012, how many staff are currently employed on a temporary contract.
State Code State Description Temporary ContractsF PFE Police Fire and Emergency Services 142
Footnote: Temporary employees include employees on temporary employment contracts, casuals, honorary (board members), executive contracts, apprentices and graduates.
The numbers represent ‘Head Count’ for both operative and inoperative employees but exclude previous employees being paid workers compensation payments. Employees not employed full time are counted as “1”.

11. In the period 01 July 2011 to 31 March 2012, how many temporary contracts have been extended, broken down by level and the number of times extended.
Classification Classification DescriptionExt. x1
Ext. x2
Ext. x3
Ext. x4
Ext. x5 Total
EO1 EXECUTIVE OFFICER 1 1 1SAO2 SNR ADMIN OFFICER 2 1 1SAO1 SNR ADMIN OFFICER 1 1 2 3AO7 ADMIN OFFICER 7 5 1 6AO6 ADMIN OFFICER 6 3 3AO5 ADMIN OFFICER 5 6 3 9AO4 ADMIN OFFICER 4 7 2 2 2 13AO3 ADMIN OFFICER 3 23 12 9 44AO2 ADMIN OFFICER 2 25 13 2 40AO1 ADMIN OFFICER 1 1 1 2P1 PROFESSIONAL 1 1 1P3 PROFESSIONAL 3 1 1 2PH2 PHYSICAL 2 1 1SPIL SNR PILOT 1 1T6 TECHNICAL 6 1 1T3 TECHNICAL 3 1 1T2 TECHNICAL 2 2 2 4T1 TECHNICAL 1 1 1
Total 80 38 14 2 134
Footnote: Data source is RMS (Recruitment Management System)
Where provided in the data employees are identified by AGS number. Where the AGS number is not available, name matching has been used. Where AGS or name matching does not align, the employee will be displayed as a separate record on the report.
12. In the period 01 July 2011 to 31 March 2012, how many positions have been advertised by “expression of interest”.
State Code State DescriptionPositions advertised by Expression of Interest
F PFE Police Fire and Emergency Services 93
13. At 31 March 2012, In relation to all vacant positions, what is the breakdown of recruitment actions by:
- Selection process commenced and- Selection process (including position advertising) not commenced
NTPFES has a rolling recruitment schedule for police and fire-fighters and has an ongoing transfer and promotion program to cater for those vacancies that need to be filled.
Some positions are vacant due to circumstances that are unique to this agency and will not necessarily result in any recruitment action. NTPFES uses establishment management methods which allow flexibility of staff deployment to areas of greatest need as they arise. This will result in vacant positions in some areas while staffing is increased in other areas but does not create a situation where a vacant position necessarily needs to be filled.

Public Servants Selection Process
State Code State DescriptionSelection Process
CommencedSelection Process Not Commenced
F PFE Police Fire and Emergency Services 95 6
14. In the period 01 July 2011 to 31 March 2012, per position level, what is the average length of time taken for recruitment from advertising to successful applicant.
State Code State Description Agency AverageF PFE Police Fire and Emergency Services 44.99
Breakdown by level
Classification Classification Description Average DaysPolice
SUPT SUPERINTENDENT 17.00SSGT SNR SERGEANT 18.20SGT SERGEANT 21.76RSGT REMOTE SERGEANT 15.00CONST CONSTABLE 18.32ACPO ABORIGINAL COMMUNITY POLICE OFFICER 15.00PAUX POLICE AUXILIARY 17.86
Fire SSO SNR STATION OFFICER 71.00SO STATION OFFICER 51.00DOF DISTRICT OFFICER 121.00
Public Servants
ECO2 EXECUTIVE CONTRACT OFFICER 2 56.00SAO1 SNR ADNIM OFFICER 1 56.00AO7 ADMIN OFFICER 7 43.50AO6 ADMIN OFFICER 6 49.33AO5 ADMIN OFFICER 5 68.14AO4 ADMIN OFFICER 4 61.00AO3 ADMIN OFFICER 3 50.09AO2 ADMIN OFFICER 2 1.00AO1 ADMIN OFFICER 1 1.00P3 PROFESSIONAL 3 36.00P2 PROFESSIONAL 2 76.00P1 PROFESSIONAL 1 96.00T3 TECHNICAL 3 41.00T2 TECHNICAL 2 78.50
NT Police Recruitment: Time is based on the number of working days between the gazetting of a position in the NT Police Gazette and the gazetting of the successful applicant in the NT Police Gazette.
Public Sector Recruitment: Time is based on the number of working days between the advertising of a position, and the gazetting of the successful applicant on the NT Employment Opportunities website.

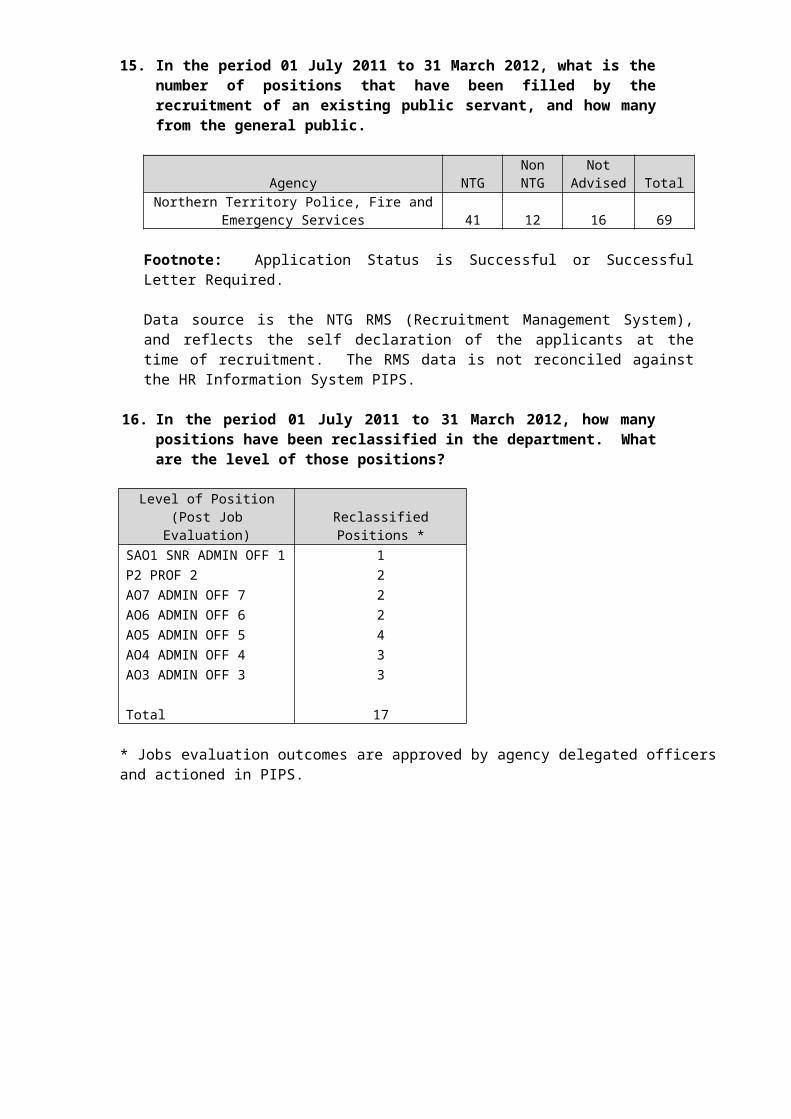
15. In the period 01 July 2011 to 31 March 2012, what is the number of positions that have been filled by the recruitment of an existing public servant, and how many from the general public.
Agency NTGNon NTG
Not Advised Total
Northern Territory Police, Fire and Emergency Services 41 12 16 69
Footnote: Application Status is Successful or Successful Letter Required.
Data source is the NTG RMS (Recruitment Management System), and reflects the self declaration of the applicants at the time of recruitment. The RMS data is not reconciled against the HR Information System PIPS.
16. In the period 01 July 2011 to 31 March 2012, how many positions have been reclassified in the department. What are the level of those positions?
Level of Position(Post Job Evaluation) Reclassified Positions *
SAO1 SNR ADMIN OFF 1 1P2 PROF 2 2AO7 ADMIN OFF 7 2AO6 ADMIN OFF 6 2AO5 ADMIN OFF 5 4AO4 ADMIN OFF 4 3AO3 ADMIN OFF 3 3 Total 17
* Jobs evaluation outcomes are approved by agency delegated officers and actioned in PIPS.
17. At Pay day 20, 28 March 2012, how many permanent supernumerary unattached employees do you have in your agency? What levels are they?
Some employees are unattached due to circumstances that are unique to this agency and will not necessarily result in any recruitment action. NTPFES uses establishment management methods which allow flexibility of staff deployment to areas of greatest need as they arise. This will result in vacant positions in some areas while staffing is increased in other areas but does not create a situation where a vacant position necessarily needs to be filled.
Classification Classification Description Unattached EmployeesPublic Servants
AO7 ADMIN OFFICER 7 1AO6 ADMIN OFFICER 6 1AO3 ADMIN OFFICER 3 3AO2 ADMIN OFFICER 2 2SP1 SENIOR PROFESSIONAL 1 1P3 PROFESSIONAL 3 1
Total 9
Footnote: Employee Status is Permanent (P) and Nominal Position Classification is Unattached. Agency State code is based on Nominal position.
The numbers represent ‘Head Count’ for both operative and inoperative staff including Casuals, Honorary (Board Members), Executive Contractors, Apprentices and Graduates but excludes previous staff being paid workers compensation payments. Employees not employed full time are counted as ‘1’.
18. In the period 01 July 2011 to 31 March 2012, how many unattached employees have successfully gained nominal positions within the Agency or gained employment in another Agency.
State Code State Description Employees
F PFE Police Fire and Emergency Services 16
Footnote: The '"Number of Unattached Officers" is based on 'Head Count' for both operative and in-operative employees. Employees not employed full-time are counted as "1".
19. In the period 01 July 2011 to 31 March 2012, how many unattached employees resigned.
State Code State DescriptionEmployees Resigned
F PFE Police Fire and Emergency Services 9
Footnote: The '"Number of Unattached Officers" is based on 'Head Count' for both operative and in-operative employees. Employees not employed full-time are counted as "1".
20. At Pay day 20, 28 March 2012, what is the average length of stay of staff in the department? Please break this down by position level.
State Code State DescriptionAgency Average
Length of Stay (yrs)F PFE Police Fire and Emergency Services 8.75
Average length of stay by level
PoliceCOPC COMMISSIONER OF POLICE 2.26DCOPC DEPUTY COMMISSIONER 1.68ACOPC ASSISTANT COMMISSIONER 20.14COMC COMMANDER 22.40SUPT SUPERINTENDENT 21.91SSGT SNR SERGEANT 18.21SGT SERGEANT 14.89RSGT REMOTE SERGEANT 17.1SC1C SNR CONSTABLE 1/C 12.32SCONT SNR CONSTABLE 10.84CON1C CONSTABLE 1/C 5.11EXAMR POLICE EXAMINER 2.47PXAMR PRINCIPAL EXAMINER 16.68CONST CONSTABLE 3.03CONTA CONSTABLE RECRUIT 0.64SACP SNR ABORIGINAL COMMUNITY POLICE OFF 10.06ACP1C ABORIGINAL COMMUNITY POLICE 1/C 5.15ACPO ABORIGINAL COMMUNITY POLICE 3.21ACPR ABORIGINAL COMMUNITY POLICE RECRUIT 0.15SPAUX SNR POLICE AUXILIARY 12.40

PAX1C POLICE AUXILIARY 1/C 5.72PAUX POLICE AUXILIARY 2.07 9.06
Fire DOF DISTRICT OFFICER FIRE SERVICE 20.47SSO SNR STATION OFFICER 24.32SO STATION OFFICER 19.22LFF LEADING FIREFIGHTER 12.42SFF SNR FIREFIGHTER 13.71FFA FIREFIGHTER QUALIFIED 13.96FFC FIREFIGHER C CLASS 2.61FFD FIREFIGHTER D CLASS 2.41FFREC FIREFIGHTER RECRUIT 0.63 12.20
Public Servants
EO4C EXECUTIVE CONTRACT OFFICER 4 17.06EO3C EXECUTIVE CONTRACT OFFICER 3 0.57EO2C EXECUTIVE CONTRACT OFFICER 2 9.61EO1C EXECUTIVE CONTRACT OFFICER 1 5.78SAO2 SNR ADMIN OFFICER 2 5.75SAO1 SNR ADMIN OFFICER 1 4.42AO7 ADMIN OFFICER 7 3.36AO6 ADMIN OFFICER 6 5.00AO5 ADMIN OFFICER 5 4.30AO4 ADMIN OFFICER 4 5.50AO3 ADMIN OFFICER 3 4.34AO2 ADMIN OFFICER 2 2.73AO1 ADMIN OFFICER 1 0.53AQF3A NTPS APPRENTICESHIP AQF3 LEVEL A 0.13CPIL CHIEF PILOT NT POLICE 6.32GOVA1 AUTOMOTIVE APPRENTICE (MHRT) 1.89SP1 SENIOR PROFESSIONAL 1 6.04SP2 SENIOR PROFESSIONAL 2 4.73P1 PROFESSIONAL 1 1.56P2 PROFESSIONAL 2 4.81P3 PROFESSIONAL 3 4.08PH2 PHYSICAL 2 9.49PH3 PHYSICAL 3 13.25PH5 PHYSICAL 5 7.36SP1 SNR PROFESSIONAL OFFICER 1 6.04SP2 SNR PROFESSIONAL OFFICER 2 4.73SPIL SNR PILOT NT POLICE 2.69T2 TECHNICAL 2 6.44T3 TECHNICAL 3 11.53T4 TECHNICAL 4 8.55T5 TECHNICAL 5 7.69T6 TECHNICAL 6 8.39 6.39
Footnote: The ‘Average Length of Service’ calculation is derived from the current period of service in the current Agency divided by the total number of staff (Head Count).

21. In the period 01 July 2011 to 31 March 2012, how much has been spent to date on advertising employee positions, and can you provide a breakdown of these costs.
Recruitment Advertising
NT Police 124,799NT Fire & Rescue 43,127NT Emergency Service 8,748Public Sector 92,522Total 269,197
22. In relation to Apprentices and Graduates, who commenced during the 2011 calendar year:
- How many started with the department?4 Apprentices and Nil Graduates.
- How many have completed the year?4 Apprentices.
- How many have won nominal positions?No Apprentices won nominal positions, as reporting period of 1 January 2011 to 31 December 2011 is within the Apprentice’s first year of service.
- How many have left the NTG?2 Apprentices left the agency during the period 1 January 2011 to 31 December 2011.
- What was the length of time each stayed with the NTG before leaving?1 Apprentice completed 11 months, 1 Apprentice completed 10 months.
Footnote: Numbers listed cover all Apprentices and Graduates for the period 1 January 2011 and 31 December 2011 that use the following classifications. It does not cover any Graduates or Apprentices that may be recorded against other classifications within PIPS (e.g. AO4/AO5).
Graduates: GRADT
Apprentices: AQF3A, AQ3SA, SBA, AQF3B, SBA02, AQF3C, AQF4A, AQFSA, GOVAM, AQF4B, AQ4SB, GOVA1, AQF4C, AQ4SC, GOVA2
23. At Pay day 20, 28 March 2012, In relation to Indigenous Employees:
a) How many employees do you have in your department that recognise themselves as indigenous? 145
b) What are the levels of their positions held? N/A see footnote
c) How many at each level? N/A see footnote
d) How many are tenured and at what level? 132See Footnote regarding level
e) How many temporary and at what levels? 13See Footnote regarding level

f) How many are acting up in positions and at what level? 8See Footnote regarding level
Footnote: Only employees that have voluntarily self identified themselves as being of Indigenous or Torres Strait Islander descent in the HR System are included in the report.
EEO information is collected for purposes of statistical reporting. Privacy legislation directs that no individuals are to be identified.
Information relating to level of employee has not been provided due to privacy concerns, as individual employees are easily identifiable.
In relation to Indigenous Employees who commenced with the NTG during the 2011 calendar year:
g) How many were still employed at 31/12/2011?h) How many have left the NTG?
Agency
Indigenous Employees
commenced in 2011
Indigenous Staff commenced in 2011
and employed at 31/12/11
Indigenous Staff commenced and ceased in 2011
NT Police Fire and Emergency Services 11 9 2
Footnote: Only staff that have voluntarily self identified themselves as being of Indigenous or Torres Strait Islander decent in the HR System are included in the report.
EEO information is collected for purposes of statistical reporting. Privacy legislation directs that no individuals are to be identified.
24. In relation to NTPS staff as at Pay Day 20, 28 March 2012:
a) What is the total amount of accrued leave in the department, broken down by level, long service leave and recreation leave? Long Service Leave 5,079.69 Months.
b) What is the financial value of that leave? $40,994,647.07.
c) What is the highest individual amount of accrued leave at each position level?
ClassificationAccrued Long Service
Leave (Months)Highest Individual Amount
Accrued (Months) Police
SUPT 184.89 12.36SSGT 316.28 12.60SGT 742.36 14.03BRSGT 6.59 4.96RSGT 143.67 12.00SC1C 368.84 10.06SCONT 857.82 13.76CON1C 346.29 6.76PXAMR 39.12 8.95EXAMR 0.96 0.96

ClassificationAccrued Long Service
Leave (Months)Highest Individual Amount
Accrued (Months)CONST 296.37 4.80CONTA 9.84 3.22SACP 74.95 5.43ACP1C 39.48 4.43ACPO 30.56 5.86ACPR 0.21 0.03SPAUX 242.51 13.03PAX1C 43.28 4.87PAUX 66.31 4.30 3,810.33 14.03
Fire DOF 51.44 11.43SSO 91.02 20.26SO 176.10 13.26LFF 129.70 9.46SFF 128.99 11.20FFA 88.12 13.66FFC 14.05 1.13FFD 15.60 6.36FFREC 9.00 3.33 704.02 20.26
Public Servants SAO2 3.29 1.92SAO1 38.93 5.60AO7 41.38 4.72AO6 56.15 6.22AO5 69.35 11.47AO4 58.68 10.30AO3 112.45 4.22AO2 43.17 5.05AO1 0.59 0.47AQF3A 0.04 0.02GOVA1 0.55 0.55CPIL 1.87 1.87SPIL 3.94 1.22SP2 7.00 3.55SP1 11.27 5.63P3 13.80 2.80P2 6.27 3.35P1 1.79 1.22PH5 2.20 2.20PH3 6.26 2.39PH2 16.37 4.35T6 10.99 5.49T5 9.20 2.95T4 17.34 6.53T3 16.12 5.20T2 16.34 5.07 565.34 13.03
Total 5,079.69 20.26
d) What is the total amount of accrued leave in the department, broken down by level, long service leave and recreation leave? Recreation Leave – 95,778.76 days.
e) What is the financial value of that leave? $34,173,662.55.

f) What is the highest individual amount of accrued leave at each position level?
ClassificationAccrued Recreation
Leave (Days)
Highest Individual Amount Accrued
(Days)Police
SUPT 1,928.61 121.24SSGT 3,892.90 117.75SGT 12,015.55 141.13BSGT 56.75 41.58RSGT 2,459.43 99.67SC1C 5,930.81 116.37SCONT 13,967.85 198.66CON1C 7,570.00 117.25PXAMR 655.09 110.78EXAMR 53.00 53.00CONST 10,512.24 138.75CONTA 449.92 59.26SACP 1,435.33 107.62ACP1C 999.96 84.84ACPO 820.09 77.42ACPR 17.50 2.92SPAUX 3,465.18 137.69PAX1C 972.02 103.88PAUX 2,402.13 85.33 69,604.34 (c) 198.66
Fire DOF 581.86 99.74SSO 1,394.74 175.72SO 2,543.95 180.07LFF 2,307.91 183.16SFF 2,760.41 230.57FFA 1,693.13 223.97FFC 684.61 78.49FFD 528.02 88.33FFREC 176.34 36.84 12,670.96 (c) 230.57
Public Servants
SAO2 138.09 69.50SAO1 845.04 87.00AO7 929.55 103.21AO6 1,242.66 143.30AO5 1,408.86 167.34AO4 1,152.40 84.95AO3 3,127.88 83.59AO2 1,107.53 104.50AO1 60.11 47.61AQF3A 5.00 2.50GOVA1 33.62 33.62SP2 94.97 87.20SP1 229.96 102.18P3 379.26 51.50P2 108.67 39.08P1 82.36 35.19PH5 82.82 82.82PH3 256.45 88.76

ClassificationAccrued Recreation
Leave (Days)
Highest Individual Amount Accrued
(Days)PH2 441.43 114.10CPIL 75.50 75.50SPIL 135.00 52.00T6 246.62 104.73T5 202.53 68.00T4 427.91 137.74T3 373.68 103.03T2 315.53 50.85
13,503.46 (c) 143.30 Total 95,778.76 (c) 230.57
g) What is the current total of sick leave entitlement of employees in the department?
State Code State DescriptionTotal Sick Leave
Entitlement (Weeks)F PFE Police Fire and Emergency Services 7,750.46
Footnote: Police employees are excluded from this report as per clause 60.3 (PATD). A member shall be entitled to unlimited personal leave in circumstances where he/she is, was or will be unable to attend duty due to a genuine personal illness subject to satisfactory proof of documentation.
h) In relation to NTPS staff how many days sick leave were taken between 01 July 2011 and 31 March 2012 at each employee level?
Classification Classification DescriptionDays Sick
Leave Taken Police
SUPT SUPERINTENDENT 133.39SSGT SNR SERGEANT 625.59SGT SERGEANT 1,935.30RSGT REMOTE SERGEANT 89.50SC1C SNR CONSTABLE 1/C 792.85SCONT SNR CONSTABLE 2,839.17CON1C CONSTABLE 1/C 1,093.52CONST CONSTABLE 1,673.33CONTA CONSTABLE RECRUIT 13.89SACP SNR ACPO 427.14ACP1C ABORIGINAL COMM POLICE OFFICER 1/C 202.88ACPO ABORIGINAL COMM POLICE OFFICER 243.75SPAUX SNR POL AUXILIARY 900.73PAX1C POLICE AUXILIARY 1/C 251.41PAUX POLICE AUXILIARY 655.20PAUXR POLICE AUXILIARY RECRUIT 11.00 11,888.65
Fire DOF DISTRICT OFFICER 17.38SSO SNR STATION OFFICER 77.57SO STATION OFFICER 195.45LFF LEADING FIREFIGHTER 179.63SFF SNR FIREFIGHTER 294.16FFA FIREFIGHTER QFD 133.25FFB FIREFIGHTER B 3.75

Classification Classification DescriptionDays Sick
Leave TakenFFC FIREFIGHTER C 36.75FFD FIREFIGHTER D 121.18FFREC FIREFIGHTER RECRUIT 9.00 1,068.12
Public Servants SAO2 SNR ADMIN OFFICER 2 8.00SAO1 SNR ADMIN OFFICER 1 111.31AO7 ADMIN OFFICER 7 120.54AO6 ADMIN OFFICER 6 222.24AO5 ADMIN OFFICER 5 240.52AO4 ADMIN OFFICER 4 385.09AO3 ADMIN OFFICER 3 691.87AO2 ADMIN OFFICER 2 390.57AO1 ADMIN OFFICER 1 9.00AQF3A NTPS APPRENTICE 4.46GOVA1 AUTO APPRENTICE 1.00SP2 SNR PROFESSIONAL OFFICER 2 7.82SP1 SNR PROFESSIONAL OFFICER 1 7.00P3 PROFESSIONAL 3 31.80P2 PROFESSIONAL 2 37.20P1 PROFESSIONAL 1 36.15PH3 PHYSICAL 3 1.95PH2 PHYSICAL 2 26.70SPIL SNR PILOT 40.76T6 TECHNICAL 6 20.90T5 TECHNICAL 5 16.70T4 TECHNICAL 4 47.18T3 TECHNICAL 3 84.18T2 TECHNICAL 2 10.00
2,532.04 Total 15,488.81
Footnote: ‘Days Sick Leave Taken’ is calculated from an 8 hour day, however some employees (Police Officers) work 12 hour shifts in one day and any leave taken is calculated as though it was an 8 hour day. For Example: 1 x 12 hour shift is converted to 1.5 days.
25. In relation to Contract (ECO1 and above) staff as of 31 March 2012:
a) What is the total amount of accrued leave in the department, broken down by level, long service leave and recreation leave?
b) What is the financial value of that leave? $1,819,849.92.c) What is the highest individual amount of accrued leave at each position level?
Classification
Accrued Long Service Leave
(Months)
Highest Individual Amount Accrued
(Months)Police
COPC 0.85 0.85DCOPC 2.45 2.45ACOPC 14.22 8.03COMC 55.48 11.93 73.0 (c ) 11.93
Public Servants
EO4C 6.60 6.60

Classification
Accrued Long Service Leave
(Months)
Highest Individual Amount Accrued
(Months)EO3C 0.15 0.15EO2C 11.04 10.85EO1C 16.99 10.77 34.78 (c ) 10.85 Total 107.78 (c ) 11.93
In relation to Contract (EC01 and above) Staff as at Pay Day 20, 28 March 2012:
i) What is the total amount of accrued leave in the department, broken down by level, long service leave and recreation leave? 976.21 Days.
ii) What is the financial value of that leave? $783,871.36.iii) What is the highest individual amount of accrued leave at each position level?
ClassificationAccrued Recreation
Leave (Days)Highest Individual Amount
Accrued (Days)
Police COPC 46.50 46.50DCOPC 25.16 25.15ACOPC 139.47 63.45COMC 486.03 94.68 697.16 94.68
Public Servants EO4C 37.49 37.49EO3C 6.50 6.50EO2C 54.99 49.33EO1C 180.06 57.32
279.05 57.32 Total 976.21 94.68
d) In relation to Contract (E01 and above) Staff - What is the current total of sick leave entitlement of employees in the department?
Police employees on Executive Contracts have been removed due to privacy concerns as individual employees are easily identifiable.
State Code State Description
Total Sick Leave Entitlement
(Weeks)
F PFE Police Fire and Emergency Services 253.93

(e) In relation to Contract (ECO1 and above) staff how many days sick leave were taken between 1 July 2011 and 31 March 2012, at each employee level?
Police employees on Executive Contracts have been removed due to privacy concerns as individual employees are easily identifiable.
Classification Classification DescriptionDays Sick Leave
Taken Public Servants EO4C EXEC OFF 4 CNTR 4.46EO2C EXEC OFF 2 CNTR 2.00EO1C EXEC OFF 1 CNTR 46.64 Total 53.10
Footnote: ‘Days Sick Leave Taken’ is calculated from an 8 hour day.
26. In the period 01 July 2011 to 31 March 2012, how many employees have utilised section 52.8 Cash-out of Leave – (Recreation Leave), under the NTPS 2010-2013 Enterprise Agreement.
- Break down by level and amount of leave
State Code State DescriptionEmployees utilising
Cash-out LeaveF PFE Police Fire and Emergency Services 9
Cash-out of leave by level
Classification Classification Description Number of Staff No. of Days
AO6 ADMIN OFFICER 6 4 55AO4 ADMIN OFFICER 4 1 10AO3 ADMIN OFFICER 3 2 23T6 TECHNICAL 6 1 29T4 TECHNICAL 4 1 10
Total 9 127
Footnote: Report scope is employees affected by the NTPS 2010-2013 Enterprise Agreement, date of effect 19 August 2010. Employment classifications referenced as well as Pay Transaction Records Entitlement code SAR049 and SAR050.
Employee must have a minimum balance of 20 days recreation leave remaining after cash out of leave.

27. In the period 01 July 2011 to 31 March 2012, how many employees have utilised section 55.3 (b) Long Service Leave cash out of 10 years, under the NTPS 2010-2013 Enterprise Agreement.
- Break down by level and amount of leave
Classification Classification DescriptionNumber of
StaffNo.
DaysAO6 ADMIN OFFICER 6 1 13 Total 1 13
Footnote: Report scope is employees affected by the NTPS 2010-2013 Enterprise Agreement, date of effect 19 August 2010. Employment classifications referenced as well as Pay Transaction Records Entitlement code SAR020.
28. During the period 01 July 2011 to 31 March 2012, did the CEO direct any employee under section 52.7 Excess Leave of the NTPS 2010-2013 Enterprise Agreement to take leave? Break down by level and the amount of leave taken.
No.
29. During the period 01 July 2011 to 31 March 2012, did the CEO direct any employee under section 55.3 (a) Long Service Leave to take leave.
- Break down by level and the amount of leave
No.

30. At Pay day 20, 28 March 2012, how many workers were on workers compensation. At what level and is there an expected return date.
There were 12 claimants on workers compensation leave as at 28 March 2012.
Classification Return Date No. of Employees
Police Constable 1st Class Returned 1Senior Constable Returned 1Senior Constable June 2012 1Senior Constable Not Known 2Senior Constable 1st Class May 2012 1Sergeant Not Known 2Senior Sergeant Not Known 1
9CivilianAdmin Officer 3 Not Known 1
1FireStation Officer Not Known 1Senior Firefighter Not Known 1
2
Total 12
Only current employees were reported on who were unfit on the date of effect and therefore in receipt of benefits (benefits only, not other expenditure). Former employees, disputed claims, claimants who had already returned to work, and workers with no time lost or duplicate workers have not been included in the above response.
31. From 01 July 2011 to 31 March 2012, how many people received workers compensation, at what position level and geographic location and how long for each person.
A total of 221 staff received workers compensation payments, with a total of 35,218 days in receipt of workers compensation.
Region / Level Number DaysAlice Springs Remote 5 935
Constable 3 561Constable 1 Class 1 187Sergeant 1 187
Alice Springs Urban 32 5210Administrative Officer 3 1 187Administrative Officer 4 1 187Constable 13 2260Constable 1 Class 4 748Fire-fighter Recruit 1 187Fire-fighter Class D 2 63Leading Fire-fighter 1 187

Senior Aboriginal Community Police Officer 1 187Senior Constable 2 374Senior Fire-fighter 2 374Senior Sergeant 1 187Sergeant 3 269
Darwin Remote 10 1473Constable 3 498Constable 1 Class 3 337Physical 3 1 77Senior Constable 1 Class 1 187Sergeant 2 374
Darwin Urban 130 21082Aboriginal Community Police Officer 3 392Administrative Officer 2 2 249Administrative Officer 3 2 229Administrative Officer 4 1 172Administrative Officer 5 2 229Administrative Officer 6 1 187Constable 18 3025Constable 1 Class 16 2740Executive Contract Officer 1 1 94Fire Auxiliary 1 187Fire-fighter Class A 2 325Fire-fighter Class D 1 13Government Apprentice 1 1 187Leading Fire-fighter 3 351NTES Volunteer 1 187Police Auxiliary 4 748Police Auxiliary 1 Class 2 374Senior Aboriginal Community Police Officer 1 111Senior Constable 31 5250Senior Constable 1 Class 8 1496Senior Fire-fighter 4 592Senior Police Auxiliary 2 315Senior Sergeant 4 688Sergeant 16 2380Station Officer 3 561
Gove Urban 1 187Senior Constable 1 187
Katherine Remote 2 374Constable 1 187Senior Constable 1 Class 1 187
Katherine Urban 15 2163Aboriginal Community Police Officer 1 40Aboriginal Community Police Officer 1 Class 1 187Constable 2 262Constable 1 Class 3 512Police Auxiliary 2 374Senior Constable 4 414Sergeant 2 374

Palmerston Urban 19 2927Constable 7 1061Constable 1 Class 5 628Leading Fire-fighter 1 187Senior Aboriginal Community Police Officer 1 187Senior Constable 4 748Superintendent 1 116
Tennant Creek Urban 7 867Constable 2 364Senior Aboriginal Community Police Officer 1 12Senior Constable 1 187Senior Police Auxiliary 1 81Sergeant 2 223
Grand Total 221 35218
For the purpose of this response, ‘received workers compensation’ refers to payment of weekly benefits to recompense for time lost due to illness or injury or payment of medical intervention/rehabilitation expenses incurred.
32. At Pay day 20, 28 March 2012, how many workers were on sick leave or extended leave (excluding recreation leave), longer than 3 weeks, at what level, and for what reason.
Classification Classification Description Sick LSLMisc Paid
Misc Unpaid
Total Staff
Police ACOPC ASSISTANT COMMISSIONER 1 1SUPT SUPERINTENDENT 1 2 3SSGT SNR SERGEANT 3 1 1 5SGT SERGEANT 5 6 1 2 14RSGT REMOTE SERGEANT 1 1SC1C SNR CONSTABLE 1/C 1 2 1 4SCONT SNR CONSTABLE 3 6 1 14 24CON1C CONSTABLE 1/C 1 2 3CONST CONSTABLE 3 1 1 2 7PXAMR PRINCIPAL EXAMINER 2 2SACP SNR ACPO 1 1 2 4ACPO ABORIGINAL COMM POL 1 1SPAUX SNR POLICE AUXILIARY 3 4 1 8PAX1C POLICE AUXILIARY 1 C 2 2PAUX POLICE AUXILIARY 3 3
Fire DOF DISTRICT OFFICER 1 1SO SNR OFFICER 1 1SFF SNR FIREFIGHTER 1 1
Public Servants AO4 ADMIN OFFICER 4 2 2AO3 ADMIN OFFICER 3 1 2 5 8AO2 ADMIN OFFICER 2 2 1 3T6 TECHNICAL 6 1 1

Total 23 31 8 37 99
Footnote: Report can only be answered at a point in time, ie. Who was on extended leave on 30 March 2012. Leave awaiting approval or awaiting processing are not included in this report.
Miscellaneous leave includes (but is not limited to) Maternity, Leave Without Pay, Sick Leave Without Pay, Secondment, Study Leave and extended absences consisting of multiple leave types.
33. At Pay day 20, 28 March 2012, were there any NTPS public servants who were employed in the 80’s and eligible for return flight to Adelaide every 2 years. How many and at what level.
Classification Classification Description Eligible for AirfarePolice
SUPT SUPERINTENDENT 23SSGT SNR SERGEANT 30SGT SERGEANT 51RSGT REMOTE SERGEANT 2SC1C SENIOR CONSTABLE 1/C 18SCONT SENIOR CONSTABLE 29SPAUX SNR POLICE AUXILIARY 2
155Fire
DOF DISTRICT OFFICER 4SSO SNR STATION OFFICER 8SO STATION OFFICER 8LFF LEADING FIREFIGHTER 1SFF SNR FIREFIGHTER 6FFA FIREFIGHTER QFD 4
31Public Servants
SAO1 SNR ADMIN OFFICER 1 3AO7 ADMIN OFFICER 7 1AO6 ADMIN OFFICER 6 5AO5 ADMIN OFFICER 5 3AO4 ADMIN OFFICER 4 3AO3 ADMIN OFFICER 3 5AO2 ADMIN OFFICER 2 1PH3 PHYSICAL 3 1T2 TECHNICAL 2 1T3 TECHNICAL 3 1T4 TECHNICAL 4 1
25
Total 211
34. How many complaints have been made in the Department in relation to workplace bullying and harassment? In relation to each output group within the Department.

State Code State Description
Complaints in relation to workplace bullying and
harassment
F PFE Police Fire and Emergency Services 10
Footnote: Report Scope is internal complaints of bullying and harassment for the period 1 April 2011 to 28 March 2012.
35. From 01 July 2011 to 31 March 2012, how much has been spent on relocation cost for commencement of employment and either completion or termination of employment (removalists, airfares, accommodation and allowances) in the Department.
Recruitment Fares 38,756.76
Removal and Storage Expenses 116,642.65
Relocation Allowances 0
Total
155,399.41
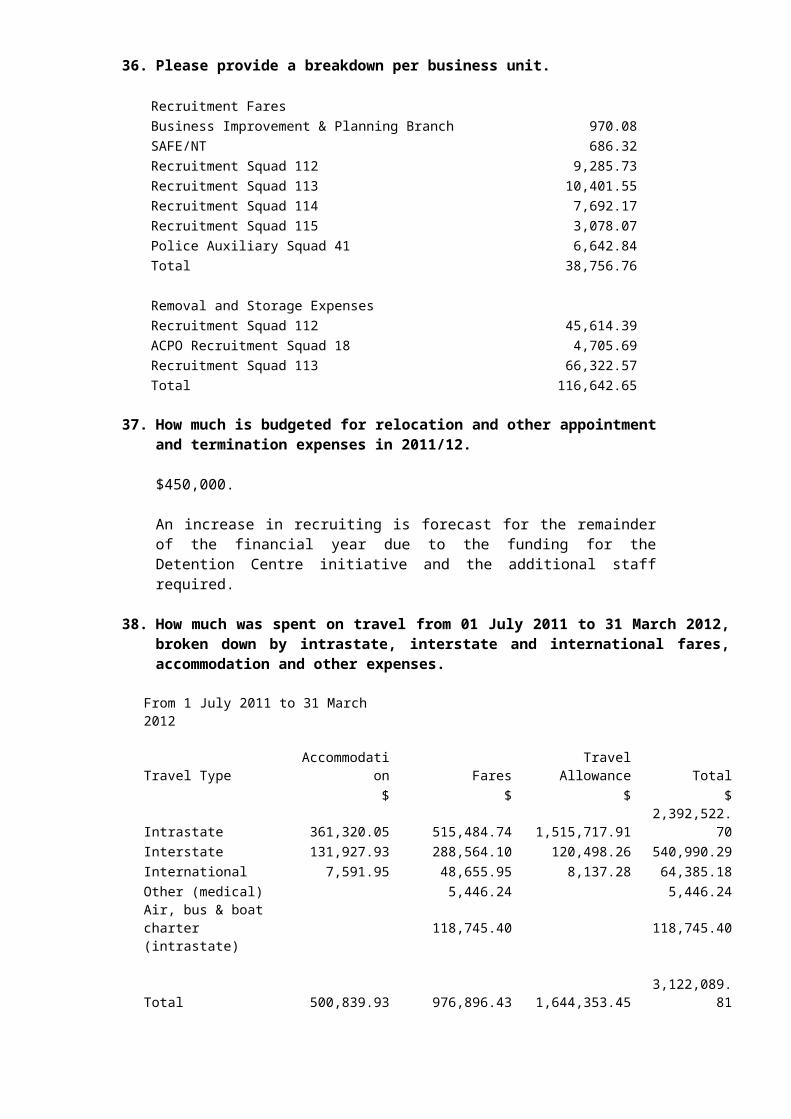
36. Please provide a breakdown per business unit.
Recruitment FaresBusiness Improvement & Planning Branch 970.08SAFE/NT 686.32Recruitment Squad 112 9,285.73Recruitment Squad 113 10,401.55Recruitment Squad 114 7,692.17Recruitment Squad 115 3,078.07Police Auxiliary Squad 41 6,642.84Total 38,756.76
Removal and Storage ExpensesRecruitment Squad 112 45,614.39ACPO Recruitment Squad 18 4,705.69Recruitment Squad 113 66,322.57Total 116,642.65
37. How much is budgeted for relocation and other appointment and termination expenses in 2011/12.
$450,000.
An increase in recruiting is forecast for the remainder of the financial year due to the funding for the Detention Centre initiative and the additional staff required.
38. How much was spent on travel from 01 July 2011 to 31 March 2012, broken down by intrastate, interstate and international fares, accommodation and other expenses.

From 1 July 2011 to 31 March 2012
Travel Type Accommodation Fares Travel Allowance Total $ $ $ $
Intrastate 361,320.05 515,484.74 1,515,717.91 2,392,522.70Interstate 131,927.93 288,564.10 120,498.26 540,990.29International 7,591.95 48,655.95 8,137.28 64,385.18Other (medical) 5,446.24 5,446.24Air, bus & boat charter (intrastate) 118,745.40 118,745.40
Total 500,839.93 976,896.43 1,644,353.45 3,122,089.81
39. How much was spent on vehicles by the Department from 01 July 2011 to 31 March 2012.
$11.468 million.
40. How many vehicles does the Department have responsibility for.
On 31 March 2012, the NTPFES had 621 vehicles in-service.
41. What is the change, if any, in these vehicle numbers from the previous year.
The vehicle in-service increase is 11 compared to the same time last year however, in reality, varies due to timing variations in purchasing and auction activity over each reporting period.
NTPFES purchased an additional 17 vehicles over the reporting period - the armoured bear cat, 9 Toyota Hilux’s for the Remote Policing Command’s Community Engagement Police Officers and associated Darwin / Alice Springs reserve pools, 2 Ford Ranger’s for NT Emergency Service Area Manager’s for Katherine and Tennant Creek, the Holden Commodore concept car, the Katherine Mobile Police Station, the red Volvo Fire Truck for NTFRS training, trial Isuzu Grass Fire Truck and a Holden Rodeo seized under the Kava Management Act and subsequently gifted to the NT Police by the NT Licensing Commission.
42. What proportion of those vehicles meet the emission standard of 5.5 out of 10 under the Commonwealth Government’s Green Vehicle Guide.
Total vehicle numbers in Q40 and Q41 above, are based at a point in time, and differ from the NTG Greening the Fleet Strategy which counts all vehicles owned across the reporting period (including those replaced).
Vehicles Measured by the Commonwealth’s Green Vehicle GuideGreening the Fleet Strategy reporting period
Total Vehicles (incl 4WD utilities and station wagons)
Passenger Vehicles (number)
Passenger Vehicles >5.5
(number)
Passenger Vehicles >5.5(percentage)
1 April 09 to 31 March 10 723 401 298 74%1 April 10 to 31 March 11 710 399 306 77%1 April 11 to 31 March 12 727 410 322 79%
During the current NTG Greening the Fleet Strategy reporting period of 1 April 2011 to 31 March 2012, 727 light commercial and passenger vehicles can be measured for energy efficiency by the green vehicle guide of which 410 are passenger vehicles. Of the passenger vehicles, 322 or 79% are at the emission standard of 5.5 or above.

This is a 2% increase on the previous NTG Greening the Fleet Strategy reporting period at 77% and is largely a result of a steady improvement in emission standards of manufacturer’s new model vehicles.
Vehicles that do not meet the emission standard are due to specific operational requirements such as Road Safety traffic pursuit vehicles and the Territory Response Group’s counter disaster vehicles.
The agency also has additional specialist vehicles, predominately vans, fire tankers, trucks and mobile police stations, motorbikes and others that are not measured for energy efficiency by the Commonwealth’s Green Vehicle Guide.
43. How many vehicles are home garaged.
At 31 March 2012, there were 62 vehicles home garaged.
44. What position levels have vehicles attached or are allowed to home garage.
Home garaging of vehicles is allowed for NTPFES Contract Officers and Police Superintendents in line with their employment conditions. All other home garaging is to be in line with the policy below.
For Contract Officers, home garaging of motor vehicles is in line with their employment conditions. With regard to the remainder of the agency’s vehicles, cases of monthly standing or overnight approval to home garage a motor vehicle requires the written approval of the relevant Divisional Police Superintendent, NT Fire and Rescue Service Divisional Officer, Director NT Emergency Service or Executive Director, Corporate Service, provided:
1. the driver is undertaking duties requiring the use of that motor vehicle prior to the commencement of their next rostered shift;
2. the driver is performing duties in the field (away from the station or work place) using a motor vehicle and it is operationally expedient and cost effective to go straight home after work rather than returning to the workplace;
3. the driver proceeds to duty away from their normal workplace directly from their home on the following day; and
4. the driver is liable to be recalled to duty and/or is “on-call” and the home garaging of the vehicle is operationally necessary.
45. How many credit cards have been issued to department staff.
356.
46. How many repayment transactions (and the value) for personal items and services are outstanding.
Nil.
47. How many reports of the improper use of Information Technology have been made.
A total of 15 reports were investigated in relation to improper use of Information Technology.
48. How many reports resulted in formal disciplinary action?

10 members received disciplinary action under Section 14C or Part IV of the Police Administration Act.
49. How many staff are considered ‘Essential’ in your Agency, for the purposes of an Emergency eg- Cyclone
- Break down by level
All police, fire and emergency services staff and volunteers are considered ‘essential’. Some civilian support staff such as CCTV monitor operators, call takers, media and logistic support including supply, facilities and ICT are also considered essential. The number and level of people deployed in each emergency event will be determined in accordance with the size and nature of the emergency. Additional staff will also be assigned with specific duties and responsibilities at different stages of the response and recovery.
Marketing:
50. From 01 July 2011 to 31 March 2012, how much was spent by the Department on advertising and marketing programs.
$0.11 million.
51. What was each of those programs and what was the cost of each of those programs.
Program Cost
Road Safety Campaign (seatbelts) 2,076.00
Show Expenses 26,984.36
National Police Remembrance Day 2,521.36
White Ribbon Day 1,177.91
Smoke Alarm Campaign 272.50
Northern Territory Emergency Services Campaigns 2,116.81(flooding, community resilience, emergency kits)
Promotional Items Child Abuse Task Force 1,642.50
Promotional Items Binge Drinking Early Intervention Pilot Program (Commonwealth funded)
37,665.35
General promotional items NTPFES (for use in all campaigns)
8,646.91
Interpretive Talking Posters - Alcohol Initiatives (Commonwealth funded)
28,763.64
Total 111,867.34
Insurance:
52. From 01 July 2011 to 31 March 2012, how much was spent on insurance expenses; further broken down by worker and employee insurances, physical plant and equipment insurances and other insurances.
Insurance Type Cost
Travel Insurance 482.68
Public Liability Insurance for the Junior Police Ranger programs 8,285.03
Total 8,767.71
53. What areas of the department are self-insured. What areas are commercially insured. If there are areas that are commercially insured, who provides this insurance, when is it due for renewal and what is the cost of this insurance provision and does it attract any thresholds under which insurance is not provided or any payments on item replacement.
The Northern Territory Government applies a self insurance policy for its general government sector insurable risks. The self insurance policy covers property and assets, workers compensation, public liability and professional indemnity related liabilities.
With the Treasurer’s approval, agencies may procure commercial insurance cover where a net benefit can be demonstrated.
With the exception of workers compensation cover, government businesses and corporations, such as the Power and Water Corporation, are excluded from the self insurance framework, and are required to purchase appropriate commercial insurance cover.
The Territory does not purchase reinsurance cover for natural disasters or other insurable risks under the self insurance policy. Instead, the Territory makes provision in the Budget for disaster related events, complemented by the Natural Disaster Recovery and Relief Arrangements (NDRRA) with the Commonwealth to provide assistance for natural disaster events that are outside of the Territory’s control and where commercial insurance is not readily available or affordable.
The Territory is currently reviewing its natural disaster insurance arrangements, following changes to the NDRRA announced by the Commonwealth in March 2011.
Any whole of government insurance policy related questions should be referred to the Treasurer.

54. What provision has been made for disaster or major catastrophe insurance?
Treasurer’s Advance is available to agencies in the event disaster costs exceed budget during the year.
The Territory does not purchase reinsurance cover for natural disasters or other insurable risks under the self insurance policy. Instead, the Territory makes provision in the Budget for disaster related events, complemented by the Natural Disaster Recovery and Relief Arrangements (NDRRA) with the Commonwealth to provide assistance for natural disaster events that are outside of the Territory’s control and where commercial insurance is not readily available or affordable.
Any whole of government insurance policy related questions should be referred to the Treasurer.
Climate Change:
55. From 01 July 2011 to 31 March 2012, how many tonnes of CO2 did the department emit.
The NTG Energy Smart Buildings Policy is calculated on an annual basis. In 2010-11, the NTPFES’ building energy consumption was 47,625 giga joules corresponding to 10,141 tonnes of greenhouse gas emissions.
The NTG Greening the Fleet Strategy reporting period is 1 April 2011 to 31 March 2012. During this period, greenhouse gas emissions from NTPFES vehicles from 1 April 2011 to 31 March 2012 was 2,661 tonnes.
Total tonnes of greenhouse gas emissions emitted is 12,802 tonnes.
Year Buildings Vehicles Total
Energy Consumption (Giga Joules)
Greenhouse Gas Emissions(Tonnes)
Greenhouse Gas Emissions(Tonnes)
Greenhouse Gas Emissions(Tonnes)
2008-09 43,816 9,552 2,922 12,474
2009-10 45,509 10,231 2,773 13,004
2010-11 47,625 10,141 2,661 12,802
Some key initiatives (with additional buildings) directly increased energy usage during the year:
New college training facility and drug dog kennels at Peter McAulay Centre completed late 2009/10;
New Yarralin Police Station;
Alice Springs Crime Scene Examination extension for additional office and laboratory accommodation;
Alice Springs Fire Station extension for additional offices and sleeping quarters;
Alice Springs NT Emergency Services headquarters extension for Emergency Operations Centre;
Jabiru Fire Station extension for additional office space, visiting officers quarters and lecture/training area; and
Police Beat in Parap.

56. From 01 July 2011 to 31 March 2012, what programs and strategies were introduced to reduce C02 emissions across the department?
Whilst NTPFES has not introduced new projects in the reporting period, the agency continues to rollout previous initiatives wherever possible.
As can be seen below, NTPFES has previously undertaken a number of strategies to reduce carbon emissions:
Peter McAulay Centre, Main Building
Airconditioning vents – ongoing installation of cushion head vents that close when desired temperature is reached. This lowers airflow pressure and allows airconditioning plant to run more efficiently;
Airconditioning timers – each floor operates on timers and has been manually adjusted to reflect operational requirements.
the installation of a heat reflective film for PMC, Main Building’s windows.
progression of an internal lighting upgrade through the Government Energy Efficiency Program (GEEP) which will have energy saving benefits in future reporting years. This initiative is currently at the tender advertising / assessment stage.
Previous projects at Peter McAulay Centre include:
Power-factor-correction – The Main, College and the Forensic buildings have installed power-factor-correction devices that even out energy spikes and reduce energy consumption.
NTPFES Fleet Workshop - the installation of translucent roof sheeting to utilise daylight instead of the high wattage high bay mercury vapour lighting.
Airconditioning systems - considerable work has been conducted on the airconditioning systems to improve the operation of the main plant and energy efficiency. This has included:
Main Building
replacement of airconditioning air handling units and main chillers; cleaning of several airconditioning coils and ducts; adjustment of time-clocks to minimise after hours usage; and installation of several split system airconditioning units for small areas that
are required to work after normal business hours.
Energy efficient lighting
Considerable work has been conducted including:
the sphere light fittings for PMC car parks and roadways have been upgraded;
street lights to the visiting/single officer’s quarters are all timer driven. The pool/tennis courts lights are also on timers;
the agency changes to energy efficient light bulbs wherever it can. NTPFES use low energy tri-phosphorous tubes;

PMC Main Building lighting – reduction of 4 fluorescent lights in each ceiling cavity to 3 on fluoro replacement; and
motion activated light sensors have been installed in some areas. JESCC has a computer managed lighting system to modify lighting based on shifts and Tri-Service sections within.
Police College
replacement of air-conditioning controls and linked into the current Building Management System. This allows efficient zoning and management of the College’s air-conditioning plant.
Other NTPFES Buildings
The 5 new remote multi-purpose police stations (Yarralin complete, Ramingining and Gapuwiyak under construction and Alparra / Imanpa in future), each with 4 houses, will have solar hot water systems installed to the station and houses.
NAB House runs energy efficient lighting and air-conditioning systems.
New Casuarina Police Station - the previous station was the highest energy intensity building in NTPFES’ portfolio. The new Casuarina Police Station has significantly lower energy intensity per square meter.
Vehicles
NTPFES now purchases the turbo-diesel Hilux vehicle in lieu of the previously purchased un-leaded petrol base model Workmate Hilux. This has resulted in a 28% reduction in carbon emissions (grams per kilometre) for each vehicle. Hilux’s make up 30% of the vehicle fleet and therefore a considerable reduction is being achieved.
The agency has three hybrid vehicles for the NTPFES vehicle fleet. Also the prisoner transport cages utilise natural ventilation (no air-conditioning required) unlike many other jurisdictions.
Other:
The agency promotes good energy efficient behaviour and work place practices amongst staff, including:
Computers and other applicable appliances are turned off on leaving the workplace where 24/7 operations are not required;
Shared drives have been established so that documents can be accessed by several users, thus minimising printing of documents; and
Single printer, scanner and fax machines are being installed to service a large number of users, which replaces multiple devices, thus saving energy usage.

57. Has a target for departmental CO2 emissions been set for the coming financial year.
- If yes, what % reduction is that from the previous year. - If no, why has a target not been set.
The NTPFES is working towards the reduction target set in the Northern Territory Government Energy Smart Buildings Policy for the 2011/12 financial year.
That target is a 10% reduction in energy usage per square metre across the agency’s building portfolio compared to a 2004/05 baseline.
In addition, NTPFES is working towards the reduction target set in the Northern Territory Greening the Fleet Strategy that aims to reduce energy usage per kilometre travelled in the Territory Government’s passenger and light commercial fleet by 20% by 2014 and 50% by 2020.
The Northern Territory Government has committed to become carbon neutral by 2018 under the Northern Territory Climate Change Policy. Under this target, whole of government systems to account for greenhouse gas emissions according to recognised international greenhouse accounting standards will be progressively rolled out over the next eight years for Government processes.
58. From 01 July 2011 to 31 March 2012, what was the cost of power and water to the department?
The cost of power and water for NTPFES for the period 1 July 2011 to 31 March 2012 was $3.084 million. This includes sewerage which cannot be separated out.
59. What is the projected cost for power and water to the department for the 2012/13 financial year.
$4.485 million.
Public Events:
60. From 01 July 2011 to 31 March 2012, list the public events/conferences/forums that were sponsored by the department.
1 July 2011 to 31 March 2012:
Media forum of the Cyclone and Flood Season - Community Awareness - November 2011.
57 x public education forums on cyclone and flood awareness.
NT Aboriginal Community Police Officer recruitment ‘come and try’ fitness mornings.
NT Fire and Rescue Service recruitment ‘come and try’ fitness mornings.
White Ribbon Day, preventing violence against women awareness raising BBQ in Raintree Park, Darwin.

What are projected for the 2012/13 financial year?
Projected for 2012/13:
NT show circuit as part of corporate Police, Fire and Emergency Services display, July 2012.
Media forum of the Cyclone and Flood Season – Community Awareness, November 2012.
60 x Public education forums on cyclones awareness.
NT Police recruitment ‘come and try’ fitness mornings.
NT Fire and Rescue recruitment ‘come and try’ fitness mornings.
61. What is the level of sponsorship provided in terms of financial support or in kind support.
Media forum for the Cyclone and Flood Season - Community Awareness, November 2011.
Human Resource only
57 x number of small public education forums on cyclones/flood awareness were conducted as part of the emergency management public education campaign (preparation and delivery).
Human resource only
NT show circuit as part of corporate Police, Fire and Emergency Services display, May/July 2011.
$65,000 in addition to Human resource costs
Public launch of the Cyclone and Flood Season - Community Awareness, November 2011.
Human resource only
A number of small public education forums on cyclones/flood awareness were conducted as part of the emergency management public education campaign.
Human resource only
NT Aboriginal Community Police Officer fitness ‘come and try’ morning.
Human resource only
NT Fire and Rescue Service recruitment ‘come and try’ fitness morning.
Human resource only
White Ribbon Day, preventing violence against women awareness raising BBQ in Raintree Park, Darwin.
$2695 in addition to Human resource costs
Advertising:
62. What is the department’s budget for advertising for the 2011/12 reporting year?
The NTPFES budget for advertising for 2011/12 is $100,000.
The response last year included recruitment advertising. This has been excluded this year based on the whole-of-Government standard responses.

63. How much is year to date expenditure? Please breakdown into newspaper, radio and TV?
Advertising Marketing & Promotion
Total
Newspaper 36,808 1,731 38,539Radio 13,390 500 13,890Television 16,841 16,841Other 12,190 12,190Total 79,229 2,231 81,459
64. What advertising campaigns have been undertaken or will be undertaken by the department in 2011/12?
Description
Careers in Policing
Careers in Fire Fighting
NTFRS Volunteers Recruitment
NTES Volunteers Recruitment
New Smoke Alarm Legislation Education Campaign
Don’t be a fool Smoke Alarm Campaign
Cyclone season Community service Announcements
65. From 01 July 2011 to 31 March 2012, how many consultancies were let in the year, at what cost, how many were NT firms and how many interstate and what was the value of those intra-territory and those interstate.
Nil.___________________________