€¦ · Web viewChapter 1 Foreword : We are pleased to be associated with Vikas Anvesh Foundation,...
53
Contents Chapter 1 Foreword : We are pleased to be associated with Vikas Anvesh Foundation, an initiative of Tata Trust for conducting the small study on Digital Inclusion and Digital Citizenship in India. We have conducted the study covering 2 Districts of Assam, Barpeta and Chapter s Contents Page No 1 Foreword 2 2 Abbreviations and Abstract 3-4 3 Introduction 5-10 4 Methodology 11 5 An Overview of Findings 12-38 6 Recommendations and Conclusion Acknowledgement 39 7 Annexures –Photo Gallery 29-31
Transcript of €¦ · Web viewChapter 1 Foreword : We are pleased to be associated with Vikas Anvesh Foundation,...

Contents
Chapter 1
Foreword :We are pleased to be associated with Vikas Anvesh Foundation, an initiative of Tata Trust for conducting the small study on Digital Inclusion and Digital Citizenship in India. We have conducted the study covering 2 Districts of Assam, Barpeta and Goalpara covering 3 villages of sample size of 160 and above. The Findings are presented here.
For the last 15 years digital inclusion has seen progress in NER keeping pace with the rest of the country. The steps in digital inclusion with only one network service provider (BSNL) have increased manifold to witness the growth in mobile telephony and internet spread to reach the remotest corner of NER. The information sharing through social networking sites, various other
Chapters Contents Page No1 Foreword 22 Abbreviations and
Abstract 3-4
3 Introduction 5-104 Methodology 115 An Overview of Findings 12-386 Recommendations and Conclusion
Acknowledgement 39
7 Annexures –Photo Gallery 29-31

2
platforms have brought about a change in the population in urban areas. To understand the impact of easy accessibility of internet on people whether positive or negative is a new emerging area of study.
The impact of digital inclusion in the true sense in the grass roots level community/institutions are still left much to be desired. We could forsee a future where cash transactions will be replaced by digital money. We also anticipate digital inclusion will prevent leakages within the system to make it more transparent for developmental activities to yield real results in the field level. It may be mentioned here that true digital citizenship where the Government benefits reach the last man and woman standing at the bottom of the pyramid will lead to digital inclusion in the truest sense of the word.
We are pleased to contribute our small study report for VAS in taking up the sphere of action research where Development Practitioners will get a voice to work on the new development paradigms emerging in the current scenario for knowledge management.
We wish our association will continue in the coming days.
We wish VAS all the success.
Best wishes,
Dr Amiya Kr Sharma
Executive Director, RGVN
Chapter 2 :
Abbreviations:
ALF : Area Level Federations
BSNL : Bharat Sanchar Nigam Limited
CBO: Community Based Organizations
DBT: Direct Benefit Transfer
FGD : Focused Group Discussions

3
LAN: Local Area Network
NER: North Eastern Region
NGO: Non- Governmental Organizations
RGVN: Rashtriya Gramin Vikas Nidhi
SHG: Self Help Groups
VAS : Vikas Anvesh Foundation
Abstract
Digital Inclusion is the ability of individuals and groups to access and use information and communication technologies. In this context the study explores to what extent the communities have been able to access and use the ICT in NER with specific reference to Assam. It is found that most of the Rural and Semi Urban areas lack digital infrastructure. It is found that 75% internet users have used it via a Mobile handset (Smart Phone). 37% never accessed internet , 63% used internet in the last 3 months and 63% used internet daily taking household as a unit. 63% among the internet users have accessed it from a personal computer, laptop or a tablet taking household as a unit. 37% have gone to internet cafes in nearby tehsils for accessing internet. Out of the internet users 15% accessed from Internet cafes and 85% form home either using mobile handsets or computer or a tablets in the last 3 months. There are no fixed broad band services in these villages .It is found that 63.2% respondents agreed that data network is available in the village however the network quality is poor in terms of speed of internet. The network service providers available in the areas surveyed are

4
Airtel, Jio,Vodafone . Internet quality is not stable with availability of 2G/3GOnly. 63% of the population used the digital platforms. In rural areas the content of the internet is irrelevant as most of the content is available in English. Majority of the population cannot follow the language to access the benefits of the knowledge and information to aid in improving their livelihoods and quality of life.
It is found majority ( >80%) of the population have keen interest in use of new technology and they want their children to be able to use Internet use, mobile phone skills, internet banking skills, internet shopping skills, internet community skills, internet information skills. In rural areas the aspirations are found to be higher for their children on use of internet and increasing their skills compared to semi-urban area under survey. 98% population among the internet users used it for social media. It is to notable that majority ( > 67%) of the population still don’t know or possess the knowledge on how to use Social Media. Wrong use of Social Media can result in leaving negative impact in Society without proper knowledge. 23.35% of the population have used internet for Online Booking of Air/ Bus Tickets. 74.8% have accessed Internet for Government services and Benefits. 60.7% have applied or claimed benefits online. Only 1.2 % have used internet for online tax payments or paying bills. 61.3% have used online Banking services. It is found that internet use is more prevalent among the age group of 21-30 years. Out of this age group 61% have used internet. It is interesting to note in the age group of 31-50 years internet use is less. It is static use of internet in this age group of people. It again decreases with advancing age from 60 + years onwards. It has been a surprising to find that the youth in the villages are not using internet. In urban center (Guwahati) from the survey of a CBO it is found 55% of the women possess a smart phone. The concept of e trading , digital products are still unique in the areas surveyed. They have no awareness on using digital platforms for sale , purchase of products, online marketing , e-trading, infotainment avenues .The barriers to digital inclusion are found to be lack of digital infrastructure, lack of digital literacy, lack of affordable devices (smart phones), lack of relevancy of the content available in internet.
Chapter 3
Introduction
The term Digital Inclusion is still very new in common use whereas digital divide and digital literacy have entered into common use – and into discussions by policy makers and other stakeholders. Digital inclusion is a much broader category that addresses the other two. “Digital inclusion” has been articulated specifically to address issues of opportunity, access, knowledge, and skill at the level of policy. Whereas discussion around the digital divide tends to focus on the access available to individuals, digital inclusion is meant to signal a focus on a practical, policy-driven approach that addresses the needs of communities as a whole. In short, digital inclusion is a framework for assessing and considering the readiness of communities to provide access to opportunities in a digital age.

5
The ubiquity of the Internet poses challenges and opportunities for individuals and communities alike. These challenges and opportunities have not been evenly distributed. Digital technology has opened new domains of exclusion and privilege for some, leaving some populations isolated from the vast digital realm. Even equitable access, however, is no longer enough - increasingly, digital life requires that users be more than users. Users are now content creators as much as they are content consumers.
Success in the increasingly digitized social and economic realms requires a comprehensive approach to fostering inclusion. Digital inclusion brings together high-speed internet access, information technologies, and digital literacy in ways that promote success for communities and individuals trying to navigate and participate in the digital realm.
Digital inclusion has three broad facets: access, adoption, and application. These facets show the ultimate goal of creating digitally inclusive communities.
Access: Availability, affordability, design for inclusion, and public access.
Adoption: Relevance, digital literacy, and consumer safety.
Application: Economic and workforce development, education, health care, public safety and emergency services, civic engagement, and social connections.
In order to achieve these goals, digital inclusion may be promoted in four significant ways:
By providing free access to public access technologies (hardware, software, high-speed Internet connectivity) in the communities.
By providing access to a range of digital content to the communities. By providing digital literacy services that assist individuals navigate, understand, evaluate, and
create digital content using a range of information and communications technologies. By providing programs and services around key community need areas such as health and
wellness, education, employment and workforce development, and civic engagement.
It is increasingly recognized that the so-called digital divide is not just a matter of Unavailability of information and communication technologies (ICTs), but also of the social, political, institutional and cultural contexts which shape people’s lack of access to ICTs, or their inability to use them effectively (Warschauer 2003). These problems apply to the socially excluded in all countries of the world, the Fourth World in the language of Castells (1998). However, it can be argued they are particularly acute in the developing countries, where large numbers of people do not have access to technology, nor the educational background or support to develop their skills in using technology to improve their own lives, or the lives of the communities within which they live. One response to the above over the last decade or so has been a variety of digital inclusion projects in a wide range of contexts and countries (Hunt 2001; Kanungo 2003; Salvador et al 2005
3.1. Thrust on Digital India
Government of India has launched an ambitious program named Digital India. The Digital India programme is a flagship programme of the Government of India with a vision to transform India into a digitally empowered society and knowledge economy. The program has nine pillars. These are:

6
Broadband Highways, Universal Access to Mobile Connectivity, Public Internet Access Programme, e-Governance: Reforming Government through Technology, e-Kranti - Electronic Delivery of Services, Information for All, Electronics Manufacturing. Coordinated by the Department of Electronics and Information Technology the program is a major initiative of the entire Government. Significant progress in terms of creation of infrastructure as well as mounting of policies that would reap the benefit of the digital revolution have been launched. It is in this broader context that we explore to what extent does the world of digital access and information technology touch the lives of the lay people in rural areas; to what extent are the included in this major program of transformation and what the barriers to their inclusion are.
3.2 Meaning of Digital Inclusion
“Digital inclusion is the ability of individuals and groups to access and use information and communication technologies.”1. The definition requires both access and ability to use the information as well as modern internet based communication technology. The Digital Empowerment program aims to create a digitally empowered society and a knowledge economy. Clearly inclusion is a precondition to empowerment. Thus the goals of the Digital Program would be served only if all the citizens in the country were digitally included. Hence it is important to understand to what extent our citizens are digitally included to know how close or how far they are from being digitally empowered. The term Digital Inclusion is still very new in common use whereas digital divide and digital literacy have entered into common use – and into discussions by policy makers and other stakeholders. Digital inclusion is a much broader category that addresses the other two. Importantly, “digital inclusion” has been articulated specifically to address issues of opportunity, access, knowledge, and skill at the level of policy. Whereas discussion around the digital divide tends to focus on the access available to individuals, digital inclusion is meant to signal a focus on a practical, policy-driven approach that addresses the needs of communities as a whole. In short, digital inclusion is a framework for assessing and considering the readiness of communities to provide access to opportunities in a digital age.
3.3 Benefits:
Huge benefits are seen to accrue from large scale digital inclusion. Citizens who are digitally empowered would be able to know access and use all public services made accessible through digital; that is; IT enabled platforms. They would be able to access a whole new world of information and knowledge. They would be able to access markets and participate in e-commerce. Governments would be able to reach out directly to citizens with the services they need. The sharp reduction in the distance between the use and the provider of public citizens is expected to cut whole layers of intermediaries and hence introduce much needed efficiency and transparency in the Government functioning and Government-citizen interaction. Such improvement in efficiency and transparency will have the attendant benefits of reduction in mis-direction of resources and reduction of corruption in the system. Numerous examples of such benefits coming through in reality are cited by the advocates of digital inclusion as well as the State functionaries. As ay citizens the authors themselves note huge gains in efficiency and transparency in e.g. banking, insurance and travel sectors which touch their lives on a daily basis. 1 Institute of Museum and Library Sciences, “Building Digital Communities: A framework for Action”, pp 1; University of Washington, 2010

7
3.4 When will Digital Inclusion happen?
During the 70’sthe concept of e-governance has emerged in India focussing on the development of the in- house government applications in the areas of defence, economic monitoring, planning and the deployment of Information and technology to manage data intensive functions related to elections, census, tax administration etc. The process has been initiated with the establishment of National Informatics centre (NIC) in 1976. Since then NIC is instrumental in steering and carries out all the e-government and e-governance applications in centre, state, district, block and upto the grassroot level administration.
The 11th report of the 2nd administrative reforms commission, entitled “promoting e-governance”-the smart way forward” established the government’s position that an expansion in e-government is necessary in india. In 2006, The National e-Governance Plan (NeGP) has been created by the Department of Electronics and Information Technology (DEITY) and Department of Administrative Reforms and Public Grievances (DARPG) which aimed at long term growth of e-governance within the country. It is a plan of government of India through which all the government services will be available.
The Digital India started with establishment of CIC (Common Information Centers) at District level which gradually extended upto Block level. The efforts resulted in establishment of Broadband connectivity upto GP level with supply of Computer, Modems and VSAT .
For wide scale digital inclusion to happen we would require enabled environment and suitable conditions needed to exist for citizens to be included. The citizens themselves need to acquire relevant skills and capacities. All electronic gadgets run on electricity or rechargeable batteries hence, electrification of places where the citizens live is a must. In other words, universal electrification of the villages/ town is a pre-condition for digital inclusion. Data network have to be available for any internet based communication to occur. Users need to have access to a device which can access the network and have to be able to physically and financially access data networks. Citizens need the skills of using the device, logging on the network and navigating on the web. They need to know what services are available on which platforms. They need to be able to negotiate their way on those websites. Finally they need to effectively interface between the digital and the analogue world by understanding what do the instructions and information on the digital platform expect them to do in the real world. Digital inclusion can happen only if all these conditions are fulfilled.
3.5. Objective of the study:
Generally speaking adoption of new technology requiring investments and adoption of behaviours appropriate to new technology are more likely to happen among better off, higher caste (or social status) males living in well connected villages rather than women belonging to SC /ST and backward classes and living in far flung and remote places. Migrant workers who leave their homes and work in far off locations need to rely on digitally enabled public services and communication methods more than stagnant yet high caste farmers. Thus this technology perhaps more strongly meets needs of classes who tend to adopt other technologies more sluggishly. We therefore wish to explore if the pattern indicated by the data pertaining to digital inclusion conforms to the usual pattern of technology adoption as stated above or makes a break from it.

8
We are aware that aside from the Digital India program of the Government of India, private companies and philanthropic organizations have mounted programs for promotion of digital inclusion. We are also aware that ceaseless push for including all citizens in the fold of formal banking institutions through programs like Jan DhanYojana, push for Direct Benefit Transfer to bank accounts of beneficiaries, push for linking mobile numbers, bank accounts and PAN cards to Aadhar and only a partially slowed drive for having every citizen acquire an Aadhar cards, would exert a pressure for motivating people to get digitally included. The study have no desire to evaluate these or other efforts that are currently underway in the broad rubric of Digital India program. India is continent size country in which the combinations of necessary external conditions and features of human capacity are likely to be numerous. We wish to characterize the situation regarding digital inclusion of rural citizens as prevailing in the year 2018. Specifically we wish to
Make a rough estimate of the proportion of citizens who are digitally included; Understand the factors which favour digital inclusion Understand the barriers to digital inclusion Understand unintended consequences of digital reach Suggest ways for furthering digital inclusion
3.6. Context:
The study is designed to know the digital divide and the extent of digital inclusion in the North East Region (NER) with particular emphasis of Assam commissioned by Vikash Anvesh Foundation. The North East Region remains one of the most backward regions of the country. History, Geo-Politics and Partition has left behind backlash which continues. The total area of the region is about 2,55,168 sq. km which is characterized by river plains, hills and plateaus etc. The region is connected to the main land through a narrow 27 km Chicken neck corridor, making it a “remote land” and constraining access for movement of goods and services and people. The north eastern states mostly inhabitated by a number of native tribes. Each tribe has its own distinct culture, dance, music and life style. The region is ethnically and linguistically diverse. For years the people of N.E region fought with problems like insurgency, unemployment and lack of infrastructure and communication etc which left it isolated from the advances made in other parts of India.
The NER comprises of 8 states viz Arunachal Pradesh, Assam, Manipur, Meghalaya, Mizoram, Nagaland, Sikkim, Tripura.(refer : www.mdoner.gov.in). The region shares international boundaries with China, Myanmar, Bhutan, Bangladesh having a substantial potential to promote trade and business in this age of digitization and internet revolution.
NER is still lagging behind in development indices considering the factors marred by Geographical isolation, Climatic and Environmental factors, lack of initiatives by the Agencies etc. The silver lining is that it is one of the country’s richest in terms of Natural Resources, with an immense endowment of water, forest, bio-diversity and minerals.
The landlocked states of NER have huge potential for growth however the Development has not been as desired much to the fact due to the fact of underdeveloped infrastructure. Government of India has given thrust on economic developing the region by unveiling “Look East Policy” in 1990 has been redesigned as “ Act East Policy” in July 2008 to accelerate the development. Digital inclusion is more relevant for the region considering the underdeveloped infrastructures and sub structures to aid in the process.

9
This particular topic is commissioned to RGVN, established in the year 1990. It was the first venture of its kind on social enterprise promotion at a time when the economy has started to open up and the growth scenario in the Eastern part of India was at a difficult phase. The first promoter of RGVN was IFCI followed by IDBI as major promoters. RGVN is registered under Societies Registration Act. XXI of 1860 with the Head Quarter at Guwahati, Assam.
RGVN was set up with the vision of “reaching the unreached’’ to touch the lives of people living in the remote areas of the region. RGVN has witnessed the development activities going through tremendous changes at the grass roots level. The advent of mobile telephony and use of internet has made implementation of development projects easier. RGVN experienced it in its own practices at the grassroots level, where it is easier to take photographs and send at the click of the mouse. It has made the monitoring of projects easier.
Government owned BSNL (Bharat Sanchar Nigam Limited) serviced NER till 2003-04. Private operators started its operations in 2003-04 with Reliance providing mobile telephony which saw an advancement of technology to reach the nook and corners of the NER through private operators like Airtel, Aircel, Vodaphone , Reliance Jio setting up their operations in recent years.
Recently NER has seen start of 4G which have led to a revolution of sorts to reach urban, semi urban pockets. We are yet to estimate the extent of changes it has brought to the lives of the people in rural and semi urban pockets. This study is a timely intervention to know to what extent Digital revolution has touched the lives of people across the sections of society. It also examines the access, affordability, adaptability of such services being offered. The study offers insights on digital inclusion in rural areas of Assam in particular.
A brief Status of Digital Inclusion in NER2 :
In NER there is a huge Demand and Supply gaps considering the Geographic isolation and strategic importance. The present status of NER states on Digital Connectivity is as below3:
Table 1 : Present status of Digital Connectivity in NER ( Census 2011)
States Computer (%)
With Internet
(%)
Without Internet
(%)
Phone used (%)
Landline ( %)
Mobile (%)
Both (%)
Sikkim 11.5 3.3 8.2 73 1.8 67.7 3.5Arunachal Pradesh
8.2 2 6.2 48.3 2.9 39.8 5.6
Nagaland 8.9 1.7 7.2 53.1 1.3 48.6 3.2Manipur 9 2.1 6.9 57.5 3 52.3 2.2Mizoram 15.2 2.5 12.7 72.8 1.7 63.9 7.2Tripura 7.2 1 6.3 48.1 2.1 42.7 3.3
2 News items published “sulabh swachcha bharat “ date : 27 June 27, 2018, KPMG-FICCI, September 2018 3 Census of India, 2011

10
Meghalaya 7.6 1.5 6.1 43 1.5 39.1 2.4Assam 9.3 1.6 7.7 47.9 2.2 43.4 2.3All India 9.4 3.1 6.3 63.2 4 53.2 6
In the eight States of NER there are 12017 GPs, out of these 7338 GPs were taken up in Phase I and 2240 GPs are service ready.The Telecom Commission in January 2018 meeting has approved a comprehensive strategy to implement BharatNet in North East Region (NER). Under this strategy 4240 Gram Panchayats in the North-East are to be connected by satellite connectivity by December 2018. Under Comprehensive Telecom Development Project for NER, 6673 towers are to be setup to provide connectivity to 8621 villages and along the National Highway. MoUs have been signed between BSNL and USO Fund to setup up 2817 mobile towers by BSNL in Arunachal Pradesh and 2 districts of Assam while the work of setting up of 2004 towers in six states has been initiated by Bharti Airtel in December, 2017, which is to be completed in 18 months.It is indicated that the Asthamangal Project implemented by BSNL to the nation will cover especially the citizens of North Eastern States. Under this project, alternate bandwidth of 810 Gbps at a cost of about Rs. 35 crores has been provided by BSNL using reliable connectivity through Optical Power Ground Wire (OPGW) of Power Grid Corporation of India (PGCIL) for all State Headquarters and other important locations of NE Region. With implementation of this project, connectivity in all Eight States of North Eastern Regions will improve and the people of North East Region will benefit by 2020.To expand mobile connectivity, 6994 mobile towers will be erected by June 2019. For providing last mile connectivity through BharatNet, all the Gram Panchayats will be connected by December 2018, including satellite connectivity in the difficult and inaccessible Gram Panchayats.The need for support and facilitation for telecom projects in NER by all the NE states in terms of ROW permissions, land use permission, availability of power connections, availability of buildings to house end equipment and the custodians for such equipment is highlighted by the officials.
Chapter 4:
Methodology:
We have conducted the study through sample survey of 2 Districts covering 3 villages. .Goalpara and Barpeta . We have conducted personal interview with the community, men and women. The sample size is 163 nos.
We have also conducted FGD (Focused Group Discussions) in 4 areas of Goalpara, Barpeta and a Semi –Urban center in Khetri and a Sonaighuli, Guwahati an urban Center. The methodology used has given personal insights on digital inclusion. We have taken the support of field level

11
staffs while carrying out the study. We did orientation on the survey questioners which are filled up by the field staffs by house to house visits. We also conducted FGDs at village level. These FGDs offered a good opportunity to throw the open ended questions to probe the extent of digital inclusion. We have mobilized the community in a meeting where we have communicated the purpose of the study. We mobilized a group of 11-15 people. The FGD included people from all ages, men and women as well as young and old people. It was an interesting process to ask the questions on mobile network, availability and the questions on probable future impact.
It may be noted here we require a different approach of asking the questions where many of the participants in the group didn’t understand the questions. We took time to make them understand. During the process of conducting FGD it has come to notice that people expected it to be a new project in the village. These questionnaires are transferred for analysis into excel sheets and final analysis is done. The findings are presented in Chapter 5
3.2 Structuring the research:
The study is structured in finding the answers to close ended questions. In the personal surveys household is taken as unit. In FGD, we note down the reponses in the survey format. We record the no of people responding yes or no. The percentage is calculated based on the no of people present during the FGD. The response to yes is coded as 1 and no is coded as 0. The responses are entered into excel sheets and then percentage is calculated. We also calculated the average of the responses to reach at a conclusion. We inserted the graphical representations for easy understanding of the results.
Chapter 5
An Overview of Findings:The study concentrated in 3 villages of Assam covering Barpeta and Goalpara District towards Meghalaya border.
Barpeta District is located in lower Brahmaputra Valley at a distance of about 140 km towards North West from Assam’s Capital City Guwahati. The Total Geographical Area of the District is about 2677.33 sq km (Census Report 2011). The topography if the District is almost falt with gentle slope towards South. The Southern Part i.e. close to Northern Bank of Brahmaputra is low lying flood plain zone. The Geo Climatic condition of Barpeta District is conducive for cultivation of variety of Agricultural Crops, the principal sources of supplementary income and nutrition for rural households in the District. Administration wise, the district comprises 9 sub-districts, 9 towns and 835 villages . According to 2011 census the district has a population of 16,93,622 (Person) out of which 8,67,004 are males and 8,26,618 are females. The district has a sex ratio of 953 females for every 1000 males. In the year 2001-2011 the population growth rate in the district was 2.82% (Person) including 2.17% are males and 3.51% are

12
females. The major religions in the district are Muslim and Hindu with 70.74% and 29.11% of the total population respectively
Goalpara is a district of Assam state with its administrative headquarters located at Goalpara town. it is bounded by the Brahmaputra River on the North, East Garo Hill district of Meghalaya on the South, Kamrup district on the East and Dhubri district on the West. The climate of the district remains neither too hot in summer and nor too cold in winter. The actual rainfall in the district was 3090.4 mm in the year of 2015-16. Administration wise, the district comprises 5 sub-districts, 11 towns and 829 villages. There are 2 Parliamentary Constituencies and 4 Assembly Constituencies in the district. According to 2011 census the district has a population of 10,08,183 (Persons) out of which 5,13,292 are males and 4,94,891 are females. The district has a sex ratio of 964 females for every 1000 males. In the year 2001-2011 the population growth rate in the district was 22.64% (Persons) including 22.14% are males and 23.17% are females. The major religions in the district are Muslim and Hindu with 57.52% and 34.51% of the total population respectively.
The study covered Kachumari, Bakripara in Goalpara District and Jotia Village in Barpeta District.
The initial findings of the study is presented here.
A.4. 1. Access and Infrastructure:
It is found that 63.2% respondents agreed that data network is available in the village and 36.8% responded data network is not available in the village surveyed. 63% respondents told network quality is good and 37% responded as no. The network service providers are Airtel, Jio , Vodafone. Internet quality is not stable with availability of 2G/3G.
Graphical representation 1 : Data Network Availability
yes no
63.2
36.8
Data Network availability
Towards the interior part of the village network cannot be found in certain locations of the village. On the roadside network is available.
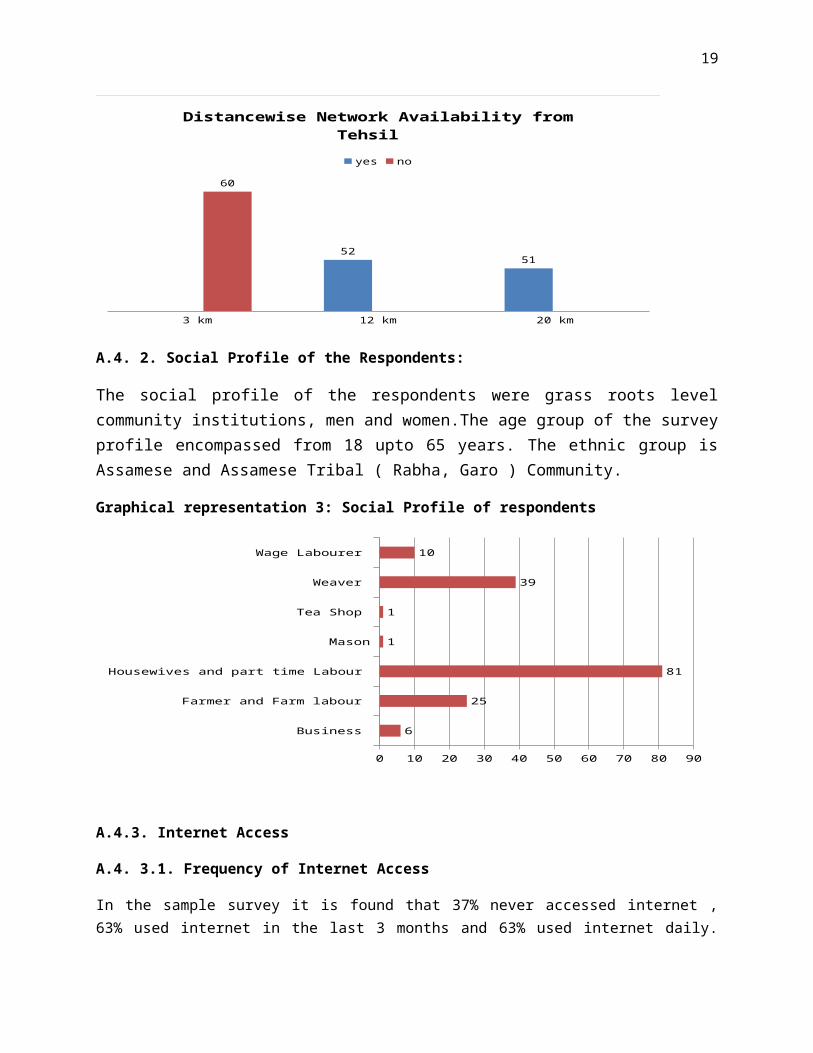
Distancewise Network Availability: It is found that in Barpeta even though it is only 3 km from Tehsil network availability is poor. However , In Goalpara , it is 12 -20 km from Tehsil , network is available. The reason may be that the villages at a greater distance from Tehsils are more connected to the Tehsils by the Operators . The network quality remains poor in all the villages . They get 2G/3G services only.

13
Graphical representation 2: Distance wise Network availability from Tehsil
3 km 12 km 20 km
60
5251
Distancewise Network Availability from Tehsil
yes no
A.4. 2. Social Profile of the Respondents:
The social profile of the respondents were grass roots level community institutions, men and women.The age group of the survey profile encompassed from 18 upto 65 years. The ethnic group is Assamese and Assamese Tribal ( Rabha, Garo ) Community.
Graphical representation 3: Social Profile of respondents
Business
Farmer and Farm labour
Housewives and part time Labour
Mason
Tea Shop
Weaver
Wage Labourer
0 10 20 30 40 50 60 70 80 90
6
25
81
1
1
39
10
A.4.3. Internet Access
A.4. 3.1. Frequency of Internet Access
In the sample survey it is found that 37% never accessed internet , 63% used internet in the last 3 months and 63% used internet daily. Here Household is taken as a sample not the individual . The man or woman surveyed maynot have accessed internet daily however the children have used the internet in some or the other form.

14
Graphical representation 4: Frequency of Internet Access
Have Never Accessed Internet
Accessed in the last 3 months
Access internet daily
0 10 20 30 40 50 60 70
37
63
63
A.4. 3.2. Age wise use of Internet Access :
It is found during survey that internet use is more prevalent among the age group of 21-30 years . Here is this age group 61% have used internet. It is interesting to note in the age group 31-50 years the use of interne is less. It is static use of internet in this age group of people. Perhaps this group of people is nowhere in the middle on use of internet. It again decreases with advancing age from 60 + years onwards. It has been a surprising to find that the youth in the villages are not using internet. 67% youth never used internet. It may be because of the reason that most of the youth from these villages have migrated out of the village to work in cities. The rest are busy in studies or engaged in household work to give importance to internet.
Graphical representation 5: Age wise Internet Use
< 20 year 21-30 years
31-40 years
41-50 years
51-60 Years
>60 years0
10
20
30
40
50
60
70
80
90
Age wise Internet Use
Have never accessed internet : Have accessed internet in last 3 months Access internet daily
A.4. 3.3. From where Internet is accessed:
It is found that out of the sample size 85% accessed internet from home and 15% accessed internet away from home. It infers that internet accessibility has reached home through mobiles to the households than

15
Cyber Cafes. It can also be understood that the booming business of Cyber cafes has gone down considerably.
Graphical representation 6: Place of Internet access
Have accessed internet from home
Have accessed internet away from home (Cyber-cafes or equivalent)
0 10 20 30 40 50 60 70 80 90
85
15
A.4. 3.4. Use of internet Gateways at present situation:
We tried to understand what is the internet gateway in the current situation in those areas . How often people go to Cyber cafes or outside home to friends, relatives house for internet access. 99% people responded they have travelled for accessing internet in their life time. No person have gone to a library for internet use. 63% people have gone either to a friends, family friends, relative’s house for accessing internet. 37 % used have gone out of the village to access internet. The people in this area go to a GP Office, Sub outpost for getting Government benefits in a radius of 15-37 km from the village. Thus it can be inferred the Cyber café use have gone down considerably. The libraries have gone out of circulation as a medium of information like earlier times where books and magazines’ have served as a only source of information in the villages.
Graphical representation 7:Use of internet Gateways
No I don’t travel
Library
To family members house
Travel to a familys home
Internet Café
0 20 40 60 80 100 120
99
0
63
63
37
A.4. 3.5. Use of internet Gateways at present situation:

16
It is found 63% people used internet for Government and Bank benefits. No person in the sample size used it for Wiki and the like, which is understandable by observing the social profile of the respondents. 98% used it for social media. 63% used for infotainment channels.
Graphical representation 8: Use of Internet Gateways in present situation
Only Social Media
Infotainment channels
Wiki and the like
Government or Bank sites
0 10 20 30 40 50 60 70 80 90 100
98
63
0
63
A.4. 3.6. How Internet is accessed:
Here we tried to understand how the village population access internet. We tried to understand among the people who use internet daily how are they accessing it. The results show that 75% internet users have a Mobile handset (Smart Phone). 63% among the internet users have accessed it from a personal computer, laptop or a tablet. It also shows that there are no fixed broad band services in these villages. They have never accessed to a device and data on share time basis. These are irrelevant in these villages. The scenario may be different in urban and semi –urban pockets.
Graphical representation 9: How the Internet is accessed
Have personal computer / / Laptop / Tablet Computer in household
(Own or use) Mobile internet from a Smart Phone
Have fixed broadband
Have access to device and data on share time basis or on familial/kinship basis
0 10 20 30 40 50 60 70 80
63
75
0
0
4.A.3.7. Electricity :
97% respondents said villages are electrified. 3% responded it it not electrified. Majority of the people 87% responded that villages are 50-75% electrified. 87% have again responded as 25-50% households are electrified. It is evident electricity have reached the villages, however, the power supply in these villages is 6-8 hours in a day. It can be understood that in rural areas

17
power situation has not improved upto the desired level. There are no solar power facilities in these areas. There is scope for solar energy in the villages as it has not reached NER as much as it has happened in rest of India. There is still much to be done in power sector. It is intricately related to power supply either electricity or solar power for digital inclusion as the devices run on batteries. Thus the devices require a regular source of power to recharge it for use.
A.4. 3.8. User Digital Ability, Affordability, Incentives:
Here we tried to understand the digital ability, affordability, incentives of the users. We tried to understand whether the population is digital savvy, use the common knowledge to reap the benefits of internet use and whether they can get incentives out of the internet use. It is found that 98% people can turn on the Computer or the Smart Device on among the users. 95% independently log on to a network, which implies they can use inbuilt app in the basic devices like facebook , google, browser etc by clicking on the mobile screen. This also meant the respondents as a Household unit. Even if the parents don’t know the children knows how to log on to internet. 100% agreed that can navigate the web. 91% can creatively use search words in the internet for information. 91% can understand the language for transacting with the websites.
Graphical representation 10 : User Digital Ability, Affordability and Incentives
a) Turn the computer / smart device on
b) independently log on to a network
c) navigate on the web
d) creatively use key words for searching information on the web
e) understand the language for transacting with the websites
86 88 90 92 94 96 98 100
98
95
100
91
91
A.4. 3.9 . Using Internet :
It is found that 23.35% of the population has used internet for Online Booking of Air/ Bus Tickets. 74.8%
have accessed Internet for Government services and Benefits. 60.7% have applied or claimed benefits
online. Only 1.2 % have used internet for online tax payments or paying bills. 61.3% have used online
Banking services. By online Banking services it meant use of ATM Debit Card for taking out money
from Bank Accounts. Other use of online Banking includes use of Paytm by their children who are
studying outside or working outside who sends money home by Online transfer.
Graphical representation 11: Purpose of using Internet

18
a) Online booking of air/rail/bus tickets
b) Accessing government services,
c) Applying for / claiming benefits online,
d) Online tax payment
e) Online Banking
0.0 10.0 20.0 30.0 40.0 50.0 60.0 70.0 80.0
23.3
74.8
60.7
1.2
61.3
Using Internet
A.4. 3.10. Online Commerce and enjoying the Digital World:
It is found that 62% of the surveyed population used online shopping . The children normally gave orders on flipkart and give a nearby address like Goalpara , Krishnai etc and Collect the products from there. None has used internet as Hobbies or Leisure activity in these areas. 37.4% used Social Networking sites like Facebook /Whatsapp etc. 1.2% of the children in the HH surveyed internet for research purposes. 62.6% of the surveyed population used internet for job searches / applications downloading etc. 62% used it for streaming/ watching/ downloading TV, Programmes / Videos/ Films etc.
Graphical representation12: Enjoying the digital world
19
a) Online shopping,
b) Cloud computing,
c) E-mail,
d) Hobbies / leisure,
e) Social networking,
f) Research,
g) Job searches / applications,
h) Streaming / watching / downloading TV, programmes / films
0.0 10.0 20.0 30.0 40.0 50.0 60.0 70.0
62.0
0.6
60.7
37.4
1.2
62.6
62.0
Agewise use of Internet and the habits/purpose: It is found that the highest use for online shopping is in between the age group of 31-40 years. The least use is among >60 years of age group. Cloud Computing which is more of academic in nature or little towards official purposes the use is almost zero. Highest use of email was by the age group of 31-40 years followed by < 20 years age group which gradually declines at > 60 years. Internet use is nil for Hobbies / Leisure activities among all age groups. Use of Social Networking is the highest among < 20 years of age group which shows declining trend to again shown a rise among > 60 years of age group. In rural-semi urban setting use of Social Networking is least in 31-40 years of age. No use for research activities by any of the age group. Use for Job searches and applications is the highest among 21-30 years followed by < 20 years of age which declines to > 60 years of age. Streaming/ Watching /Downloading TV Programmes and Films are the highst among 31-40 years followed by < 20 years of age then 41-50 years and gradually declines with > 60 years age group.
Graphical representation 13: Age wise use of Internet and the habits/purposes

20
a)
O
nlin
e sh
oppi
ng,
b)
Cl
oud
com
putin
g,
c)
E-
mai
l,
d)
Hob
bies
/ le
isur
e,
e)
So
cial
net
wor
king
,
f)
R
esea
rch,
g)
Jo
b se
arch
es /
app
licati
o...
h)
Str
eam
ing
/ w
atch
ing
...
66.6666666666667
0
66.6666666666667
0
100
0
66.666666666666766.666666666666758
3
58
0
39
0
61 6172.8813559322034
0
69.491525423729
0
30.5084745762712
1.69491525423729
69.49152542372969.49152542372963.4146341463414
0
63.4146341463414
0
34.1463414634145
2.4390243902439
65.853658536585163.4146341463414
47.0588235294118
0
47.0588235294118
0
47.0588235294118
0
52.941176470588252.941176470588220
0
20
0
60
0
20 20
< 20 year
21-30 years
31-40 years
41-50 years
51-60 Years
>60 years
B. Findings from FGD (Focused Group Discussions)
The findings from FGDs are presented here .The responses are outlined in the groups of 12-15 people and converted into understanding the general attitude of the population through the FGD. The findings are just indicative it doesnot represent the absolute fact. It just indicates the qualitative understanding on the status of Digital Inclusion.
B.4. 1. Motivation and Attitude of the People towards use of Internet:
B.4.1.1. Attitude and Motivation for Digital Inclusion:
Majority 66% people agreed that Computers and Technology gave them more control over their life. We can conclude that Computers have changed life even in rural areas and semi urban areas. We have 25% people who are not using Computers and Technology to have any impact in their life.
Graphical representation 14: Graphical Representation of attitude and motivation for Digital Inclusion

21
Strongly Agree
Agree
Neutral
Disagree
Strongly DisagreeCo
mpu
ters
and
tech
nolo
gy g
ivem
e m
ore
cont
rol o
ver
my
life
0 10 20 30 40 50 60 70
66
9
25
Attitude and Motivation for Digital Inclusion
Findings on Rural , Semi-Urban areas are as followed : It is found in all the areas people agreed on Computers and Technology giving them more control over their life except Barpeta area.
Graphical representation 15:Place wise depiction of Computers and Technology controlling life
Strongly Agree Agree Neutral Disagree Strongly Disagree0
20
40
60
80
100
120
76.9
23.1
87
13
100 100
Computers and technology giveme more control over my life
Series1 Barpeta Khetri Goalpara (KM) 1 Goalpara (BP) 2
B.4.1.2. Interest in being able to access the internet everywhere:
It is found that 88% people are interested to access internet in the rural and semi urban settings. 15% remained neutral. Resistance is very less to internet access. The people are interested to access internet wherever they are.
Graphical representation 16: Interest in accessing internet from everywhere

22
Strongly Agree
Agree
Neutral
Disagree
Strongly Disagree
I am
inte
rest
ed in
bei
ng a
ble
to a
cces
s th
e in
tern
et w
here
ver
I am
0 10 20 30 40 50 60 70 80 90 100
88
15
3
2
Findings on Rural , Semi-Urban areas are as followed : It is found that people in general are interested in being able to access internet everywhere. 13% disagreed and 7.7% strongly disagreed in rural areas.
Graphical representation 17: Place wise interest in being able to access internet everywhere
Strongly Agree Agree Neutral Disagree Strongly Disagree0
20
40
60
80
100
120
100
53.8
38.5
7.7
67
2013
100
Interest in being able to access internet everywhere
Barpeta Khetri Goalpara (KM) 1 Goalpara (BP) 2
B.4.1.3.
It is found that people normally are curious to learn about new things. Here in the sample size we have found 78% of the population is curious to know and learn about new technology or to be first adopters. 23% people remained neutral about new technology or adoption which is the population who remain at the bottom of the pyramid.
Graphical representation 18: Interest in going out of way to learn about new Technology

23
Strongly AgreeAgree
NeutralDisagree
Strongly Disagree
I go
out
of m
y w
ay t
o le
arn
eve
ryth
ing
I can
ab
out
new
tech
nolo
gy
0 10 20 30 40 50 60 70 800
7323
4
Ineterest in going out of way to learn everything about new Technology
Findings on Rural , Semi-Urban areas are as followed : It is found that people in general are interested in being able to access internet everywhere.
Graphical representation 19: Place wise interest in going out of the way to learn about new Technology
Strongly Agree Agree Neutral Disagree Strongly Disagree0
20
40
60
80
100
120
100
46.238.5
15.4
5347
93
7
Interest in going out of the way to learn about new Technology
Barpeta Khetri Goalpara (KM) 1 Goalpara (BP) 2
B.4.1.4. Difficulty in keeping pace with change in Technology:
Majority of people (70%) strongly agreed and agreed that technology is changing so fast, that, it is difficult to keep pace with change in Technology. They agreed strongly that they feel out of place in the scenario of changing Technology.
Graphical representation 20 : Difficulty in keeping pace with Technology

24
Strongly Agree
Agree
Neutral
Disagree
Strongly Disagree
I find
tech
nolo
gy is
chan
ging
so fa
st, i
t’s d
ifficu
lt to
kee
p up
with
it
23
47
2
2
Difficulty in keeping pace with Technology
Findings on Rural , Semi-Urban areas are as followed : It is found that majority of people in rural areas agreed on Technology making it difficult for them to cope up with.90.9% people in Barpeta strongly agreed. 93-86% in Goalapara agreed on it. In semi-urban areas , Khetri , 92.3% remained neutral on it.
Graphical representation 21: Place wise depiction of Technology making it difficult for people to cope up
Strongly Agree Agree Neutral Disagree Strongly Disagree0.0
10.0
20.0
30.0
40.0
50.0
60.0
70.0
80.0
90.0
100.090.9
9.1
93
7
86
14
92.3076923076923
7.69230769230769
Fast Change of Technology making it difficult for People to cope up with
Barpeta Khetri Goalpara (KM) 1 Goalpara (BP) 2
B.4.1.5. Keeping the Computer updated with security software:
There are only 1-2 Computers in the villages. Hence the result shows that updating computers with security software did not hold much importance. The Mobile Handsets are not much related with updating the security software.
Graphical representation 22: Keep Computers updated with security software

25
Strongly Agree
Agree
Neutral
Disagree
Strongly Disagree
I kee
p m
y co
mpu
ter u
p to
dat
e w
ith se
curit
y so
ftwar
e
0 10 20 30 40 50 60
0
7
52
15
25
Findings on Rural , Semi-Urban areas are as followed : It is found that people in general are neutral in keeping Computer software protected. It shows the lack of Computers and knowledge on Computers.
Graphical representation 23: Place wise depiction of Keep Computers updated with security software
Strongly Agree Agree Neutral Disagree Strongly Disagree0
20
40
60
80
100
120
15.420.0
61.5
7
93
7
93100
Keeping Computer softwre protected
Barpeta Khetri Goalpara (KM) 1 Goalpara (BP) 2
B.4.2. Basic Skills for Use of Internet by the next Generation
We tried to understand how the people take the innovations in internet use during the FGDs. WE also tried to understand how they would like their children to know about the skills in use of internet.
B.4.2.1. General Internet Skills:

26
It is found that 83% population agreed that their children should know about the general internet skills. Majority of the population has aspirations for their children to develop the skill of general internet use.
Graphical representation 24: General Internet Skills
Strongly Agree
Agree
Neutral
Disagree
Strongly Disagree
Gene
ral in
tern
et sk
ills
0 10 20 30 40 50 60 70 80 90
13
83
4
0
0
In Rural, Semi-Urban areas the comparison is shown as below. In all areas people agreed that their children should know general internet skills.
Graphical representation 24: Place wise depiction of General Internet Skills
Strongly Agree Agree Neutral Disagree Strongly Disagree0
20
40
60
80
100
120
53.8
30.8
15.4
0.0 0.00
100
0 0 00
100
0 00
100
0 0 0
General internet skills
General internet skills Khetri Barpeta Goalpara (KM) 1 Goalpara (BP) 2
B.4.2.2. Mobile Phone Skills:
It is found that 94% people agreed that their children should learn about Mobile phone skills .
Graphical representation 25: Mobile Phone Skills

27
Strongly Agree
Agree
Neutral
Disagree
Strongly Disagree
Mob
ile p
hone
ski
lls
0 10 20 30 40 50 60 70 80 90 100
4
94
2
0
0
In Rural, Semi-Urban areas the comparison is shown as below. In all areas people agreed that their children should know Mobile Phone Skills. Only in Semi urban areas a miniscule 7.7 % were neutral on use of Mobile Phone by children as they fear it will disturb their education by too much use of internet. They agreed that children as adults should know how to use Mobile phones.
Graphical representation 26: Place wise depiction of Mobile Phone Skills
Strongly Agree Agree Neutral Disagree Strongly Disagree0.0
20.0
40.0
60.0
80.0
100.0
120.0
15.4
76.9
7.70.0 0.00.0
100.0
0.0 0.0 0.00
100
0 0 00.0
100.0
0.0 0.0 0.0
Mobile Phone Skills
Khetri Barpeta Goalpara (KM) 1 Goalpara (BP) 2
B .4.2.3. Internet Banking Skills :
It is found 86.5% people agreed that their children should know about Internet Banking Skills.
Graphical representation 27: Internet Banking Skills

28
Strongly Agree
Agree
Neutral
Disagree
Strongly Disagree
Inte
rnet
ban
king
ski
lls
0 10 20 30 40 50 60 70 80 90 100
5.8
86.5
1.9
1.7
In all the areas of Rural , Semi-Urban areas people agreed that their Children should know about the Internet Banking Skills except in Semi Urban areas Khetri (23.1% strongly disagreed) , where they fear the children may loose money by internet Banking frauds. At the same time , in semi –urban areas 23% people strongly agreed on use of internet banking skills.
Graphical representation 28: Place wise depiction of Internet Banking Skills
Strongly Agree Agree Neutral Disagree Strongly Disagree0.0
20.0
40.0
60.0
80.0
100.0
120.0
23.1
46.2
7.70.0
23.1
0.0
100.0
0.0 0.0 0.00
100
0 0 00
100
0 0 0
Internet Banking Skills
Khetri Barpeta Goalpara (KM) 1 Goalpara (BP) 2
B .4.2.4. Internet Shopping Skills :
It is found 81.4 % people agreed that their children should know about Internet Shopping Skills.
Graphical representation 29: Internet Shopping Skills

29
Strongly Agree
Agree
Neutral
Disagree
Strongly Disagree
Inte
rnet
sho
ppin
g sk
ills
0 10 20 30 40 50 60 70 80 90
0
81.4
5.4
1.7
11.5
In Rural areas majority of people agreed that their children should know about Internet Shopping Skills. Majority people agreed however in Semi-Urban areas ( Khetri) people are aware about drawbacks of internet shopping ,hence, they have reservations about it. A sizeable percentage (46.2%) strongly disagreed that their children should know internet shopping skills.
Graphical representation 29: Place wise depiction of Internet Shopping Skills
Strongly Agree Agree Neutral Disagree Strongly Disagree0.0
20.0
40.0
60.0
80.0
100.0
120.0
0.0
46.2
7.70.0
46.2
0.0
100.0
0.0 0.0 0.00
87
7 700
93
70
Internet Shopping Skills
Khetri Barpeta Goalpara (KM) 1 Goalpara (BP) 2
B .4.2.5. Internet Community Skills :
It is found that 72.6 % people agreed that their children should know about internet community skills and 22.8% disagreed and negligible 3.8% strongly asserted that it might have wrong impact on their children.
Graphical representation 30: Internet Community Skills

30
In all the rural and semi urban pockets majority of the people agreed that their children should know about internet community skills. In Barpeta District , which is closer to Tehsil have disagreed that their children should know about (46.15%) internet
community skills followed by semi urban center in Khetri where 23.1% people disagreed on use of internet community skills and 15.4% strongly disagreed on the issue.
Graphical representation 31: Place wise depiction of Internet Community Skills
Strongly Agree Agree Neutral Disagree Strongly Disagree0.0
10.0
20.0
30.0
40.0
50.0
60.0
70.0
80.0
90.0
100.0
0.0
53.8
7.7
23.115.4
0.00
53.85
0.00
46.15
0.000
87
7 70
93
70 0 0
Internet Community Skills
Khetri Barpeta Goalpara (KM) 1 Goalpara (BP) 2
B .4.2.6. Internet Information Skills :
Majority of people 85.7% agreed that their children should know about information skills.
Graphical representation 32: Internet Information Skills
Strongly Agree
Agree
Neutral
Disagree
Strongly DisagreeIn
tern
et co
mm
unity
skill
s
0 10 20 30 40 50 60
23.2
50.4
3.6
19
3.8

31
Strongly Agree
Agree
Neutral
Disagree
Strongly Disagree
Inte
rnet
info
rmati
on s
kills
0 10 20 30 40 50 60 70 80 90
0
85.7
6.9
3.6
3.8
In all Rural and Semi-urban centers people agreed that their children should know about internet information skills. However in semi urban area like Khetri (15.4% ) people strongly disagreed on their children knowing the internet information skills.
Graphical Representation 33: Place wise depiction of Internet Information Skills
Strongly Agree Agree Neutral Disagree Strongly Disagree0.0
20.0
40.0
60.0
80.0
100.0
120.0
0.0
76.9
7.70.0
15.4
0.0
100.0
0.0 0.0 0.00
80
20
0 00
86
14
0
Internet Information Skills
Khetri Barpeta Goalpara (KM) 1 Goalpara (BP) 2
B. 4. 3. What activities people surveyed would like to do ( Rural/Semi Urban Areas)
B.4.3.1. Streamed, played, or downloaded content online:
The population surveyed was divided over the opinion on streaming, played or downloading content online. 31.5% agreed and 35.8% disagreed on streaming, playing and downloading content online.
Graphical representation 34: Interest of people in use of Internet

32
Strongly Agree
Agree
Neutral
Disagree
Strongly Disagree
Stre
amed
, pla
yed,
or
do
wn
load
ed c
ont
ent
on
line
0 5 10 15 20 25 30 35 40
0
31.5
1.9
35.8
5.8
B.4.3.2. AV Communication via the Internet
Majority 92.6% population agreed on use of AV Communication via the internet. They responded they would like to keep in touch with their children studying outside and relatives if given a choice via Whatsapp calling , Video calling etc.
Graphical representation 35: Interest of people in AV communication via internet
Strongly Agree
Agree
Neutral
Disagree
Strongly Disagree
AV
co
mm
un
icati
on
via
th
e in
tern
et
0 10 20 30 40 50 60 70 80 90 100
0
92.6
5.5
6
1.9
B.4.3.3. Internet Transaction or Payment :
It is found people are still not confident in use of Internet transaction or payment. They have not used Paytm or other payment system through internet. Only 46.5% population agreed on use of internet transactions or payments.
Graphical representation 36 : Interest of people in Internet Transaction or Payment

33
Strongly Agree
Agree
Neutral
Disagree
Strongly Disagree
Inte
rnet
tra
nsa
ctio
n o
r p
aym
ent
0 5 10 15 20 25 30 35 40 45 50
0
46.4
28.6
0
25
B.4.3.4. Purchase or sale of Products online:
75% people remained neutral on purchase of sale of products online. The online marketing concept hasnot caught on in rural and semi urban areas in Assam.
Graphical representation 37 : Interest of people in Purchase or sale of Products online
Strongly Agree
Agree
Neutral
Disagree
Strongly Disagree
Pu
rch
ase
d o
r so
ld a
pro
du
ct o
nli
ne
0 10 20 30 40 50 60 70 80
0
1.9
75
0
23.1
B.4.3.5. Created or managed a site or blog:
98.1% population never created or managed a site or blog. It is a novel concept for the rural and semi urban areas.
Graphical representation 38 : Interest of people in Creating or managing a site or blog

34
Strongly Agree
Agree
Neutral
Disagree
Strongly Disagree
Cre
ate
d o
r m
anag
ed
a s
ite
or
blo
g
0 10 20 30 40 50 60 70 80
0
1.9
75
0
23.1
B.4.3. Searched for advanced information:
98.1% population never searched for advanced information on internet. By advanced information we meant technical information or scientific information etc.
Graphical representation 39 : Interest of people in searching advanced information
Strongly Agree
Agree
Neutral
Disagree
Strongly Disagree
Se
arc
he
d f
or
ad
van
ced
in
form
ati
on
0 10 20 30 40 50 60 70 80
0
1.9
75
0
23.1
B.4.4. General Awareness
B.4.4.1. Knowledge on how to use Social Media like You Tube , Facebook , Whatsapp etc
It is found that in semi Urban areas the knowledge on how to use Social Media ( You Tube, Facebook , Whatsapp etc) is surprisingly less compared to Rural Areas. The results may show as such due to clubbing of FB, Youtube, Whatsapp together. Some may know on how to use due to inbuilt app in the smart phones. It can be concluded that majority ( > 67%) of the population still don’t know or possess the knowledge on how to use Social Media. The digital divide can be clearly seen. The wrong use of Social Media can result in leaving negative impact on Society without proper knowledge. It is a disturbing trend of spread of Social Media. Anti-Social elements may use Social Media to spread wrong information, rumors and fake news among common mass to leave irreparable damage in the society.
Graphical representation 40 : Place wise Knowledge on how to use Social Media

35
Semi Urban ( Khetri ) Barpeta Goalpara 1 Goalpara 2 0.0
10.0
20.0
30.0
40.0
50.0
60.0
70.0
80.0
90.0
100.0
7.7 9.1
66.7
21.4
92.3 90.9
33.3
78.6
Knowledge on how to use Social Media like Youtube, Facebook, whatsapp.
Yes No Polynomial (No)
B.4.4.2. Use of Digital Products ( Land Records, Access to MGNREGA, IRCTC, e-Trading Platforms for their Agri products , Knowledge of Educational Resources etc )
We tried to understand the use of Digital Products (Land Records, Access to MGNREGA, IRCTC, e-Trading Platforms for their products, knowledge of Educational Resources in Web etc) in Semi-Urban and Rural areas. We have found that In Semi-Urban areas the use of Digital Products is less compared in rural areas. Use of Digital Products is the highest in Barpeta followed by Goalpara . Use of Digital Products is the least in Semi-Urban Areas like Khetri.
Graphical representation 41 : Place wise Use of Digital Products
Semi Urban ( Khetri ) Barpeta Goalpara 1 Goalpara 20.0
20.0
40.0
60.0
80.0
100.0
120.0
7.69230769230769
10093.3333333333333
85.714285714285792.3076923076923
6.6666666666666714.2857142857143
Use of Digital Products ( Land Records, Access to MGNREGA, IRCTC, e-Trading Platforms for their Agri products , Knowledge of Educational Resources etc )
Use No

36
B.4. 5. Findings on a FGD in a Urban Center
We have accessed information of possession of smart phones Urban poor families especially women through a FGD with a Community Based Organization (CBO) which is named as Area Level Federation of a SHG. The results in urban areas show the Digital Inclusion have a long way to go.
Graphical representation 42 : P.C. of people having a Smart Phone among women in a CBO
Individual Bank Account Smart Phone No 0
20
40
60
80
100
120
99.5
55.5
44.5
P.C. of People having Smart Phone and Individual Bank Account in Guwahati
P.C. of People
B.4.6. Barriers for Digital Inclusion
Through FGD we tried to understand the responses which will throw some lights on barriers of Digital Inclusion.It is found that there are barriers which lead to digital divide or digital exclusion of the majority of the people living in semi-urban and rural areas.
1. Lack of Digital Infrastructure :
Digital Infrastructure is broadly defined as submarine/satellite communication networks, towers, infrastructure, wired and wireless communication networks as well as applications supporting the development of this communication network4.
75% people responded that there is a lack of Digital Infrastructure in the villages. There is lack of tower or LAN network. Broad band network has not reached the villages. There is lack of reliable network. It is 2G facilities available in the villages which make it difficult for them access internet at high speed.
2. People’s physical ability in use of Internet :
4 KPMG-FICCI Leveraging Digital Connect North Eastern India , September 2016

37
Physical disability is not a barrier. In case of blindness or any such physical disability, it is difficult to use internet. Majority of people responded about physical disability to be not a barrier for digital inclusion.
3. Lack of affordable Devices :
The Smart devices are very costly which makes it difficult for people in rural and semi urban areas to access internet. 100% people responded that smart devices are very expensive and they cannot afford it. From a sample survey in one CBO it is found that even in an urban setting only 55% urban poor possess smart phones.
4. Lack of Affordable Data Plans :
The data plans are very expensive for the rural population to afford. They responded it is an additional cost or burden to afford the expensive data plans made available by Private operators or the state owned BSNL.
5. Lack of Relevancy of Content of Internet in Rural, Semi urban setting :
A majority of 75% people responded there is no relevancy of the content of internet in rural and semi urban setting. People are not finding beneficial content to improve their livelihoods due to lack of content to suit the local situation. In rural and semi urban areas majority of the population are occupied with earning their livelihoods. They are primarily occupied with Agriculture and allied, Animal Husbandry, Fisheries, Petty business etc. They will be least bothered with internet if the contents are not suitable to their livelihoods. It has to link to their livelihoods to bring in desired benefits of Internet. Streaming of Rural Development projects, information in various field can work wonders if it reaches at higher speed in the rural areas. The population of rural areas are mostly depended on Agriculture and allied for livelihoods. The Digital Inclusion will get widespread acceptance if contents related to Agriculture and allied are made available.
6. Lack of Digital Literacy :
Majority of people responded do not know how to read or write in English and cannot follow the contents in English. The contents are mostly available in English on the internet. . The low level of literacy in English makes it irrelevant for them. Availability of contents in local languages or local context will yield the real results for reaping the benefits to improve lives and make the population digitally inclusive.
The older generation responded they don’t know how to use internet. Efforts have been made earlier on Digital Literacy. It got confined to a limited number of population owing to the cost involved and lack of capacity of the illiterate population in handling the technology. With passing of time the technology advancing to Mobile Phones which is readily available in the market Digital Literacy can extend to the last men and women standing in the pyramid.

38
7. Lack of Regular power supply either Electricity /Solar Power:
In the rural /semi urban areas 50-75% are electrified. It is found that there is irregularity in power supply . There are no facilities of solar power in these areas. It requires a regular supply of power either electricity / solar for the smart devices to work. It may be a barrier for digital inclusion.
8. Social Barriers :
There are no social barriers evident for digital inclusion in rural, semi –urban areas. In all the FGD the people responded there is no social barrier however in one village the women responded the men may not like the women using it too much by neglecting the household and field work. In rural areas the women responded there is no restriction for them from family or society on use of internet or mobile phones. In a semi urban setting it is found that 50% women responded the men may not like women to use internet or social media tools. They would want their children instead to use internet and be Internet savvy in all aspects of General Internet use, Internet Banking skills, Internet Shopping skills etc.

39
Chapter 6:
Recommendations and Conclusions:
Digital Inclusion has not reached the rural, semi urban areas of Assam and NER as envisaged. It is found that the digital infrastructure is poor and lacking in the villages surveyed which show the trend. 63% people use internet for various purposes. Digital inclusion has happened only because it is linked to MGNREGA schemes, Government DBTs linked to Bank Accounts, use of ATMs. There is an urgent need to improve upon e-Governance. Government should concentrate on Digital Infrastructure development. There should be a concentrated drive on Digital Literacy. There should be close partnership between Non-Governmental Organizations, Private Service Providers and Government Agencies in implementation of the same. There should be proper awareness drives on use of Digital Products and Social Media tools to reduce the negative impact. The content in the internet on the Government linked schemes should be in local language for the common people to understand. Every hamlet should be provided with an internet kiosk. The speed of internet should be increased which can happen only if digital infrastructure is improved. It has to be made mandatory for every village in rural/semi-urban areas to be electrified with regular power supply. The scope of solar energy can be explored in NER which is lagging behind. It is required that active participation of Government Agencies and Telecom Operators to converge, collaborate to harness the potential of digitization for the benefit of the entire Rural, Semi-Urban population for a inclusive development in all aspects in the entire NER.
Acknowledgements:
1. Ms Aneeta Dutta, Deputy Director ( Programmes), RGVN for advisory guidance 2. Ms Mrinalinee Khanikar, Senior Programme Coordinator , RGVN-NER for
coordinating the survey, FGDs ,analyzing and compiling the study 3. Shri Robiul Islam, Project staff, Goalpara for field level survey 4. Shri Gangadhar Rabha, Project staff, Goalpara for field level survey5. Shri Aamir Hussein , Project staff, Barpeta for field level survey