images.pcmac.orgimages.pcmac.org/.../AMDM_SLO_STUDY_GUIDE_FY16.docx · Web viewThe Pork ‘n’...
32
AMDM STUDY GUIDE I CAN... Apply statistical methods to design, conduct, and analyze statistical studies. These include identification of the type of study, sampling methods, hypothesis/null hypothesis, questioning, variables, and bias. 1. The essential difference between an experiment and an observational study is what? Stats Scenario 1: In order to assess the effects of exercise on reducing cholesterol, a researcher took a random sample of fifty people from a local gym who exercised regularly and another random sample of fifty people from the surrounding community who did not exercise regularly. They all reported to a clinic to have their cholesterol measured. The subjects were unaware of the purpose of the study, and the technician measuring the cholesterol was not aware of whether or not subjects exercised regularly. 2. Use Stats Scenario 1. This is what type of study? 3. A researcher wishes to determine if playing video games influences violent behaviors in teens. He randomly selects 100 parents and asks them if their children play video games and if they have been in trouble at school for aggressive behavior. What type of study best describes the type of study the researcher conducted? Stats Scenario 2. Do certain car colors attract the attention of police more than others, so that they are more likely to get speeding tickets? A few years ago a curious newspaper columnist tabulated the car color on a random sample of 120 speeding citations at the local courthouse. Here are his results. Color Red White/ Silver Gray/ Black Other Number of speeding tickets 16 33 39 32
Transcript of images.pcmac.orgimages.pcmac.org/.../AMDM_SLO_STUDY_GUIDE_FY16.docx · Web viewThe Pork ‘n’...

AMDM STUDY GUIDE
I CAN...Apply statistical methods to design, conduct, and analyze statistical studies. These include identification of the type of study, sampling methods, hypothesis/null hypothesis, questioning, variables, and bias.
1. The essential difference between an experiment and an observational study is what?
Stats Scenario 1:In order to assess the effects of exercise on reducing cholesterol, a researcher took a random sample of fifty people from a local gym who exercised regularly and another random sample of fifty people from the surrounding community who did not exercise regularly. They all reported to a clinic to have their cholesterol measured. The subjects were unaware of the purpose of the study, and the technician measuring the cholesterol was not aware of whether or not subjects exercised regularly.
2. Use Stats Scenario 1. This is what type of study?
3. A researcher wishes to determine if playing video games influences violent behaviors in teens. He randomly selects 100 parents and asks them if their children play video games and if they have been in trouble at school for aggressive behavior. What type of study best describes the type of study the researcher conducted?
Stats Scenario 2.Do certain car colors attract the attention of police more than others, so that they are more likely to get speeding tickets? A few years ago a curious newspaper columnist tabulated the car color on a random sample of 120 speeding citations at the local courthouse. Here are his results.
Color Red White/Silver Gray/Black OtherNumber of speeding tickets 16 33 39 32
He then went to the state motor vehicle registry and obtained data on the distribution of car colors for all cars registered in his state:
Color Red White/Silver Gray/Black OtherPercentage of cars on highway 14% 35% 23% 28%
4. Use Stats Scenario 2. What are the correct hypothesis and null hypothesis for this study?
5. Use Stats Scenario 2. To answer the question posed above about car color and speeding tickets, the appropriate null hypothesis is:
6. Use Stats Scenario 2. What are the correct expected counts for speeding tickets under the null hypothesis?
7. Use Stats Scenario 2. If it was discovered that black/gray cars were ticketed at a higher proportion than the proportion of registered black/gray cars on the road, what would be an appropriate assumption to draw from this information?

Stats Scenario 3A sportswriter wants to know how strongly Lafayette residents support the local minor league baseball team, the Lafayette Leopards. She stands outside the stadium before a game and interviews the first 20 people who enter the stadium.
8. Use Stats Scenario 3. The intended population for this survey is: : _______?
9. Use Stats Scenario 3.The sample for the survey is: _______?
10. Use Stats Scenario 3. The newspaper asks you to comment on the sampling technique used to perform the survey of local opinion. What would you say about the technique and the quality/accuracy of the results the technique would generate?
11. In order to assess the opinion of students at the University of Minnesota on campus snow removal, a reporter for the student newspaper interviews every 12th student on the entire University roster. The method of sampling used is: _______?
12. A television station is interested in predicting whether voters in its viewing area are in favor of offshore drilling. It asks its viewers to phone in and indicate whether they support/are in favor of or are opposed to this practice. Of the 2241 viewers who phoned in, 1574 (70%) were opposed to offshore drilling. Are the viewers who phoned the population being studied? If they are a sample, what type of sample would they be?
____ 13. A marketing research firm wishes to determine if the adult men in Laramie, Wyoming, would be interested in a new upscale men’s clothing store. From a list of all residential addresses in Laramie, the firm selects a simple random sample of 100 and mails a brief questionnaire to each. The chance that all 100 homes in a particular neighborhood in Laramie end up being the sample of residential addresses selected isA. the same as for any other set of 100 residential addresses.B. exactly 0. Simple random samples will spread out the addresses selected.C. reasonably large due to the “cluster” effect.D. 100 divided by the size of the population of Laramie.E. large since the population of Laramie is small.
14. A public opinion poll in Ohio wants to determine whether or not registered voters in the state approve of a measure to ban smoking in all public areas. They select a simple random sample of fifty registered voters from each county in the state and ask whether they approve or disapprove of the measure. This is an example of what type of sampling?
____ 15. A stratified random sample is appropriate whenA. It is impractical to take a simple random sample because the population is too large.B. The population can be easily subdivided into groups according to some categorical
variable, and the variable you are measuring is quite different within the groups but very similar between groups.
C. The population can be easily subdivided into groups according to some categorical variable, and the variable you are measuring is very similar within the groups but quite different between groups.
D. You intend to take a sample of more than 100 individuals.E. You want to avoid undercoverage of certain groups.
16. To determine the proportion of each color of Peanut Butter M&M, you buy 10 1.69 ounce packages and count how many there are of each color. This is an example of what type of sampling?

17. A 1992 Roper poll found that 22% of Americans say that the Holocaust may not have happened. The actual question asked in the poll was “Does it seem possible or impossible to you that the Nazi extermination of the Jews never happened?” and 22% responded possible. Why can the results of this poll not be trusted?
18. In the late 1990’s Scotland was considering independent from England. An opinion poll showed that 51% of Scots favor "independence." Another poll taken at the same time showed that only 34% favored being "separate" from England. Why do these results differ by so much?
19. Frequently, telephone poll-takers call near dinner time—between 6 pm and 7 pm—because most people are at home them. This is an effort to avoid what type of questioning problem(s)?
20. The Bradley effect is a theory proposed to explain observed discrepancies between voter opinion polls and election outcomes in some elections where a white candidate and a non-white candidate run against each other. The theory proposes that some voters tend to tell pollsters that they are undecided or likely to vote for a non-white candidate, and yet, on election day, vote for the white opponent. This is an example of what type of question/response error(s)?
21. Just before the presidential election of 1936, the magazine Literary Digest predicted—incorrectly, as it turned out—that Alf Landon would defeat Franklin Delano Roosevelt. Landon lost in a landslide. It turned out that the magazine had only polled its own subscribers, plus others from a list of automobile owners and a list of people who had telephone service. All three groups had higher than typical incomes during the Great Depression. This is an example of what type of question/response error(s)?
22. What is the definition of a “closed question?”
____ 23. Which of the following is not a closed question?A. Do you think Donald Trump would make a good president?B. Who is your favorite Democratic candidate in this year’s election?C. What are your feelings about Donald Trump in this election?D. If you vote this year, will you vote Democratic, Republican, Green, or Independent?
I CAN...Determine probability and expected value (conditional probability, probability of compound events, expected value) to make everyday decisions.
24. I toss a penny and observe whether it lands heads up or tails up. Suppose the penny is fair, i.e., the probability of heads is 1/2 and the probability of tails is 1/2. What does this mean?
25. You have been given a unique opportunity. You can take a guaranteed gift of $240 now or you can take a chance. With your chance, you will have a 25% chance of winning $1000 and a 75% chance of winning nothing. What is the expected value if you take a chance?
26. If you sell your stock, you are guaranteed to lose $740. If you keep your stock, you have a 75% chance to lose $1000 and a 25% chance to lose nothing. What is your expected value if you keep your stock?

27. Jim is throwing horseshoes at a target while playing a carnival game. If he hits the target once, he wins $1 and earns the chance to throw again. If he hits the target the second try, he wins an additional $5. If he misses the target the first try, the game is over and he wins nothing. Based on his skill, he has a probability of .40 of hitting the target each time he throws a horseshoe. If he plays the game 10 times, how much is he expected to win?
28. A box has 10 tickets in it, two of which are winning tickets. You draw a ticket at random. If it's a winning ticket, you win. If not, you get another chance, as follows: your losing ticket is replaced in the box by a winning ticket (so now there are 10 tickets, as before, but 3 of them are winning tickets). You get to draw again, at random. Which of the following are legitimate methods for using simulation to estimate the probability of winning? I. Choose, at random, a two-digit number. If the first digit is 0 or 1, you win on the first draw; If the first digit is 2 through 9, but the second digit is 0, 1, or 2, you win on the second draw. Any other two-digit number means you lose.II. Choose, at random, a one-digit number. If it is 0 or 1, you win. If it is 2 through 9, pick a second number. If the second number is 8, 9, or 0, you win. Otherwise, you lose.III. Choose, at random, a one-digit number. If it is 0 or 1, you win on the first draw. If it is 2, 3, or 4, you win on the second draw; If it is 5 through 9, you lose.
Probability Scenario 1If you draw an M&M candy at random from a bag of the candies, the candy you draw will have one of six colors. The probability of drawing each color depends on the proportion of each color among all candies made. The table below gives the probability that a randomly chosen M&M had each color before blue M & M’s replaced tan in 1995.
Color Brown Red Yellow Green Orange TanProbability 0.3 0.2 ? 0.1 0.1 0.1
29. Use Probability Scenario 1. The probability of drawing a yellow candy is
30. Use Probability Scenario 1. The probability that you do not draw a red candy is
31. Use Probability Scenario 1. The probability that you draw either a brown or a green candy is
Probability Scenario 2:Ignoring twins and other multiple births, assume that babies born at a hospital are independent random events with the probability that a baby is a boy and the probability that a baby is a girl both equal to 0.5.
32. Use Probability Scenario 2. The probability that the next five babies are girls is
33. Use Probability Scenario 2. The probability that at least one of the next three babies is a boy is
____ 34. Use Probability Scenario 2. The events A = the next two babies are boys, and B = the next two babies are girls areA. disjoint.B. conditional.C. independent.D. complementary.E. none of the above.

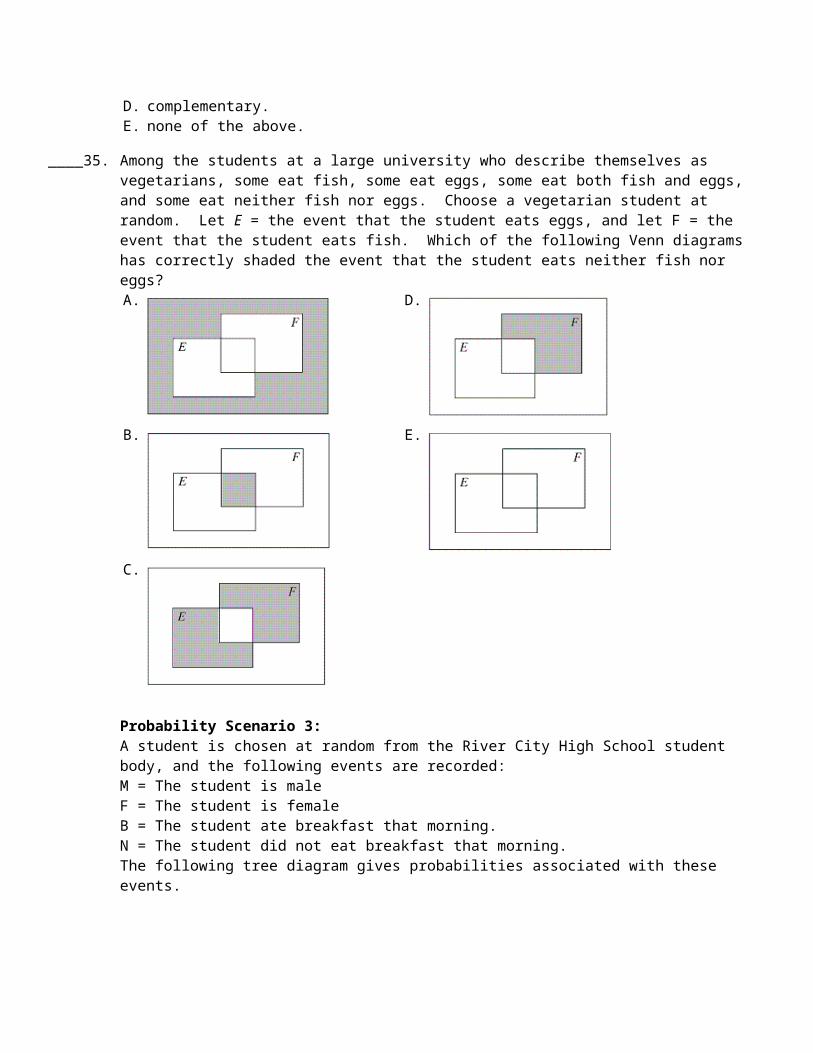
____ 35. Among the students at a large university who describe themselves as vegetarians, some eat fish, some eat eggs, some eat both fish and eggs, and some eat neither fish nor eggs. Choose a vegetarian student at random. Let E = the event that the student eats eggs, and let F = the event that the student eats fish. Which of the following Venn diagrams has correctly shaded the event that the student eats neither fish nor eggs?A. D.
B. E.
C.
Probability Scenario 3:A student is chosen at random from the River City High School student body, and the following events are recorded:M = The student is maleF = The student is femaleB = The student ate breakfast that morning.N = The student did not eat breakfast that morning.The following tree diagram gives probabilities associated with these events.

36. Use Probability Scenario 3. What is the probability that the selected student is a male and ate breakfast?
37. Use Probability Scenario 3. What is the probability that the student had breakfast?
38. Use Probability Scenario 3. Given that a student who ate breakfast is selected, what is the probability that he is male?
39. Use Probability Scenario 3. Find and write in words what this expression represents.
Probability Scenario 4:The Venn diagram below describes the proportion of students who take chemistry and Spanish at Jefferson High School, Where A = Student takes chemistry and B = Students takes Spanish.
Suppose one student is chosen at random.
40. Use Probability Scenario 4. Find the value of and describe it in words.
41. Use Probability Scenario 4. The probability that the student takes neither Chemistry nor Spanish is
Probability Scenario 5:
The following table compares the hand dominance of 200 Canadian high-school students and what methods they prefer using to communicate with their friends.
Cell phone/Text In person Online TotalLeft-handed 12 13 9 34Right-handed 43 72 51 166
Total 55 85 60 200
Suppose one student is chosen randomly from this group of 200.
42. Use Probability Scenario 5. What is the probability that the student chosen is left-handed or prefers to communicate with friends in person?
43. Use Probability Scenario 5. If you know the person that has been randomly selected is left-handed, what is the probability that they prefer to communicate with friends in person?
Probability Scenario 6:One hundred high school students were asked if they had a dog, a cat, or both at home. Here are the results.
Dog? TotalNo Yes
Cat? No 74 4 78Yes 10 12 22
Total 84 16 100
44. Use Probability Scenario 6. If a single student is selected at random and you know she has a dog, what is the probability she also has a cat?
45. Use Probability Scenario 6. If a single student is selected at random, what is the probability associated with the union of the events “has a dog” and “does not have a cat?”
46. Use Probability Scenario 6. If two students are selected at random, what is the probability that neither of them has a dog or a cat?
Probability Scenario 7:The Pork ‘n’ Spud Restaurant serves all BBQ plates with a potato side dish, but customers are not allowed to choose which type of potato side dish that they receive. The area (bar) model below shows a customer’s comparative probability of receiving a particular type of potato side dish, depending on what day it is (the restaurant is open Monday through Friday).
47. Use Probability Scenario 7.Over the span of one week, what is the probability that a customer will receive french fries? Express as a fraction.

48. Use Probability Scenario 7.What is the probability that a customer will receive a baked potato on his or her BBQ plate on Wednesday? Express as a fraction.
49. At a carnival game, you may win an inflatable crayon, you may win a small stuffed animal, or you may win nothing at all. If the probability of winning nothing is 0.64 and the probability of winning a small stuffed animal is 0.28, what is the probability of winning an inflatable crayon? Express your answer as a decimal.
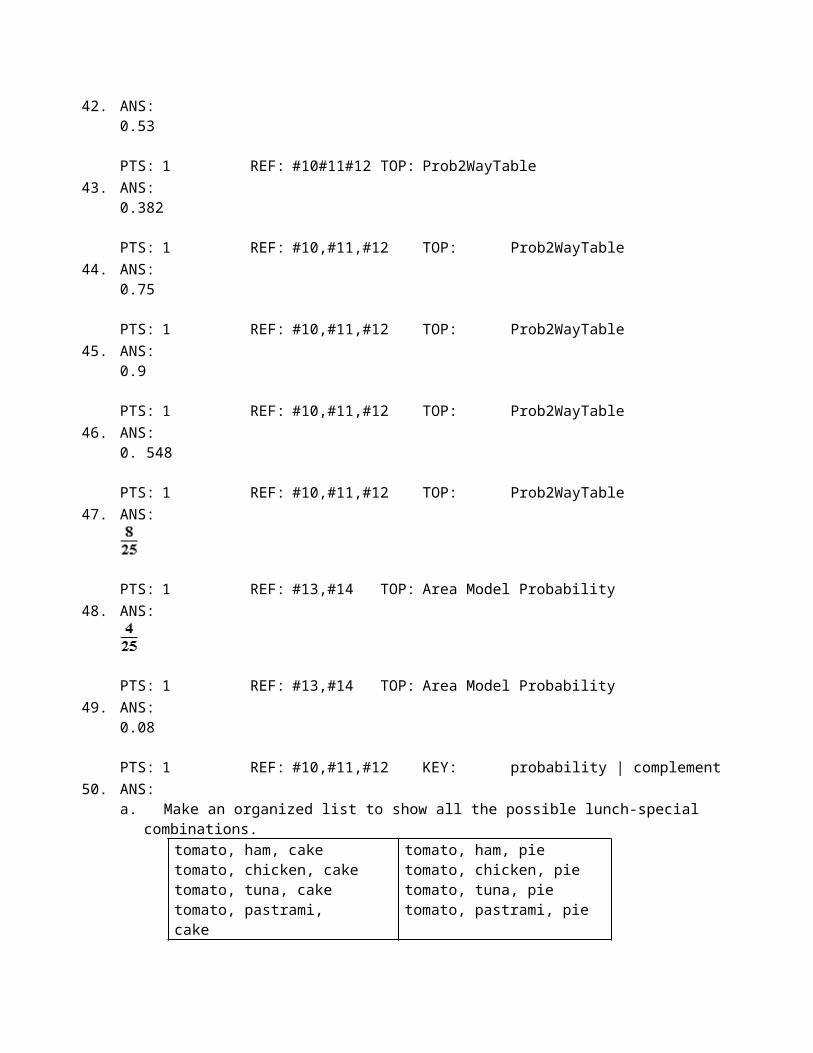
50. A deli offers a lunch-special that comes with soup, a sandwich, and a dessert. The soup choices are tomato or onion, the sandwich choices are ham, chicken, tuna, or pastrami, and the dessert choices are cake or pie.
a. List all possible lunch-special combinations.b. What is the size of the lunch-special sample space? Explain your answer.
I CAN analyze and critique reported statistical information, summaries, and graphical displays, calculate the mean, median, mode, range, and graph and interpret data displays.
51. The five-number summary of the distribution of scores on the final exam in Psych 001 last semester was:18 39 62 76 100
The 80th percentile was:
52. Which of the following dot plots would best be approximated by a Normal distribution?
____ 53.

Which of the following best describes the shape of distribution of three-point shots per game above? A. Skewed leftB. Skewed rightC. Approximately uniformD. Approximately NormalE. Symmetric, but distinctly non-Normal.
54. Find the mean, median, mode, and range of the data set.Number of Books Read
Sylvester 218 Edmund 224Rashin 217 Treya 217
____ 55. Find a set of 5 items that has a range of 9, a mean of 15, a median of 14, and a mode of 11.A. 11, 11, 13, 15, 20 C. 11, 11, 14, 19, 20B. 5, 11, 14, 14, 31 D. 6, 10, 14, 15, 15
I CAN...understand how identification numbers such as UPCs and credit cards numbers are created and verified.
____ 56. Which of the following check digits (d) will make the UPC given valid? 0-56824-87654-d
A. 3B. 5C. 7D. 9
____ 57. Which of the following credit card numbers is valid?
A. 4620 0711 1042 5389
B. 5011 1803 4801 9120
C. 5030 1382 1776 1985
D. 5717 0183 4450 3389
I CAN...

Create and use two- and three-dimensional representations of authentic situations, applying proportional reasoning to these representations in order to solve problems.
58. Three balls are packaged in a cylindrical container as shown below. If the balls just touch the top, bottom, and sides of the cylinder, how much of the space inside the cylinder is not filled by the balls if the diameter of a single ball is 7 cm? Justify each step in your solution.
59. A half sheet cake is and will serve 36 people. In order to give each of the 36 people identical slices of cake with none left over, what should be the dimensions of each piece of cake?
60. A can of flea bomb spray states that one can will cover an area that is . How many cans should you get to flea bomb a one story, rectangular house that is ?
61.The aspect ratio of a television screen is 4:3. If the opening above your fireplace (which is meant for a TV) is
, and you want the largest possible TV, which of the television sets below should you buy?
I CAN...Utilize weighted averages to determine overall averages. Averages Scenario 1:Percy’s AMDM grades are listed below, in their appropriate categories. You can see that Senioritis was a serious problem for Percy this year. Percy hopes to graduate but he has to pass this course...and it’s looking like he might be cuttting it very, very close. Use the gradebook report below to find out.

(Each individual grade shown below is weighted equally within its category with other grades within that same category).
62. Use Averages Scenario 1. OPEN ENDED. Answer all parts of the question below.
a) What grade did Percy have, going into the final exam?b) Calculate Percy’s category averages and his overall average in AMDM. Show your work. Did Percy pass AMDM B? c) If he did not pass, what final exam grade did he need to make a 70? d) What final exam grade did he make to make an 80? e) What final exam grade did he need to make a 90?
I CAN...create and analyze mathematical models to make decisions related to earning, investing, spending, and borrowing money by using exponential models for income, expenditures, loans, and investments.
63. Betty Blue is a choreographer. Her biweekly salary is $6,514. What is Betty’s gross annual income?
64. John and Loretta Smith are in the 28% tax bracket. Their joint taxable income is $134,899. If the first $16,050 is taxed at 10%, with the remainder at 28%, how much tax will they owe?

65. Roland had $10,500 in medical expenses last year and has no medical insurance. The IRS allows medical expense deductions for the amount that exceeds 7.5% of a taxpayer’s adjusted gross income. If Roland’s adjusted gross income is $31,000, how much can he claim as a medical deduction?
66. Marta Perez sells coffee beans to local coffee shops. She earns a 10% straight commission on all sales. In November, her sales totaled $38,500. What was her commission?
67. Colleen Truman earns a 4.5% commission on all sales. In June, her sales totaled $40,000. How much did she earn in commission?
68. Jason Ayers works as a lifeguard earning $8.75 an hour for 20 hours per week. What is Jason’s straight-time pay for the week?
69. Marianne opened a retirement account that has an annual yield of 5.5%. She is planning to retire in 25 years. How much should she put into the account each month so that she will have $500,000 when she retires?
70. Use the summary section of the monthly credit card statement below to calculate the finance charge.
71. Mantago wants to borrow $10,000 to buy a used car. He examined his budget and decides that he can afford a payment of $200 a month. If his bank offers him an APR of 7.5%, how long should he borrow the money so he can afford his monthly payment?
72. Dr. Drake is thinking about retirement and decides to sail around the world once he retires. He buys a sailboat for $125,000. He borrows the money at an APR of 7.5% for five years. What will his total interest be?
73. What is the monthly periodic rate on a loan with an APR of 18.6%?
I CAN...Use a variety of network models to organize data in quantitative situations, make informed decisions, and solve problems.
____ 74. Which of the following represents an Euler Circuit?

A. CBDFEACFDBA C. FEACBDCFDBAB. BDCFDBAFEAC D. DCFDBAFEACB
75. Explain why the following two figures do not represent the same graph.
76. Does the following graph have an Euler Path or an Euler Circuit?
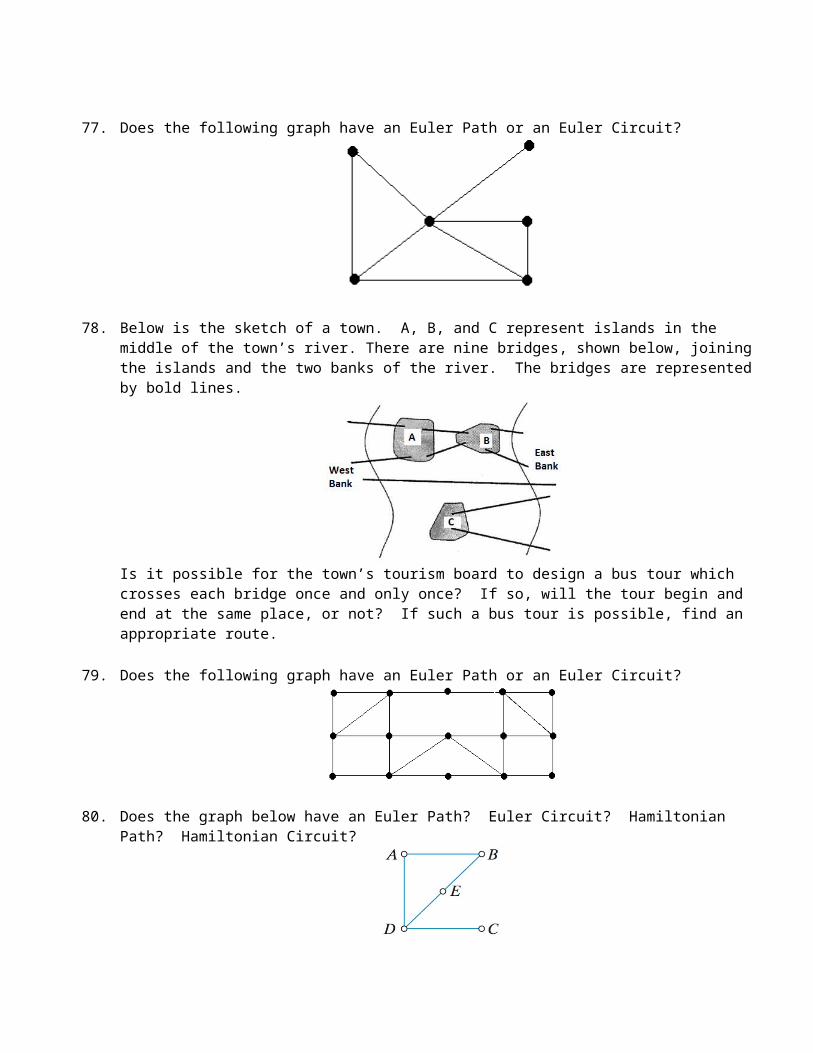
77. Does the following graph have an Euler Path or an Euler Circuit?
78. Below is the sketch of a town. A, B, and C represent islands in the middle of the town’s river. There are nine bridges, shown below, joining the islands and the two banks of the river. The bridges are represented by bold lines.

Is it possible for the town’s tourism board to design a bus tour which crosses each bridge once and only once? If so, will the tour begin and end at the same place, or not? If such a bus tour is possible, find an appropriate route.
79. Does the following graph have an Euler Path or an Euler Circuit?
80. Does the graph below have an Euler Path? Euler Circuit? Hamiltonian Path? Hamiltonian Circuit?
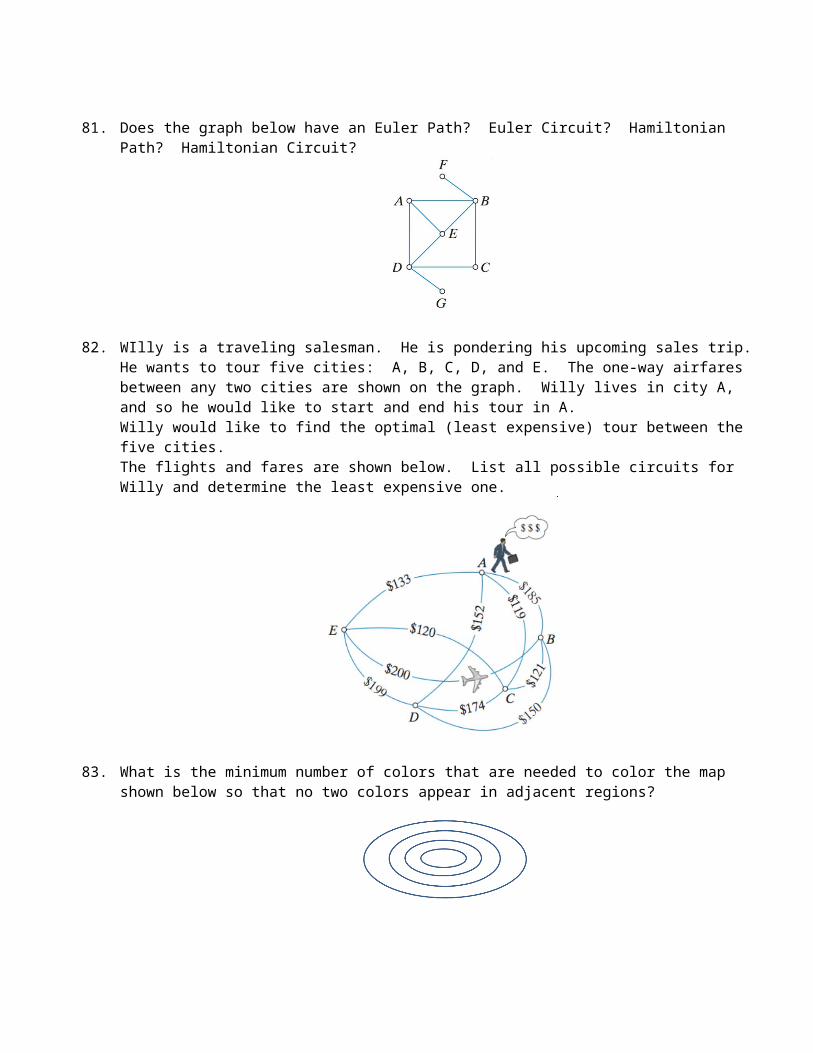
81. Does the graph below have an Euler Path? Euler Circuit? Hamiltonian Path? Hamiltonian Circuit?
82. WIlly is a traveling salesman. He is pondering his upcoming sales trip. He wants to tour five cities: A, B, C, D, and E. The one-way airfares between any two cities are shown on the graph. Willy lives in city A, and so he would like to start and end his tour in A. Willy would like to find the optimal (least expensive) tour between the five cities. The flights and fares are shown below. List all possible circuits for Willy and determine the least expensive one.

83. What is the minimum number of colors that are needed to color the map shown below so that no two colors appear in adjacent regions?
84. What is the minimum number of colors that are needed to color the map shown below so that no two colors appear in adjacent regions?
85. Warner Robins is planning a new zoo. There will initially be a chimpanzee, gazelle, giraffe, lion, and panda. The zookeeper needs to determine the minimum number of enclosures with the following restrictions: the chimpanzee cannot be with the lion or panda. The gazelle cannot be with the lion or panda. The giraffe cannot be with the lion. The lion cannot be with the chimpanzee, gazelle, giraffe, or panda. The panda cannot be with the chimpanzee, gazelle, or lion.
How many new habitats would be the minimum number required under these rules?
Network Scenario 1:The activity graph below provides task completion times in hours. Use this graph to answer the questions below.

86. Use Network Scenario 1.What is the minimum completion time for the project based on the graph?
87. Use Network Scenario 1.Which activities are critical?
Network Scenario 2:The activity table shown below will be used to answer questions related to PERT.
88. Use Network Scenario 2.What is the minimum number of days needed to complete the activities?
89. Use Network Scenario 2.How long could the storyline task be delayed without affecting the overall completion time?
AMDM STUDY GUIDEAnswer Section
1. ANS:an experiment imposes treatments on the subjects, but an observational study does not.
PTS: 1 REF: #1 TOP: Experiment vs. Observational study2. ANS:
observational study.
PTS: 1 DIF: #1 TOP: Experiment vs. Observational study3. ANS:
Observational Study
PTS: 1 REF: #1 TOP: Type of Study4. ANS:
: Certain car colors get more tickets than others.
: There is no evidence that certain car colors get more speeding tickets than others.
PTS: 1 REF: #2 TOP: Identify hyp and null hyp5. ANS:
The distribution of car colors for the speeding citations is the same as the distribution of colors for cars on the highway.
PTS: 1 REF: #2 TOP: Null hypothesis6. ANS:
PTS: 1 REF: #2 TOP: Expected countsHyp7. ANS:
Reject H0: there is evidence that certain car colors get more speeding tickets than others.
PTS: 1 REF: #2 TOP: Conclusion given results8. ANS:
all residents of Lafayette.
PTS: 1 REF: #2 TOP: Identify population9. ANS:
the 20 people who gave the sportswriter their opinion.
PTS: 1 REF: #6 TOP: Identify sample10. ANS:
This is a convenience sample. It will almost certainly overestimate the level of support among all Lafayette residents.
PTS: 1 REF: #4 TOP: Convenience sample11. ANS:
a systematic sample
PTS: 1 REF: #3 TOP: Systematic sample12. ANS:
a voluntary response sample.
PTS: 1 REF: #5 TOP: Voluntary response13. ANS: A PTS: 1 REF: #5 TOP: SRS definition14. ANS:
stratified random sample.
PTS: 1 REF: #6 TOP: Stratified random sample15. ANS: C PTS: 1 REF: #6 TOP: Why stratify16. ANS:
cluster sampling
PTS: 1 REF: #6 TOP: ClusterSampling17. ANS:
the question is worded in a confusing manner.
PTS: 1 REF: #8 TOP: Question wording18. ANS:
the wording of questions has a big effect on poll results.
PTS: 1 REF: #8 TOP: Question wording19. ANS:
nonresponse.
PTS: 1 REF: #9 TOP: NonResponseBias20. ANS:
response bias.
PTS: 1 REF: #9 TOP: ResponseBias21. ANS:
undercoverage.
PTS: 1 REF: #9 TOP: UndercoverageBias22. ANS:
A question that can only be answered with choices provided.
PTS: 1 REF: #7 TOP: Closed Question23. ANS: C PTS: 1 REF: #7 TOP: Closed Question24. ANS:
if I flip the coin many, many times the proportion of heads will be approximately 1/2, and this proportion will tend to get closer and closer to 1/2 as the number of tosses increases.
PTS: 1 REF: #10-#18 TOP: Idea of probability25. ANS:
$250

PTS: 1 REF: #18 TOP: Expected Value26. ANS:
-$750
PTS: 1 REF: #18 TOP: Expected Value27. ANS:
$12.00
PTS: 1 REF: #18 TOP: Expected Value28. ANS:
I and II
PTS: 1 REF: #10-#18 TOP: Simulation to estimate probability29. ANS:
.2.
PTS: 1 REF: #10-#18 TOP: Basic Probability Rules30. ANS:
.8.
PTS: 1 REF: #10-#18 TOP: Complement rule31. ANS:
.4.
PTS: 1 REF: #10-#18 TOP: Addition of disjoint events32. ANS:
0.03125.
PTS: 1 REF: #10-#18 TOP: Mult,IndepEvents33. ANS:
0.875.
PTS: 1 REF: #10-#18 TOP: Complement rule34. ANS: A PTS: 1 REF: #10-#18 TOP: Mutually exclusive events35. ANS: A PTS: 1 REF: #10,#11#12 TOP: VennDiagrams36. ANS:
0.32
PTS: 1 REF: #15,#16,#17 TOP: Probabilities from tree diagram37. ANS:
0.50
PTS: 1 REF: #15,#16,#17 TOP: Probabilities from tree diagram38. ANS:
0.64
PTS: 1 REF: #15,#16,#17 TOP: Probabilities from tree diagram39. ANS:

0.30; The probability the student ate breakfast, given she is female.
PTS: 1 REF: #15,#16,#17 TOP: Probabilities from tree diagram40. ANS:
0.6; The probability that the student takes either chemistry or Spanish, or both.
PTS: 1 REF: #15#16#17 TOP: VennDiagrams41. ANS:
0.4
PTS: 1 REF: #15#16#17 TOP: VennDiagrams42. ANS:
0.53
PTS: 1 REF: #10#11#12 TOP: Prob2WayTable43. ANS:
0.382
PTS: 1 REF: #10,#11,#12 TOP: Prob2WayTable44. ANS:
0.75
PTS: 1 REF: #10,#11,#12 TOP: Prob2WayTable45. ANS:
0.9
PTS: 1 REF: #10,#11,#12 TOP: Prob2WayTable46. ANS:
0. 548
PTS: 1 REF: #10,#11,#12 TOP: Prob2WayTable47. ANS:
PTS: 1 REF: #13,#14 TOP: Area Model Probability48. ANS:
PTS: 1 REF: #13,#14 TOP: Area Model Probability49. ANS:
0.08
PTS: 1 REF: #10,#11,#12 KEY: probability | complement50. ANS:
a. Make an organized list to show all the possible lunch-special combinations.tomato, ham, cake tomato, ham, pietomato, chicken, cake tomato, chicken, pie

tomato, tuna, cake tomato, tuna, pietomato, pastrami, cake tomato, pastrami, pieonion, ham, cake onion, ham, pieonion, chicken, cake onion, chicken, pieonion, tuna, cake onion, tuna, pieonion, pastrami, cake onion, pastrami, pie
b. The size of the sample space is the number of different lunch combinations. There are 16 different lunch combinations available.
PTS: 1 REF: #15 KEY: combinations sample space51. ANS:
between 76 and 100
PTS: 1 REF: #19#20#21 TOP: Percentiles52. ANS:
E
PTS: 1 REF: #19#20#21 TOP: Recognizing Normal distribution53. ANS: D PTS: 1 REF: #19 TOP: Central limit theorem54. ANS:
The mean is books; the median is books; the mode is 217 books; and the range is 7 books.
PTS: 1 REF: #20#21 KEY: meanmedianmode55. ANS: C PTS: 1 REF: 20#21 TOP: MeanMedianMode56. ANS: A PTS: 1 REF: #22 KEY: UPCValid57. ANS: A PTS: 1 REF: #23 KEY: CCValid58. ANS:
269.4
PTS: 1 REF: #24 KEY: VolumeTennisBalls59. ANS:
Each piece will be
PTS: 1 REF: #24 TOP: Area, Divided60. ANS:
29 cans of flea bomb
PTS: 1 REF: #24 TOP: Area, Divided61. ANS:
PTS: 1 REF: #25 TOP: AspectRatio62. ANS:
50% 20% 5% 15% 10%Tests Learning Tasks Daily Quiz Final
100 40 0 0 76

95 63 50 50
63 39 20 20
70 88 47
60 60
5266
82 58.28571429 23.33333 35.4 76
66.73
a) Going into the final exam he had a 65.7%. This grade is VERY hard to bring up to passing with a final exam that only counts 10%. Also - students would need to average the categories pre-final and
((0.5*82)+(0.2*58.28571429)+(0.05*23.33333)+(0.15*35.4))/(0.90)(because only 90% of the grade has been posted!)b) Percy ended up with a 66.73. He did not pass. c) To have passed AMDM, he would have needed a 105 (maybe there is some extra credit?)d) To have made a “B” in AMDM, he would have needed a 204 (not possible).e) To have made an “A” in AMDM, he would have needed a 304!
PTS: 1 REF: #26#27 KEY: weighted averages63. ANS:
$169,364
PTS: 1 REF: #28 KEY: GrossIncome64. ANS:
$34,882.72(16,050 0.1) + 0.28(134,899 16,050) = 1,605 + 33,277.72 = $34,882.72
PTS: 1 REF: #29 KEY: TaxesPercentages65. ANS:
$8,17531,000 0.075 = 2,325; 10,500 2,325 = $8,175
PTS: 1 REF: #29 KEY: TaxesPerrcentages66. ANS:
$3,850
PTS: 1 REF: #331 TOP: Commission67. ANS:
$1,800
PTS: 1 REF: #31 TOP: Commission68. ANS:
$175.00
PTS: 1 REF: #30 KEY: Hourly pay

69. ANS:
= $778.77
PTS: 1 REF: #32,#3370. ANS:
$10.06805 0.0125 = $10.06
PTS: 1 REF: #37-#3971. ANS:
5 years
PTS: 1 REF: #3572. ANS:
$25,284.61
; 2,504.74 60 = 150,284.61; 150,284.61 – 125,000 = $25,284.61
PTS: 1 REF: #3673. ANS:
1.55%18.6 ÷ 12 = 1.55
PTS: 1 REF: #3874. ANS: C PTS: 1 REF: #4175. ANS:
They have different edge sets.The edge sets of the lefthand graph are . The edge sets of the right hand graph are . Had the edge sets been the same they would have been considered the same graph. The fact that the names of each vertex have changed would not have been important if the same edge sets had resulted.
PTS: 1 TOP: GraphTheory
76. ANS:It has an Euler Path but no Euler CircuitBecause it has exactly two odd vertices.
PTS: 1 TOP: GraphTheory77. ANS:
It has neither an Euler Path nor an Euler Circuit.Because it has exactly four odd vertices.
PTS: 1 TOP: GraphTheory78. ANS:
This graph has two odd vertices and connected so it has an Euler path. The town can design such a bus tour. It will begin at W (or E) and end at E (or W). One such Euler Path: WABEBAWECE
PTS: 179. ANS:
It has an Euler Path and and Euler CircuitBecause it is connected and has no odd vertices.An Euler Circuit is a type of Euler Path.
PTS: 1 TOP: GraphTheory80. ANS:
This graph has no Euler circuits but does have Euler PathsThis graph has no Hamiltonian Circuits but does have Hamiltonian paths.
PTS: 181. ANS:
This graph has no Euler circuits, no Euler paths. (Too many odd vertices)This graph has no Hamiltonian circuits and no Hamiltonian paths.
PTS: 182. ANS:
The least expensive trip is $676. ADBCEA (or its reverse...AECBDA)
PTS: 183. ANS:
2
PTS: 1 REF: #39#4084. ANS:
2
PTS: 1 REF: #39#4085. ANS:
3
PTS: 1 REF: #4186. ANS:
14 hours

PTS: 187. ANS:
B, D, &E
PTS: 188. ANS:
93
PTS: 189. ANS:
3 Hours
PTS: 1