Modulation of Actinorhodin Biosynthesis in Streptomyces lividans by Glucose Repression of afsR2

Rapid, accurate, and comparative differentiation of clinically and industrially relevant microorganisms via multiple
vibrational spectroscopic fingerprinting
Howbeer Muhamadali1, Abdu Subaihi1, Mahsa Mohammadtaheri 2, Yun Xu1, David I. Ellis1, Rajesh Ramanathan2, Vipul Bansal2 and Royston Goodacre1*
1School of Chemistry, Manchester Institute of Biotechnology, University of Manchester, Manchester, UK2Ian Potter NanoBioSensing Facility, NanoBiotechnology Research Laboratory, School of Science, RMIT
University, Melbourne, Australia
*Corresponding author:Royston Goodacre, E-mail: [email protected], Tel: 0161 306-4480
Keywords:
Metabolic fingerprint, Raman, Fourier transform infrared spectroscopy, surface enhanced
Raman scattering (SERS), microbial classification, multivariate analysis
1
1
2
3
4
56
7
8
91011
121314
15
16
17
Abstract
Despite the fact that various microorganisms (e.g., bacteria, fungi, viruses, etc.) have been
linked with infectious diseases, their crucial role towards sustaining life on Earth is
undeniable. The huge biodiversity, combined with the wide range of biochemical capabilities
of these organisms, have always been the driving force behind their large number of current,
and, as of yet, undiscovered future applications. The presence of such diversity could be said
to expedite the need for the development of rapid, accurate and sensitive techniques which
allow for the detection, differentiation, identification and classification of such organisms. In
this study, we employed Fourier transform infrared (FT-IR), Raman, and surface enhanced
Raman scattering (SERS) spectroscopies, as molecular whole-organism fingerprinting
techniques, combined with multivariate statistical analysis approaches for the classification of
a range of industrial, environmental or clinically relevant bacteria (P. aeruginosa, P. putida,
E. coli, E. faecium, S. lividans, B. subtilis, B. cereus) and yeast (S. cerevisiae). Principal
components-discriminant function analysis (PC-DFA) scores plots of the spectral data
collected from all three techniques allowed for the clear differentiation of all the samples
down to sub-species level. The partial least squares-discriminant analysis (PLS-DA) models
generated using the SERS spectral data displayed lower accuracy (74.9%) when compared to
those obtained from conventional Raman (97.8%) and FT-IR (96.2%) analyses. In addition,
whilst background fluorescence was detected in Raman spectra for S. cerevisiae, this
fluorescence quenched when applying SERS to the same species, and conversely SERS
appeared to introduce strong fluorescence when analysing P. putida. It is also worth noting
that, FT-IR analysis provided spectral data of high quality and reproducibility for the whole
sample set, suggesting its applicability to a wider range of samples, and perhaps the most
suitable for the analysis of mix cultures in future studies. Furthermore, our results suggest
that while each of these spectroscopic approaches may favour different organisms (sample
types), when combined, they would provide complementary and more in-depth knowledge
(structural and/or metabolic state) of biological systems. To the best of our knowledge, this is
the first time that such a comparative and combined spectroscopic study (using FT-IR,
Raman and SERS) has been carried out on microbial samples.
2
1
2
3
4
5
6
7
8
9
10
11
12
13
14
15
16
17
18
19
20
21
22
23
24
25
26
27
28
29
Introduction
The huge biodiversity, combined with the wide range of biochemical capabilities of micro-
organisms, have always been the driving force behind their large number of applications in
various fields of science, technology, and industry, including: agriculture,1 food production
and processing ,2, 3 biotechnology 4, 5, bioremediation,6, 7 and more recently, synthetic
biology.8, 9 The presence of such microbial diversity, which results in clear chemical
differences between different bacterial genera and species requires the development of rapid,
accurate and sensitive physicochemical techniques allowing for the detection, identification
and classification of such highly beneficial organisms, which are potentially of huge
importance for food safety,10, 11 clinical medicine, the environment,12, 13 as well as the
production of a whole range of compounds within the setting of synthetic biology.
Although traditional techniques such as phenotypic and serological tests are still used in
clinical settings for bacterial identification, these approaches are considered time-consuming
(generally between 24-72 h), laborious and often provide limited accuracy.14 In addition to
these approaches, molecular biology approaches such as 16S or 18S ribosomal DNA or
RNA15, 16 amplification combined with sequencing assays, and analytical techniques, most
notably matrix-assisted laser desorption ionisation time of flight mass spectrometry (MALDI-
TOF-MS) 17, 18 are also considered as viable options for this task. However, in order to
achieve identification at sub-species level using 16S or 18S rRNA sequencing techniques,
full genome sequence of the organisms are required, and perhaps importantly, these
techniques are not ideally suited for field applications.19, 20
During the past few decades the application of spectroscopy-based techniques, such as
molecular fingerprinting approaches, for microbial identification and classification has
attracted a lot of attention.16, 18-20 Fourier transform infrared (FT-IR) spectroscopy, a
3
1
2
3
4
5
6
7
8
9
10
11
12
13
14
15
16
17
18
19
20
21
22
23
24

vibrational spectroscopic technique based on the interaction of IR light with the molecular
bonds in a sample, 21 is a low cost, rapid (<1 min per sample) and high-throughput
fingerprinting technique with demonstrated utility in various applications including those
within, but not exclusive to, the food safety,22, 23 clinical,18 biotechnology 24-26 and
environmental 27, 28 arenas. However, one of the limitations of FT-IR for investigation of
biological systems is the strong absorbance of water in such samples, which is overcome in
some cases by subtraction of the water signal, drying the sample or using alternative IR-based
techniques such as the less sensitive near-IR (NIR), or attenuated total reflectance (ATR)
sampling accessories or probes.29
As a complementary technique to FT-IR, Raman spectroscopy is considered an ideal method
for the analysis of aqueous samples as water is a weak Raman scatterer, and the resultant
Raman spectra tend to be more information rich in terms of the spectra have sharper peaks
than FT-IR spectra.30 However, one of the known limitations of this vibrational technique is
that the Raman scattering is inherently weak. Over the past few decades this has been to a
degree overcome by the development of new signal enhancement methods (e.g. surface
enhanced Raman scattering (SERS) and resonance Raman techniques), as well as significant
advancements in instrumentation (e.g., charged-coupled devices and laser technology), and
computation. These improvements have contributed towards the various applications of
Raman spectroscopy in many different areas of microbiology, including: food safety,31-34
medical,35, 36 cell sorting (Raman tweezers),37 as well as classification of fixed and live
bacteria at colony,38, 39 spore,40 and single cell levels.41-44 Alternatively, SERS, as a Raman
enhancement technique (with a typical enhancement factor of 104 - 106),45 has also become an
increasingly attractive approach as it allows for the rapid, sensitive, selective and label-free
detection of various biomolecules. Such advantages have contributed towards its popularity
and broad range of applications such as detection of biomarkers of various diseases,46, 47 DNA
4
1
2
3
4
5
6
7
8
9
10
11
12
13
14
15
16
17
18
19
20
21
22
23
24
25
detection,48-50 monitoring enzyme activity,51, 52 and in particular for detection,53
quantification,54 and classification of microbial cells.55-57 For an overview on fundamental
aspects and applications of SERS, the reader is directed to the following general reviews with
excellent coverage of the area.19, 58-60
In this study, we employed FT-IR and conventional Raman spectroscopies, and surface
enhanced Raman scattering, as physicochemical fingerprinting techniques, combining these
with multivariate statistical analysis approaches for the rapid and accurate classification of a
range of bacterial (P. aeruginosa, P. putida, E. coli, E. faecium, S. lividans, B. subtilis, B.
cereus) and yeast (S. cerevisiae) cells. To the best of our knowledge, this is the first time that
such a combined and comparative study (using FT-IR, Raman and SERS) has been carried
out on microbial samples.
Materials and methods
Bacteria and yeast growth conditions
All chemicals and reagents were purchased from Sigma-Aldrich (Sigma Aldrich, UK) unless
otherwise stated. A list of all the microorganisms used in this study, along with their
characteristics, is provided in Table 1. All microorganisms used in this study were sub-
cultured three times on the relevant agar medium, to ensure purity and phenotypic stability,
before being used for inoculum preparation. Five biological replicates of all microbes were
cultured.
Escherichia coli, Bacillus subtilis, B. cereus and Enterococcus faecium were inoculated into
50 mL of nutrient broth, to a final OD600nm of 0.1, and incubated at 37 °C with 200 rpm
shaking using a Multitron standard shaker incubator (INFORS-HT Bottmingen Switzerland).
5
1
2
3
4
5
6
7
8
9
10
11
12
13
14
15
16
17
18
19
20
21
22
23

Pseudomonas putida and Pseudomonas aeruginosa were grown under identical conditions
except that the incubator was set to 30 °C. Saccharomyces cerevisiae was inoculated into
50 mL of yeast extract-peptone-dextrose (YPD) medium followed by incubation at 30 °C
with 200 rpm shaking. Precultures of Streptomyces lividans TK24 were prepared by
inoculating 50 mL of phage medium with a dense spore stock (108 spores per mL) followed
by incubation at 30 °C with 280 rpm shaking for 24 h.25 The resultant vegetative mycelial
cells were harvested by centrifugation (4000 g at 4 °C for 10 min), washed using sterile
normal saline solution, and inoculated into 50 mL of phage medium in 250 mL baffled flasks
and incubated at 30 °C with 280 rpm shaking, to achieve homogeneous growth and avoid any
clump formation.
Sample preparation
Biomass from all the samples was harvested at late exponential phase by centrifugation at
4000 g for 10 min at 4 °C using a MicroCL 17R microcentrifuge (Thermo Fisher Scientific
Inc., UK). The supernatant was discarded and the biomass washed twice using sterile
physiological saline solution (0.9% NaCl) to remove any residual compounds from the
medium, as previously reported.24, 41 All washed samples were resuspended in saline solution
and normalised according to their OD600nm (~15).
FT-IR analysis
Samples were spotted as 20 µL aliquots onto an FT-IR silicon 96 well plate and heated to
dryness at 55 °C for ~30 min. FT-IR spectral data were collected in absorbance mode in the
Mid-IR range (4000 - 600 cm-1) on a Bruker Equinox 55 infrared spectrometer (Bruker Optics
6
1
2
3
4
5
6
7
8
9
10
11
12
13
14
15
16
17
18
19
20
21
22
23

Ltd, Coventry, UK), as 64 co-adds with 4 cm-1 resolution, in triplicate (analytical replicates)
from separate regions of each of the sample spots.61 FT-IR spectral data were normalised
using standard normal variate (SNV) transformation,62 followed by replacement of of the CO2
peaks with a trend (2400-2275 cm-1).
Raman analysis
Samples were spotted onto prewashed calcium fluoride (CaF2) discs in 5 µL aliquots and
dried in a desiccator at room temperature. Raman analysis was carried out on a Renishaw
inVia Raman microscope (Renishaw Plc., Gloucestershire, UK) equipped with a 785 nm
laser. The instrument was calibrated with a silicon wafer focused under a ×50 objective,
where a static spectrum centered at 520 cm-1 for 1 s at 10% power was collected. Spectral
data were collected using the GRAMS WiRE 3.4 software (Galactic Industries Corp. Salem,
NH). All spectra were acquired using 20 s exposure time, three accumulations and 600 l/mm
grating, in the 2233-489 cm-1 spectral range, and the laser power was adjusted on the sample
to ~30 mW.41 All collected Raman spectral data were baseline corrected and normalised using
SNV transformation.62
Synthesis of Ag nanoparticles (AgNPs)
For SERS AgNPs were synthesised using amino acid tyrosine as a reducing and capping
agent, as shown in previous studies.63, 64 Briefly, 100 mL aqueous solution comprising of 0.1
mM tyrosine and 0.1 mM KOH were heated to boiling point. Under alkaline boiling
conditions, 0.1 mM equivalent of Ag+ ions (AgNO3) were added to the above solution with
subsequent boiling for a further 5 min. This resulted in a yellow coloured solution consisting
7
1
2
3
4
5
6
7
8
9
10
11
12
13
14
15
16
17
18
19
20
21
22
23
of tyrosine capped AgNPs. Rotary vacuum evaporation was used to concentrate AgNPs
solution 10 times. These NPs solutions were found to be highly stable even after the
evaporation process, signifying the strong tyrosine capping. The concentrated solution of
AgNPs was dialysed overnight against deionised MilliQ water using 12 kDa molecular
weight cut-off cellulose dialysis membranes, followed by exchange of water twice, in order
to remove the excess amounts of KOH, potentially unreduced Ag+ ions and unbound tyrosine.
The concentration of silver in AgNPs was determined using Atomic Absorption Spectroscopy
(AAS) (Varian, Inc. Middelburg, Netherlands).
Nanoparticle characterisation
The homogeneous colloidal solution obtained after removal of unbound amino acids and ions
was characterized by UV−visible absorbance spectroscopy using an Envision multi-label
plate reader (PerkinElmer) (Figure 1A). Samples for transmission electron microscopy
(TEM) were prepared by drop-coating the solutions on to carbon-coated copper grids,
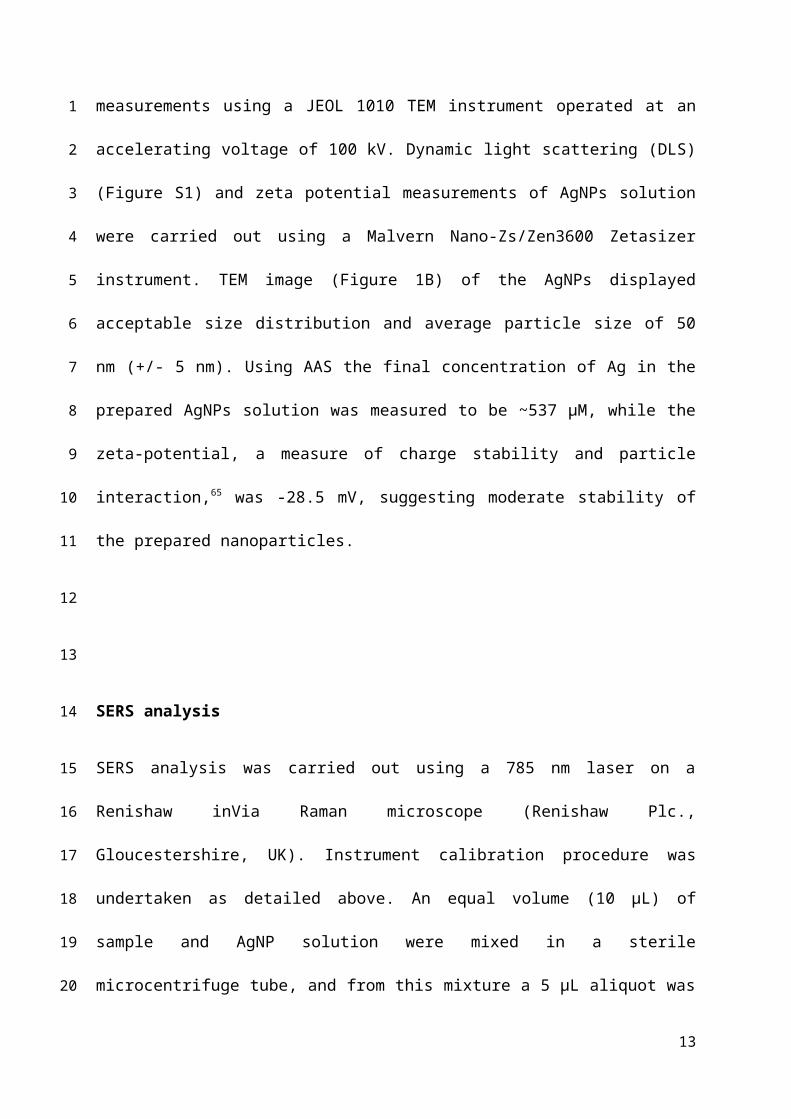
followed by TEM measurements using a JEOL 1010 TEM instrument operated at an
accelerating voltage of 100 kV. Dynamic light scattering (DLS) (Figure S1) and zeta
potential measurements of AgNPs solution were carried out using a Malvern
Nano-Zs/Zen3600 Zetasizer instrument. TEM image (Figure 1B) of the AgNPs displayed
acceptable size distribution and average particle size of 50 nm (+/- 5 nm). Using AAS the
final concentration of Ag in the prepared AgNPs solution was measured to be ~537 µM,
while the zeta-potential, a measure of charge stability and particle interaction,65 was -28.5
mV, suggesting moderate stability of the prepared nanoparticles.
8
1
2
3
4
5
6
7
8
9
10
11
12
13
14
15
16
17
18
19
20
21
22
23

SERS analysis
SERS analysis was carried out using a 785 nm laser on a Renishaw inVia Raman microscope
(Renishaw Plc., Gloucestershire, UK). Instrument calibration procedure was undertaken as
detailed above. An equal volume (10 µL) of sample and AgNP solution were mixed in a
sterile microcentrifuge tube, and from this mixture a 5 µL aliquot was spotted onto
prewashed CaF2 discs and dried at room temperature in a desiccator. SERS spectral data were
collected using a ×50 objective lens, 10 s exposure time and the motorized xy stage
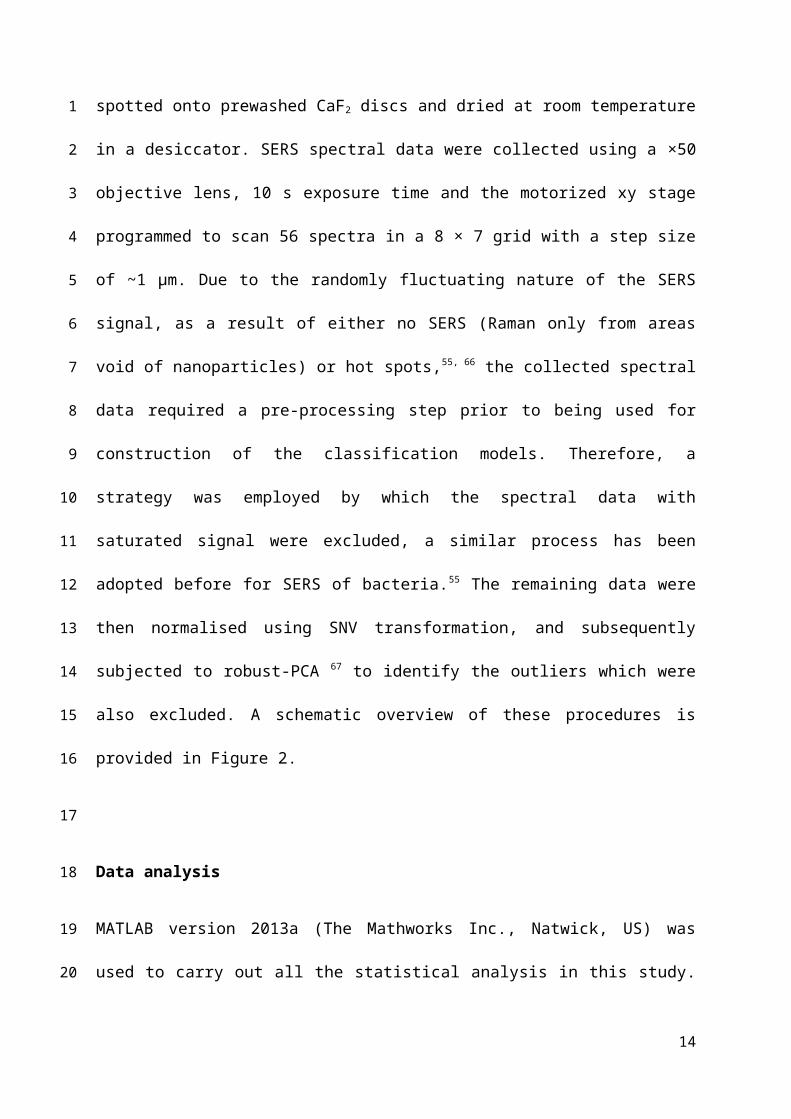
programmed to scan 56 spectra in a 8 × 7 grid with a step size of ~1 µm. Due to the randomly
fluctuating nature of the SERS signal, as a result of either no SERS (Raman only from areas
void of nanoparticles) or hot spots,55, 66 the collected spectral data required a pre-processing
step prior to being used for construction of the classification models. Therefore, a strategy
was employed by which the spectral data with saturated signal were excluded, a similar
process has been adopted before for SERS of bacteria.55 The remaining data were then
normalised using SNV transformation, and subsequently subjected to robust-PCA 67 to
identify the outliers which were also excluded. A schematic overview of these procedures is
provided in Figure 2.
Data analysis
MATLAB version 2013a (The Mathworks Inc., Natwick, US) was used to carry out all the
statistical analysis in this study. All preprocessed spectral data were subjected to principal
component-discriminant function analysis (PC-DFA), using the first 20 PCs,68 a supervised
discriminatory statistical method that uses a priori knowledge (species information) to
9
1
2
3
4
5
6
7
8
9
10
11
12
13
14
15
16
17
18
19
20
21
22
23

minimise within class variance, while maximising between class variance. Hierarchical
cluster analysis (HCA) was then applied to the average of the PC-DFA scores (the first three
scores retained) of the analytical replicates of each class (different species), to facilitate the
visualisation of the distance between each of the clusters. In order to assess the unbiased
capability of the models generated for discrimination of the spectral data, partial least
squares-discriminant analysis (PLS-DA) 69 with bootstrapping (1,000 iterations) validation
was applied.70 In each iteration, n (n is the total number of samples) samples were randomly
selected with replacement (i.e. one sample can be selected multiple times) from the spectral
data set and used as the training set, while the samples that had not been selected (due to the
fact that a sample can be selected multiple times) were used as the test set.69 The PLS-DA
model was built on the training set and applied to the test set. The accuracy of the predictions
on only the test set was then recorded. This process had been repeated 1,000 times for each
spectral data set and the prediction accuracies of the 1,000 randomly generated test sets were
then averaged and reported.71
Results
The average of all spectra collected using three spectroscopic techniques employed in this
study are presented in Figure 3. Due to the multivariate nature of the collected spectral data,
simple visible discrimination of the spectra could not be achieved, thus several chemometrics
approaches were employed to generate (with suitable validation) reliable classification
models for each of the datasets. The results of each of the vibrational spectroscopies will be
discussed in turn.
10
1
2
3
4
5
6
7
8
9
10
11
12
13
14
15
16
17
18
19
20
21
22
23

FT-IR fingerprints
PC-DFA scores plot of the FT-IR spectral data (Figure 4A, B) demonstrated clear separation
of S. cerevisiae from all other samples based on DF1. This is of course as expected as
S. cerevisiae are eukaryotic yeast cells while all other samples are prokaryotic bacterial cells.
In addition, the two Bacillus species clustered away from all other bacterial samples, on the
positive side of DF2, while E. coli, P. putida, P. aeruginosa and S. lividans clustered closely
on the negative side (Figure 4B). These findings are also evident from the HCA dendogram
constructed from the PC-DFA scores (Figure 5A). However, it is worth noting that according
to DF3 on the 3D PC-DFA scores plot (Figure 4A), S. lividans is clearly separated from
E. coli and both Pseudomonas species (all three are Gram-negative bacteria), while B. subtilis
can also be distinguished from B. cereus using DF3.
According to the DF1 and DF2 loadings plots (Figure S2, A) the most significant peaks
contributing to such clustering patterns include: fatty acid vibrations at 2924 and 2853 cm -1
(CH2, asymmetric and symmetric stretching respectively), esters at 1740 cm-1 (C=O,
stretching), amide I at 1665 (C=O, stretching) and amide II at 1540 cm-1 (combination of C-N
stretching and N-H bending), and other vibrational bands in the so called fingerprint region
(1500 - 500 cm-1).41, 72
Next PLS-DA was used to try to classify the different microorganisms. In this approach we
used binary encoding in the PLS2 analyses where as there were eight microbes to be
identified a vector of ‘0’s was used where ‘1’ was employed for the correct identity; that is to
say, for the identification of the 3rd microorganism (E. coli in this case; Table S1) the
encoding would be “0, 0, 1, 0, 0, 0, 0, 0”. The accuracy of predictions was assessed using
bootstrapping (n = 1,000) and the resultant confusion matrix (Figure 6A) generated from
11
1
2
3
4
5
6
7
8
9
10
11
12
13
14
15
16
17
18
19
20
21
22
23
PLS-DA confirmed the high accuracy of the generated models with prediction accuracies
between 92.6 – 99.9%, and an overall average of 96.19% (Table S1).
Raman fingerprints
Despite multiple attempts of optimisation using the 785 nm laser (e.g., using various biomass
concentrations, laser power and acquisition time), S. cerevisiae spectra contained high
background fluorescence and unclear spectral features. Fluorescence is known to be a
problem with yeast73 and potentially can be overcome by using the anti-Stokes scattering
(although this is considerably) weak or better still is to employ SERS (vide infra). Thus,
Raman spectral data of S. cerevisiae were excluded from further analysis. PC-DFA scores
plot (Figure 4C, D) of the remaining Raman spectral data displayed clear separation of all the
species. S. lividans clustered away from all other samples, according to DF1 (Figure 4D),
while DF2 separated E. coli, E. faecium and Pseudomonas spp., from S. lividans and Bacillus
spp.
Once again the 3D PC-DFA scores plot (Figure 4C), separated the samples down to
subspecies level, by which B. subtilis, B. cereus, P. putida and P. aeruginosa were further
separated into distinct clusters. Using the DF1 and DF2 loadings plot (Figure S2, B), the
significant Raman vibrational bands were identified as: esters at 1731 cm -1 (C=O, stretching),
amide I at 1651 cm-1 (C=O, stretching), lipids and nucleic acids at 1484 cm-1 (C-H,
deformation), proteins at 1375 cm-1, tyrosine (ring breathing) and/or nucleic acids (O-P-O,
stretching) at 826 cm-1, and a combination cytosine and uracil at 782 cm-1 (C=O, C-N and
ring deformations).41, 72
12
1
2
3
4
5
6
7
8
9
10
11
12
13
14
15
16
17
18
19
20
21
22
The HCA dendogram (Figure 5B) of the Raman PC-DFA scores also exhibited this clear
separation. Validation of the PLS-DA classification models (Figure 6B), generated using
Raman spectral data confirmed the accuracy and validity of the model (between 95.3 –
99.9%) with an average prediction accuracy of 97.8% (Table S2).
SERS fingerprints
Unlike Raman, SERS spectra of S. cerevisiae provided detailed features (Figure 3C) showing
that the nanoparticles had caused an enhancement and had quenched fluorescence.74 By
contrast, SERS spectra obtained from P. putida samples contained high background
fluorescence, possibly due to the presence of an exopolysaccharide capsule surrounding the
cell,75 and were therefore excluded from further analysis.
PC-DFA scores plot of the SERS spectral data displayed clear separation of all samples
(Figure 4E, F), the two Bacillus spp. were separated from all other samples based on DF1.
Although S. cerevisiae are yeast cells with different biochemical composition compared to
that of bacterial cells, and despite any prior assumptions, these samples clustered closely with
S. lividans. It was clear that in comparison to FT-IR and Raman data (Figure 4) that the
clustering of the biological replicates was not so tight and this suggests that these data have
higher variability. On further inspection, the 3D PC-DFA scores plot of the SERS spectral
data (Figure 4E), revealed that the Gram-positive bacteria (E. faecium, S. lividans, B. subtilis,
and B. cereus) are generally clustered on the positive side of DF2, while the Gram-negative
bacteria (E. coli, and P. aeruginosa) are on the negative side of DF2. According to the DF2
loadings plot (Figure S2, C), the main vibrational bands contributing to this separation that
have been observed in SERS of microorganisms include: carbohydrates at 486 cm-1,76
proteins at 681 cm-1 (C-S stretching and C-C twisting),77 polysaccharides at 730 cm-1 (N-
13
1
2
3
4
5
6
7
8
9
10
11
12
13
14
15
16
17
18
19
20
21
22
23
24
acetyl-D-glucosamine and N-acetylmuramic acid),55, 78 tyrosine at 831 cm-1,76, 78 and lipids at
1447 cm-1 (CH2 deformation).78
The HCA dendogram of the SERS PC-DFA scores (Figure 5C), demonstrates a clearer image
of this clustering pattern, whilst it is clear that the two Gram-negative species E. coli and P.
aeruginosa can not be differentiated between presumably due to the similarity in the cell wall
of these two Enterobacteriaceae, where it is known that the majority of the SERS signal
arises from.19, 55 Finally the PLS-DA classification model generated using SERS spectra
provided lower accuracy (67.4 – 85.7%) compared to that of the FT-IR and Raman models,
with an average prediction accuracy of 74.9% (Table S3). This may be expected given the
observations of the cluster compactness seen in Figure 4 for the three spectroscopies.
Discussion
Accurate detection and identification of microorganisms is of great interest with a wide range
of existing and potential applications, including: pharmaceutical manufacturing processes,
food quality control, medicine, environmental monitoring and bioremediation, and synthetic
biology. For example, the early detection of pathogens in clinical microbiology laboratories
(or indeed in general practice) may accelerate the initiation of appropriate and targeted
treatment,79 which may prevent the development of future challenges such as antibiotic
resistance.80, 81
During the past two decades, vibrational spectroscopic techniques have demonstrated great
potential for this task,82 which has also been reflected by the development of various
commercial systems (e.g. River Diagnostics (www.riverd.com), and rapID (www.rap-id.com)
Particle Systems GmbH). Although IR, Raman and SERS spectroscopic techniques have
14
1
2
3
4
5
6
7
8
9
10
11
12
13
14
15
16
17
18
19
20
21
22
23
been successfully applied for microbial characterisation and identification, the question
remains, which is the most appropriate technique?
Thus, the aim of this study was to compare, and demonstrate the applicability and accuracy of
FT-IR, Raman and SERS, as physicochemical whole organism fingerprinting approaches, for
differentiation of a range of microbial samples. While the collected spectra of bacteria and
yeast cells investigated in this study shared similar spectral bands (Figure 3), it was shown
using multivariate analyses that the relative intensities of these bands were specific to each of
the species and strains, which allowed for the differentiation of the samples (Figure 5).
Furthermore, the relative clustering pattern of S. lividans to S. cerevisiae on the FT-IR PC-
DFA scores plot (Figure 4B), and S. lividans to Pseudomonas spp. on the Raman PC-DFA
scores plot (Figure 4D), emphasises that these clustering patterns are not dependant on the
different incubation temperatures and growth conditions used in this study, but due to other
phenotypic/biochemical differences.
The PLS-DA classification models generated using FT-IR and Raman spectral data provided
highly accurate prediction values of 96.2% and 97.8% respectively, allowing for the
differentiation of yeast from bacterial cells, and further discrimination of bacterial cells down
to sub-species level (Figure 5A, B). However, the background fluorescence from
S. cerevisiae in the resultant ‘Raman’ spectra led to the exclusion of these samples from the
subsequent modelling process. Nonetheless, the spectra collected from both techniques
clearly demonstrated their complementarity (Figure S3), while the overall clustering patterns
were also in agreement. Although, the SERS classification model had lower prediction
accuracy (average of 74.9%), it displayed unique clustering patterns which allowed for the
ready differentiation of Gram-positive and Gram-negative bacterial samples. This is perhaps
not surprising as the AgNPs are in the vicinity of the cell membrane, which allows for the
15
1
2
3
4
5
6
7
8
9
10
11
12
13
14
15
16
17
18
19
20
21
22
23
24
enhancement of the Raman signal from the outer surface, providing structural information
and subsequently differentiation.19, 55
One of several interesting observations from this study was that spectral data from all three
vibrational spectroscopic techniques resulted in a clear separation of Bacillus spp., from all
other bacterial samples that were analysed. This could be the result of any number of factors
of course, though we consider this separation is probably to be due to differences in
biochemical composition of the bacterial cell membrane (mainly protein, RNA and lipids),83,
84 or the cell wall peptidoglycan building blocks (N-acetyl-D-glucosamine and N-
acetylmuramic acid), which is also evident (730 cm-1) from DF1 loadings plot (Figure S2, C)
of the SERS spectral data.55, 85
It is also worth noting that whilst numerous studies have demonstrated the potential
applications of Raman and SERS for analysis of biological samples;86, 87 the application of
these exceptionally useful techniques require careful consideration and choice of instrument,
instrumental parameters, and of course experimental design 88 (e.g. choice of laser excitation
wavelength), prior to their application to a specific type of biological sample. Here for
example, using our comparative approach, it was found that whilst background fluorescence
was observed from Raman spectra for S. cerevisiae, this fluorescence quenched when
applying SERS to the same species, and conversely SERS appeared to introduce strong
fluorescence when analysing P. putida. Furthermore, whilst it is well known that
mid-infrared is a strong absorber of water, after drying samples for a short period prior to
analysis, FT-IR spectra were shown to provide for a highly reproducible and accurate
classification model for the whole range of samples used in this study. Thus, despite the
limited number of microorganisms examined, the findings of this study suggest FT-IR as
ideal method for differentiation of microorganisms in pure, or potentially mixed cultures.
16
1
2
3
4
5
6
7
8
9
10
11
12
13
14
15
16
17
18
19
20
21
22
23
24

In conclusion, this combined and comparative study of a range of clinically and industrially
relevant microorganisms, clearly demonstrates the potential application of Raman, SERS, and
FT-IR spectroscopies for microbial classification and differentiation. Although this is perhaps
not surprising, given the rapidly expanding literature regarding individual applications of
each of the three techniques explored here.89-91 The opposite observation is that our findings
bring into focus and highlight the fact that when compared directly, there is not ‘one method
that fits all’. Indeed, careful thought is required prior to selection of one or more of these
techniques, especially regarding sample type, format, preparation, and the biological
questions being asked. These spectroscopies, individually or when combined, will continue
to reveal much detailed and useful knowledge, and enable novel insights into biological
systems and bioprocesses, though only if applied correctly. Finally, these rapid methods, with
their potential to be combined within single benchtop, bedside, or handheld portable units,29
and continued advances in miniaturisation, computation, and materials, only increases their
potential into an ever expanding horizon of biological, clinical, and industrial
microbiological applications.
Acknowledgments
HA and RG thank the European Commission’s Seventh Framework Program for funding
(STREPSYNTH; Project No. 613877). M.M. acknowledges Commonwealth of Australia for
an Endeavour Research Award to visit University of Manchester (award 4660_2015). XY
thanks the Cancer Research UK for funding (including an Experimental Cancer Medicine
Centre award). R.G. is also very grateful to BBSRC for financial support and, in particular,
for Raman microscopy (BB/L014823/1). V.B. acknowledges Australian Research Council for
an ARC Future Fellowship (FT140101285) and the Ian Potter Foundation for establishing an
17
1
2
3
4
5
6
7
8
9
10
11
12
13
14
15
16
17
18
19
20
21
22
23
24
Ian Potter NanoBioSensing Facility at RMIT University, which is directed towards
developing new international linkages with Australia in the area of nano-diagnostics. R.R.
acknowledges RMIT University for a Vice Chancellor’s Postdoctoral Research Fellowship.
18
1
2
3

Figures
Figure 1. UV-Vis absorption spectra (A), and TEM image (B) of the tyrosine capped AgNP solution, showing acceptable homogeneity and size distribution.
Figure 2. Schematic overview of the procedures applied for the analysis of SERS spectral data.
19
1
2
3
45
6
7
8
9
10
11
12
13
14
Figure 3. Typical FT-IR (A), Raman (B) and SERS (C) spectra of the samples investigated in this study. All spectra were normalized using SNV transformation. Each spectrum represent the average of all biological (n = 5) and analytical replicates of that class (species).
20
1
234
Figure 4. PC-DFA scores plots of spectral data generated via FT-IR (A, B), Raman (C, D), and SERS (E, F) spectroscopic analysis of the different microbial samples. Different coloured symbols represent the different species, and the coding for this is provided in the figure.
21
1
234
5
Figure 5. Dendograms generated by HCA using means of the technical replicates from each of the bio-replicates (n = 5) of different classes (species) of samples for: FT-IR (A), Raman (B), and SERS (C) spectral data.
Figure 6. The averaged confusion matrices of the classification models generated using PLS-DA and validated by bootstrapping method (1000 iterations), of the FT-IR (A), Raman (B), and SERS (C) spectral data.
22
1
234
5
6
7
8
910
11
12
13

Table 1. Microorganisms and their specific growth conditions used in this study.
Genus and species Organism Gram stain
Incubation temperature (ºC) Growth media
Escherichia coli Bacterium - 37 Nutrient broth
Pseudomonas putida Bacterium - 30 Nutrient broth
Pseudomonas aeruginosa Bacterium - 30 Nutrient broth
Saccharomyces cerevisiae Yeast NA 30 YPD
Streptomyces lividans Bacterium + 30 Phage
Bacillus subtilis Bacterium + 37 Nutrient broth
Bacillus cereus Bacterium + 37 Nutrient broth
Enterococcus faecium Bacterium + 37 Nutrient broth
23
1
2
3
References
1. J. D. G. Jones and J. L. Dangl, Nature, 2006, 444, 323-329.2. L. A. David, C. F. Maurice, R. N. Carmody, D. B. Gootenberg, J. E. Button, B. E. Wolfe, A.
V. Ling, A. S. Devlin, Y. Varma, M. A. Fischbach, S. B. Biddinger, R. J. Dutton and P. J. Turnbaugh, Nature, 2014, 505, 559-+.
3. E. Sherr and B. Sherr, Limnology and Oceanography, 1988, 33, 1225-1227.4. S. Chu and A. Majumdar, Nature, 2012, 488, 294-303.5. Z. Du, H. Li and T. Gu, Biotechnology Advances, 2007, 25, 464-482.6. A. L. Juhasz and R. Naidu, International Biodeterioration & Biodegradation, 2000, 45, 57-
88.7. T. C. Hazen, E. A. Dubinsky, T. Z. DeSantis, G. L. Andersen, Y. M. Piceno, N. Singh, J. K.
Jansson, A. Probst, S. E. Borglin, J. L. Fortney, W. T. Stringfellow, M. Bill, M. E. Conrad, L. M. Tom, K. L. Chavarria, T. R. Alusi, R. Lamendella, D. C. Joyner, C. Spier, J. Baelum, M. Auer, M. L. Zemla, R. Chakraborty, E. L. Sonnenthal, P. D'Haeseleer, H. Y. N. Holman, S. Osman, Z. M. Lu, J. D. Van Nostrand, Y. Deng, J. Z. Zhou and O. U. Mason, Science, 2010, 330, 204-208.
8. D. I. Ellis and R. Goodacre, Curr Opin Biotechnol, 2012, 23, 22-28.9. H. S. Toogood, S. Tait, A. Jervis, A. Ní Cheallaigh, L. Humphreys, E. Takano, J. M. Gardiner
and N. S. Scrutton, in Methods in Enzymology, Academic Press, DOI: http://dx.doi.org/10.1016/bs.mie.2016.02.020.
10. S. Brul and P. Coote, International Journal of Food Microbiology, 1999, 50, 1-17.11. L. Gram, L. Ravn, M. Rasch, J. B. Bruhn, A. B. Christensen and M. Givskov, International
Journal of Food Microbiology, 2002, 78, 79-97.12. F. Baquero, J.-L. Martinez and R. Canton, Current Opinion in Biotechnology, 2008, 19, 260-
265.13. D. J. Barker and D. C. Stuckey, Water Research, 1999, 33, 3063-3082.14. C. Kirschner, K. Maquelin, P. Pina, N. A. Ngo Thi, L. P. Choo-Smith, G. D. Sockalingum, C.
Sandt, D. Ami, F. Orsini, S. M. Doglia, P. Allouch, M. Mainfait, G. J. Puppels and D. Naumann, J Clin Microbiol, 2001, 39, 1763-1770.
15. I. Vliegen, J. A. Jacobs, E. Beuken, C. A. Bruggeman and C. Vink, Journal of Microbiological Methods, 2006, 66, 156-164.
16. R. I. Amann, W. Ludwig and K. H. Schleifer, Microbiological Reviews, 1995, 59, 143-169.17. D. Dubois, D. Leyssene, J. P. Chacornac, M. Kostrzewa, P. O. Schmit, R. Talon, R. Bonnet
and J. Delmas, Journal of Clinical Microbiology, 2010, 48, 941-945.18. H. Muhamadali, D. Weaver, A. Subaihi, N. AlMasoud, D. K. Trivedi, D. I. Ellis, D. Linton
and R. Goodacre, Analyst, 2016, 141, 111-122.19. R. M. Jarvis and R. Goodacre, Chemical Society Reviews, 2008, 37, 931-936.20. S. Efrima and L. Zeiri, Journal of Raman Spectroscopy, 2009, 40, 277-288.21. B. C. Smith, Fundamentals of Fourier transform infrared spectroscopy, CRC Press, Boca
Raton, FL, 2011.22. L. E. Rodriguez-Saona, F. M. Khambaty, F. S. Fry, J. Dubois and E. M. Calvey, Journal of
Food Protection, 2004, 67, 2555-2559.23. D. I. Ellis, D. Broadhurst, D. B. Kell, J. J. Rowland and R. Goodacre, Appl Environ
Microbiol, 2002, 68.24. H. Muhamadali, Y. Xu, D. I. Ellis, J. W. Allwood, N. J. W. Rattray, E. Correa, H. Alrabiah, J.
R. Lloyd and R. Goodacre, Applied and Environmental Microbiology, 2015, 81, 3288-3298.25. H. Muhamadali, Y. Xu, D. I. Ellis, D. K. Trivedi, N. J. W. Rattray, K. Bernaerts and R.
Goodacre, Microbial Cell Factories, 2015, 14.26. H. Muhamadali, Y. Xu, R. Morra, D. K. Trivedi, N. J. W. Rattray, N. Dixon and R. Goodacre,
Molecular Biosystems, 2016, 12, 350-361.27. E. S. Wharfe, R. M. Jarvis, C. L. Winder, A. S. Whiteley and R. Goodacre, Environ.
Microbiol., 2010, 12, 3253-3263.
24
1
23456789
10111213141516171819202122232425262728293031323334353637383940414243444546474849505152
28. H. Wang, K. Hollywood, R. M. Jarvis, J. R. Lloyd and R. Goodacre, Applied and Environmental Microbiology, 2010, 76, 6266-6276.
29. D. I. Ellis, H. Muhamadali, S. A. Haughey, C. T. Elliott and R. Goodacre, Analytical Methods, 2015, 7, 9401-9414.
30. D. I. Ellis, D. P. Cowcher, L. Ashton, S. O'Hagan and R. Goodacre, Analyst, 2013, 138, 3871-3884.
31. D. Kusic, B. Kampe, P. Roesch and J. Popp, Water Research, 2014, 48, 179-189.32. S. Meisel, S. Stoeckel, M. Elschner, F. Melzer, P. Roesch and J. Popp, Applied and
Environmental Microbiology, 2012, 78, 5575-5583.33. S. Meisel, S. Stoeckel, P. Roesch and J. Popp, Food Microbiology, 2014, 38, 36-43.34. K. Sowoidnich, H. Schmidt, H.-D. Kronfeldt and F. Schwaegele, Vibrational Spectroscopy,
2012, 62, 70-76.35. L. P. Choo-Smith, H. G. M. Edwards, H. P. Endtz, J. M. Kros, F. Heule, H. Barr, J. S.
Robinson, H. A. Bruining and G. J. Puppels, Biopolymers, 2002, 67, 1-9.36. S. Kloss, B. Kampe, S. Sachse, P. Roesch, E. Straube, W. Pfister, M. Kiehntopf and J. Popp,
Analytical Chemistry, 2013, 85, 9610-9616.37. W. E. Huang, A. D. Ward and A. S. Whiteley, Environmental Microbiology Reports, 2009, 1,
44-49.38. L. P. Choo-Smith, K. Maquelin, T. van Vreeswijk, H. A. Bruining, G. J. Puppels, N. A. Ngo
Thi, C. Kirschner, D. Naumann, D. Ami, A. M. Villa, F. Orsini, S. M. Doglia, H. Lamfarraj, G. D. Sockalingum, M. Manfait, P. Allouch and H. P. Endtz, Appl Environ Microbiol, 2001, 67, 1461-1469.
39. K. Maquelin, L. P. Choo-Smith, T. van Vreeswijk, H. P. Endtz, B. Smith, R. Bennett, H. A. Bruining and G. J. Puppels, Analytical Chemistry, 2000, 72, 12-19.
40. J. W. Chan, A. P. Esposito, C. E. Talley, C. W. Hollars, S. M. Lane and T. Huser, Analytical Chemistry, 2004, 76, 599-603.
41. H. Muhamadali, M. Chisanga, A. Subaihi and R. Goodacre, Analytical Chemistry, 2015, 87, 4578-4586.
42. W. E. Huang, R. I. Griffiths, I. P. Thompson, M. J. Bailey and A. S. Whiteley, Analytical Chemistry, 2004, 76, 4452-4458.
43. C. Xie, J. Mace, M. A. Dinno, Y. Q. Li, W. Tang, R. J. Newton and P. J. Gemperline, Analytical Chemistry, 2005, 77, 4390-4397.
44. W. E. Huang, M. Li, R. M. Jarvis, R. Goodacre and S. A. Banwart, in Advances in Applied Microbiology, Academic Press, 2010, vol. Volume 70, pp. 153-186.
45. M. Fleischmann, P. J. Hendra and A. J. McQuillan, Chemical Physics Letters, 1974, 26, 163-166.
46. S. McAughtrie, K. Faulds and D. Graham, Journal of Photochemistry and Photobiology C: Photochemistry Reviews, 2014, 21, 40-53.
47. A. F. Chrimes, K. Khoshmanesh, P. R. Stoddart, A. A. Kayani, A. Mitchell, H. Daima, V. Bansal and K. Kalantar-zadeh, Analytical Chemistry, 2012, 84, 4029-4035.
48. J. A. Dougan, D. MacRae, D. Graham and K. Faulds, Chemical Communications, 2011, 47, 4649-4651.
49. D. Graham, R. Stevenson, D. G. Thompson, L. Barrett, C. Dalton and K. Faulds, Faraday Discussions, 2011, 149, 291-299.
50. D. van Lierop, I. A. Larmour, K. Faulds and D. Graham, Analytical Chemistry, 2013, 85, 1408-1414.
51. I. A. Larmour, K. Faulds and D. Graham, Chemical Science, 2010, 1, 151-160.52. R. Stevenson, S. McAughtrie, L. Senior, R. J. Stokes, H. McGachy, L. Tetley, P. Nativo, J.
M. Brewer, J. Alexander, K. Faulds and D. Graham, Analyst, 2013, 138, 6331-6336.53. H. Zhou, D. Yang, N. P. Ivleva, N. E. Mircescu, R. Niessner and C. Haisch, Analytical
Chemistry, 2014, 86, 1525-1533.54. K. Gracie, E. Correa, S. Mabbott, J. A. Dougan, D. Graham, R. Goodacre and K. Faulds,
Chemical Science, 2014, 5, 1030-1040.55. R. M. Jarvis and R. Goodacre, Analytical Chemistry, 2004, 76, 40-47.56. L. Zeiri and S. Efrima, Journal of Raman Spectroscopy, 2005, 36, 667-675.
25
123456789
10111213141516171819202122232425262728293031323334353637383940414243444546474849505152535455
57. L. Cui, Y.-J. Zhang, W. E. Huang, B.-F. Zhang, F. L. Martin, J.-Y. Li, K.-S. Zhang and Y.-G. Zhu, Analytical Chemistry, 2016, 88, 3164-3170.
58. S. Schlücker, Angewandte Chemie International Edition, 2014, 53, 4756-4795.59. A. P. Craig, A. S. Franca and J. Irudayaraj, Annual Review of Food Science and Technology,
2013, 4, 369-380.60. M. Vendrell, K. K. Maiti, K. Dhaliwal and Y.-T. Chang, Trends in Biotechnology, 2013, 31,
249-257.61. C. L. Winder, S. V. Gordon, J. Dale, R. G. Hewinson and R. Goodacre, Microbiology, 2006,
152.62. R. J. Barnes, M. S. Dhanoa and S. J. Lister, Applied Spectroscopy, 1989, 43, 772-777.63. P. R. Selvakannan, R. Ramanathan, B. J. Plowman, Y. M. Sabri, H. K. Daima, A. P.
O'Mullane, V. Bansal and S. K. Bhargava, Physical Chemistry Chemical Physics, 2013, 15, 12920-12929.
64. H. K. Daima, P. R. Selvakannan, R. Shukla, S. K. Bhargava and V. Bansal, PLoS ONE, 2013, 8, e79676.
65. T. Cosgrove, Colloid Science: Principles, Methods and Applications, 2005.66. R. C. Maher, in Raman Spectroscopy for Nanomaterials Characterization, ed. C. S. S. R.
Kumar, Springer Berlin Heidelberg, Berlin, Heidelberg, 2012, DOI: 10.1007/978-3-642-20620-7_10, pp. 215-260.
67. M. Hubert, P. Rousseeuw and T. Verdonck, Computational Statistics & Data Analysis, 2009, 53, 2264-2274.
68. H. J. H. Macfie, C. S. Gutteridge and J. R. Norris, Journal of General Microbiology, 1978, 104, 67-74.
69. P. S. Gromski, H. Muhamadali, D. I. Ellis, Y. Xu, E. Correa, M. L. Turner and R. Goodacre, Analytica Chimica Acta, 2015, 879, 10-23.
70. B. Efron and G. Gong, The American Statistician, 1983, 37, 36-48.71. N. AlMasoud, Y. Xu, N. Nicolaou and R. Goodacre, Anal Chim Acta, 2014, 840, 49-57.72. S. A. Patel, F. Currie, N. Thakker and R. Goodacre, Analyst, 2008, 133, 1707-1713.73. A. D. Shaw, N. Kaderbhai, A. Jones, A. M. Woodward, R. Goodacre, J. J. Rowland and D. B.
Kell, Applied Spectroscopy, 1999, 53, 1419-1428.74. G. McNay, D. Eustace, W. E. Smith, K. Faulds and D. Graham, Applied Spectroscopy, 2011,
65, 825-837.75. S. C. Kachlany, S. B. Levery, J. S. Kim, B. L. Reuhs, L. W. Lion and W. C. Ghiorse, Environ
Microbiol, 2001, 3, 774-784.76. J. Guicheteau, L. Argue, D. Emge, A. Hyre, M. Jacobson and S. Christesen, Applied
Spectroscopy, 2008, 62, 267-272.77. Y. Chao and T. Zhang, Anal Bioanal Chem, 2012, 404, 1465-1475.78. M. Kahraman, A. I. Zamaleeva, R. F. Fakhrullin and M. Culha, Anal Bioanal Chem, 2009,
395, 2559-2567.79. D. I. Ellis, W. B. Dunn, J. L. Griffin, J. W. Allwood and R. Goodacre, Pharmacogenomics,
2007, 8.80. S. B. Levy, The Antibiotic Paradox: How the Misuse of Antibiotics Destroys Their Curative
Powers, Perseus Pub., 2002.81. B. M. Marshall and S. B. Levy, Clinical Microbiology Reviews, 2011, 24, 718-733.82. M. Harz, P. Rosch and J. Popp, Cytometry. Part A : the journal of the International Society
for Analytical Cytology, 2009, 75, 104-113.83. D. G. Bishop, L. Rutberg and Samuelss.B, European Journal of Biochemistry, 1967, 2, 448-
&.84. C. Sohlenkamp and O. Geiger, FEMS Microbiology Reviews, 2016, 40, 133-159.85. R. M. Jarvis, A. Brooker and R. Goodacre, Faraday Discuss, 2006, 132, 281-292; discussion
309-219.86. M. J. Baker, S. R. Hussain, L. Lovergne, V. Untereiner, C. Hughes, R. A. Lukaszewski, G.
Thiefin and G. D. Sockalingum, Chemical Society Reviews, 2016, 45, 1803-1818.87. S. Mabbott, D. Thompson, N. Sirimuthu, G. McNay, K. Faulds and D. Graham, Faraday
Discussions, 2016, DOI: 10.1039/C5FD00167F.
26
123456789
10111213141516171819202122232425262728293031323334353637383940414243444546474849505152535455
88. H. Fisk, C. Westley, N. J. Turner and R. Goodacre, Journal of Raman Spectroscopy, 2016, 47, 59-66.
89. R. Hou, S. Pang and L. He, Analytical Methods, 2015, 7, 6325-6330.90. C. Hughes and M. J. Baker, Analyst, 2016, 141, 467-475.91. M. J. Baker and K. Faulds, Chemical Society Reviews, 2016, 45, 1792-1793.
27
12345
6
7