d2n0lz049icia2.cloudfront.net · Web viewA convenient way to summarize the information on the...
17
79A LRC Circuit 79A - Page 1 of 17 Phase Relationships in an LRC Circuit Equipment 1 Resistor/Capacitor/Inductor Network UI-5210 4 Voltage Sensors UI-5100 1 BNC-to-Banana Cord for 850 Output UI-5119 1 Patch Cords (Set of 5) SE-7123 Introduction The phase differences between the output voltage, the voltage across the inductor, the voltage across the capacitor, and the voltage across the resistor will be examined at resonant frequency, and the half-power frequencies above and below resonance. Analysis verifies that the voltage lags the current in a capacitor by 90⁰, and voltage leads current by 90⁰ in an inductor, and that by using phasor math one can understand how the internal resistance of the components prevents the angles from being exactly 90⁰. Phasor math is also used to show that the maximum voltages add correctly only if one uses phasor math. The instantaneous voltages are also added to show that Kirchhoff's Loop Theorem is correct for this circuit. The formulas for the reactance are also verified. Written by Chuck Hunt
Transcript of d2n0lz049icia2.cloudfront.net · Web viewA convenient way to summarize the information on the...

79A LRC Circuit 79A - Page 1 of 11
Phase Relationships in an LRC Circuit
Equipment
1 Resistor/Capacitor/Inductor Network UI-5210 4 Voltage Sensors UI-5100 1 BNC-to-Banana Cord for 850 Output UI-5119 1 Patch Cords (Set of 5) SE-7123
Introduction
The phase differences between the output voltage, the voltage across the inductor, the voltage across the capacitor, and the voltage across the resistor will be examined at resonant frequency, and the half-power frequencies above and below resonance.
Analysis verifies that the voltage lags the current in a capacitor by 90⁰, and voltage leads current by 90⁰ in an inductor, and that by using phasor math one can understand how the internal resistance of the components prevents the angles from being exactly 90⁰. Phasor math is also used to show that the maximum voltages add correctly only if one uses phasor math. The instantaneous voltages are also added to show that Kirchhoff's Loop Theorem is correct for this circuit. The formulas for the reactance are also verified.
Figure 1: LRC Series Circuit Diagram
Written by Chuck Hunt

79A LRC Circuit 79A - Page 2 of 11
Theory
An inductor, a capacitor, and a resistor are connected in series with a sine wave generator. Since it is a series circuit, the current will be common to all the components and given by
I = Imax cos(ωt) (1)
The voltage across the resistor will be in phase with the current, but the voltage across the inductor leads the current by 90⁰ and the voltage across the capacitor lags by 90⁰. Adding the three EMF voltages, E, results in a total voltage that varies sinusoidally, but has a phase shift φ with respect to the current and is given by
E = Emax cos(ωt + φ) (2)
The three components obey the AC analogs of Ohm's Law: VR = IR, VL max= ImaxXL, VC max= ImaxXC, where XL and XC are the AC analogs of resistance called the inductive reactance and the capacitive reactance. Since the voltage across the resistor is in phase with the current, the phase of the current can be measured by measuring the phase of the voltage across the resistor. The capacitive reactance and the inductive reactance are given by:
XC= 1ωC
(3)
XL = ωL (4)
In terms of the measured variables:
V C
V R= 1
ωCR (5)
V L
V R=ωL
R(6)
At resonance, XL = XC and ϕ=0. Setting Equation 3 equal to Equation 4 yields the resonant angular frequency:
ωres=1
√LC(7)
Written by Chuck Hunt

79A LRC Circuit 79A - Page 3 of 11
Figure 2: LRC Series Circuit
Written by Chuck Hunt

79A LRC Circuit 79A - Page 4 of 11
Phasors
A convenient way to summarize the information on the Theory page is to use phasors. Recall that circuit current is in phase with VRo. At resonance, VC = VL and they cancel each other. So the total voltage (Emax) equals the voltage across the resistor (VRo) and the phase shift is zero. Below resonance (the case shown), VC > VL , the capacitor dominates, total voltage lags total current and the phase shift is negative. Above resonance the inductor dominates.
The magnitudes of the phasors are related through phasor math where Emax is the sum of the other three as indicated in Figure 3 where the phasors are added like vectors.
Measuring the Phase Angle:
We will measure the time Δt by which a signal leads or lags the circuit current (actually VR). Since 360⁰ of phase shift is equivalent to one cycle, we have:
ϕ = 360⁰ (Δt/T) = 360⁰ (Δt) f (8)
where T is the period and f is the frequency.
Figure 3: Phasors
Written by Chuck Hunt

79A LRC Circuit 79A - Page 5 of 11
Setup
1. Construct the circuit shown at right using the following values (see Figure 4):
L = 6.8 mHC = 3900 pFR = 1.0 kΩ
Connect to Output #2 on the 850 Universal Interface using the BNC to banana cord. Note that it is important to connect the left hand side of the inductor to the right hand side of the capacitor and the left hand side of the capacitor to the right hand side of the resistor as shown. A voltage sensor is connected to the D analog input on the 850 Universal Interface and connected so that it measures the total voltage (VD = Vo) as shown in Figure 4.
2. Now connect the other three voltage sensors as shown in Figure 6. Input A is connected across the resistor. Input B is connected across the inductor. Input C is connected across the capacitor. Note that the black side of each voltage sensor is attached on the left side of the circuit board.
Figure 4: Circuit Diagram with Voltage Sensors
Written by Chuck Hunt

79A LRC Circuit 79A - Page 6 of 11
Figure 5: LRC Circuit without Sensors
Figure 6: Circuit with Sensors
Written by Chuck Hunt

79A LRC Circuit 79A - Page 7 of 11
Procedure
1. In PASCO Capstone, create an Oscilloscope display and put the voltage measurements from all four voltage sensors on a single vertical axis of the oscilloscope. You do this by adding similar measurements on the measurement selector on the axis. Set the time units to μs.
2. Set the sample rate to 1 MHz and set the Sampling Mode to Fast Monitor.
3. Click open the Signal Generator. Signal Generator #2 should be set to a frequency of 30,000 Hz and an amplitude of 6 V. Also, the Auto button should be selected.
4. Click Monitor. If the scope trace is rolling left or right, click the trigger button in the scope toolbar. Adjust the vertical scale so the signals are as large as possible without going off screen. Adjust the horizontal scale so you see about two cycles.
5. Adjust the Signal Generator Frequency (to the nearest 100 Hz) to make the phase φ=0 by making V,D (=Vo) and V,A (=VR) cross the V=0 axis at the same point. Adjust the Signal Generator Amplitude so that the maximum VR voltage is exactly 6 V. Click Stop. VR<Vo because the coil has a resistance of ~60 Ω. Record the frequency for resonance in Table I as shown in step 6.
6. Create Table I as shown below:
System frequency(Hz)
Δt VL (μs)
Δt VC (μs)
Δt Vo
(μs)φL
(deg)φC
(deg)φTOTAL(deg)
ResonanceBelow Res.Above Res.
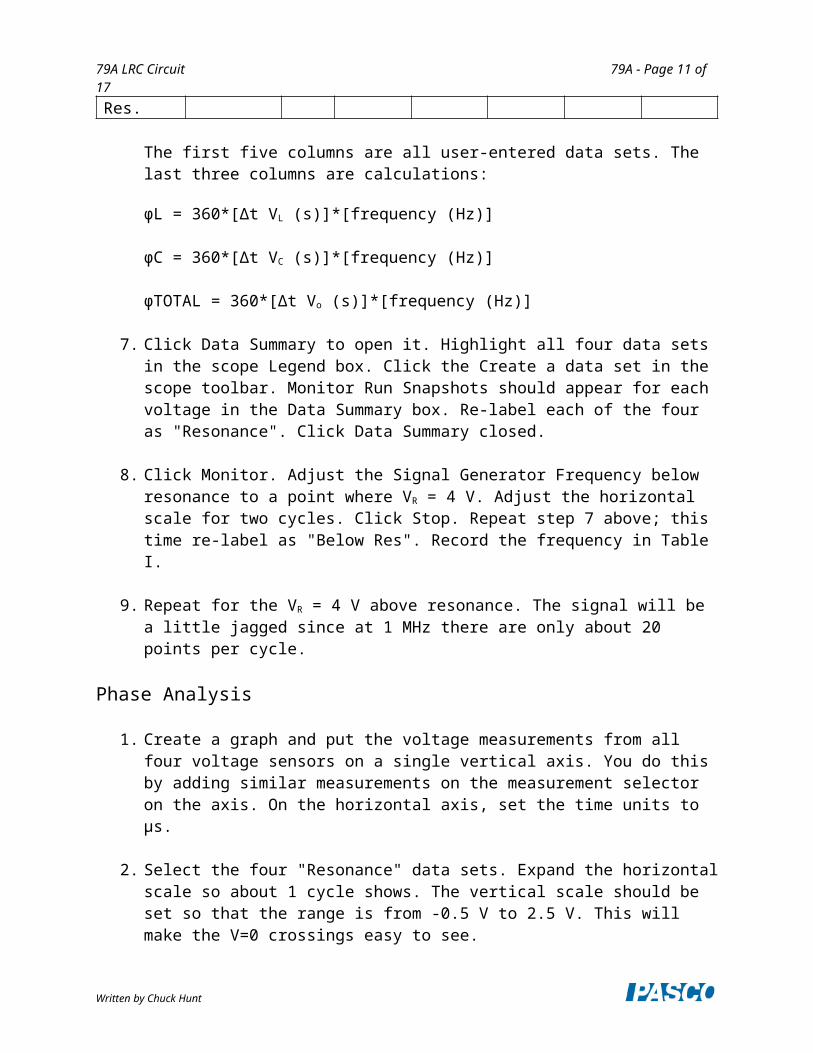
The first five columns are all user-entered data sets. The last three columns are calculations:
φL = 360*[Δt VL (s)]*[frequency (Hz)]
φC = 360*[Δt VC (s)]*[frequency (Hz)]
φTOTAL = 360*[Δt Vo (s)]*[frequency (Hz)]
7. Click Data Summary to open it. Highlight all four data sets in the scope Legend box. Click the Create a data set in the scope toolbar. Monitor Run Snapshots should appear for each voltage in the Data Summary box. Re-label each of the four as "Resonance". Click Data Summary closed.
Written by Chuck Hunt

79A LRC Circuit 79A - Page 8 of 11
8. Click Monitor. Adjust the Signal Generator Frequency below resonance to a point where VR = 4 V. Adjust the horizontal scale for two cycles. Click Stop. Repeat step 7 above; this time re-label as "Below Res". Record the frequency in Table I.
9. Repeat for the VR = 4 V above resonance. The signal will be a little jagged since at 1 MHz there are only about 20 points per cycle.
Phase Analysis
1. Create a graph and put the voltage measurements from all four voltage sensors on a single vertical axis. You do this by adding similar measurements on the measurement selector on the axis. On the horizontal axis, set the time units to μs.
2. Select the four "Resonance" data sets. Expand the horizontal scale so about 1 cycle shows. The vertical scale should be set so that the range is from -0.5 V to 2.5 V. This will make the V=0 crossings easy to see.
3. The Coordinate tool should show 3 significant figures, have the delta tool turned on, and the Snap to Pixels disabled by setting the "snap distance" = 1. If not, right click on the Coordinate tool and adjust Tool Properties.
4. To find the phase shift of a voltage, use the delta tool on the coordinates tool to measure the difference in time between the first two points where the two signal cross the x axis (V=0) with a negative slope. First, position the delta tool on the first place this happens for VR (V,A). Now position the cross-hairs on the VL crossing of V=0. Record this phase shift time (Δt VL) in Table I (with any sign). Leave the delta tool on the VR crossing and use the cross-hairs to measure the times for VC and Vo. The phase shifts are calculated using Equation 8.
5. Repeat for the "Below Res" and "Above Res" data.
Voltage Analysis
1. Select the four "resonance" data sets.
2. The Coordinate tool should show 3 significant figures and the Snap to Pixels disabled by setting the "snap distance" = 1. If not, right click on the Coordinate tool and adjust Tool Properties.
3. Use the Coordinate tool to determine the maximum voltages: VR, VL, VC, Vo and enter them in the Table II as shown in Step 4.
Written by Chuck Hunt

79A LRC Circuit 79A - Page 9 of 11
4. Create Table II as shown below:
System frequency(Hz)
VR (V)
VL (V)
VC (V)
Vo
(V) VL/VR VC/VR) VL/VR
TheoryVC/VR
TheoryResonanceBelow Res.Above Res.
The first two columns are identical to the ones in Table I. The next four columns are user-entered data sets and the last four columns are calculations:
VL/VR = [VL (V)]/[VR (V)]
VC/VR = [VC (V)]/[VR (V)]
VL/VR theory = 2*π*[frequency (Hz)]*[L (H)]/[R (Ω)]
VC/VR theory = 1/(2*π*[frequency (Hz)]*[C (F)]*[R (Ω)])
[L] = 0.0068 H[C] = 3.9e-9 F[R] = 1000 Ω
5. Select the four "below res" data sets and repeat.
6. Select the four "above res" data sets and repeat.
Conclusions
1. Using Equation 7, calculate the resonant angular frequency and the resonant frequency and compare to experiment.
2. Examine these equations in the Calculator:
VL/VR = [VL (V)]/[VR (V)]
VC/VR = [VC (V)]/[VR (V)]
VL/VR theory = 2*π*[frequency (Hz)]*[L (H)]/[R (Ω)]
VC/VR theory = 1/(2*π*[frequency (Hz)]*[C (F)]*[R (Ω)])
Do the first two equations represent Equations 5&6? What do the VC/VR, VC/VR theory, VL/VR, and VL/VR theory ratios imply about Equations 3 & 4?
3. Does XC=XL at resonance (when φ=0)? How do you know?
Written by Chuck Hunt

79A LRC Circuit 79A - Page 10 of 11
4. Which reactance (XC or XL) is larger above resonance? Below resonance? How do you know?
5. Considering the total phase shift, "φTOTAL", does the circuit behave more like a capacitor or more like an inductor below resonance? How do you know? Considering the voltages, why is this true?
6. We expected that the voltage across the capacitor should lag current by 90⁰ and the voltage across the inductor should lead by 90⁰. While this is approximately true, your data should show both shifts to be less than 90⁰. This occurs because each component has some small internal resistance (heating the component) that behaves like a series resistor (and is frequency dependent). As shown in Figure 7, the voltage across the inductor is then the phasor sum of the current times the inductive reactance and the current times the internal resistance rL. This results in a phase angle less than 90⁰. Use Figure 7 to calculate rL for the resonance case. Draw a similar diagram for the capacitor and use it to calculate rC at resonance.
7. At resonance the total voltage is dropped across the total resistance = R+rL+rC since the internal resistance may be treated as being in series. Use the values you found in step 6 to calculate the value you would expect to measure across R and compare to what you actually observed at resonance.
Figure 7: Effect of Inductor Resistance
Written by Chuck Hunt
79A LRC Circuit 79A - Page 11 of 11
Phasor Analysis
1. Do the voltages at a given frequency obey scalor math? That is, does VR+VC+VL=Vo? For any of the three cases?
2. Does the phasor math implied by Figure 3 give the correct answer? That is, is Vo the phasor sum of VR, VC, & VL? Before trying this, recall that the VR values are too small since they do not include the voltage drops across the internal resistances of the capacitor and inductor. We really want VR+VrL+VrC = [(R+rL+rC)/R]VR. We can get the value of the resistance ratio (in the square brackets) by noting that for the resonance case the Vo =VR+VrL+VrC, so [(R+rL+rC)/R] = (Vo /VR)res. Use the resonance data to find the ratio and then correct the value of VR for the other two cases. Note that this isn't quite correct since the internal resistances are frequency dependent and the Vr's do affect VL and VC a little, but it is a good first approximation.
3. Using the corrected values for VR verify that phasor math gives the correct value for Vo within a reasonable uncertainty for both the below and above resonance cases.
4. On the graph, select the four "Below Res" cases. Pick any vertical line (for example 10 µs) and use the Coordinate tool to measure the voltage for each of the four voltages at that instant. Enter the values in line 4 of Table II including sign. Do these values obey scalor math? Do you see why scalor math fails for the max values used in step 1 above?
Figure 3: Phasors
Written by Chuck Hunt


![Phasors Final Ron Alexander.ppt [Read-Only] · While represented as phasors, the impedance and power “phasors” do not rotate at system frequency. The international standard is](https://static.fdocuments.in/doc/165x107/5e187b822001895a3240f732/phasors-final-ron-read-only-while-represented-as-phasors-the-impedance-and-power.jpg)